
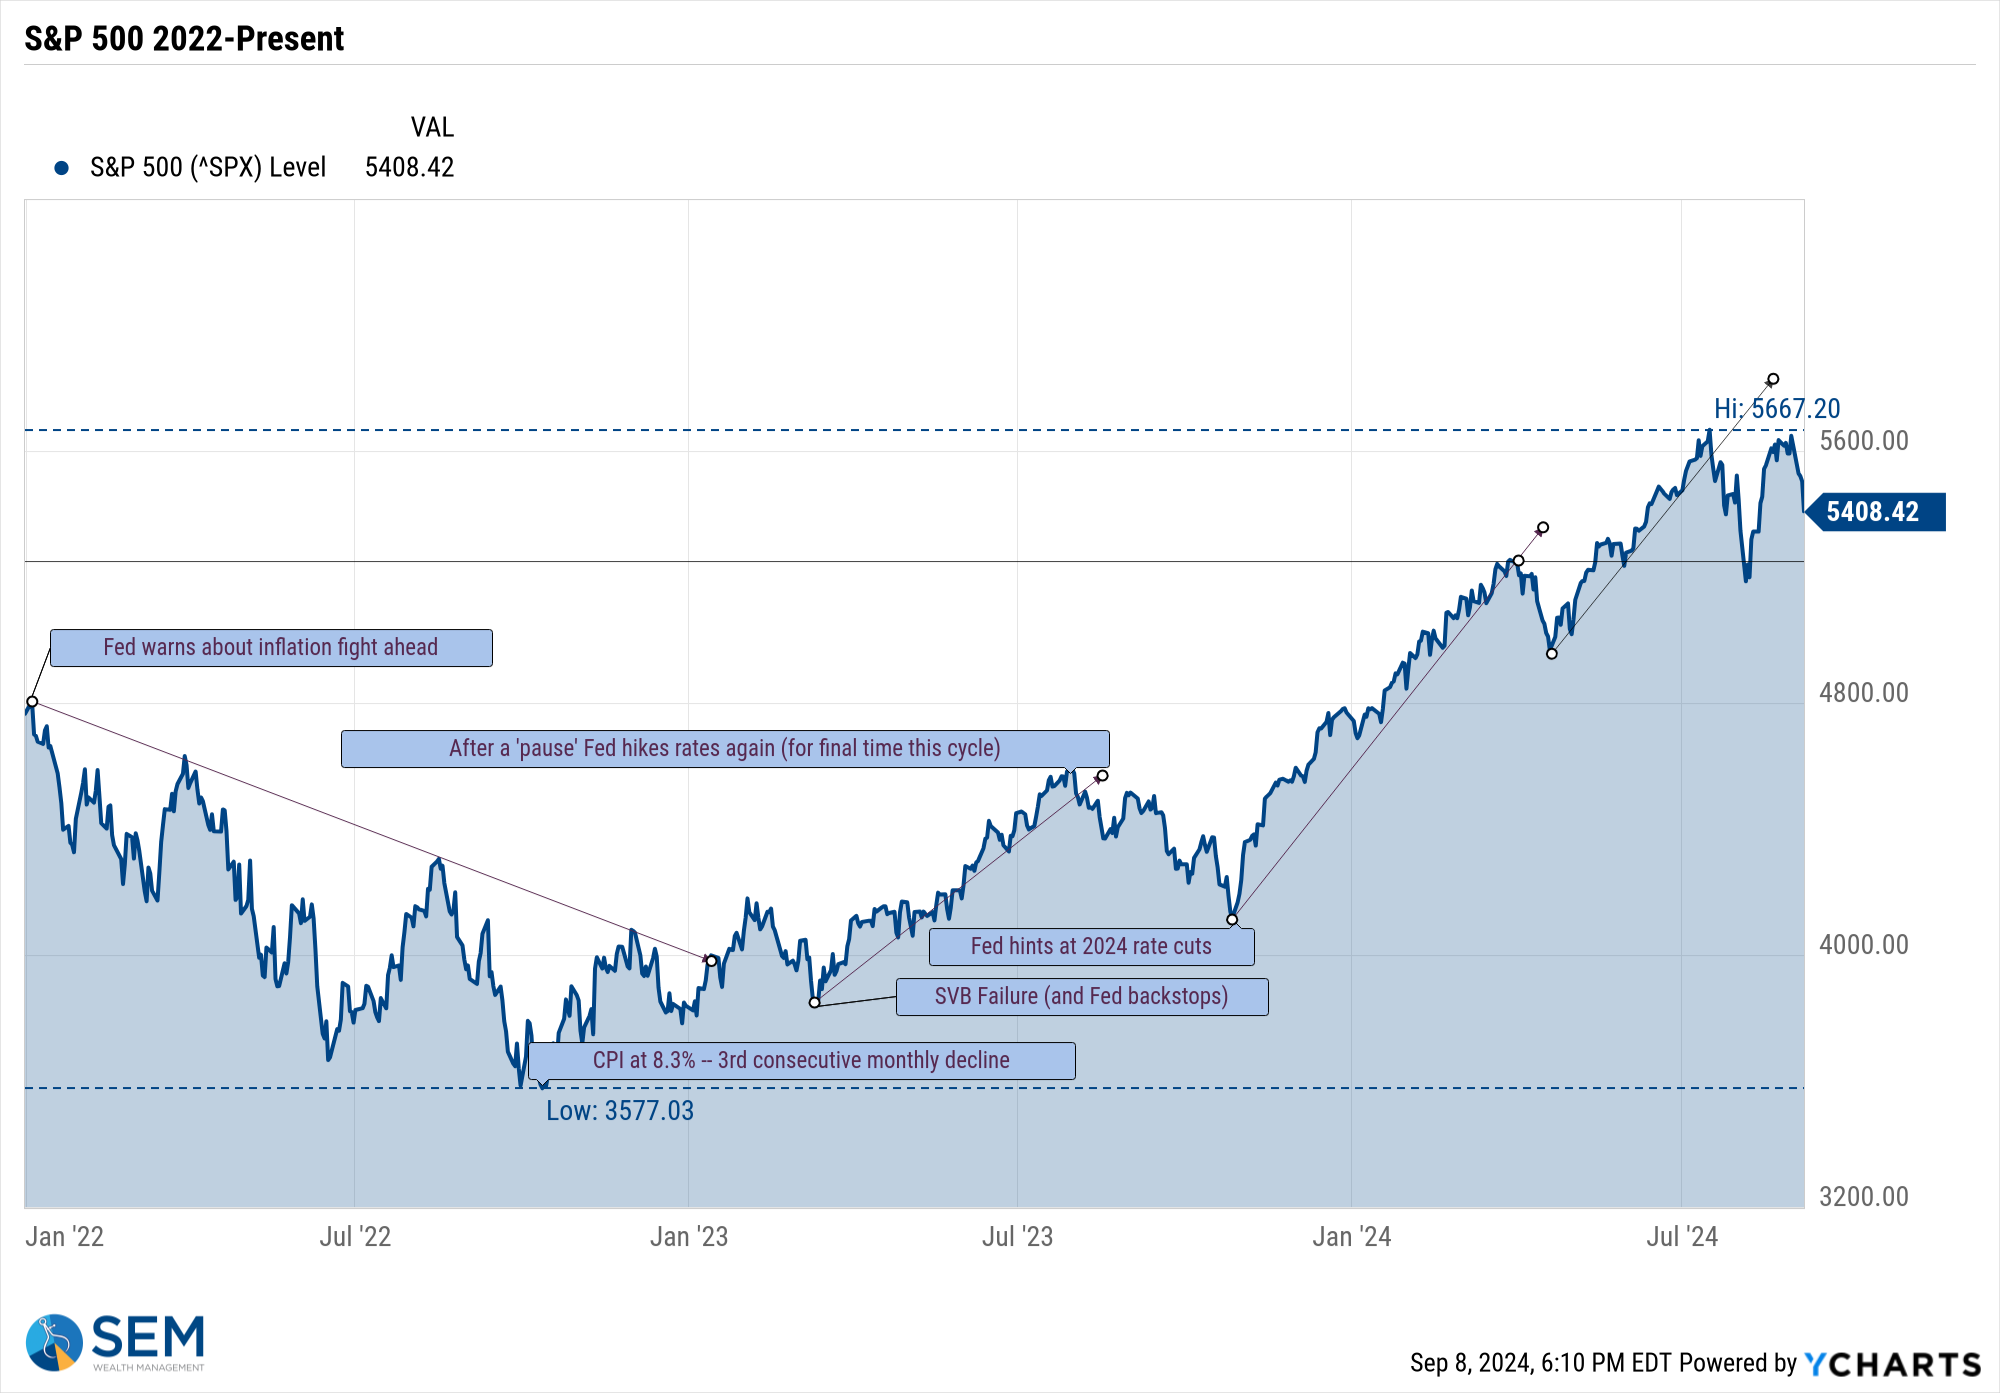
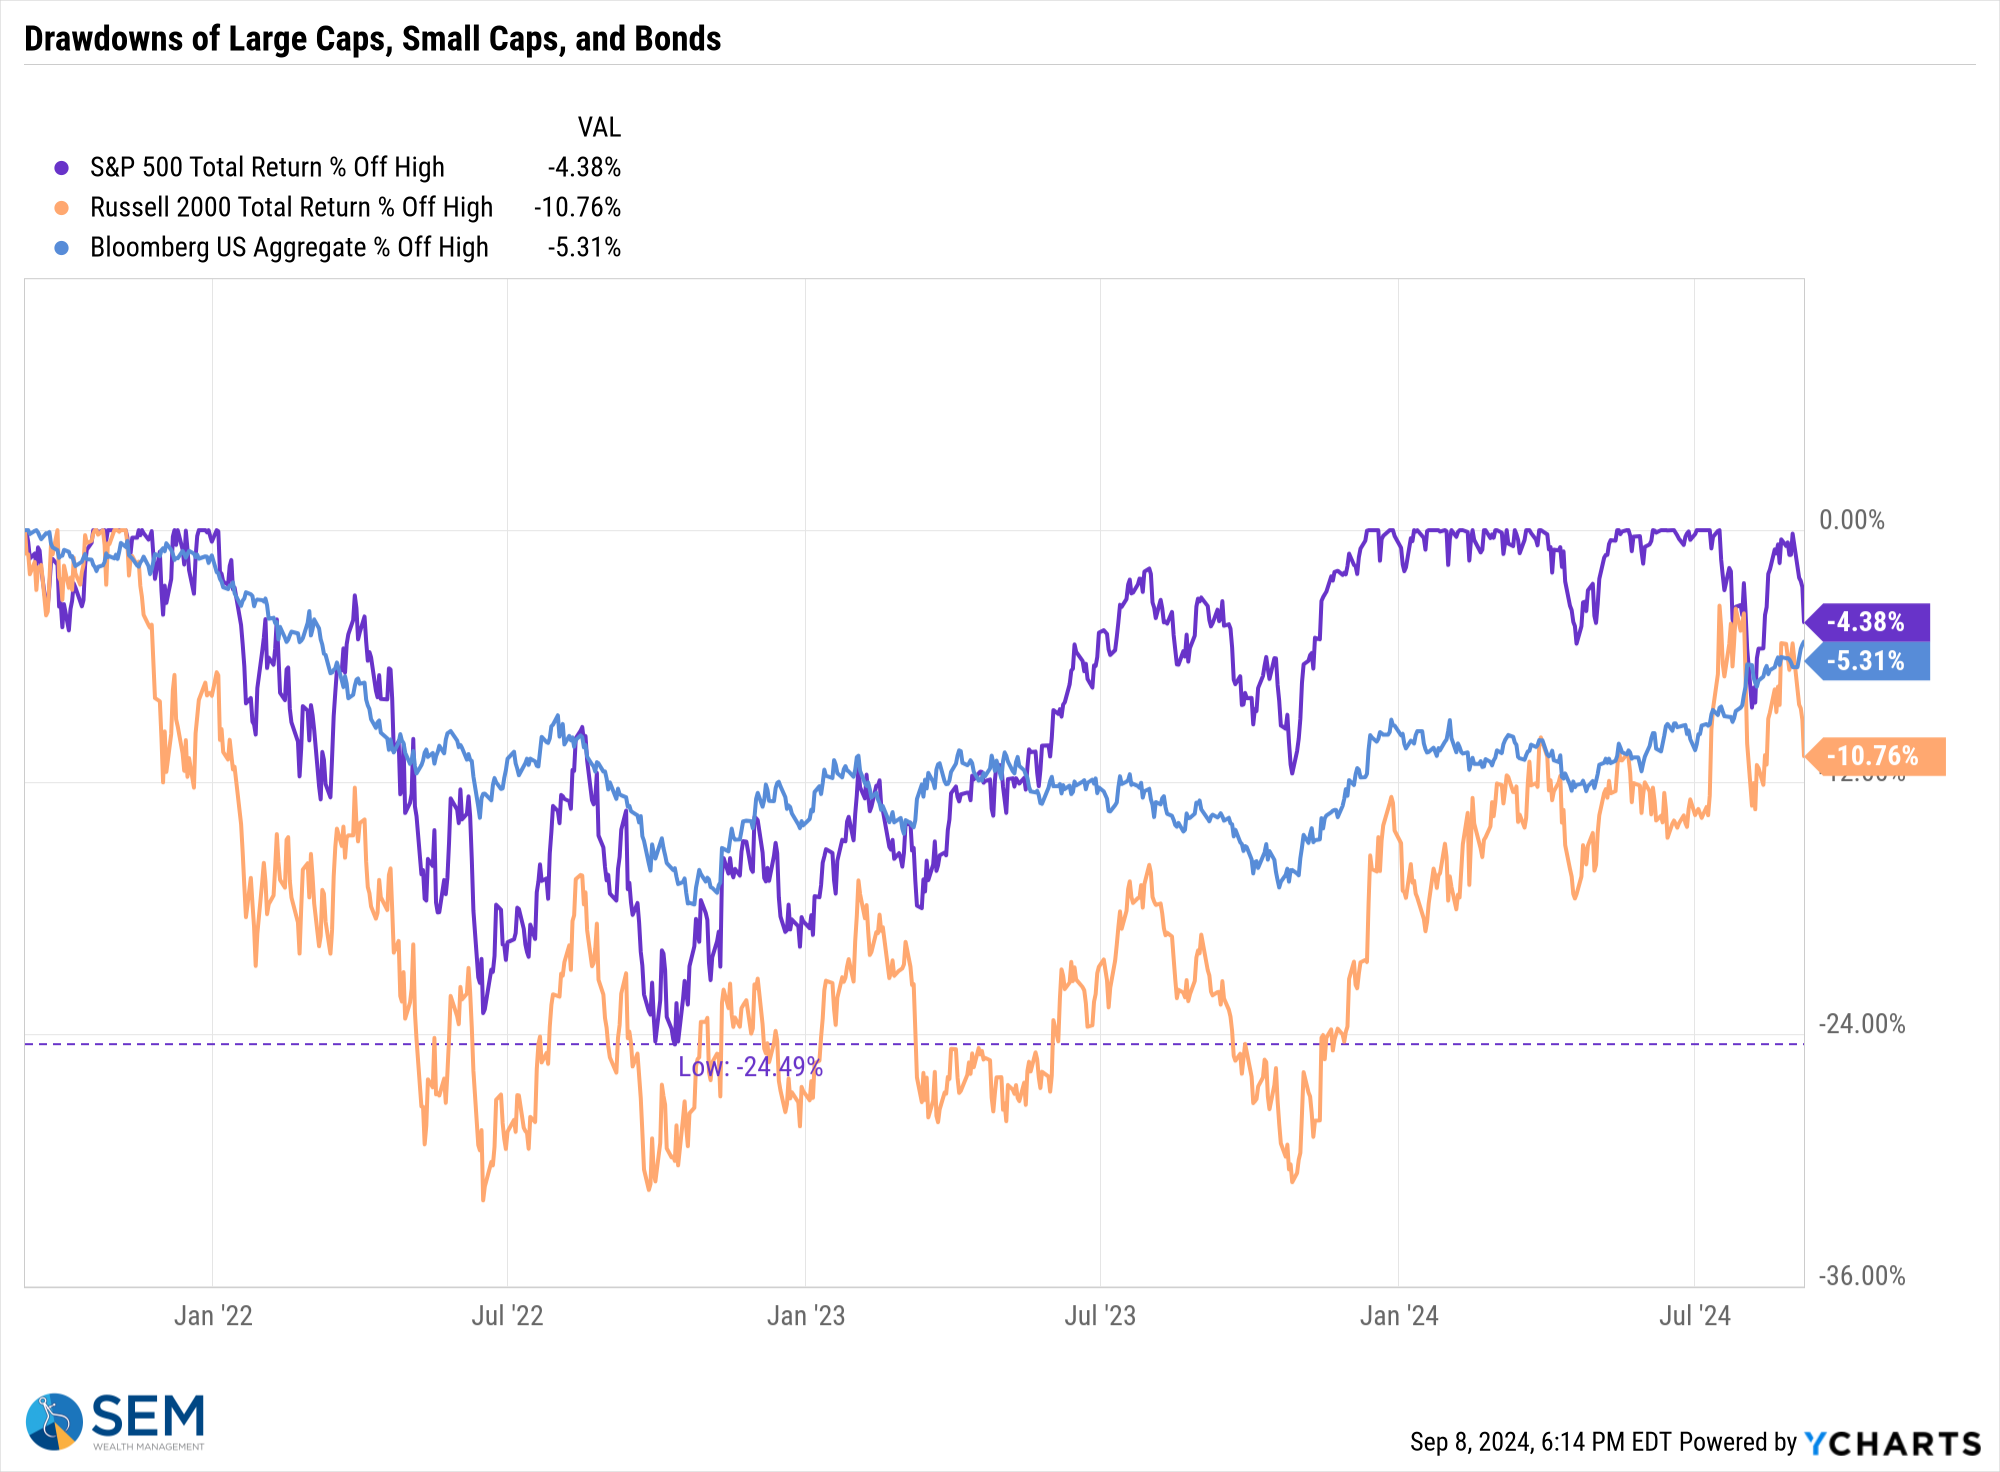
A year ago, the stock market was in the midst of a 10% correction over fears the economic data was too strong, which meant the Fed was going to continue in their inflation fight. The sell-off started when the Fed hiked rates after a one meeting pause. The sell-off didn't end until the end of October when the Fed started hinting they would be cutting rates "soon".
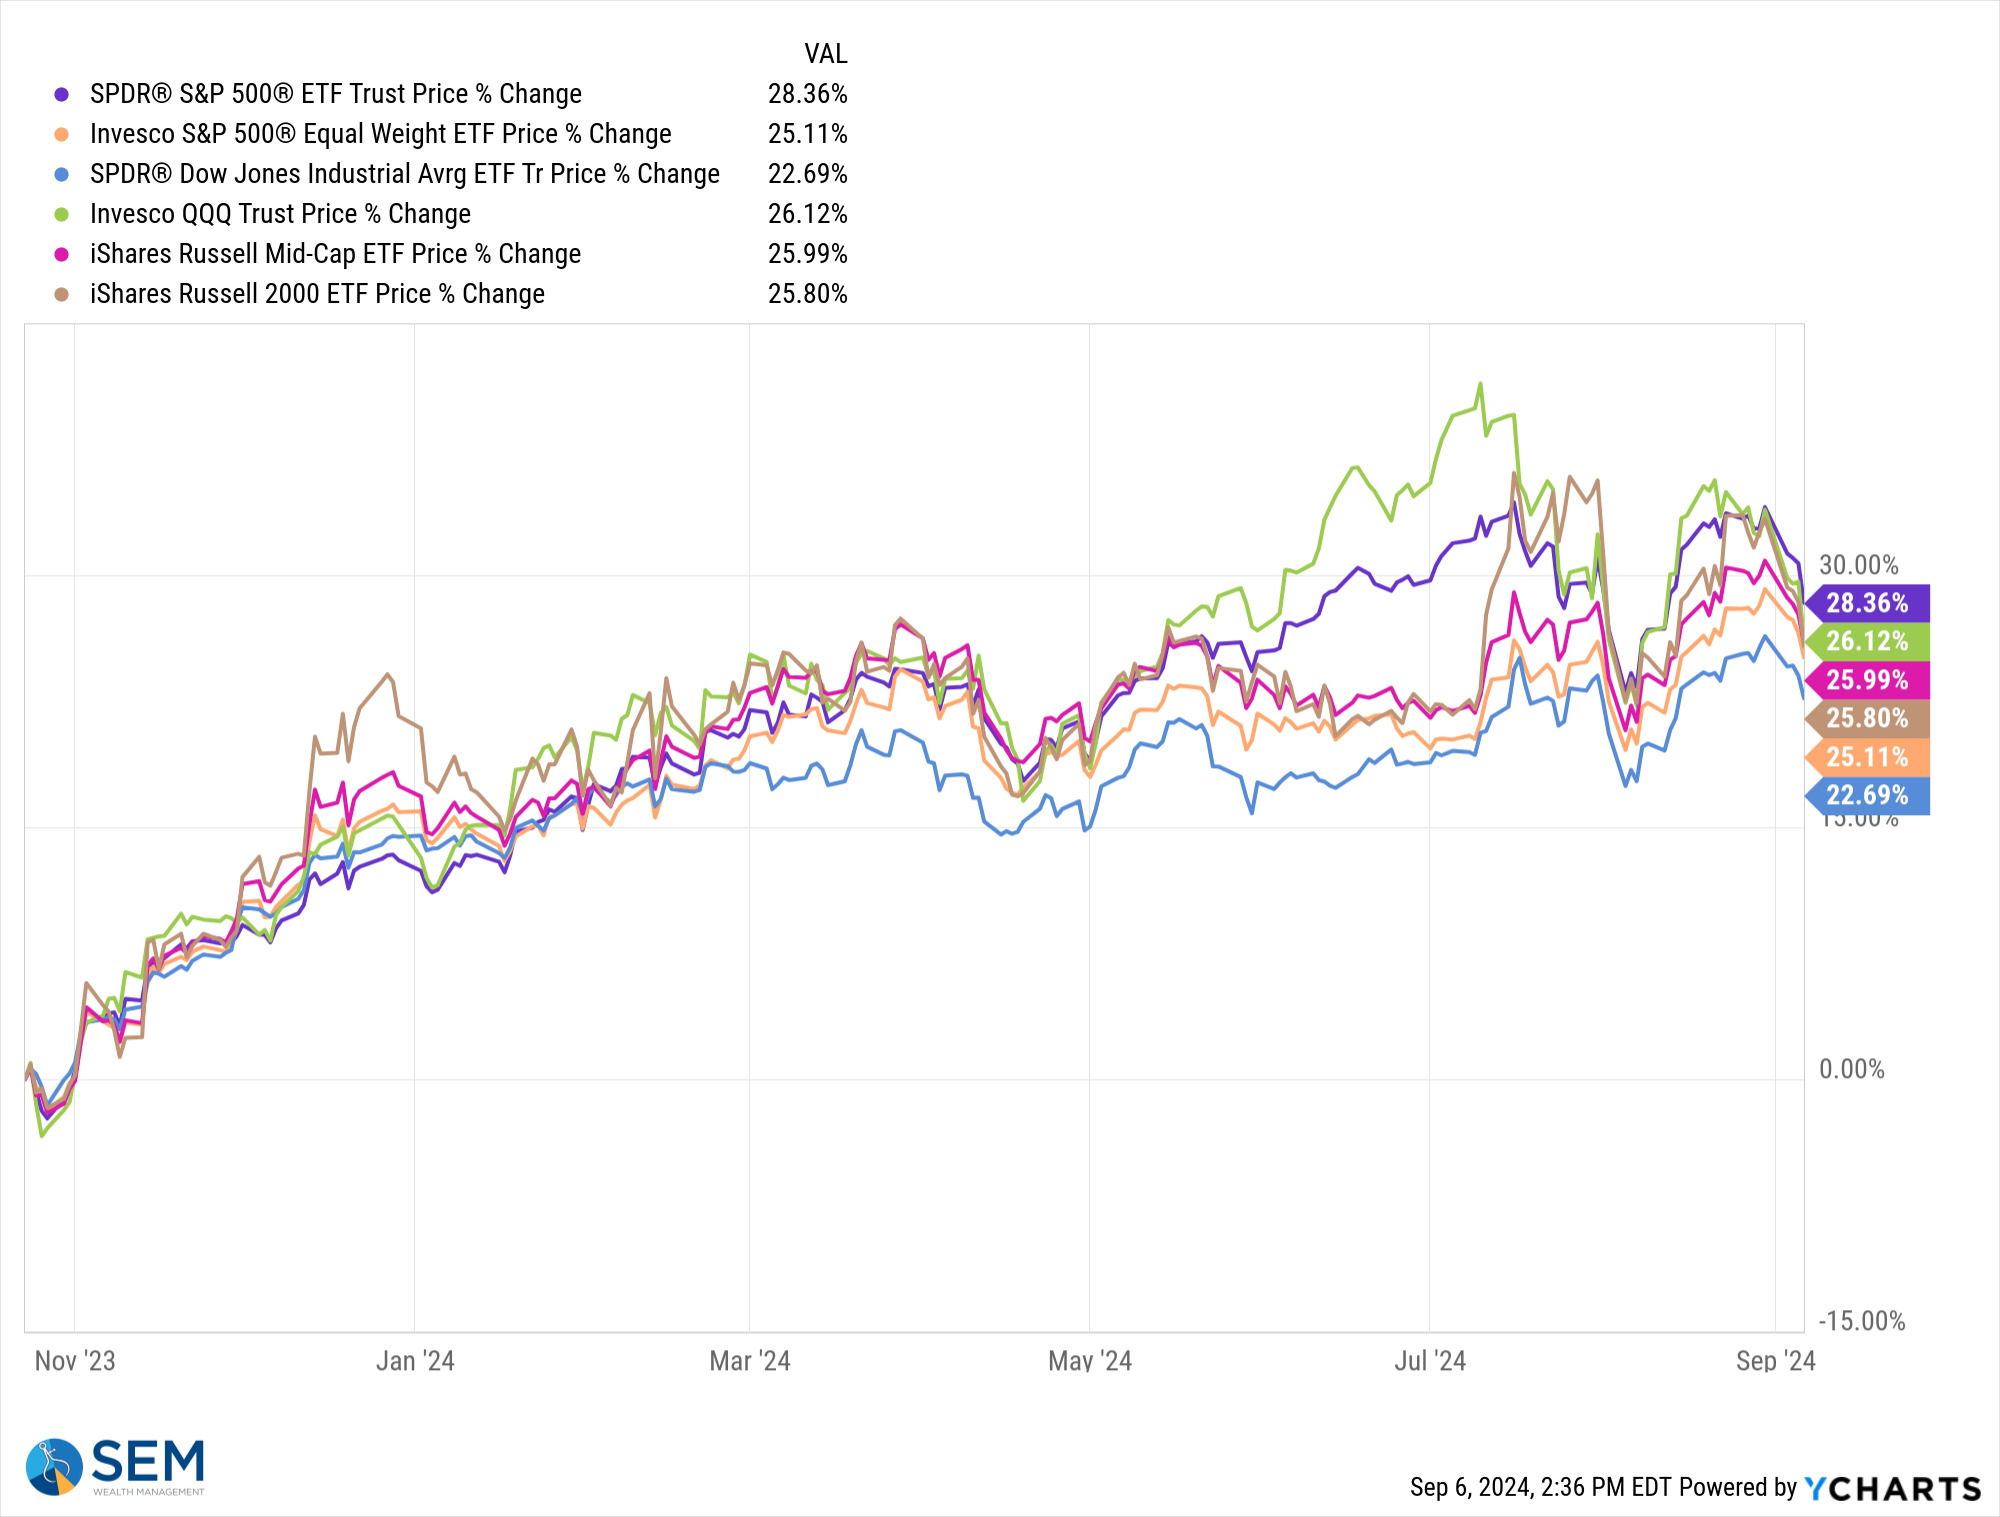
Since that time, 'slow' economic data was cheered as an encouraging sign the Fed was on the verge of cutting rates. Any "strong" economic data was seen as problematic. The economy has been slowing for quite some time and the market rallied 37% from the bottom last October to the highs of July 18 and August 30. That is not a typo – the mere thought of the Fed cutting interest rates generated a 37% rally in the stock market.
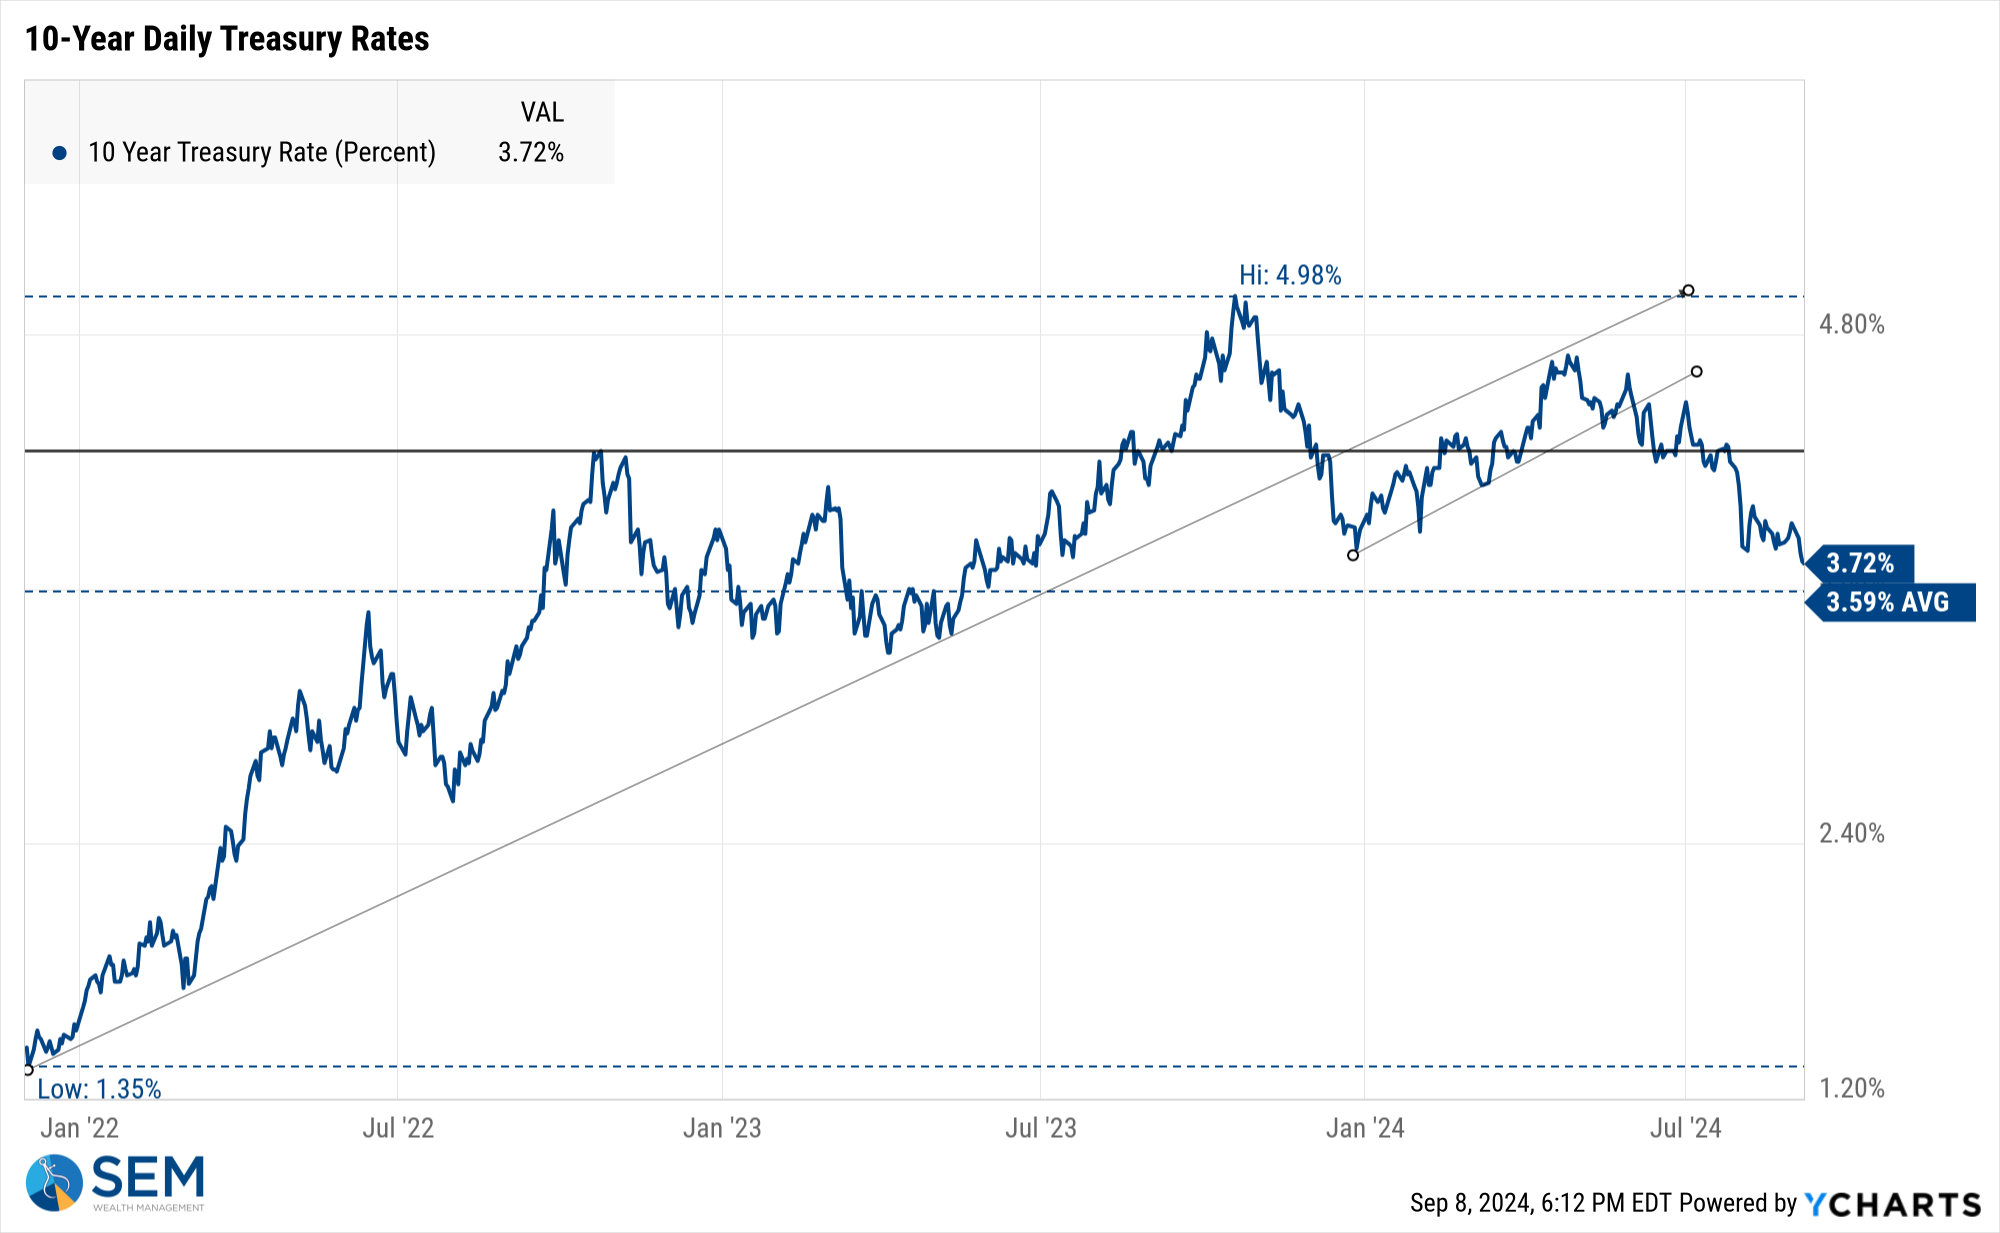
Interest rates also reacted strongly – the 10-year Treasury yield has dropped a total of 1% (100 basis points) since the Fed began hinting they might cut rates. 11 months later the Fed has not moved, but the market is pricing in a total of 100 basis points in cuts before the end of the year.
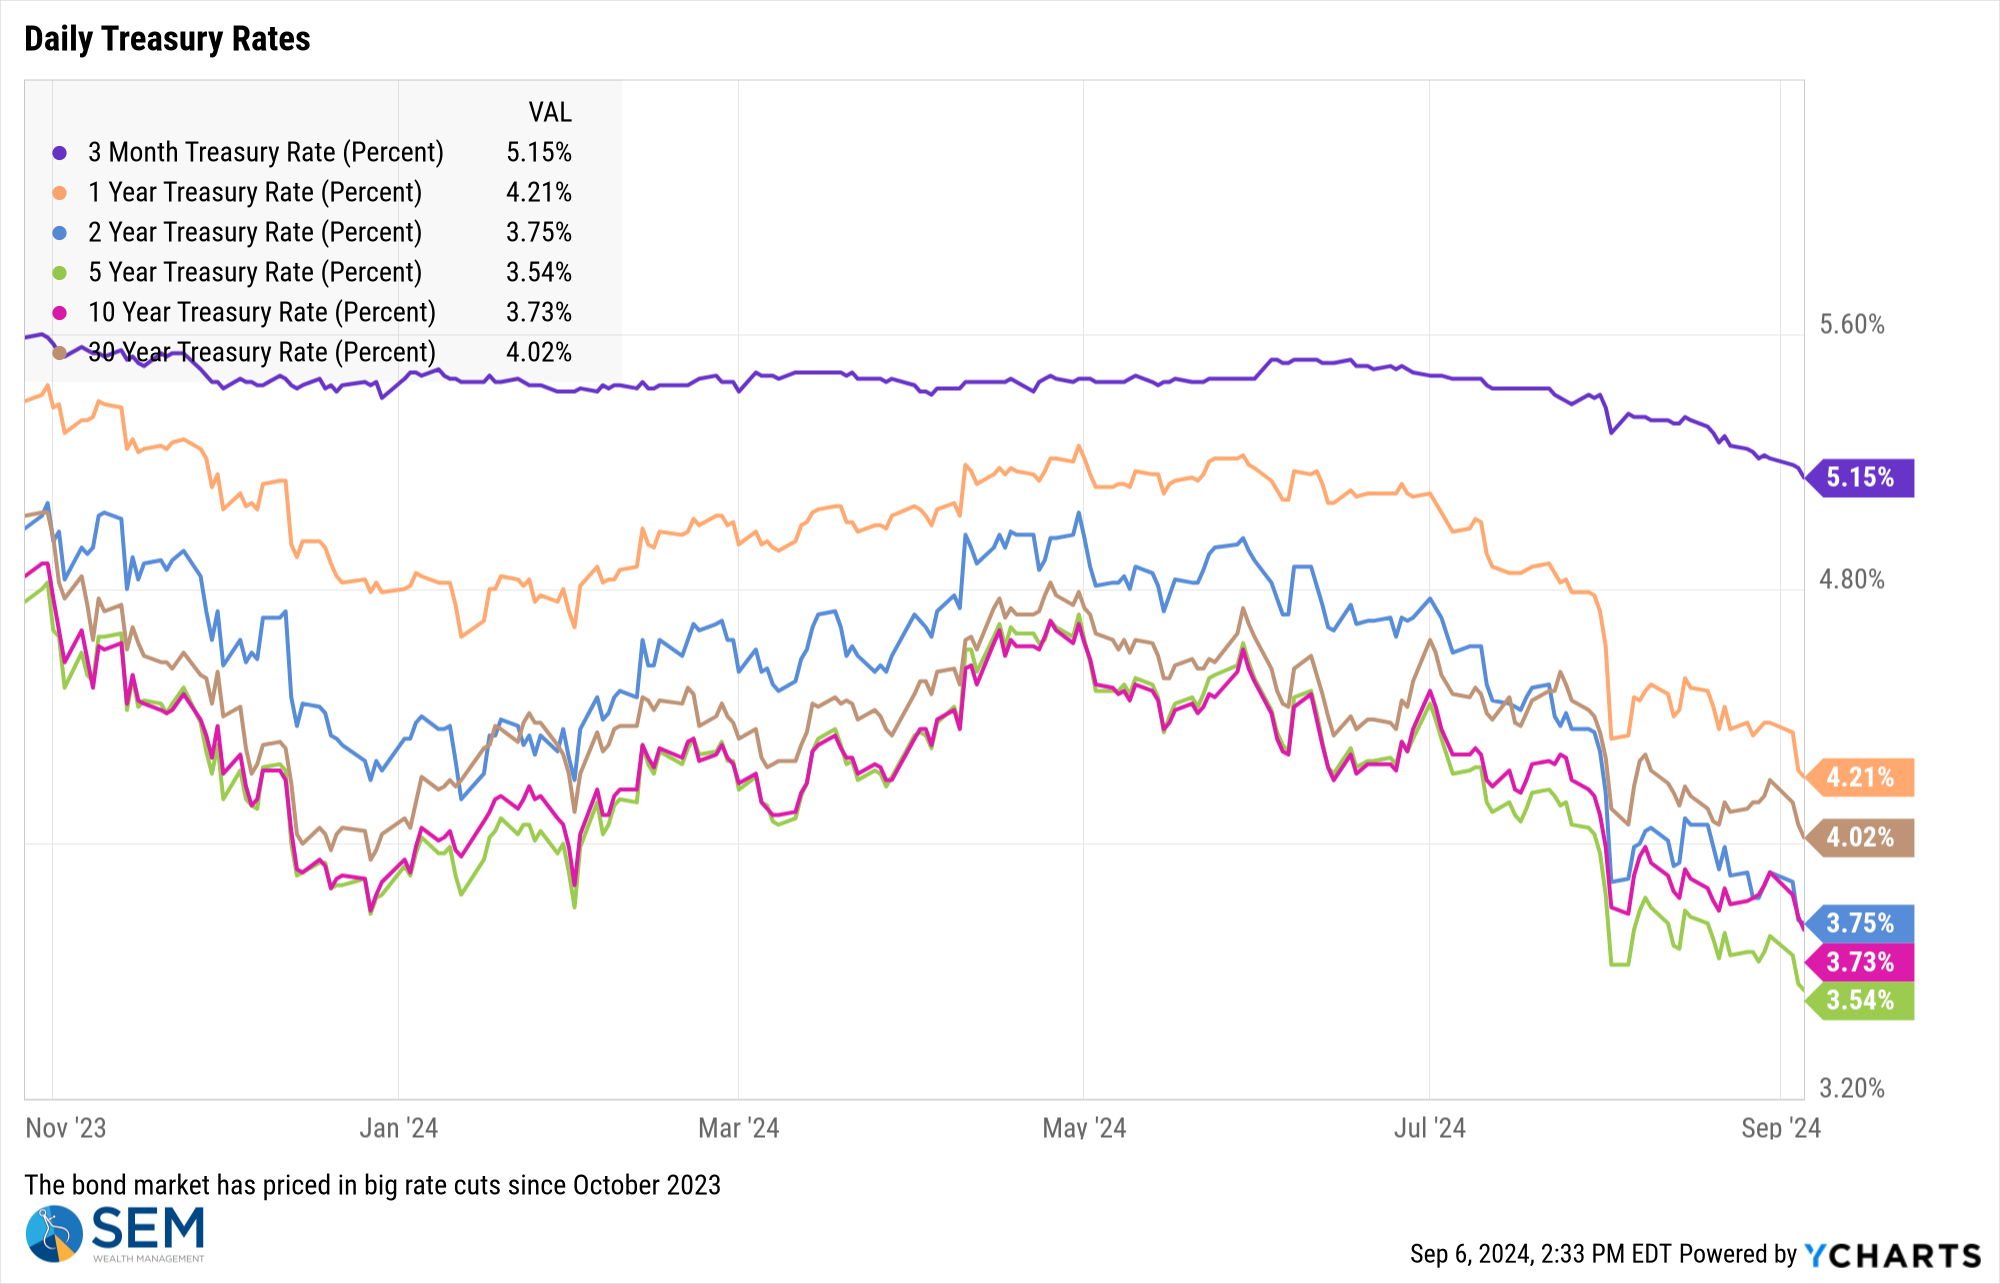
Two weeks ago, Fed Chair Powell emphasized that the "time was right" to begin cutting rates. One problem facing the Fed is both the stock and bond market has already assumed this was going to happen and reacted with confidence.
I sort of look at this like the difference between my parents saying "maybe" and the reaction my kids give when I say "maybe" when asked if they can do something. Growing up, if my parents answered with a maybe it was just another way of them saying no. The only return we'd get if we tried to change their mind was not positive and thus something we learned to stop trying. With our kids, if we answer "maybe", this is usually followed by a fist pump and a "YES!" They know I'm open to convincing and they will do their very best to swing my answer to yes.
Speaking of my kids, we started a new video series last month, "Money Talks with Dad". We've been posting clips to social media. You can get the full first episode here. Hopefully you'll see I'm not as bad as a parent as my kids' reaction to a 'maybe' might indicate.
The market seems to have the same mindset of my kids. A "maybe" from the Fed is immediately assumed to be a resounding Yes. If they Fed does not answer 'yes' soon enough, their kids (the markets) will throw a tantrum. This is nothing new. I've lamented since the financial crisis about the problem we have when the Fed bows to every wish of the 'market' and ignores the rest of the economy.
The other problem the Fed is facing is once again it is appearing they moved TOO SLOW. Suddenly 'slow' economic data is not good news. The fear is the economy could enter a recession before the Fed's interest rate cuts could stop it from happening. With a market pricing in ABOVE AVERAGE earnings growth for both 2024 and 2025 that is a problem, especially when you consider a week ago valuations were near bubble-era levels.
With the jobs report last Friday, we closed the book on our economic model for the month. Looking at our dashboard, it is not a pretty site.
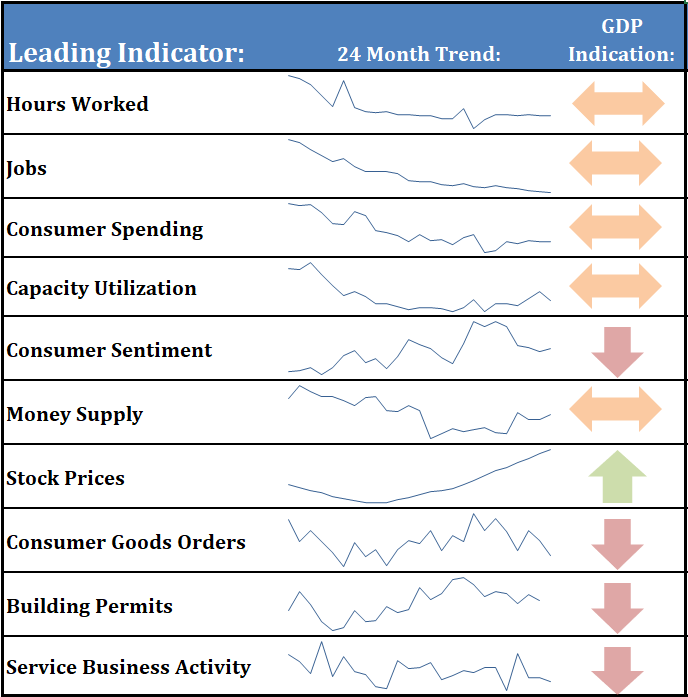
A quick glance will show just one indicator still indicating a STRONG economy. Ironically that is the stock market (based on the 12 month moving average through the end of August). With the economy at a cross-roads, let's take a quick visual stroll through our leading indicators:
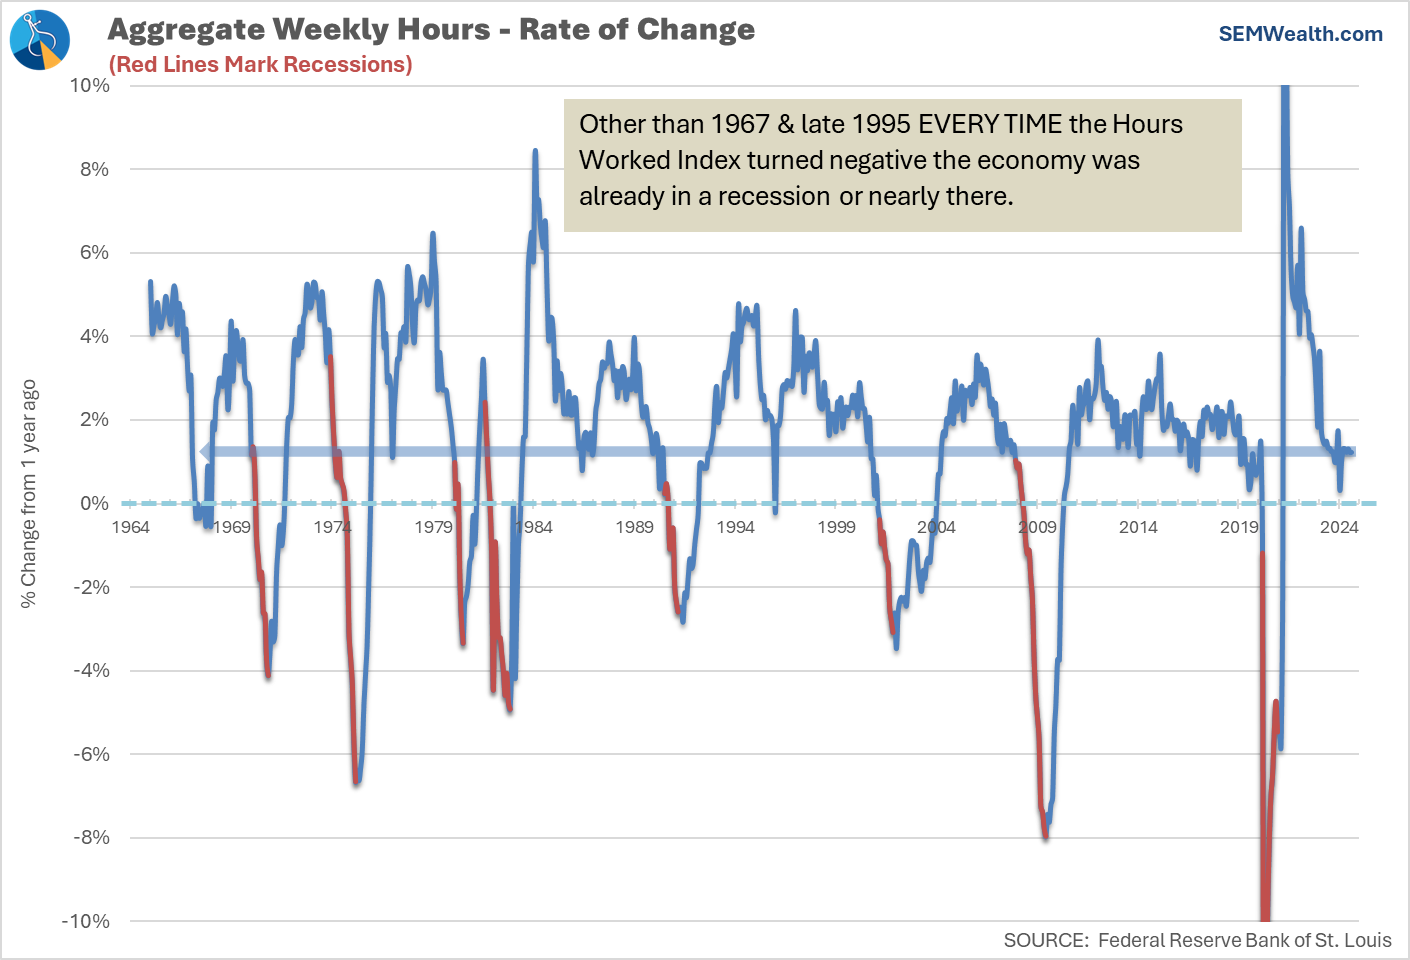
Hours Worked
Indication: Flattening Growth
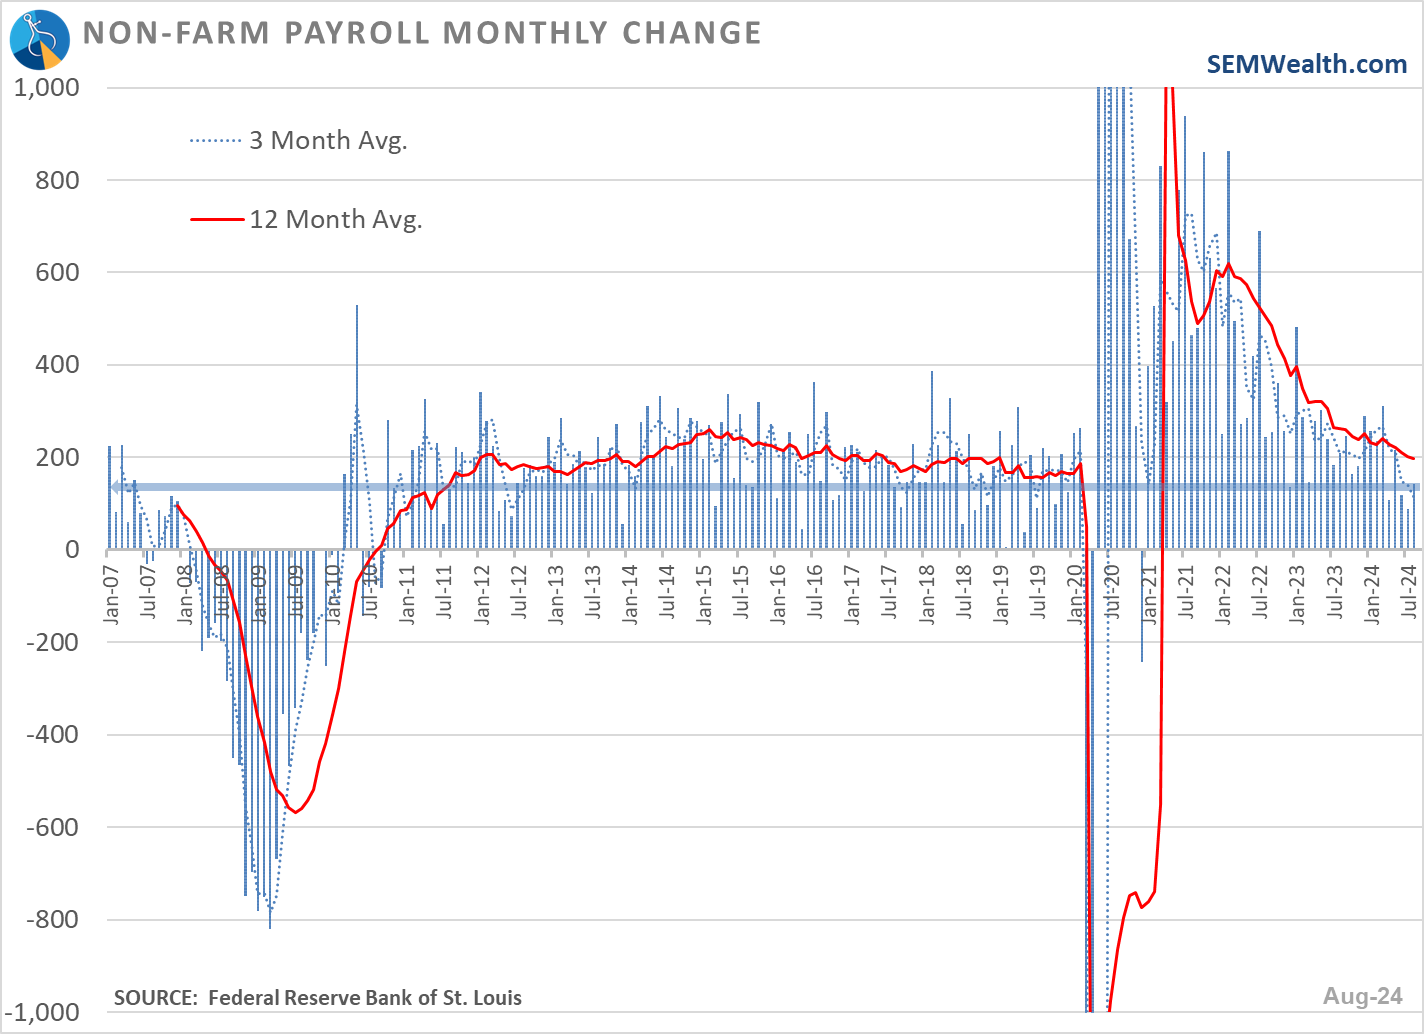
Jobs
Indication: Flattening Growth
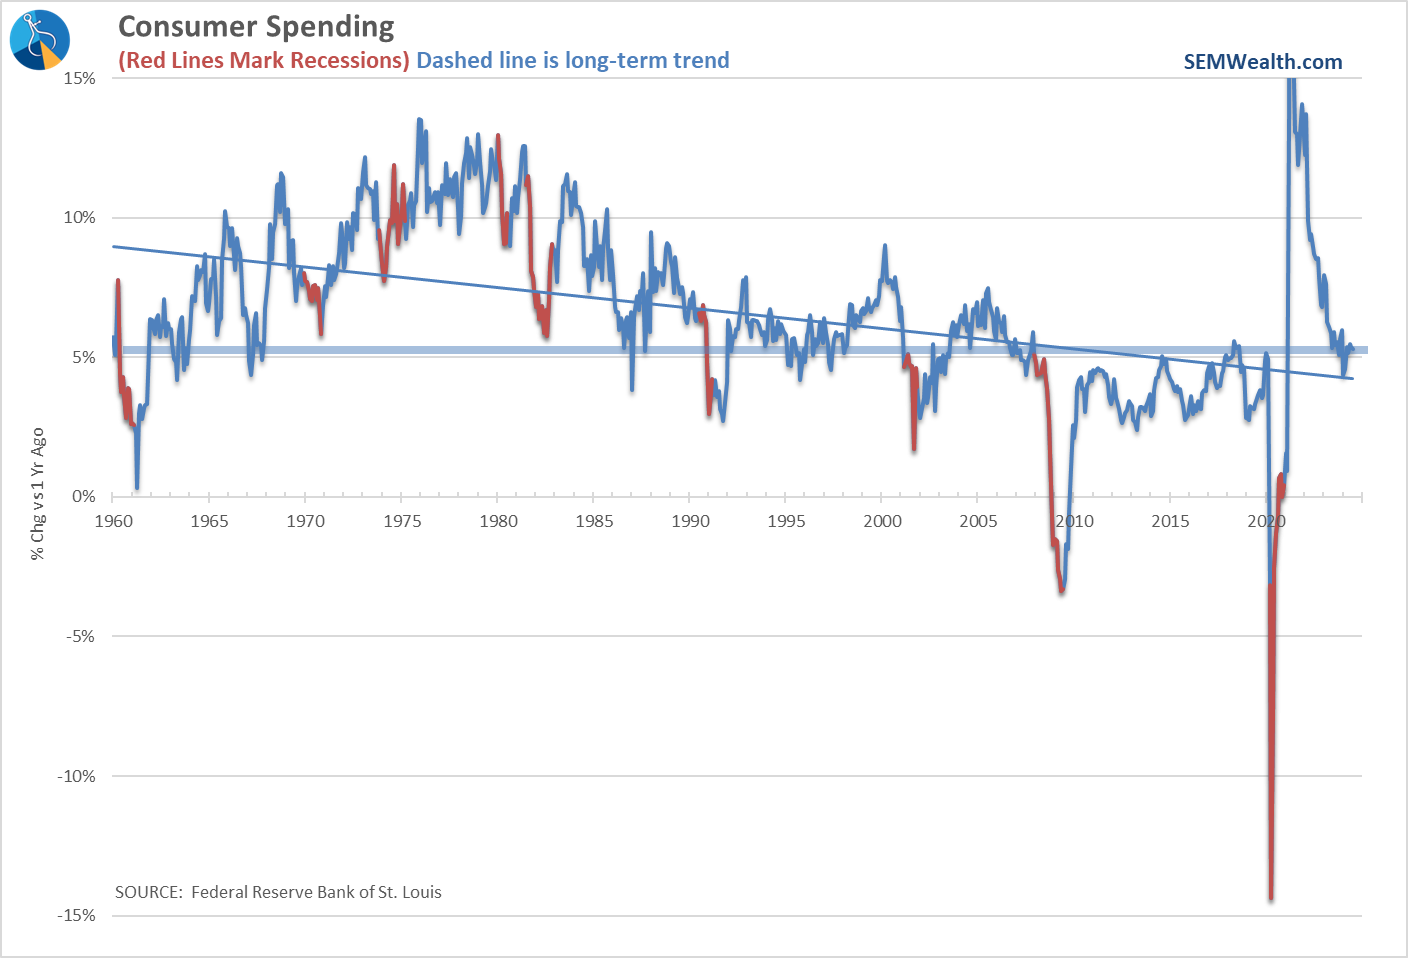
Consumer Spending
Indication: Flattening Growth
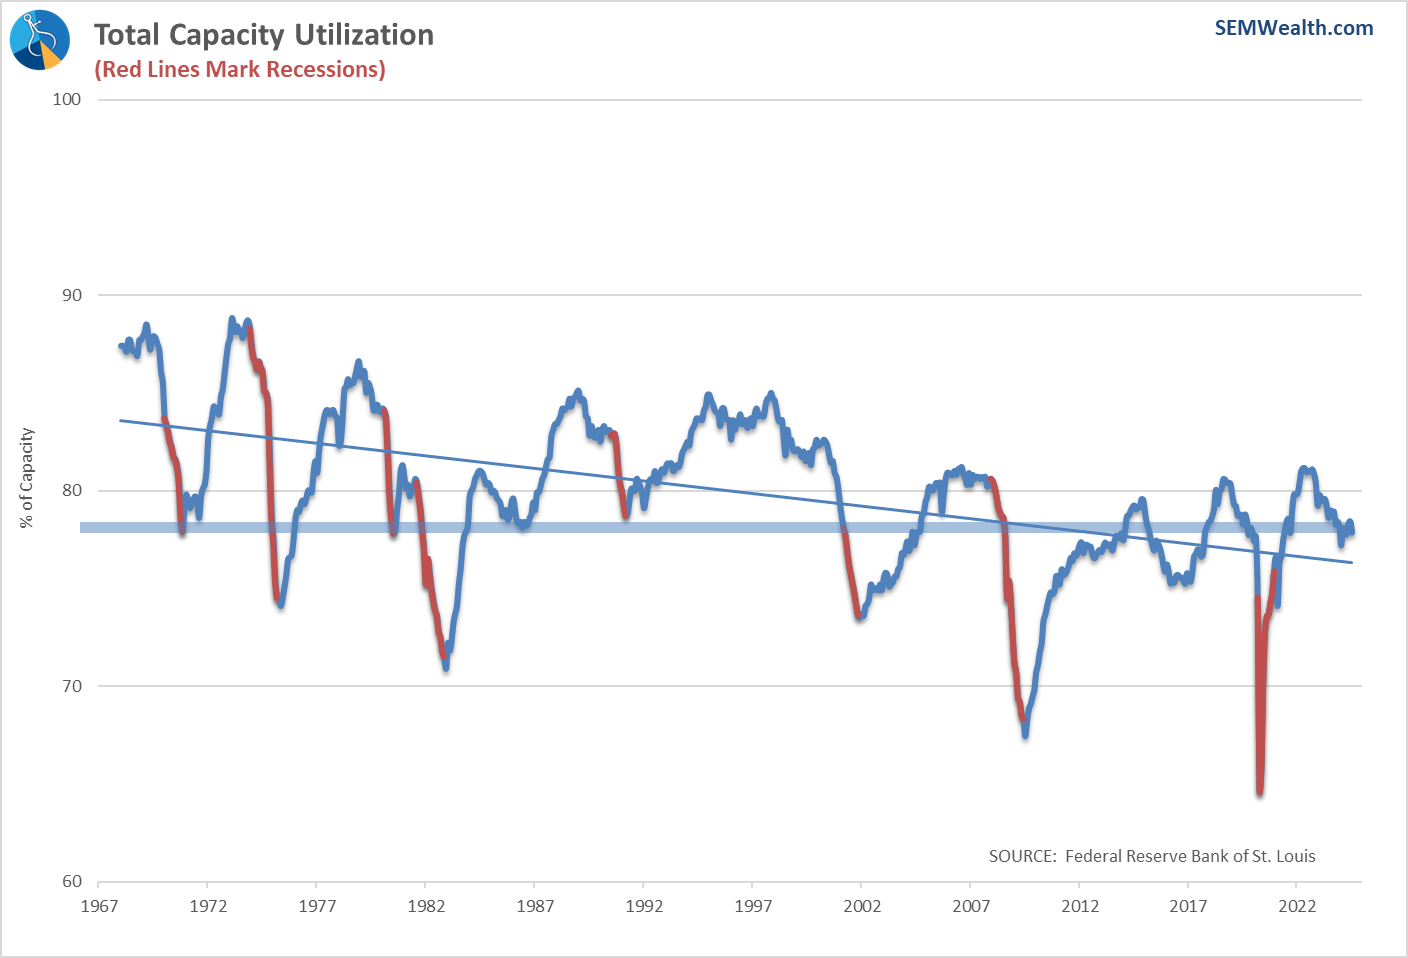
Capacity Utilization
Indication: Flattening Growth
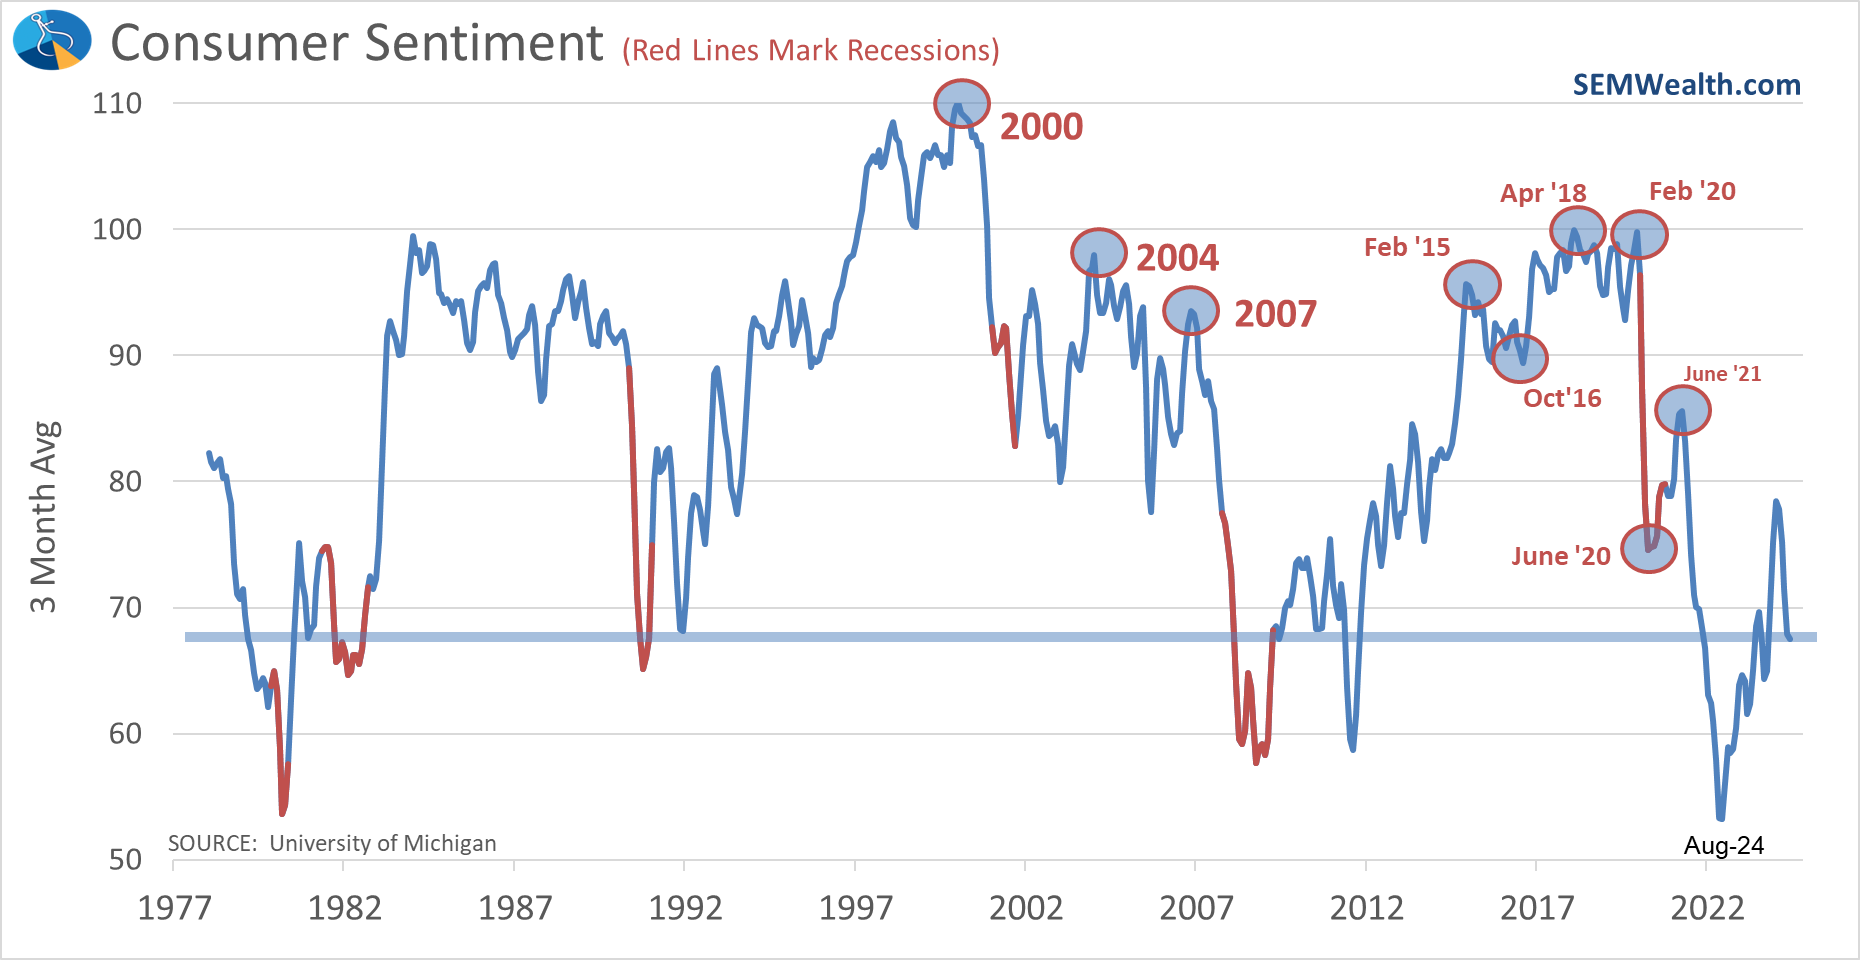
Consumer Sentiment
Indication: SLOWING Growth
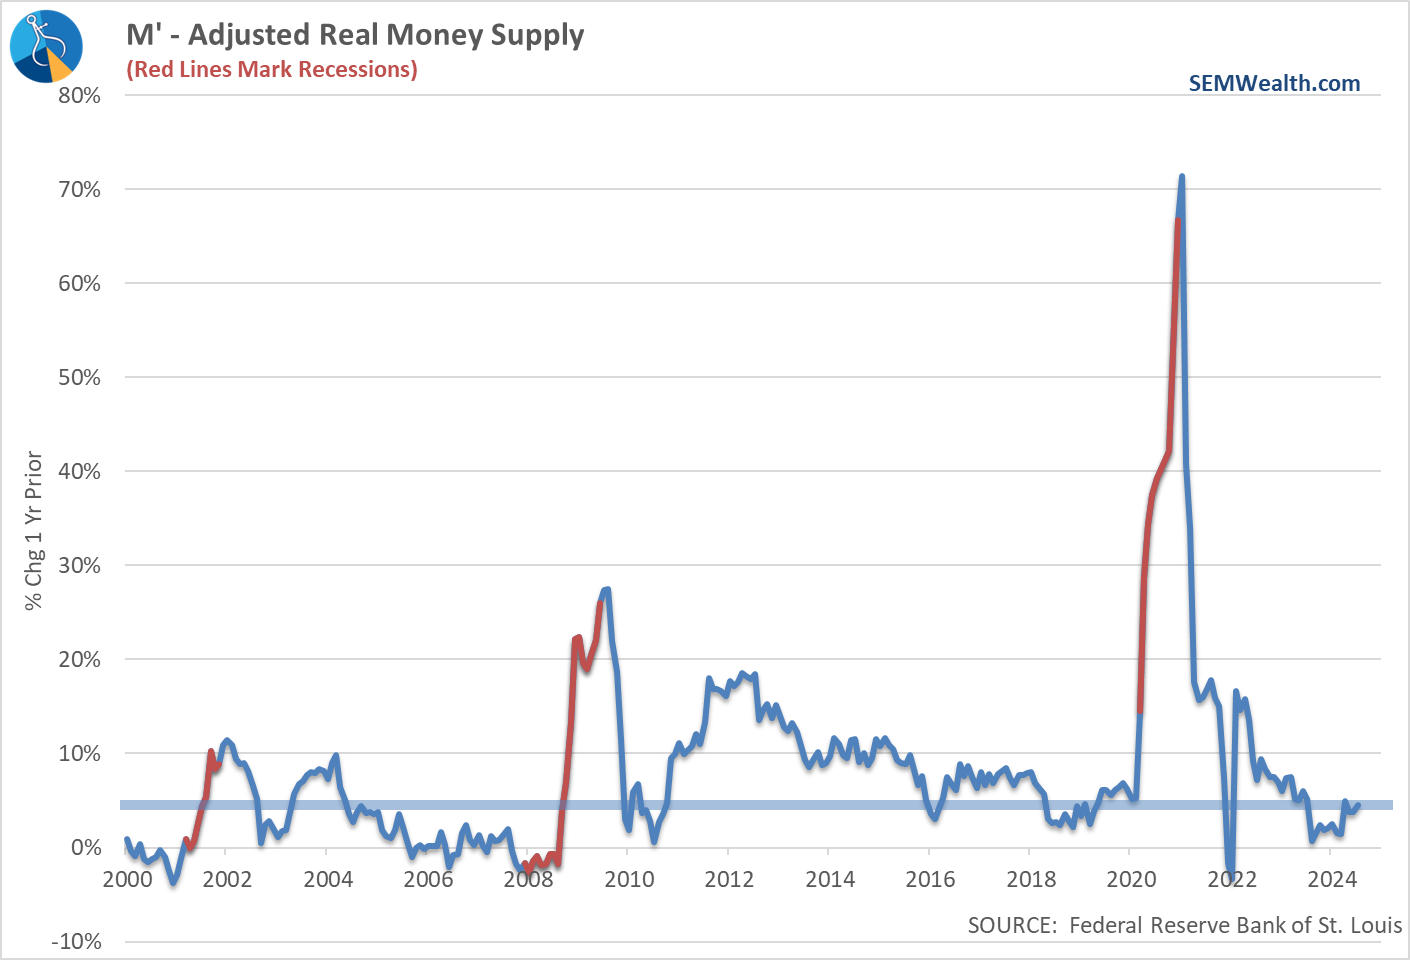
Money Supply
Indication: Flattening Growth
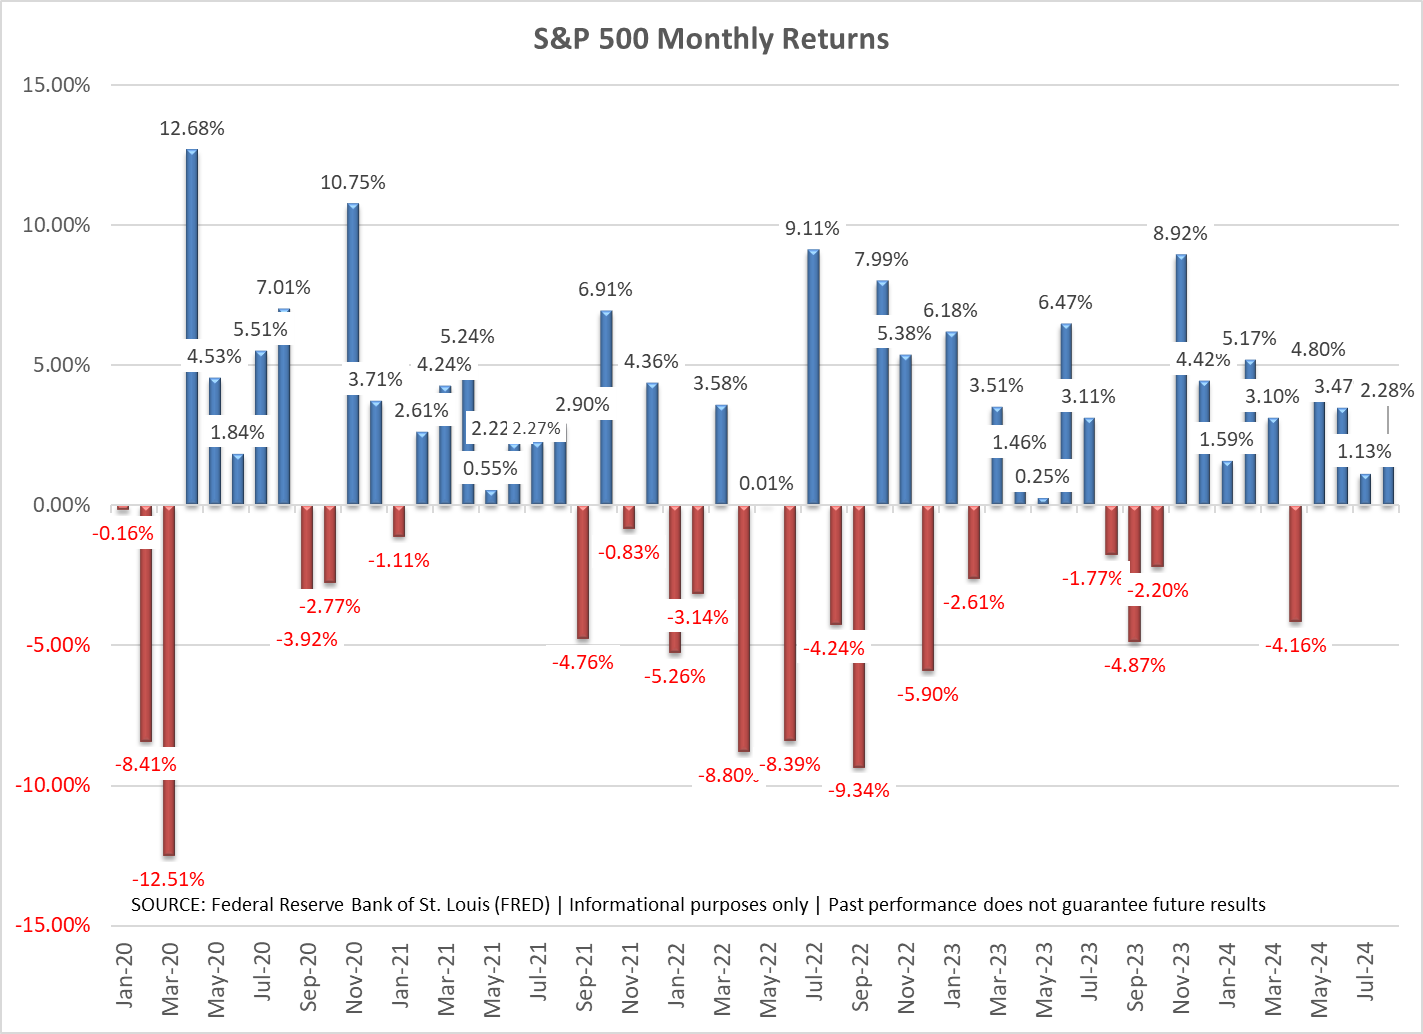
Stock Prices
Indication: EXPANDING Growth
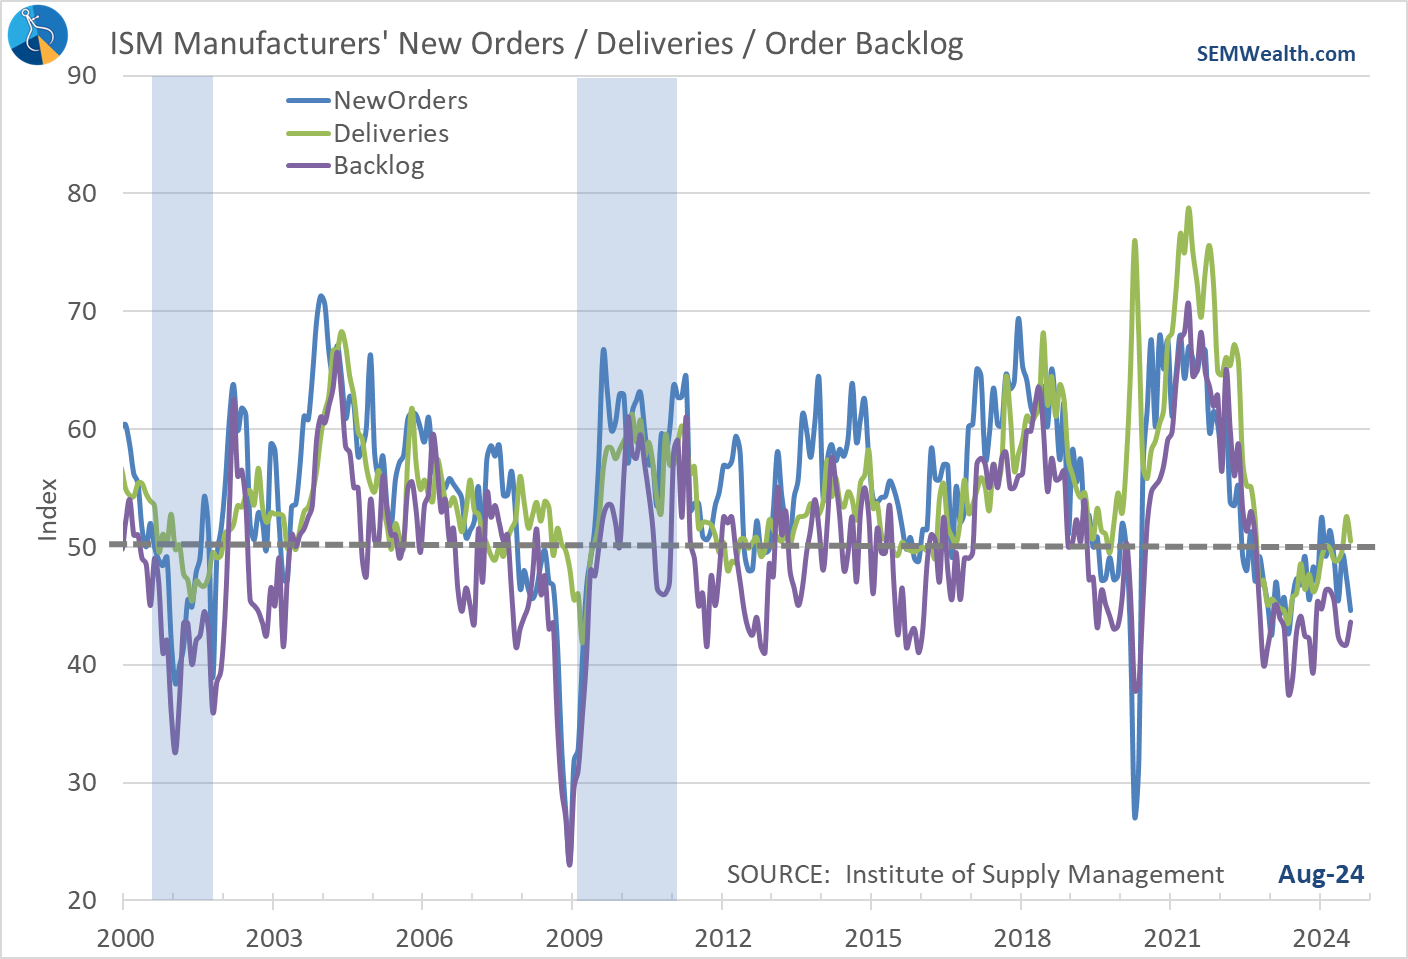
Consumer Goods Orders
Indication: SLOWING Growth
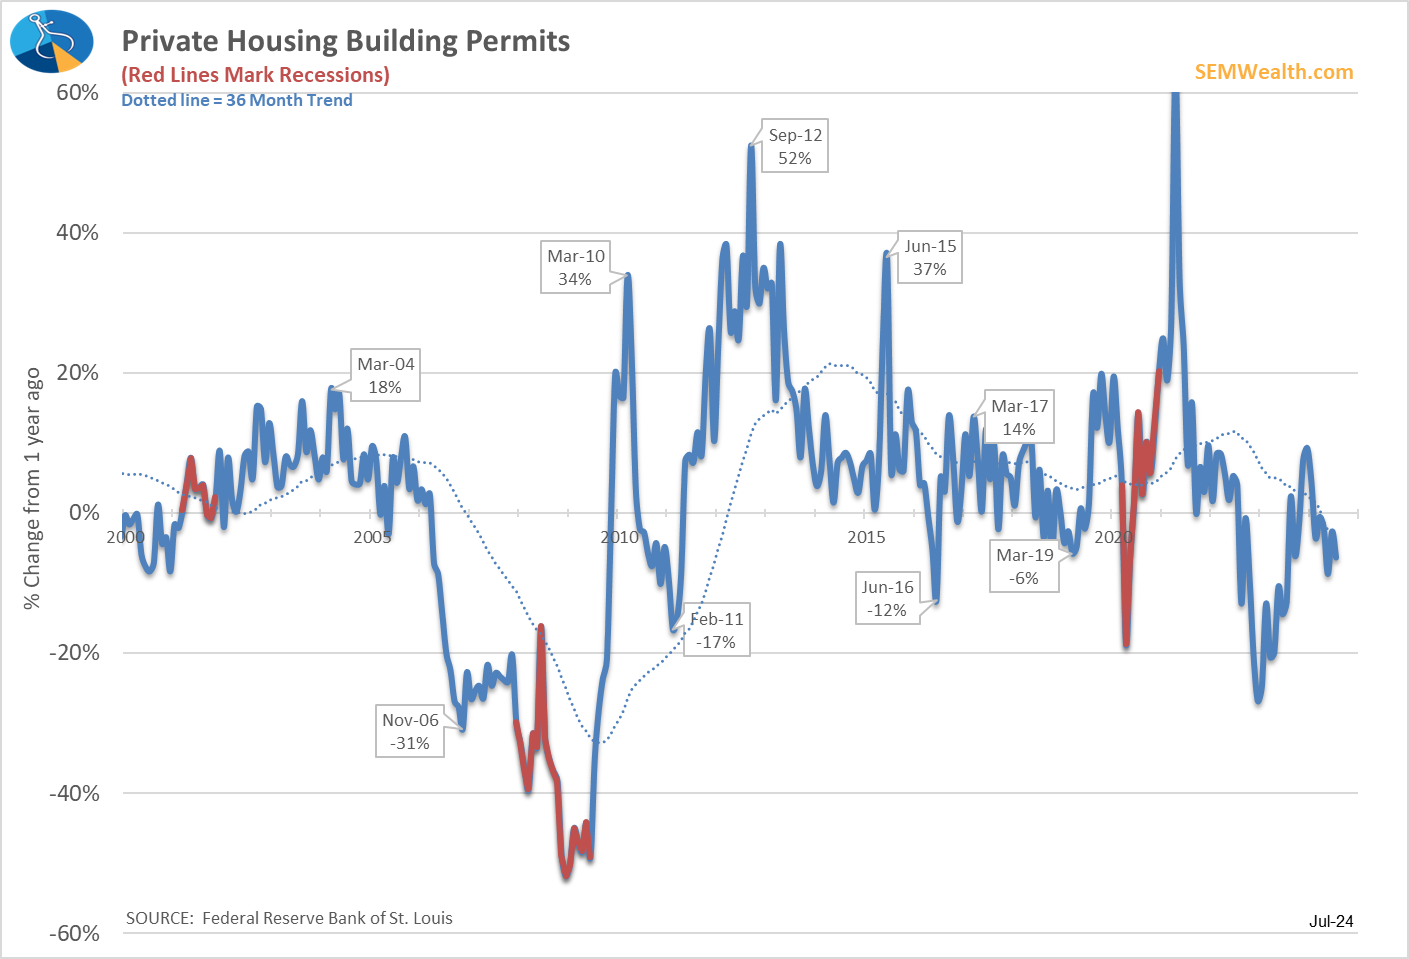
Building Permits
Indication: SLOWING Growth
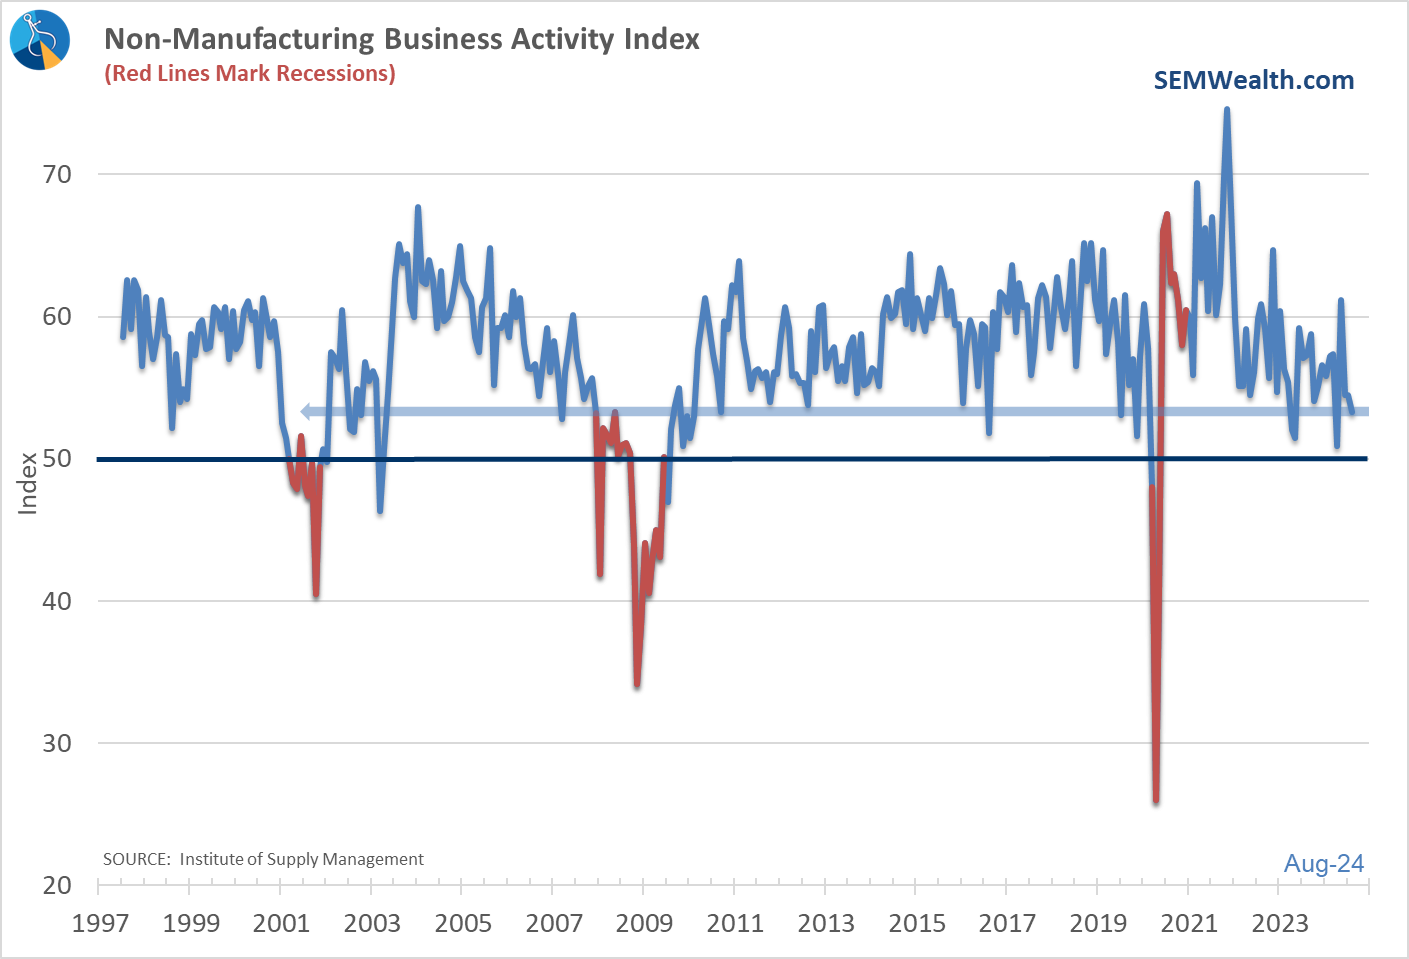
Service Business Prices
Indication: SLOWING Growth
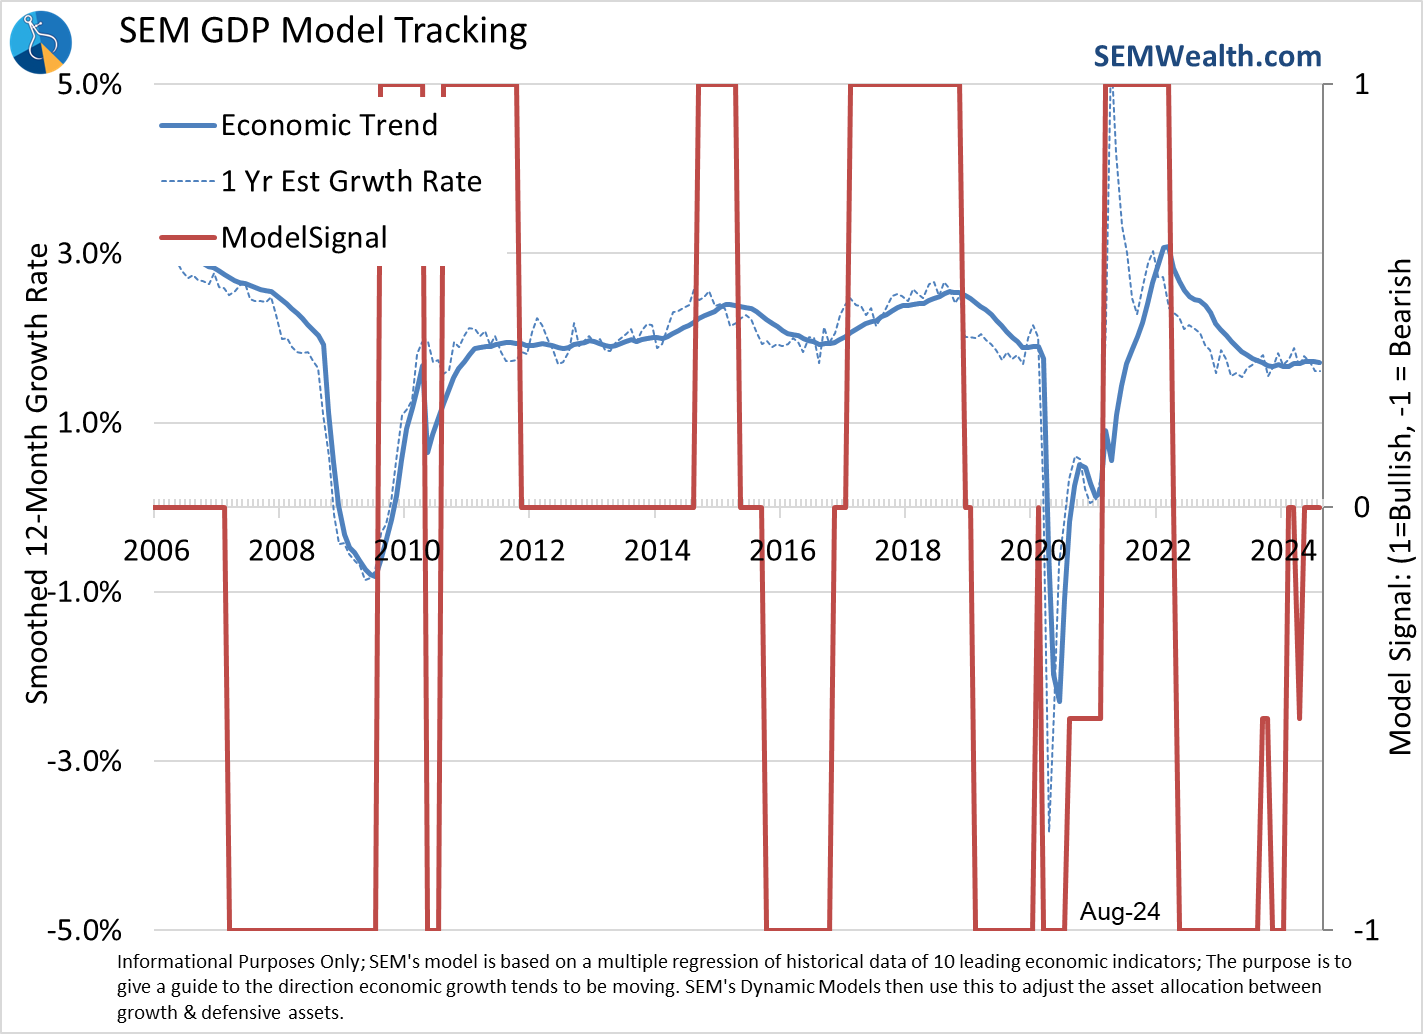
OVERALL MODEL INDICATION
Flattening Growth
Despite a few more indicators flipping from "expanding" to "flattening" last month, our economic model, which smooths the volatile monthly readings remains "neutral".
What does this mean? At a minimum it means BE CAREFUL. This is the point in the economic cycle where a lot of damage can be done trying to decipher every move in the market. A week ago before the market opened I worried about the "certainty" everyone had about a "great" outcome. We just saw our worst single week since last year, so at least some of that worry has been alleviated with valuations dropping a bit, but it doesn't mean you should rush in to buy the dip (unless your financial plan calls for MORE equity exposure and you already have cash on the sidelines.)
We should EXPECT three 5% or higher drops per year, at least one 10% drop in a year, and a 20-25% drop every 3 or 4 years. It's been nearly a year since the last 10% drop.
I won't waste my time or your time speculating about what the Fed may or may not do and what that may or may not do to the prospects of a recession. That's for everyone on TV to do. It's a pointless exercise.
Instead, we will continue to focus on our time-tested models to make our decisions, a stance that has served us well the past 32+ years.
SEM Model Positioning
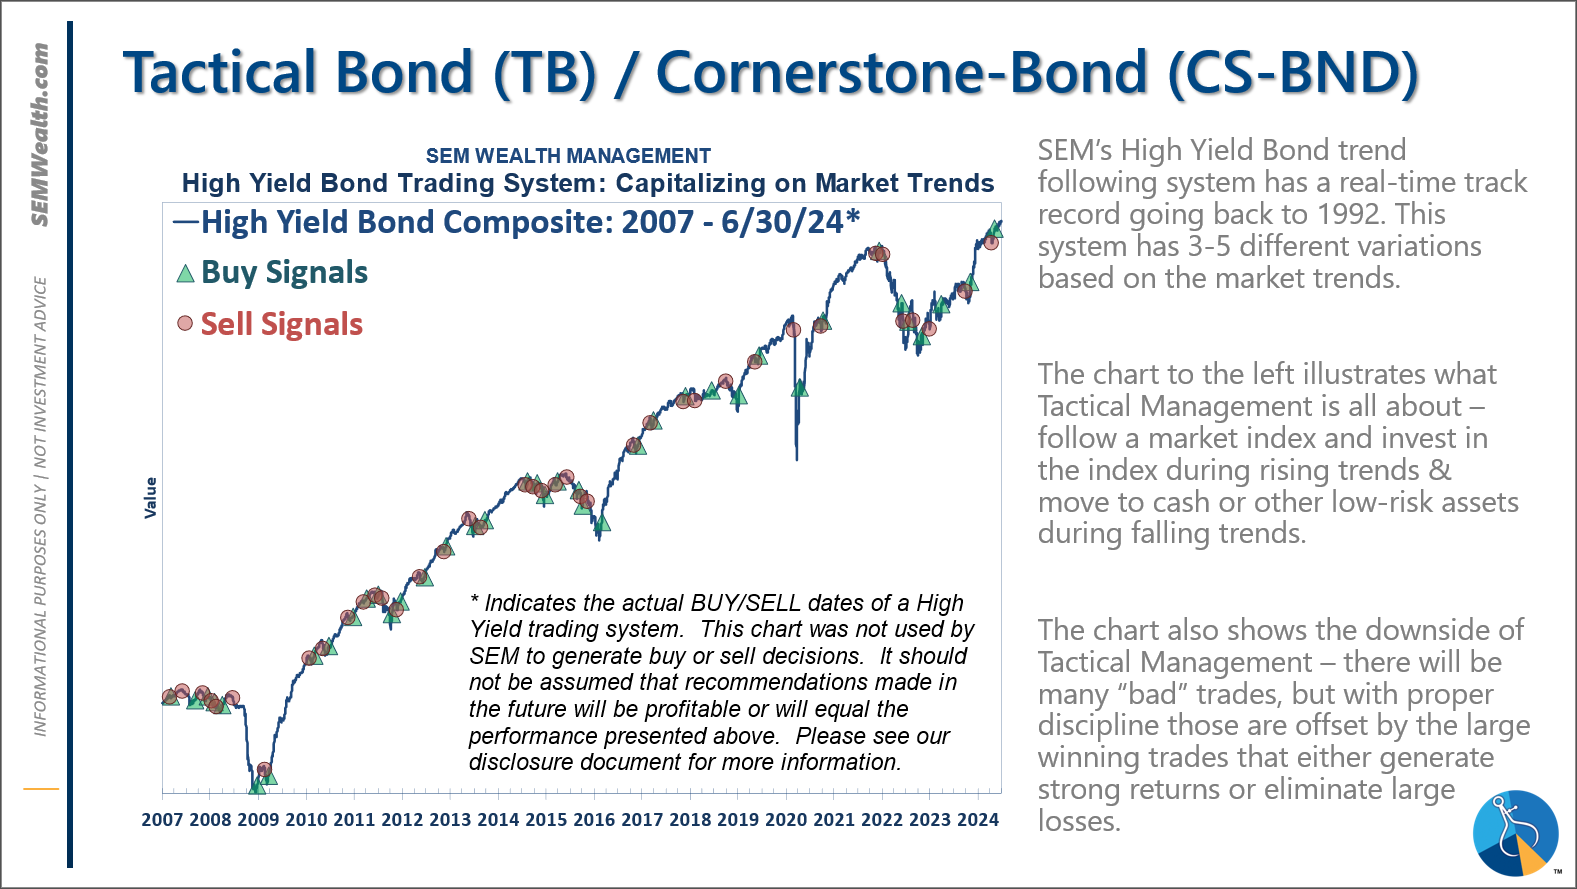
-Tactical High Yield had a partial buy signal on 5/6/24, reversing some of the sells on 4/16 & 17/2024 - the other portion of the signal remains on a sell as high yields continue to oscillate.
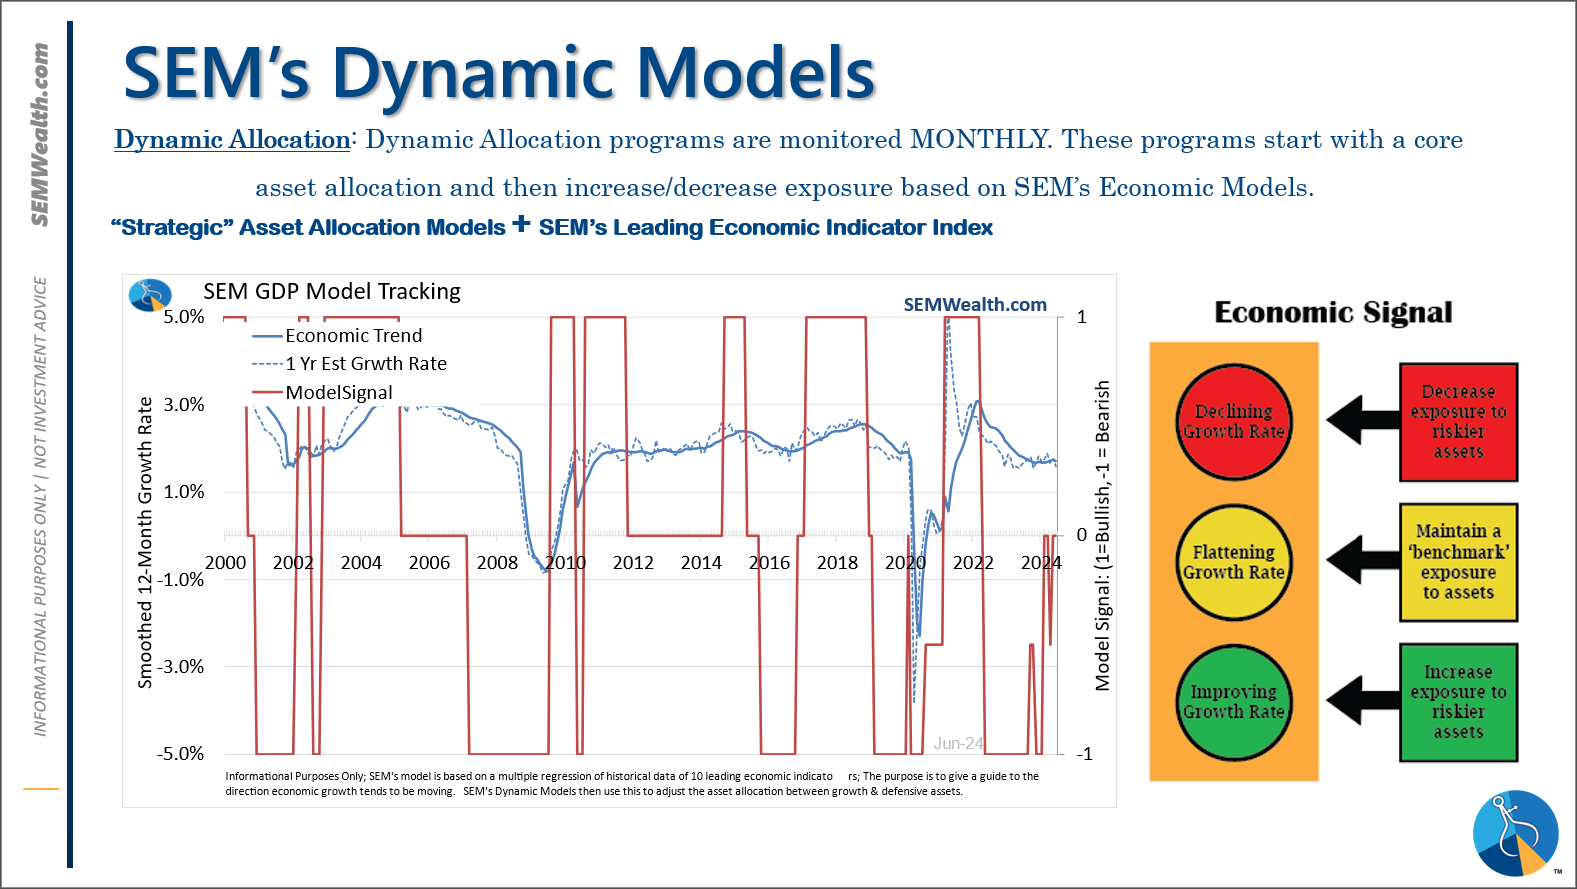
-Dynamic Models are 'neutral' as of 6/7/24, reversing the half 'bearish' signal from 5/3/2024. 7/8/24 - interest rate model flipped from partially bearish to partially bullish (lower long-term rates).
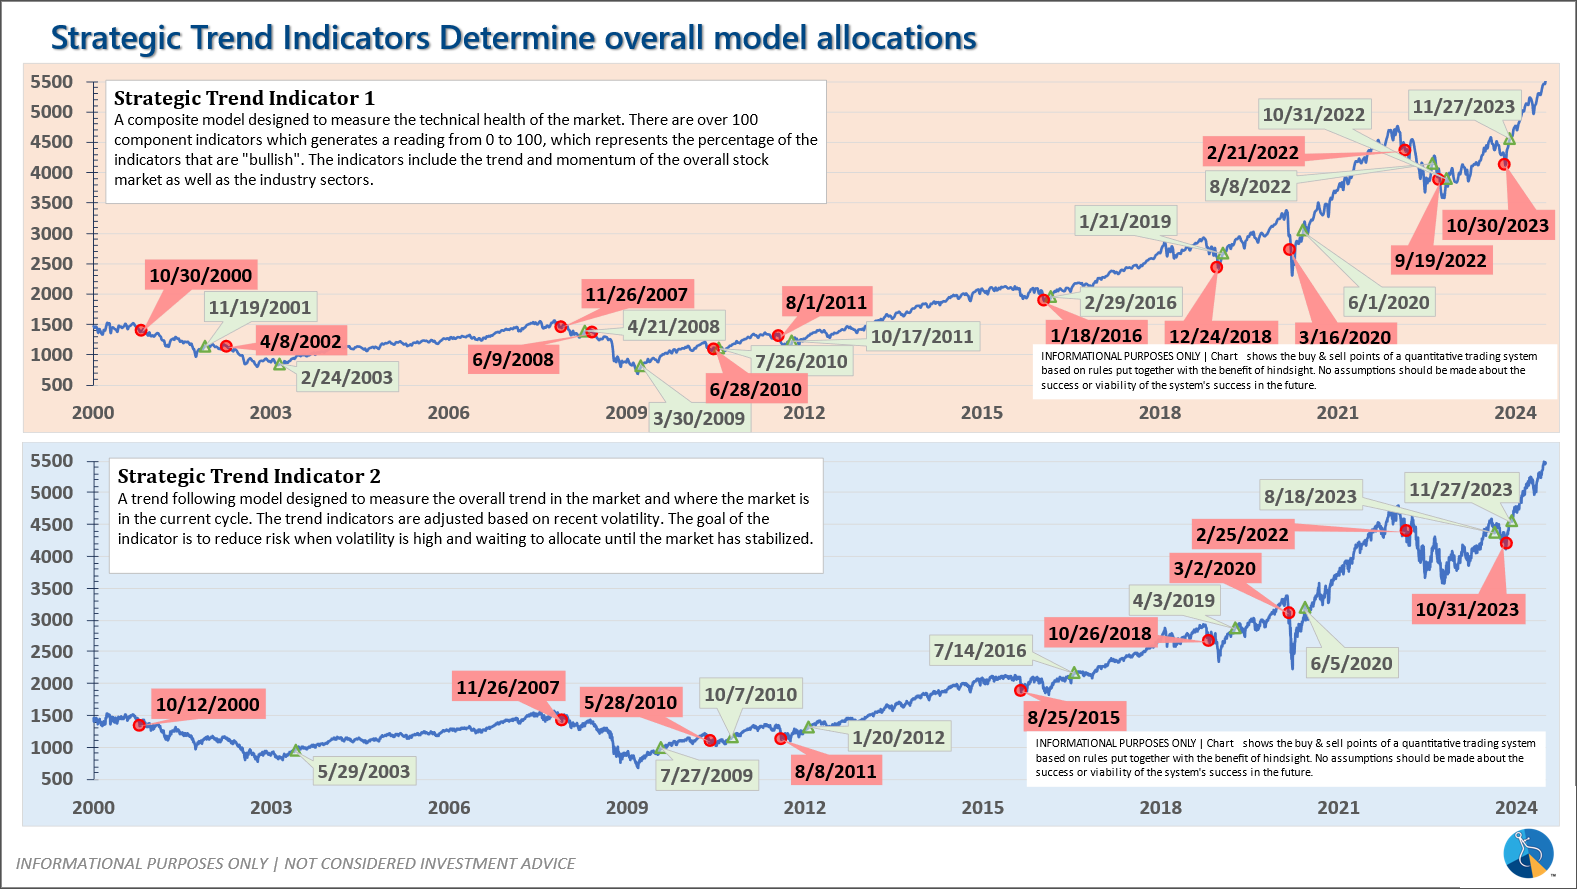
-Strategic Trend Models went on a buy 11/27/2023; 7/8/24 – small and mid-cap positions eliminated with latest Core Rotation System update – money shifted to Large Cap Value (Dividend Growth) & International Funds
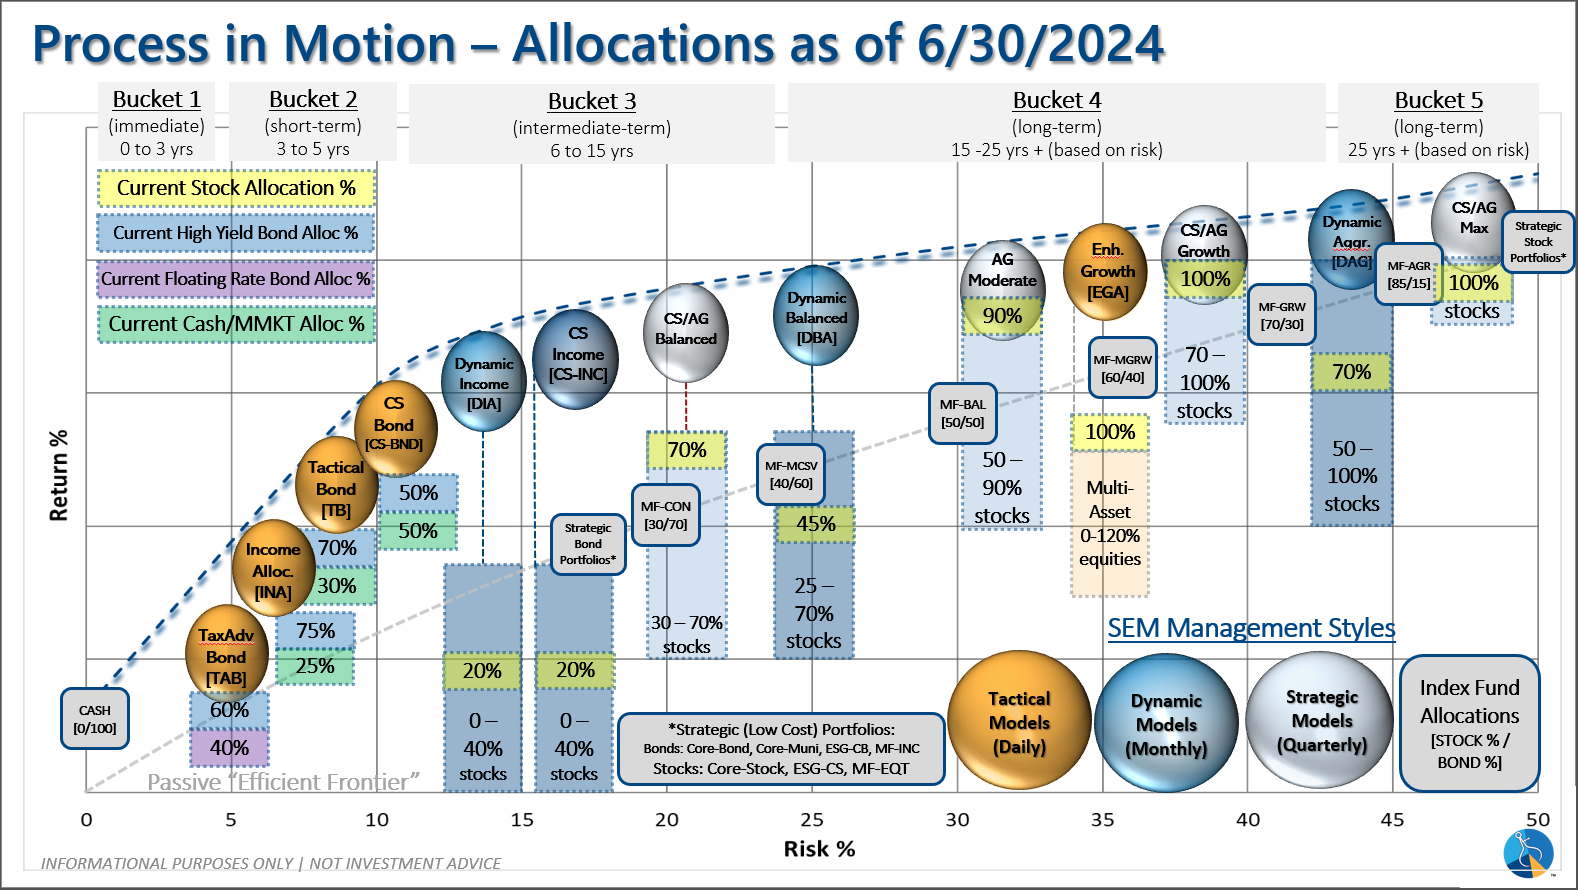
SEM deploys 3 distinct approaches – Tactical, Dynamic, and Strategic. These systems have been described as 'daily, monthly, quarterly' given how often they may make adjustments. Here is where they each stand.
Tactical (daily): On 5/6/24 about half of the signals in our high yield models switched to a buy. The other half remains in money market funds. The money market funds we are currently invested in are yielding between 4.8-5.3% annually.
Dynamic (monthly): The economic model was 'neutral' since February. In early May the model moved slightly negative, but reversed back to 'neutral' in June. This means 'benchmark' positions – 20% dividend stocks in Dynamic Income and 20% small cap stocks in Dynamic Aggressive Growth. The interest rate model is slightly 'bullish'.
Strategic (quarterly)*: BOTH Trend Systems reversed back to a buy on 11/27/2023
The core rotation is adjusted quarterly. On August 17 it rotated out of mid-cap growth and into small cap value. It also sold some large cap value to buy some large cap blend and growth. The large cap purchases were in actively managed funds with more diversification than the S&P 500 (banking on the market broadening out beyond the top 5-10 stocks.) On January 8 it rotated completely out of small cap value and mid-cap growth to purchase another broad (more diversified) large cap blend fund along with a Dividend Growth fund.
The * in quarterly is for the trend models. These models are watched daily but they trade infrequently based on readings of where each believe we are in the cycle. The trend systems can be susceptible to "whipsaws" as we saw with the recent sell and buy signals at the end of October and November. The goal of the systems is to miss major downturns in the market. Risks are high when the market has been stampeding higher as it has for most of 2023. This means sometimes selling too soon. As we saw with the recent trade, the systems can quickly reverse if they are wrong.
Overall, this is how our various models stack up based on the last allocation change:
Questions or comments - drop us a note?
Curious if your current investment allocation aligns with your overall objectives and risk tolerance? Take our risk questionnaire


