
"Buy low, sell high," - easy to say, much more difficult to do. Last week we discussed the natural human emotions which drive our investment decisions. Generally speaking, the more stocks go up, the more we fall in love with them. As they start to fall a bit of fear creeps in. If they fall too far, we end up hating stocks. If you've followed the markets enough you know stocks will go up and down in cycles. The humans behind the market become overly optimistic to drive stocks higher than they should be, and then become overly pessimistic when stocks are unable to fill these unreasonable expectations.
The fascinating thing about this is there is plenty of data which shows the danger of investing when stocks are unreasonably high. There are plenty of metrics showing how stocks are valued. The most popular is the Price/Earnings (P/E) ratio. Interestingly enough, the P/E ratio is probably the worst measure of valuations we have available, but because it is easy to calculate it gets the most attention.
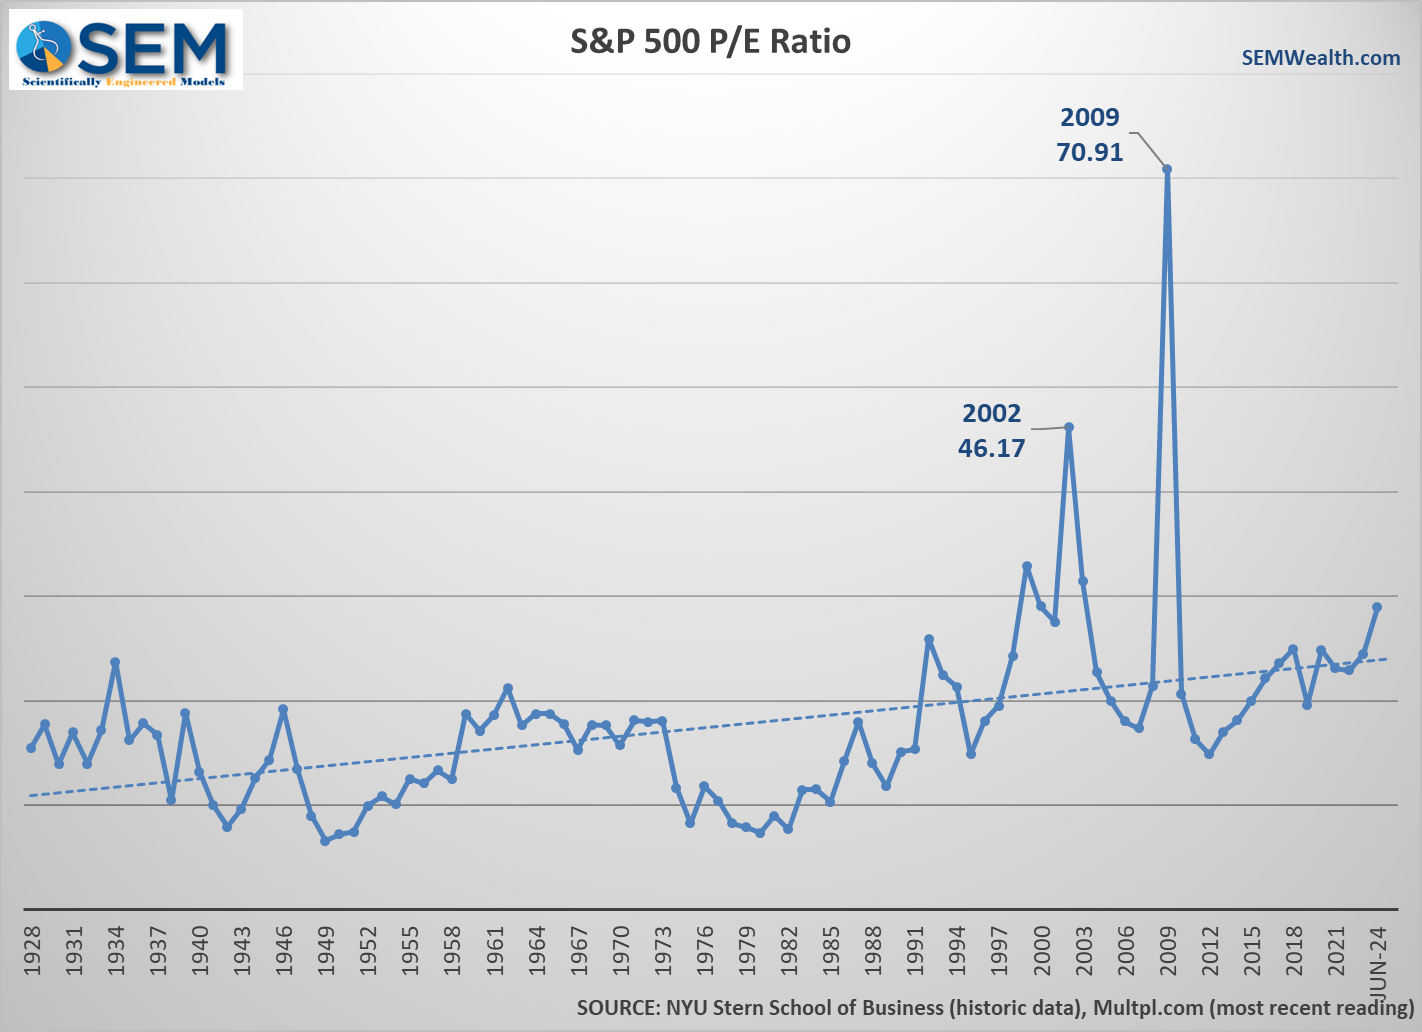
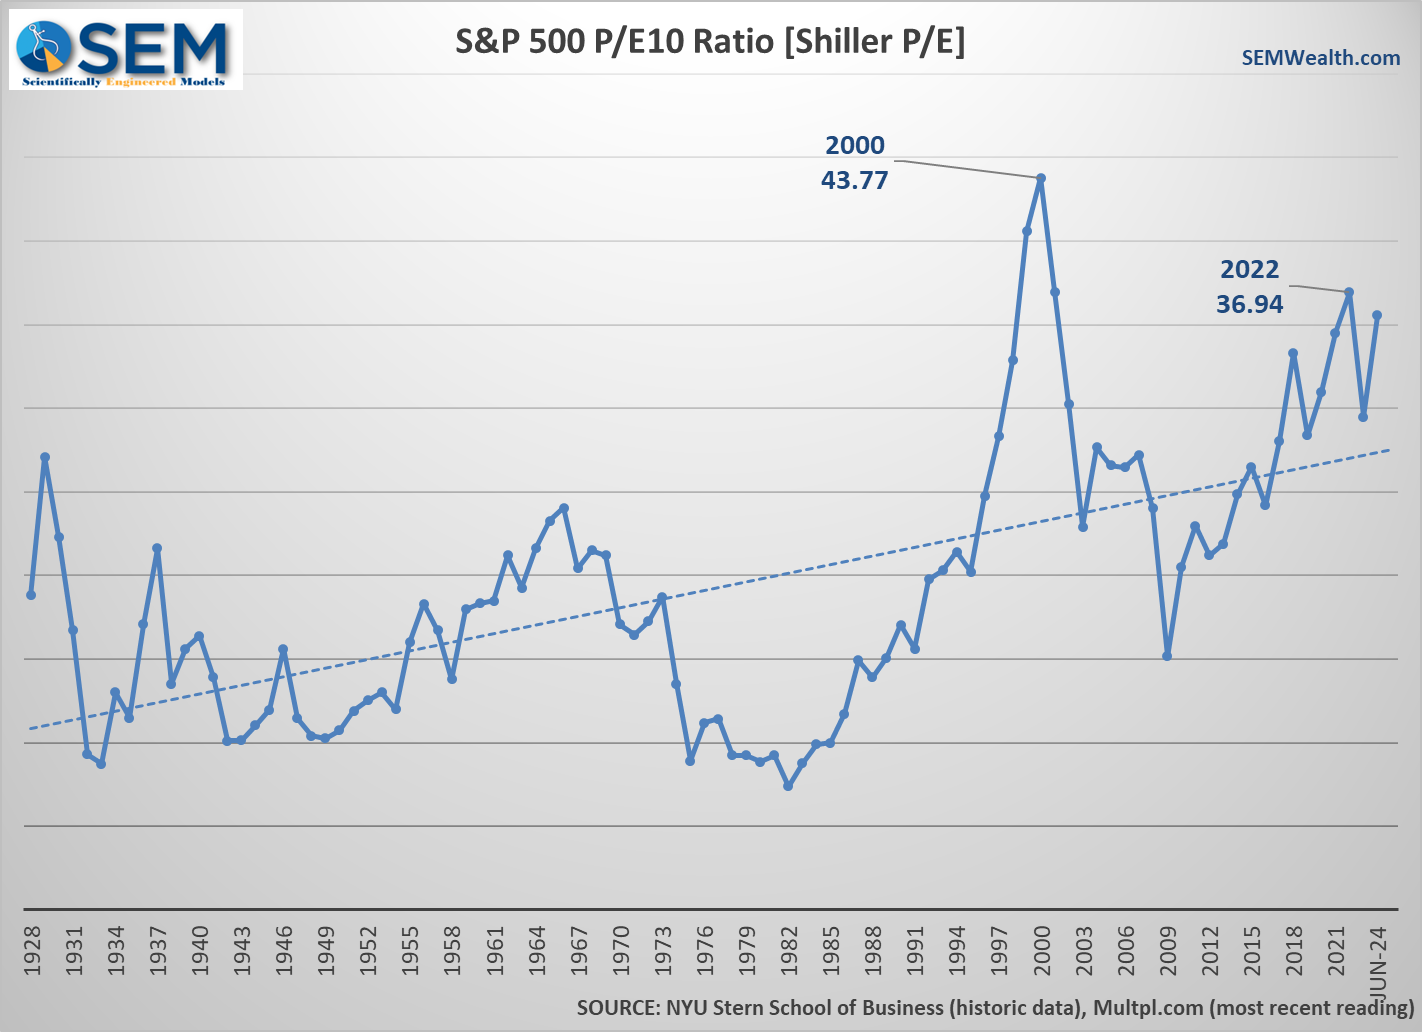
The problem with P/E is the E portion of the ratio. Earnings can fluctuate greatly, especially at market turning points. Near the bottom of a recession, earnings are quite low, which makes the P/E quite high. Near the end of an economic expansion, earnings are at their cyclical highs, making the P/E seem reasonable.
Here is a chart of the P/E ratio showing the P/E. Notice the 'high' P/E right at the END of the recession.
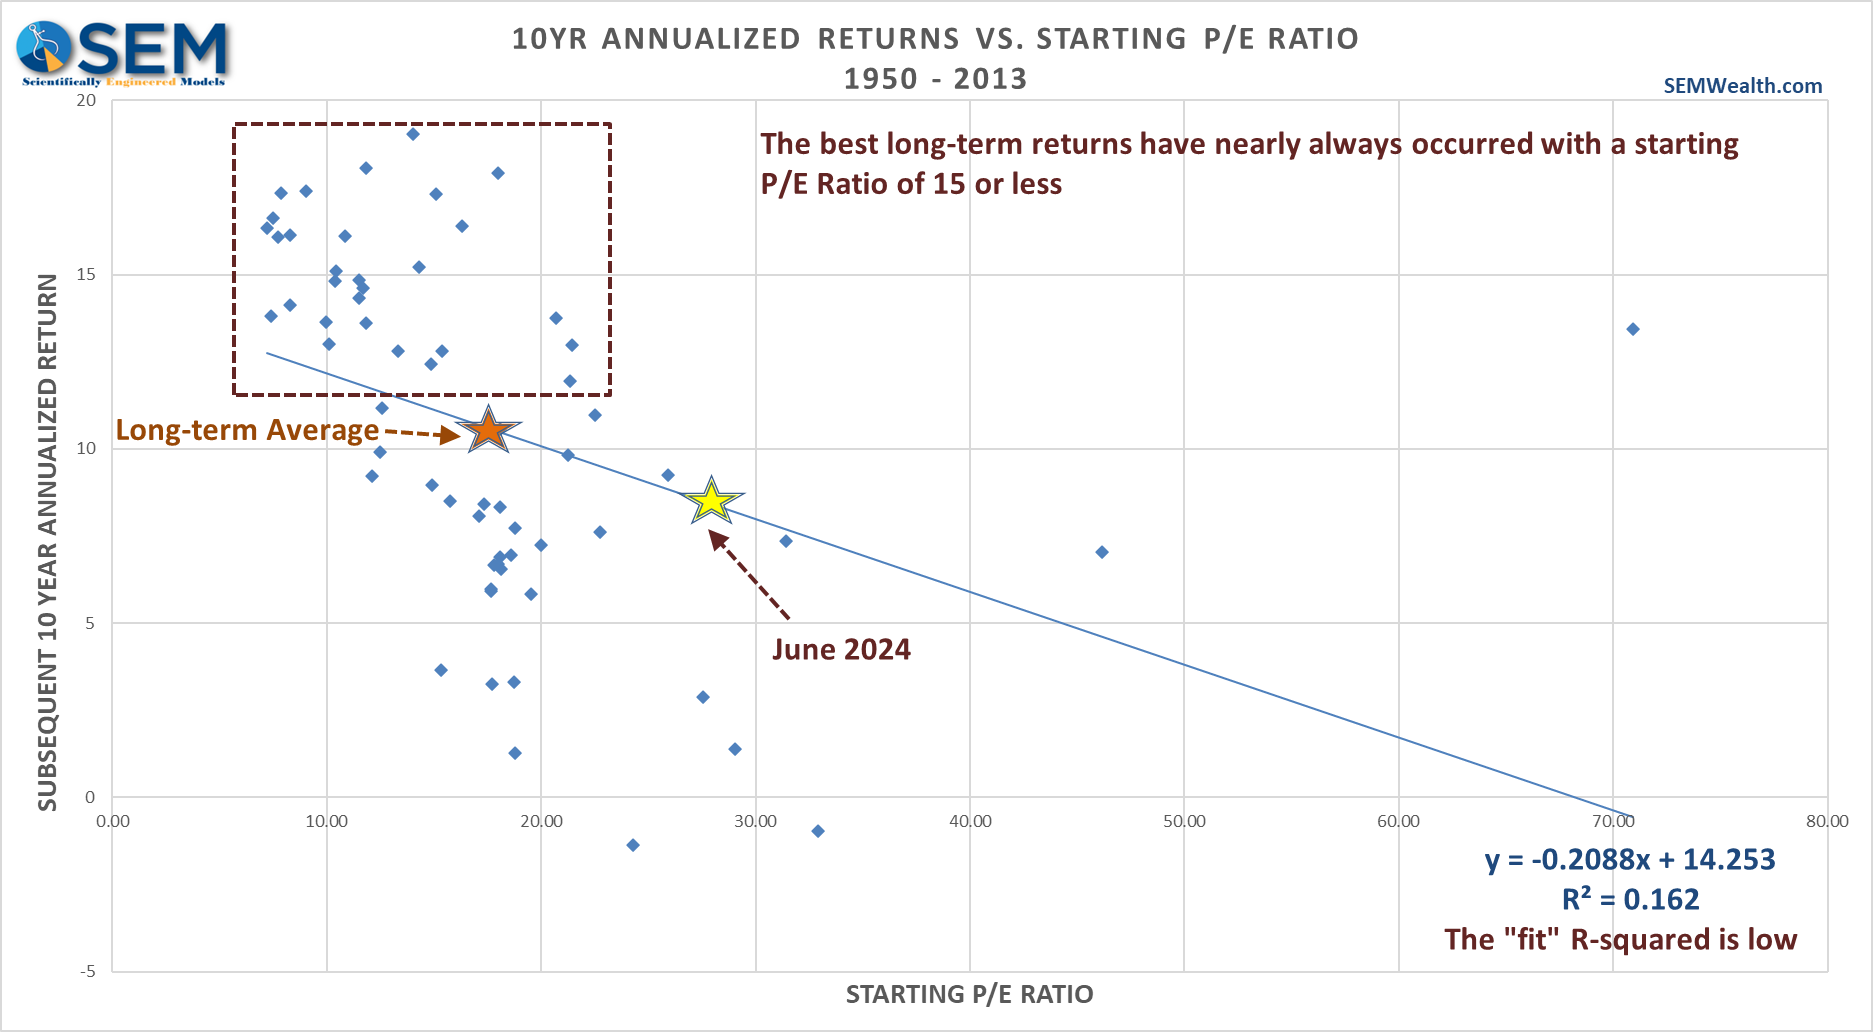
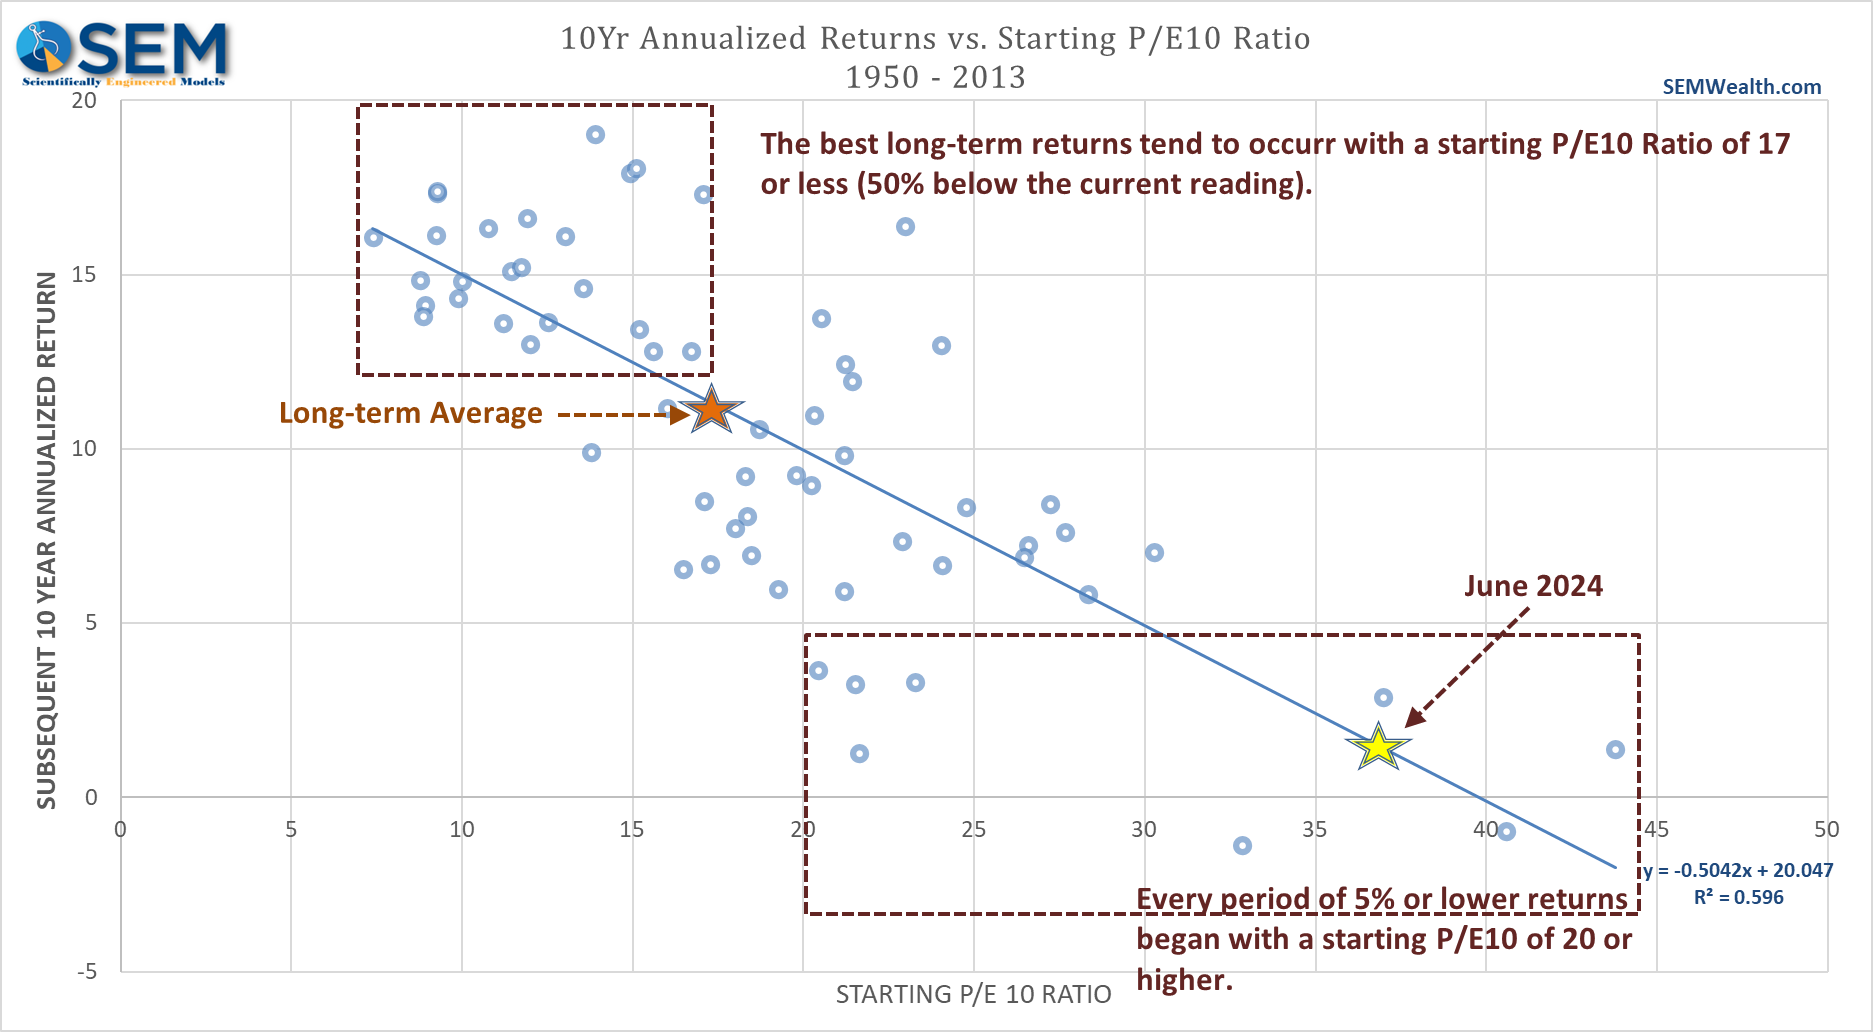
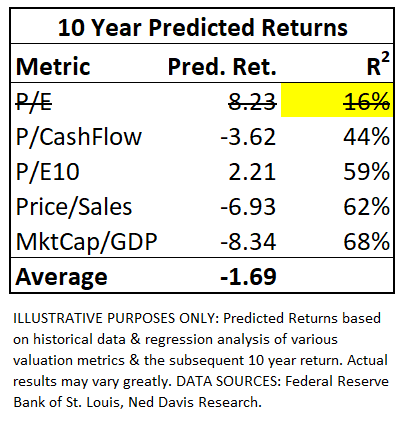
If you study the long-term history of the market, the highest 10-year returns have occurred when the starting valuations are BELOW AVERAGE. Studies have shown this is true. By looking at the data we can see which valuation metrics have historically been the best in predicting long-term returns. Today we'll walk through some charts which show how well those measurements predict the future returns. On these charts, focus on the R-Squared which shows the 'fit' to the modeled line. 1.0 would be a perfect fit with every data point fitting on the line. Therefore, the higher the R-Squared the better the measurement is at predicting the returns for the market.
An R-Squared of 16 for P/E tells us it is not a good tool for predicting long-term returns. Even with this poor fit, the P/E ratio is telling us we should expect BELOW AVERAGE returns for the next 10 years.
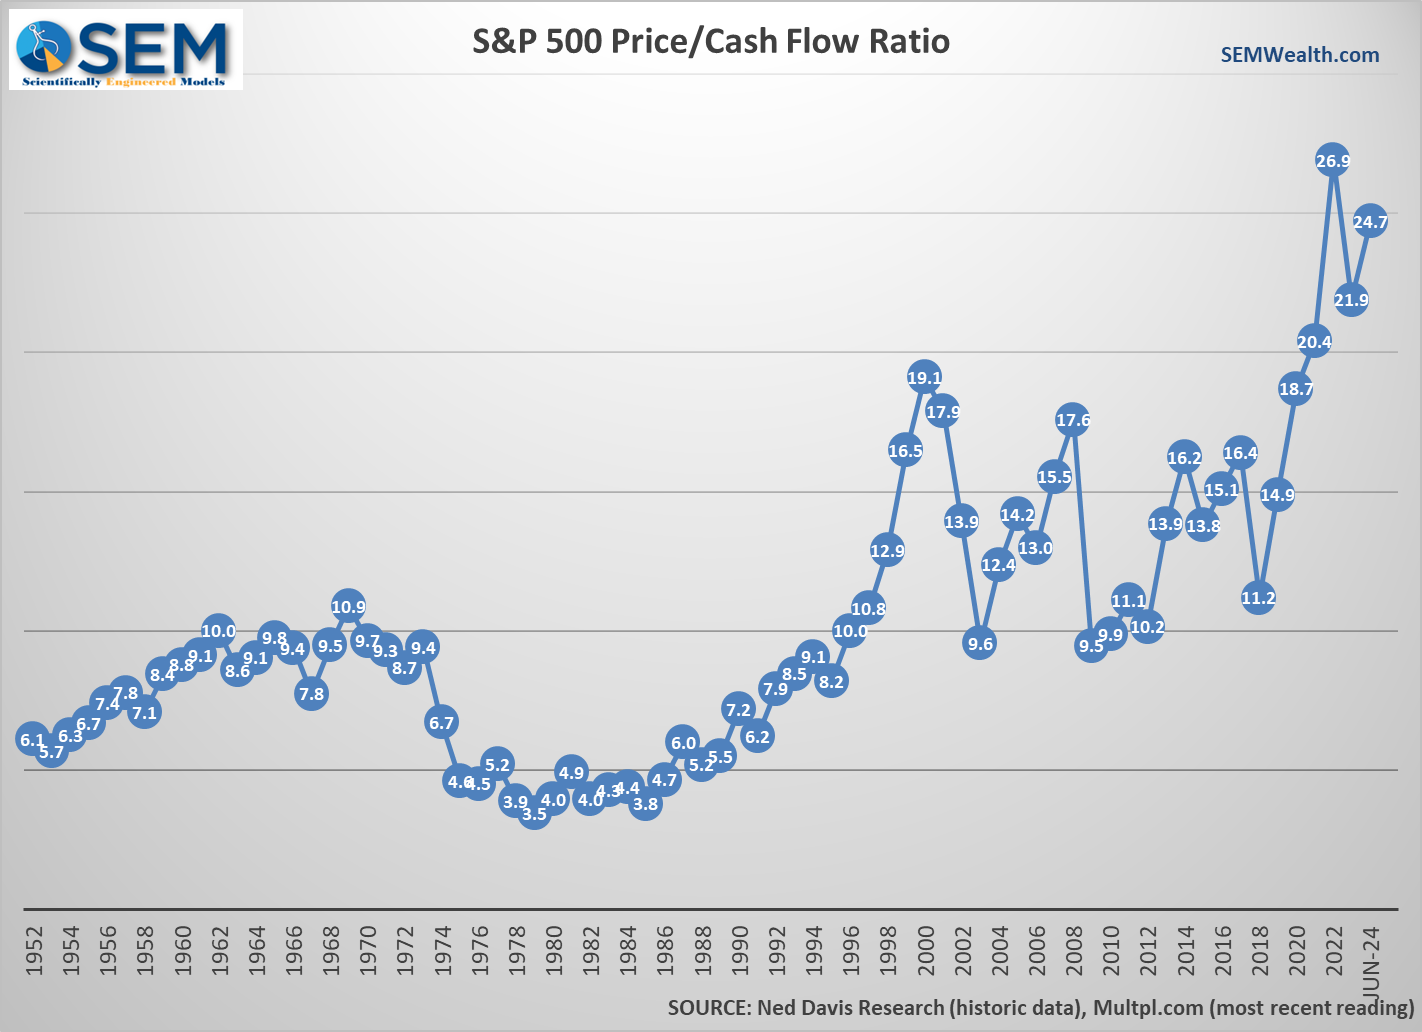
A better measurement and one as an accountant I prefer is the Price/Cash Flow (P/CF) ratio. I like this because unlike earnings, it is much more difficult to manipulate cash flow to look better on paper each quarter. Sure there are tricks and delay tactics, but a good company will see strong cash flow growth and a weak company will have softening cash flows.
We are quickly approaching the January 2022 peak. Since COVID we can also see the bubble all that stimulus money created for the stock market, which has led to the P/CF ratio breaking out of a 20-year range.
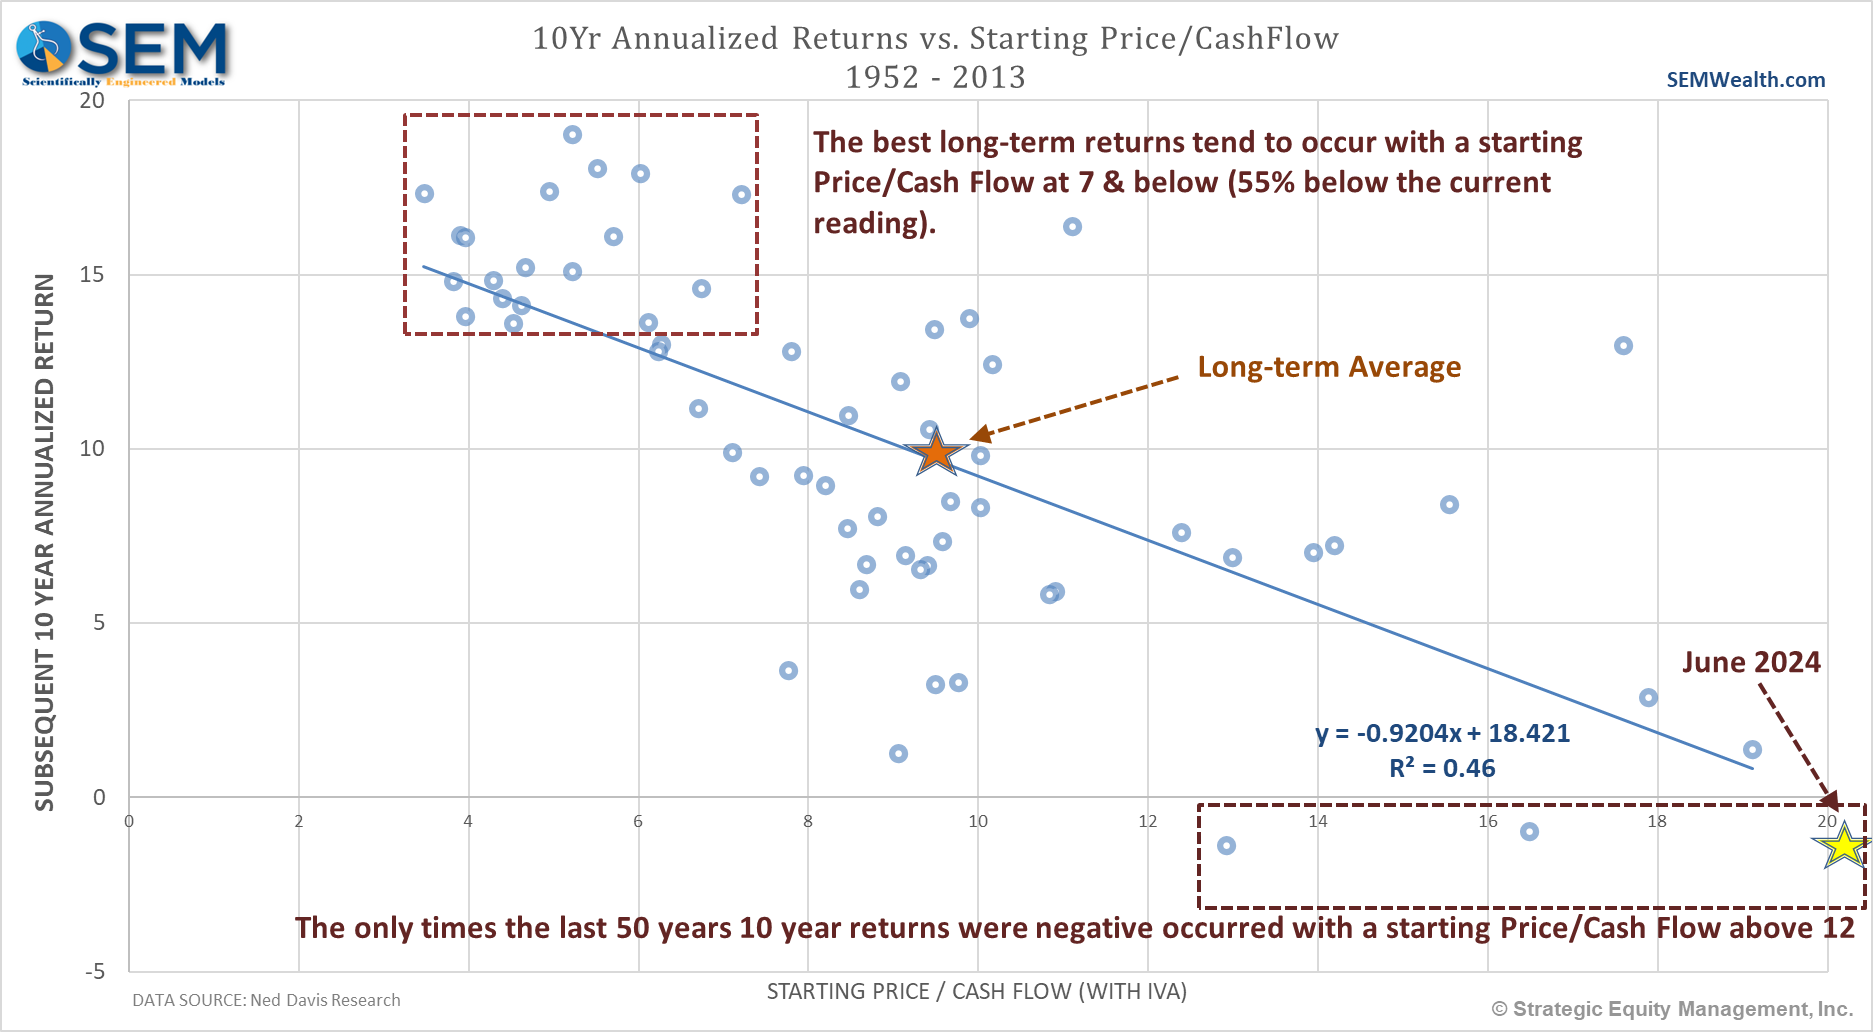
The 'fit' for P/CF is 46%. With the P/CF ratio so high, the model is predicting NEGATIVE returns over the next 10 years.
Going back to the P/E ratio, Dr. Robert Shiller in the 1990s sought a way to remove the big fluctuations in earnings to generate a more useful P/E ratio. His "Cyclically Adjusted Price Earnings Ratio" (CAPE) essentially smooths earnings out over the last 10 years. This measurement has gained popularity over the last 10 years in the value investing crowd. It is sometimes listed as the PE/10 as a reminder that the "E" is a smoothed 10-year average.
Like the other valuation metrics, we are at clearly high levels.
The "fit" for this model in predicting long-term returns is 60%. The current P/E10 tells us we should expect minimal returns for stocks over the next 10 years.
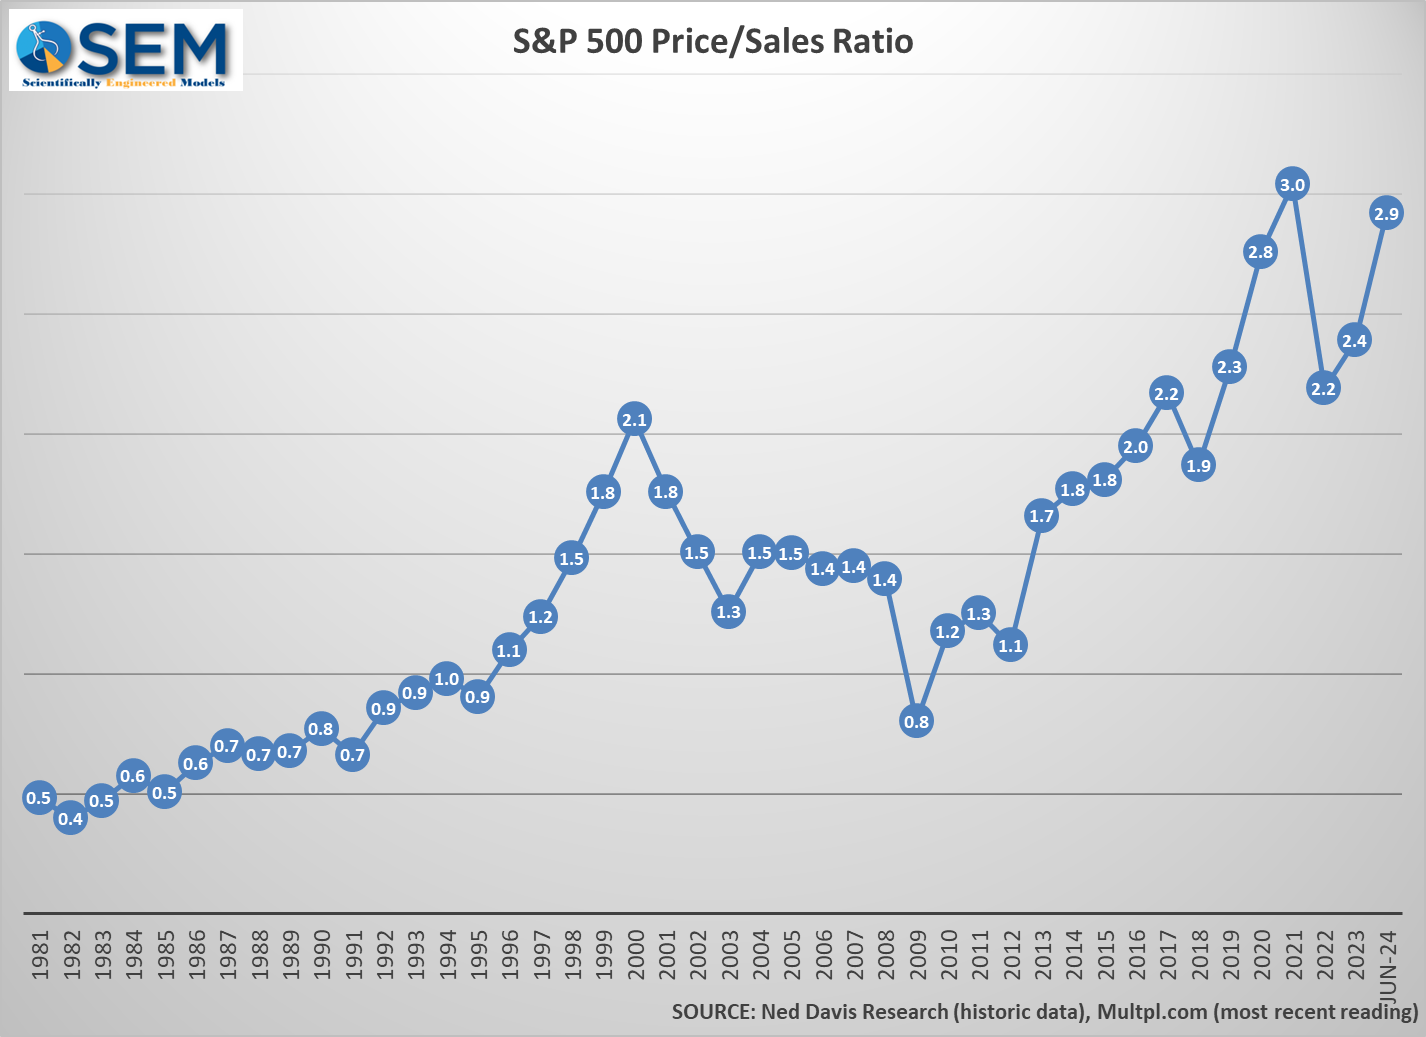
Turning back to my accounting roots, another measurement that is more difficult to manipulate is revenue (sales). The Price/Sales measurement gained popularity in the 1990s as a way to compare stocks because so many companies back then were not making money, did not have a 10 year history, AND had negative cash flow, making the prior measurements useless. Back then I thought we'd never see Price/Sales (P/S) ratios as high as they were at the time. Of course back then I never thought I'd see the Fed pump so much money into the financial system to 'save' itself from recession, but that's what the did post financial crisis and again during and after the pandemic.
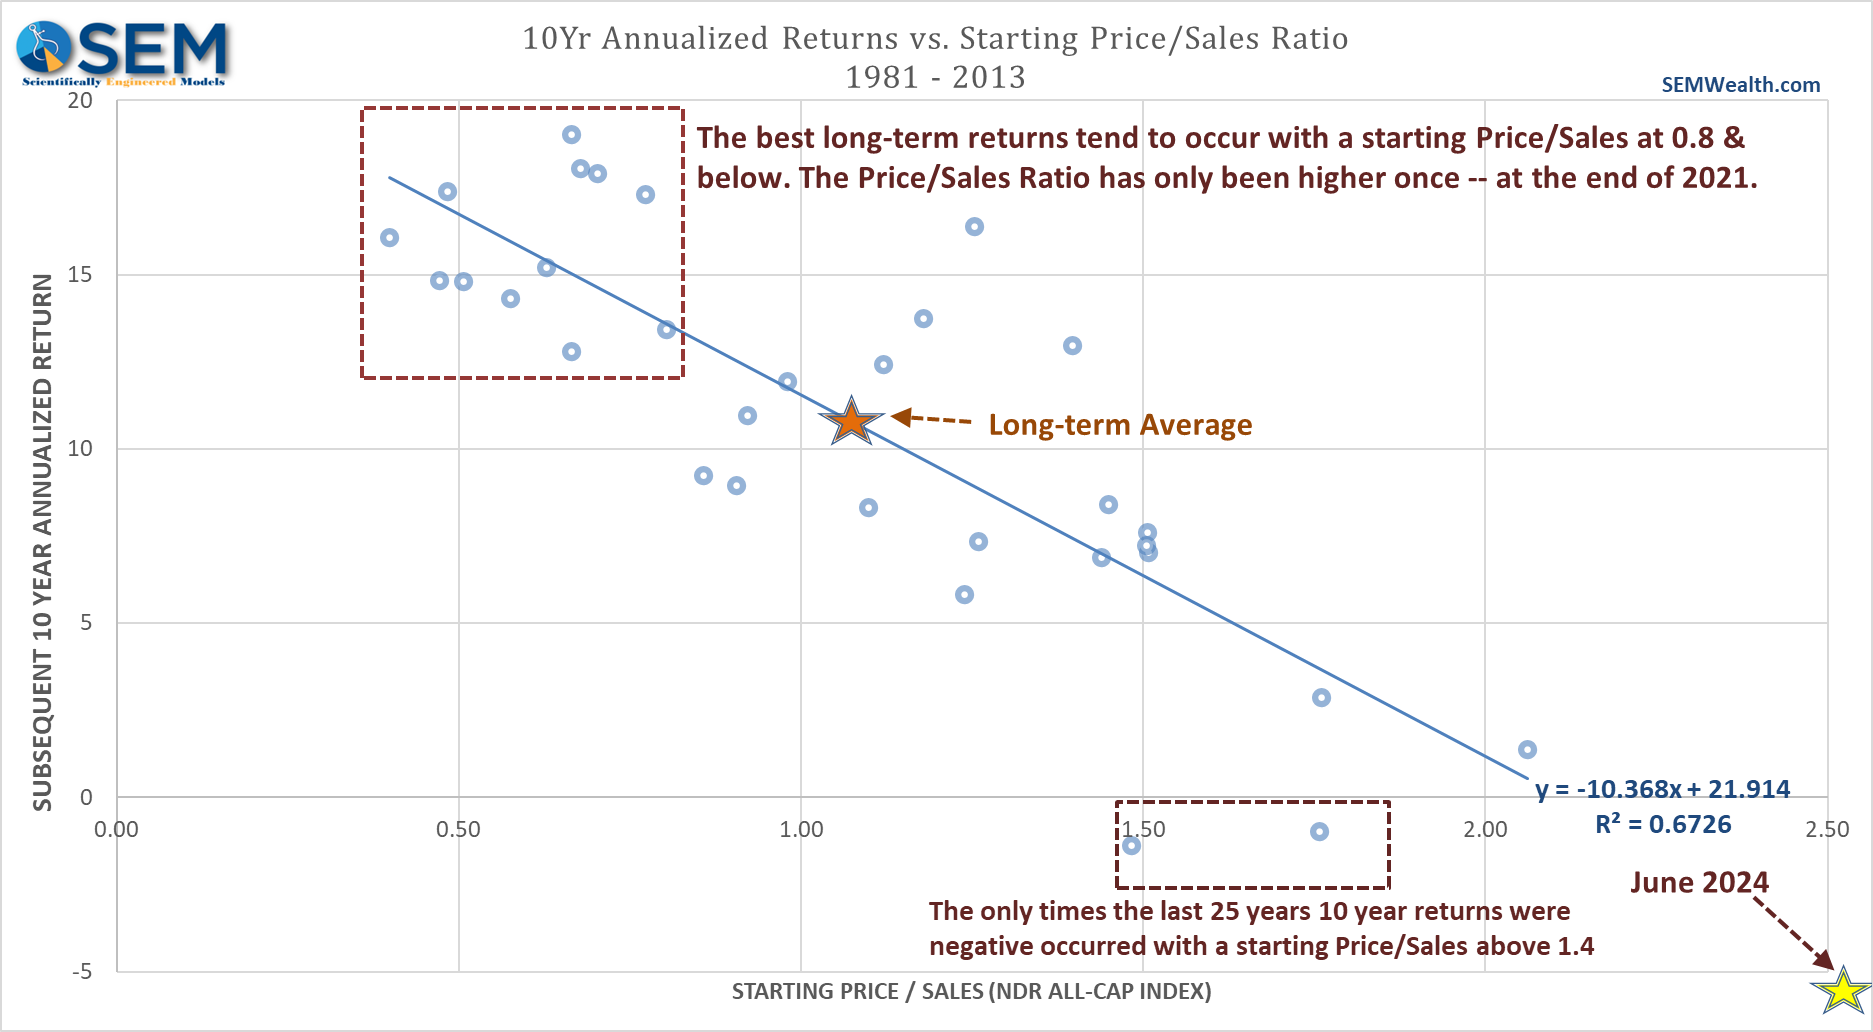
The "fit" for P/S is much higher than any other measurement. The current values are literally off the chart (because we've never had a P/S ratio this high prior to 2013.) The model, which has a 67% 'fit' is predicting deeply negative returns for the next 10-years.
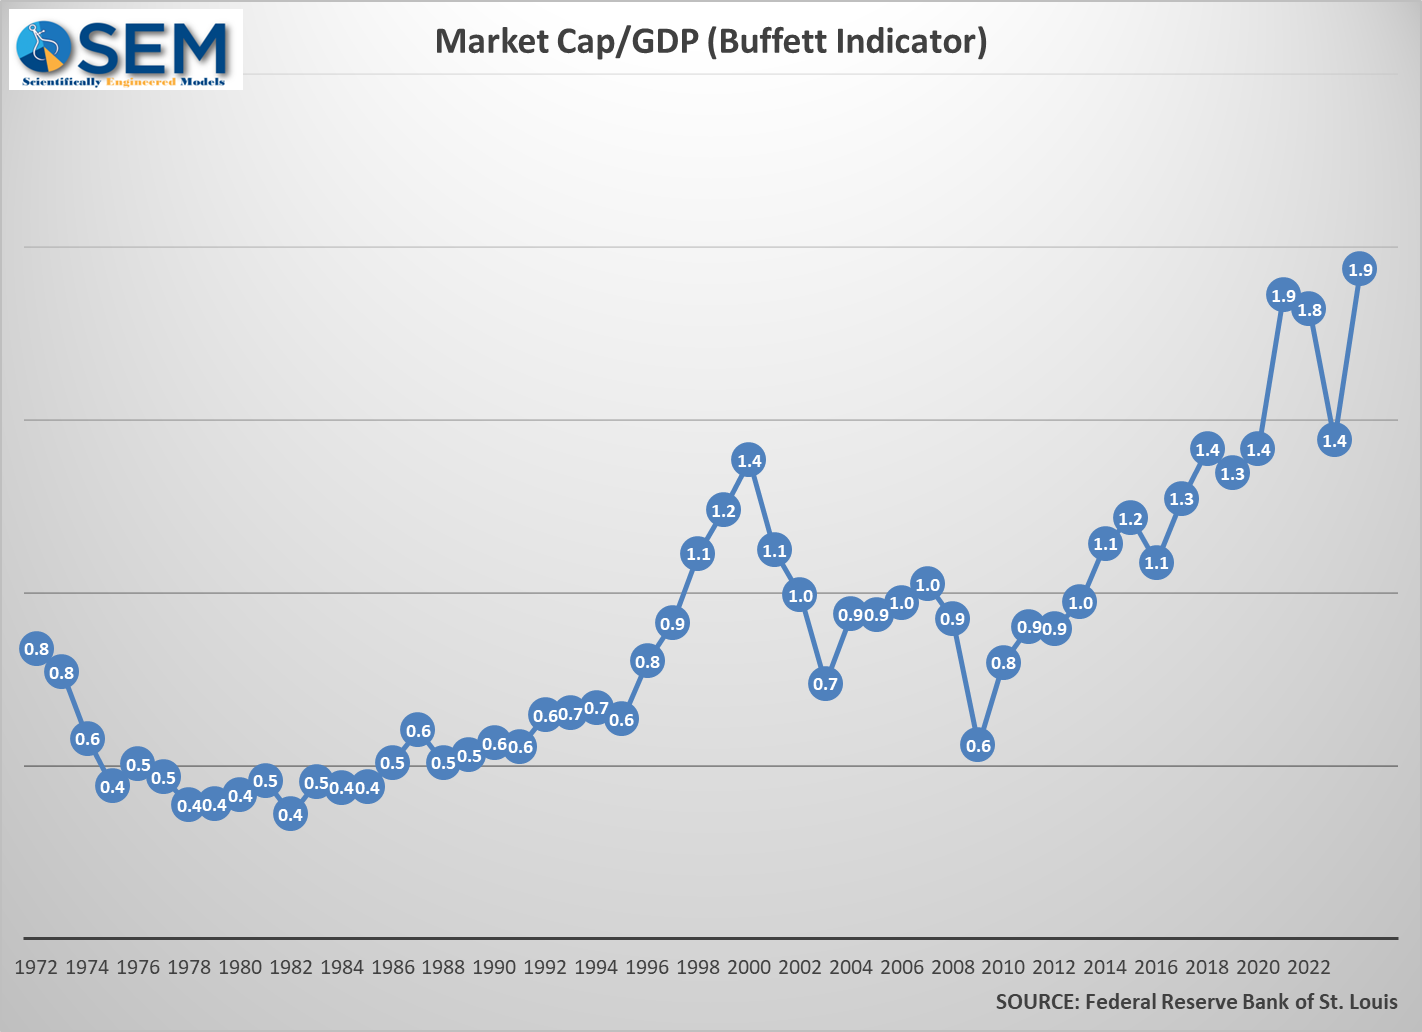
The final measurement I studied was the "Buffett Indicator". Back in the early 2000s Warren Buffett was asked what the single best indicator of market valuation was. He answered, "the Market Capitalization to GDP ratio." He went on to explain how mathematically it is impossible for the stock market to continuously be worth more than the underlying economy. Constantly high valuations will lead to lower returns, which will dry up the appetite for investment and thus cause the stock market to lose value down to a level which will attract investors again.
With that the "Buffett Indicator" was born. Like the other valuation metrics, this one moved higher in the post-financial crisis bubble and then broke out of its range as the Fed and Congress poured even more money into the economy.
The "fit" for this model is an astounding 86% (what else would you expect if Warren Buffett is using it.) Like P/S the Buffett Indicator is off the charts and predicting deeply negative returns.
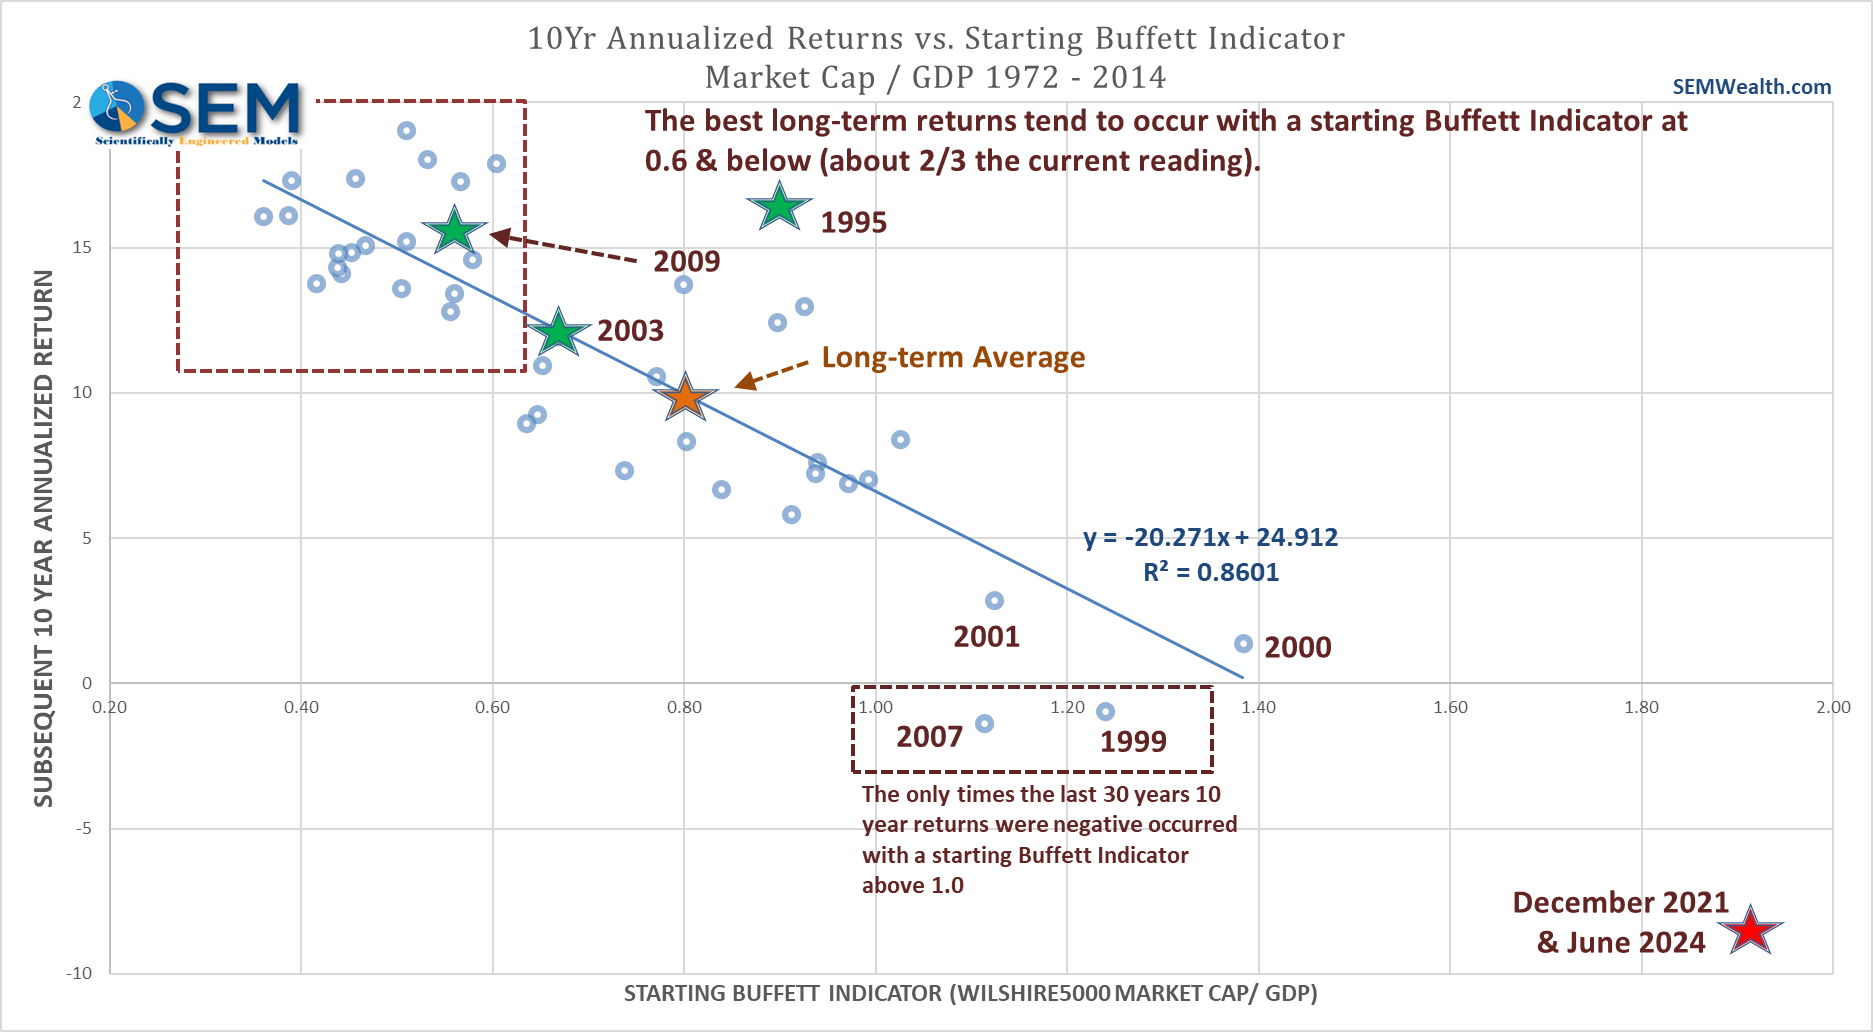
While some may thing the "Oracle of Omaha" is washed up, it's hard to argue about his long-term track record (including 'missing' the end of the tech bubble.)
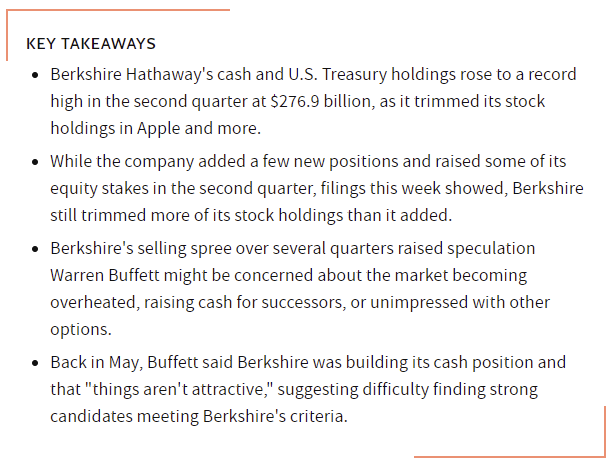
His company, Berkshire Hathaway has amassed a record amount of cash as it has sold stock throughout 2024.
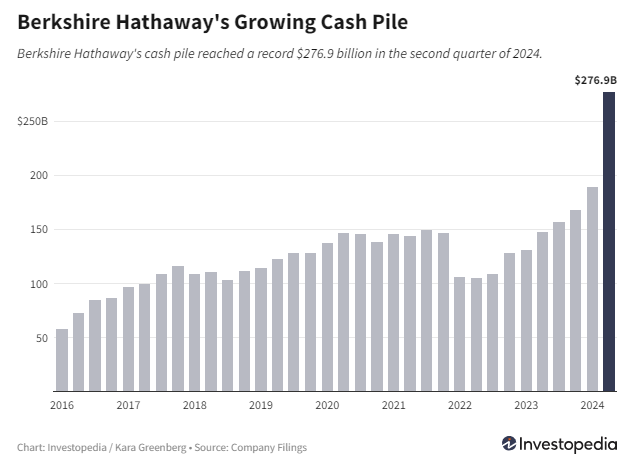
Unlike others, Buffett isn't buying high hoping to sell even higher.
Valuation measurements are not a good "timing" mechanism, but they are good in setting expectations for future returns, which SHOULD help you manage your appetite for risk. Right now, these valuation metrics are saying at a minimum we should expect BELOW AVERAGE (if not negative) returns over the next 10 years.
What does this mean for investors? Stay tuned for Part 3 next week.
Market Charts
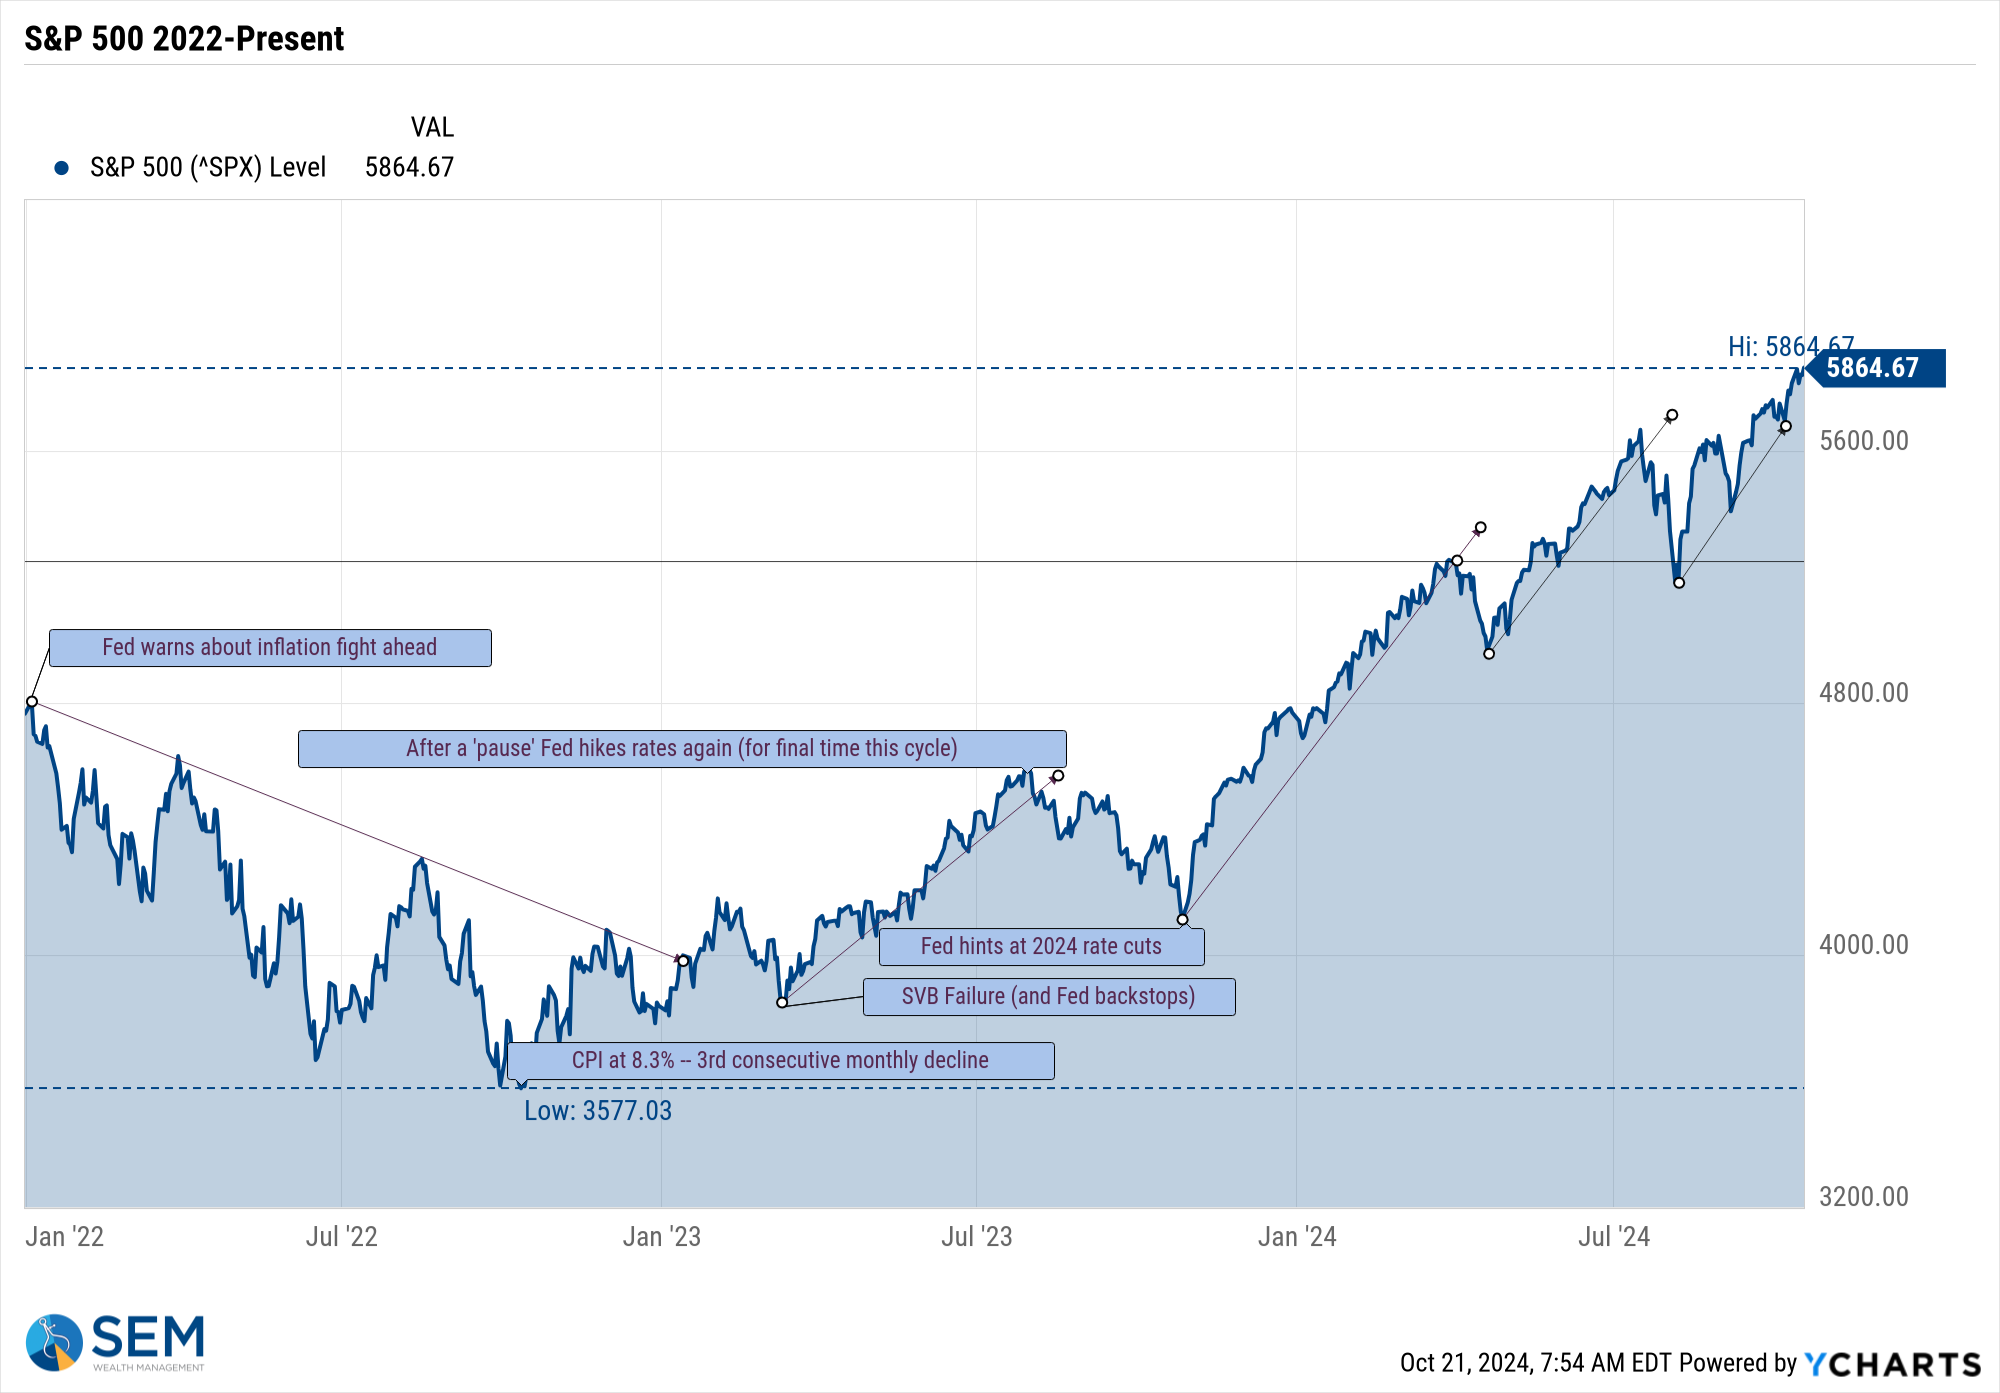
Despite near record high valuations, I'm not pessimistic over the SHORT-TERM. Studying the data tells us what I've been saying all year – higher highs lead to higher highs – until something significant comes along to change it. Until that happens, the most likely direction is UP.
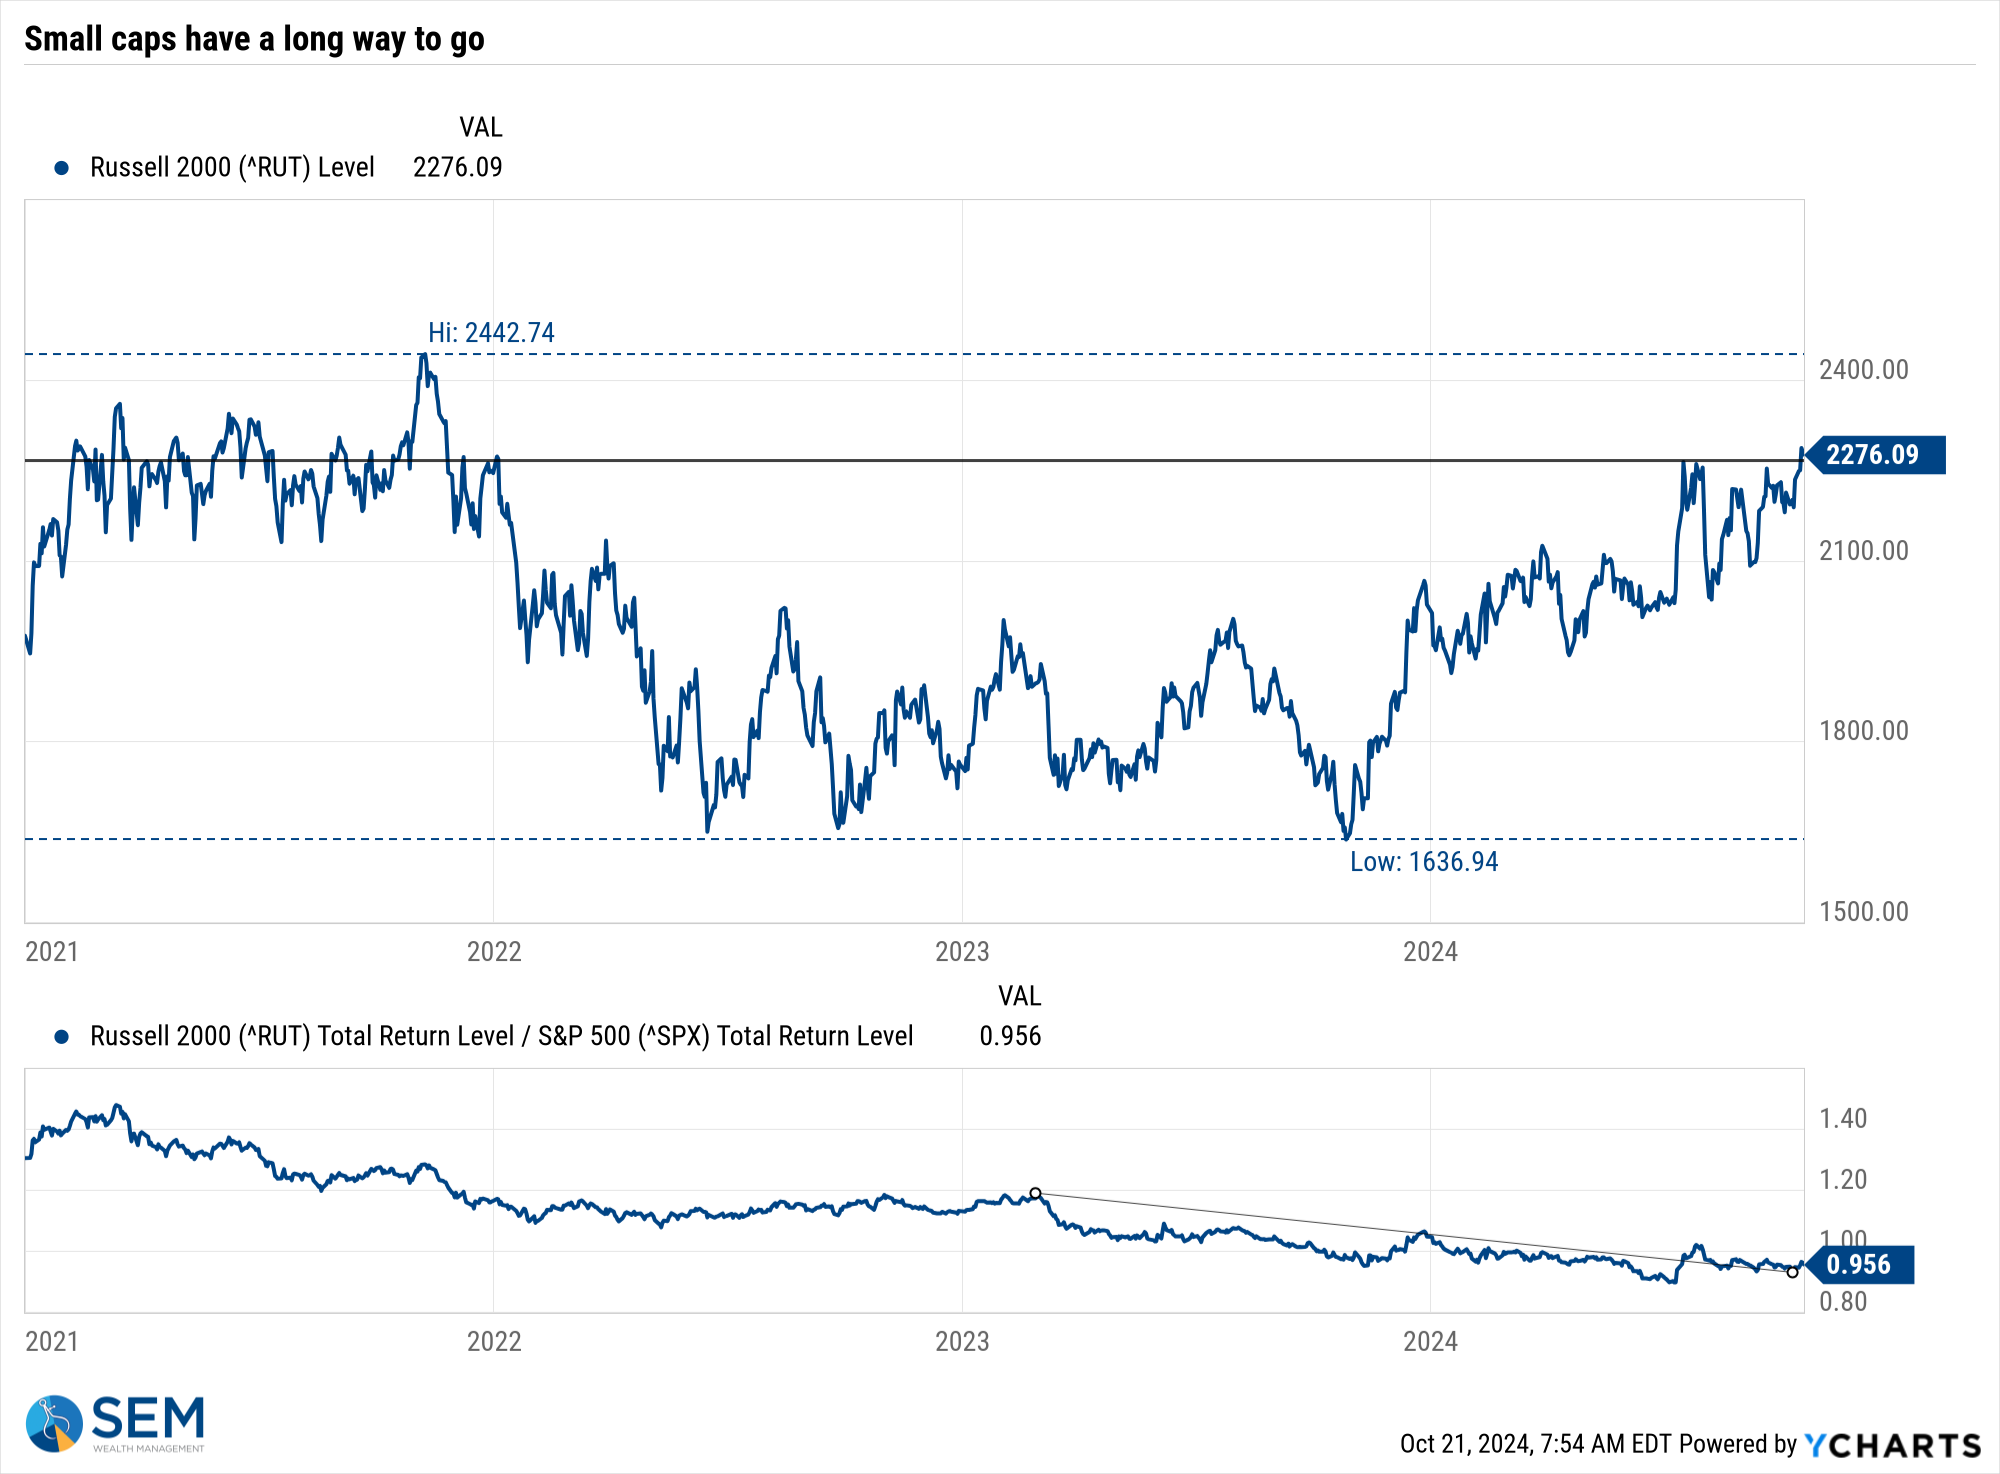
Last week we also saw an encouraging sign – small caps picked up some momentum. If the economy is truly healthy, we need small caps to start leading the charge.
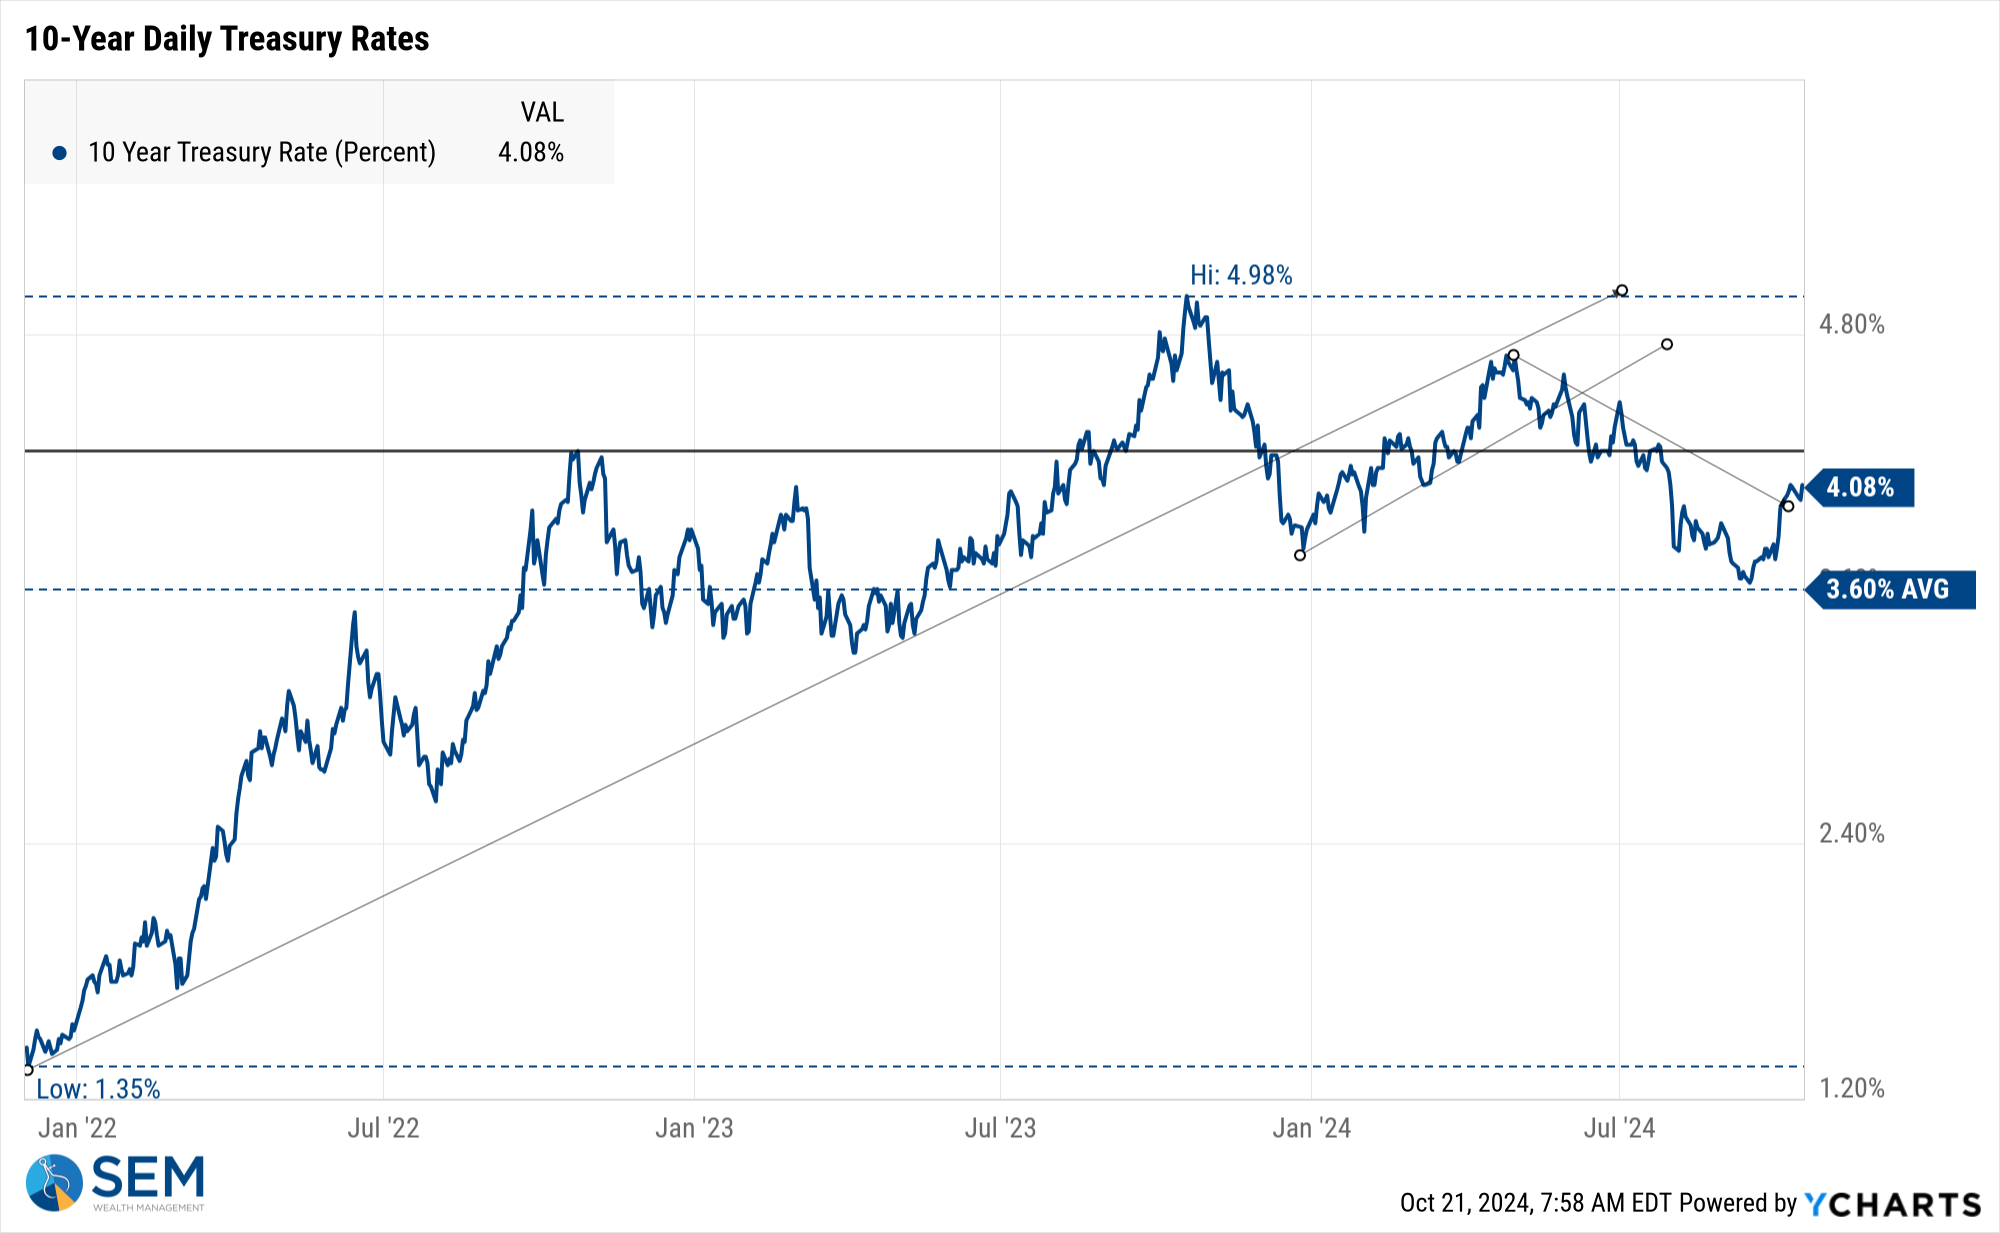
The problem we continue to have is the disconnect in the bond market. Longer-term bond yields have been moving higher since the Fed CUT rates. This INCREASES borrowing costs.
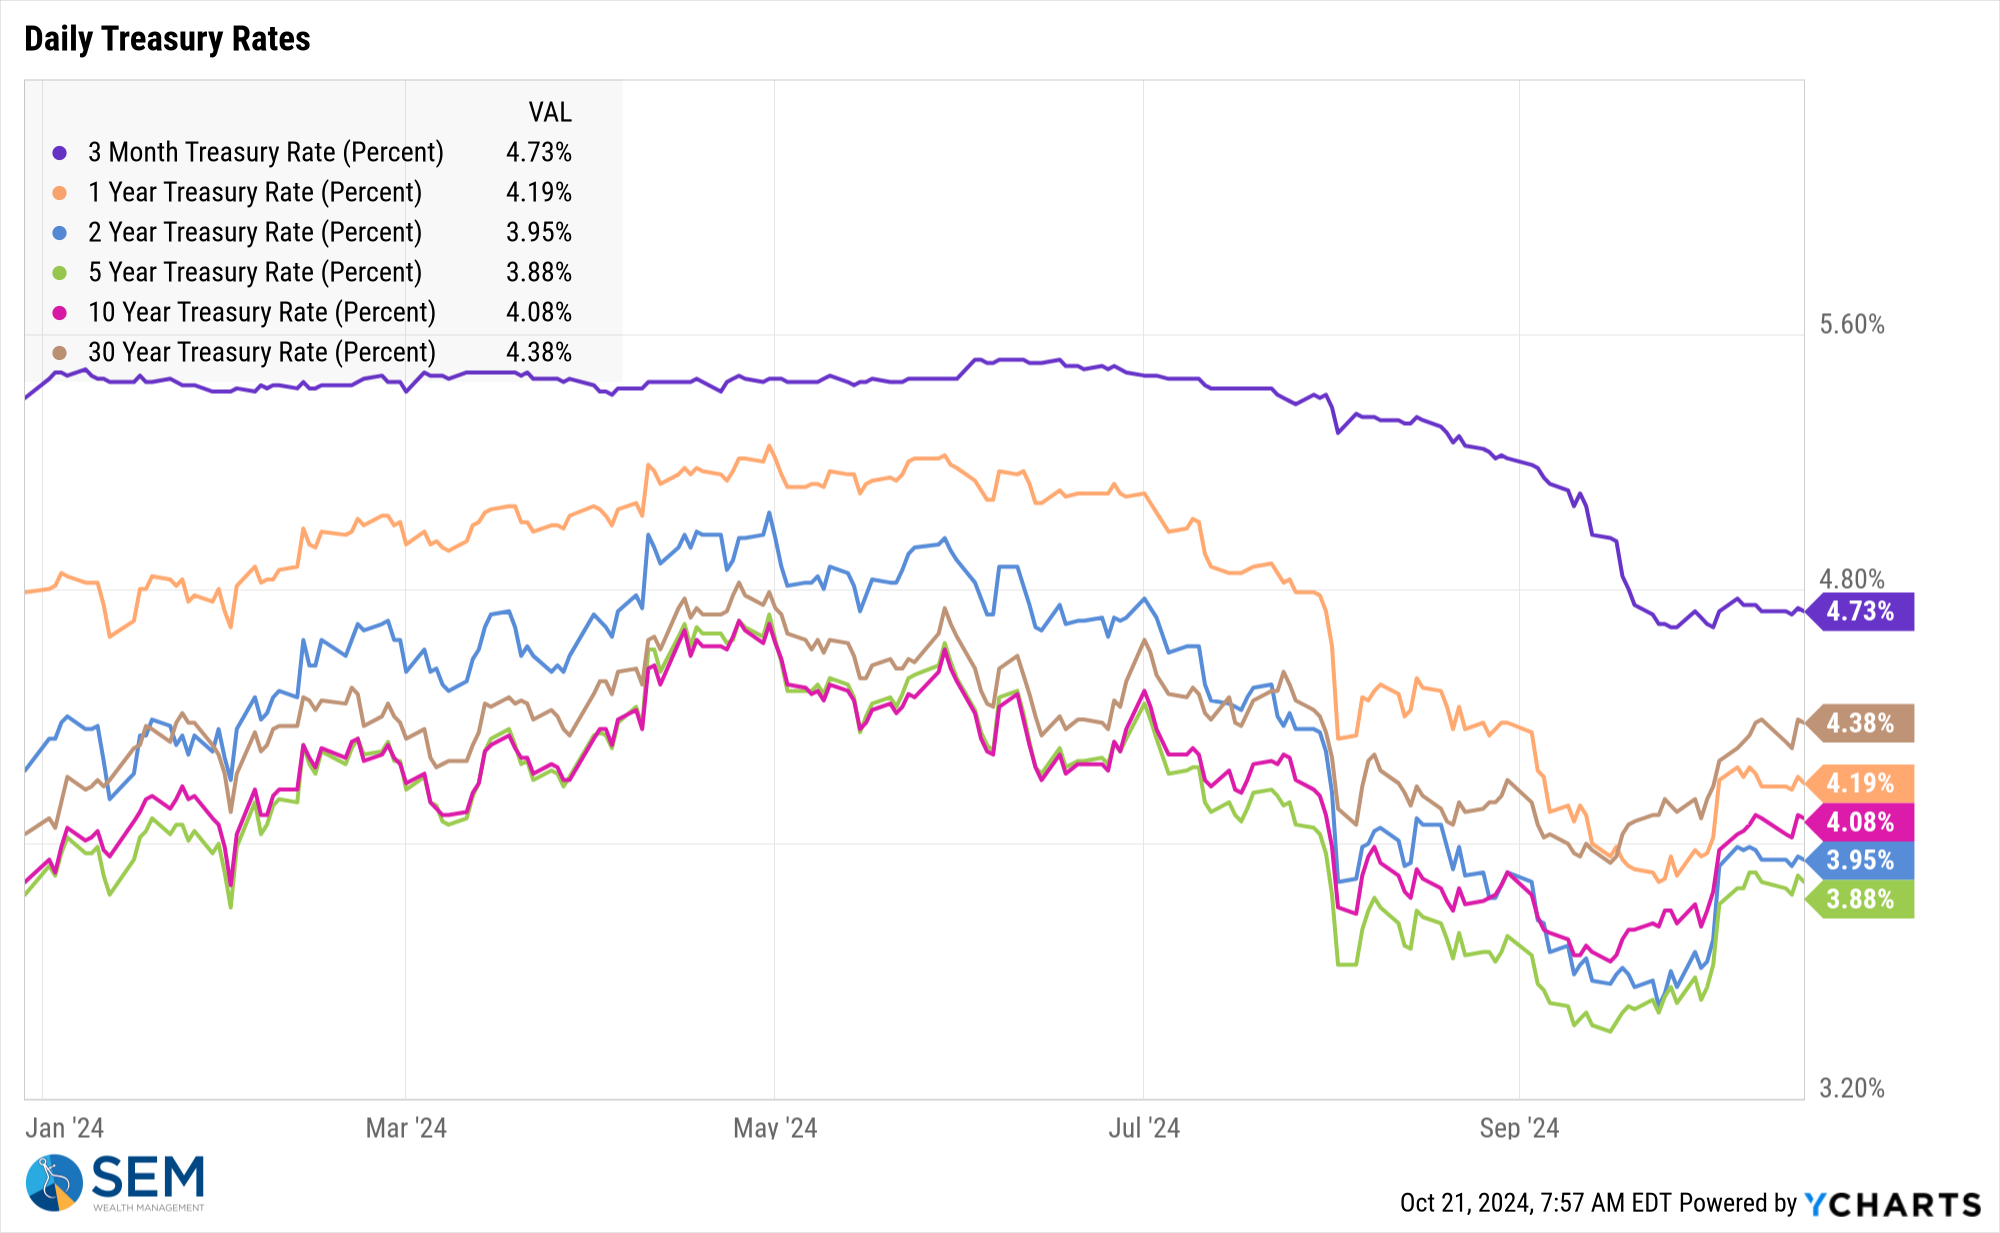
The bond market is telling us inflation is still a problem, which could turn into a problem for the stock market (eventually).
Something we are watching closely is the "spread" in the bond market between corporate bonds and Treasury bonds. We are approaching ALL-TIME low spreads, meaning investors in these bonds are receiving VERY LITTLE compensation for taking on the credit risk of corporate bonds.
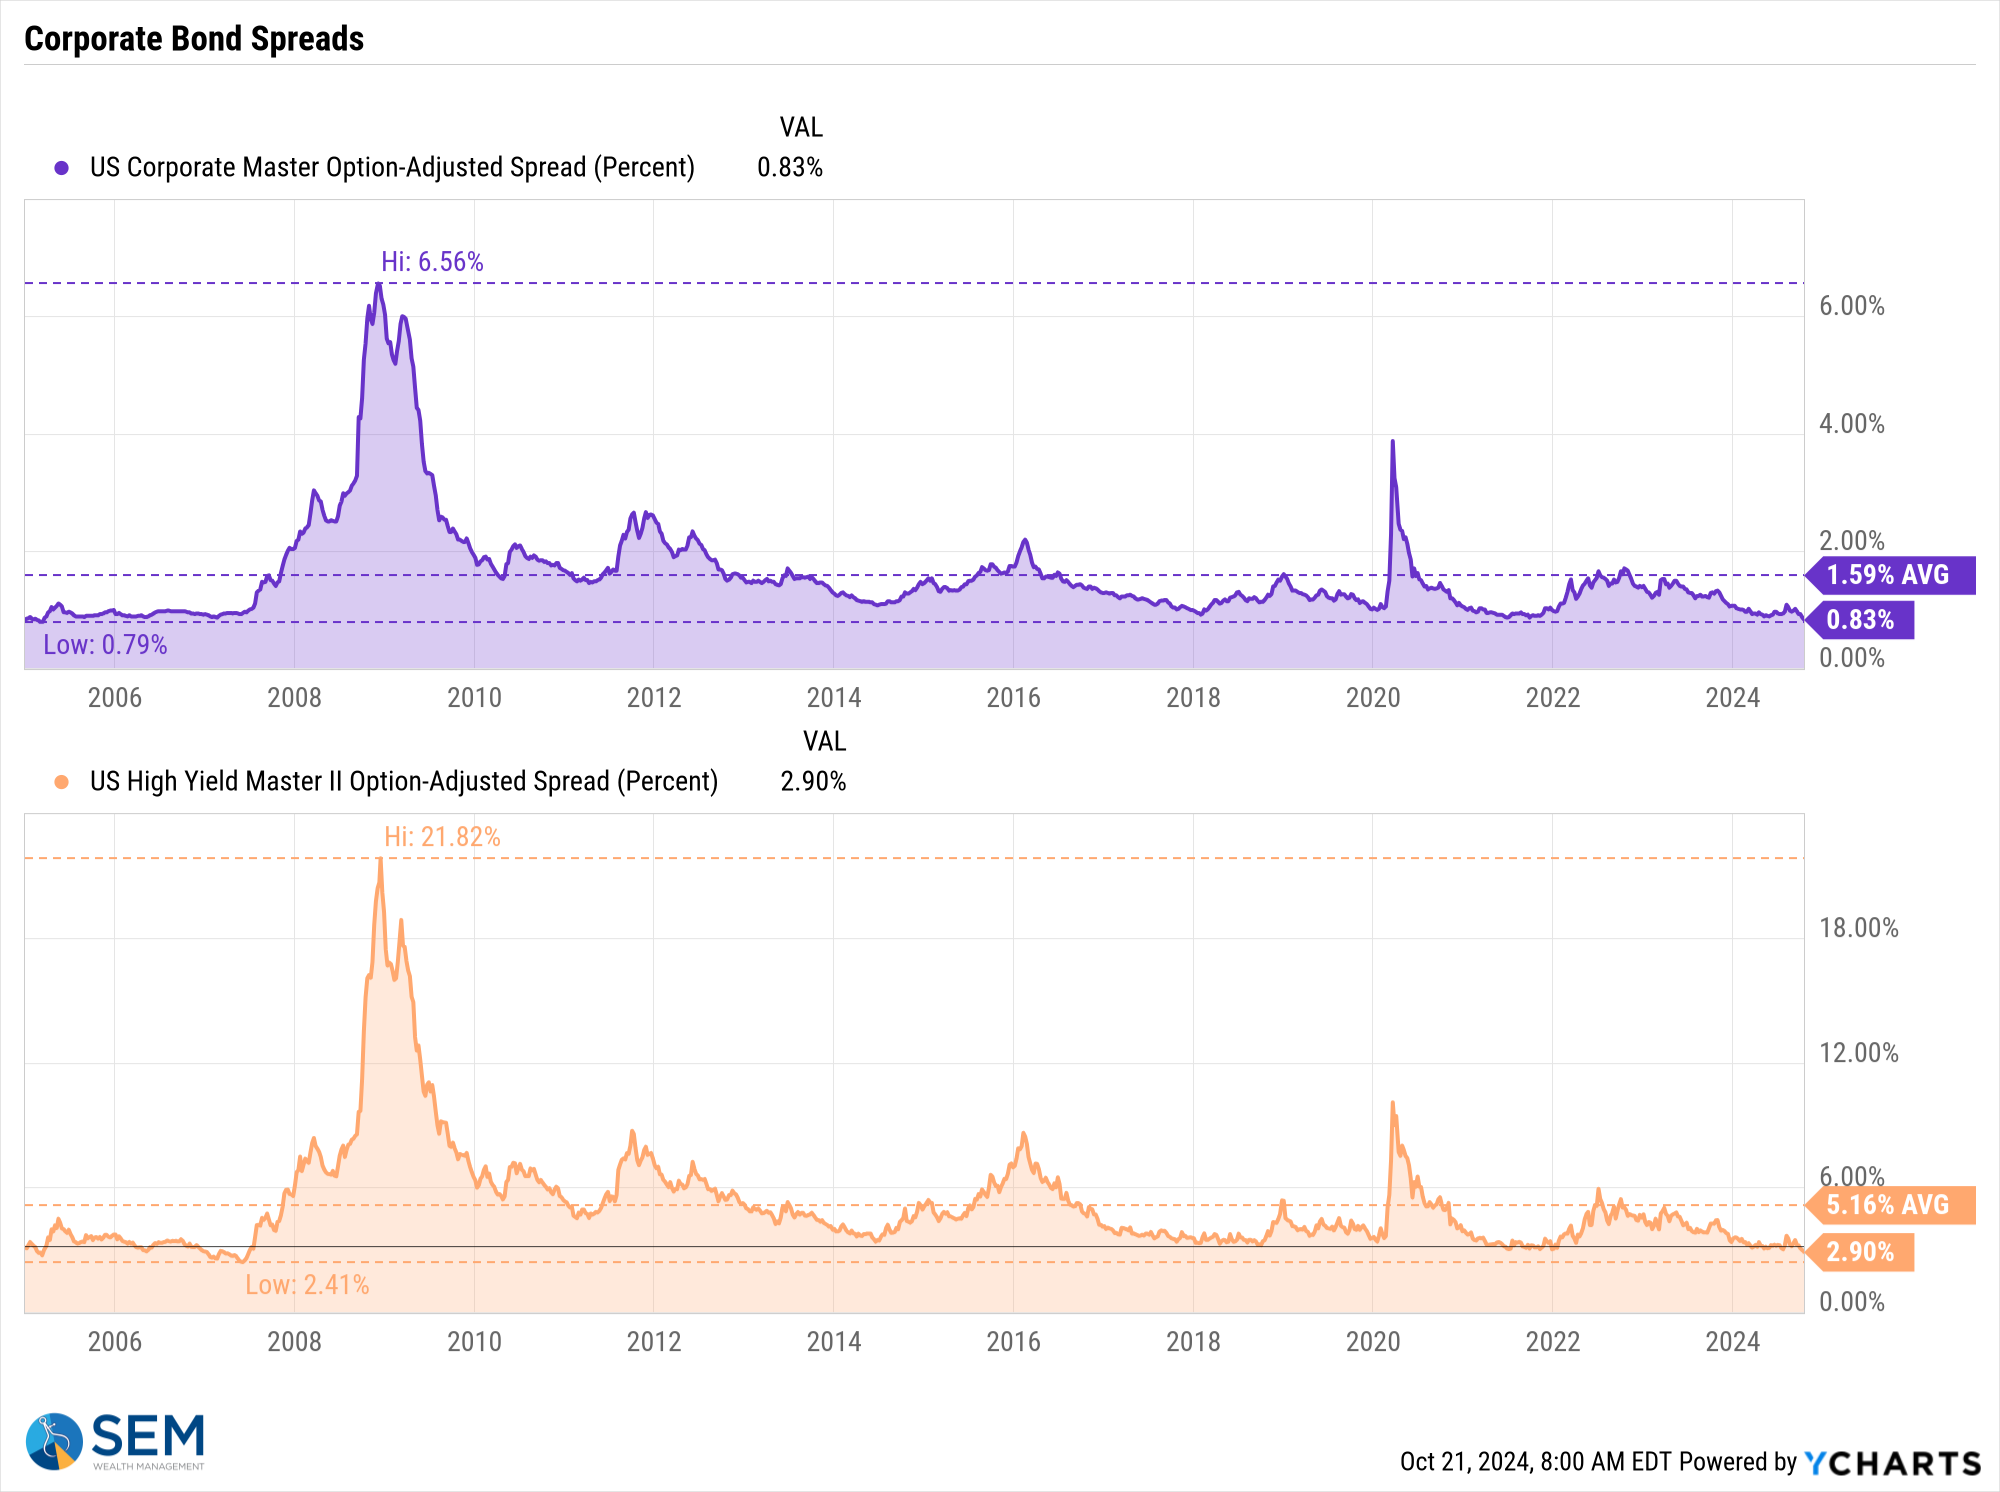
Time will tell if the Fed is somehow able to manage this bubble without causing another big recession/bear market.
SEM Model Positioning
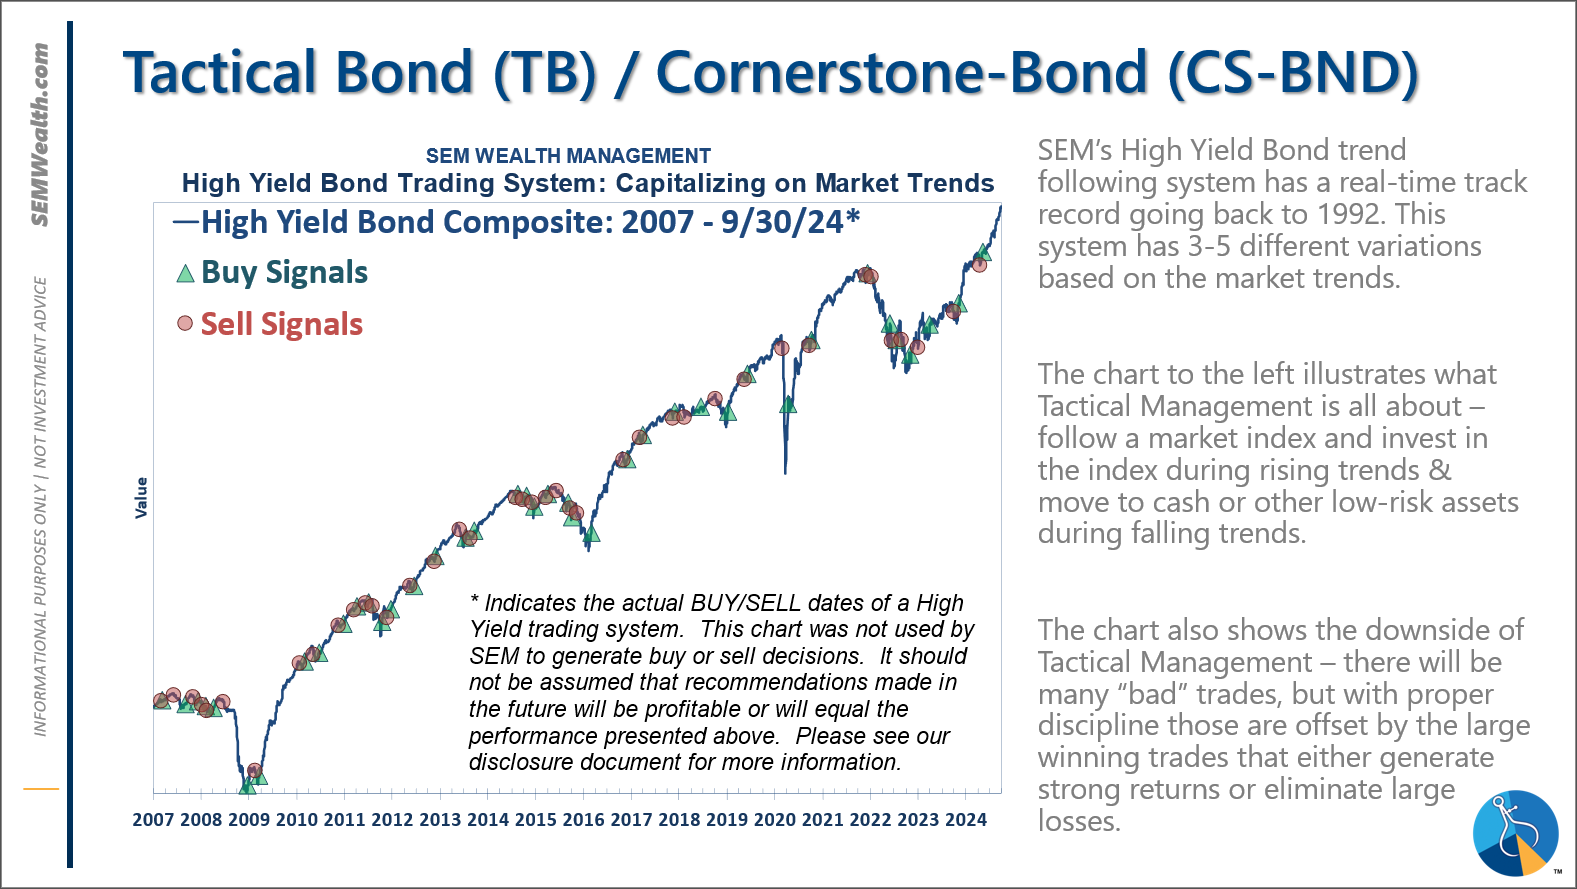
-Tactical High Yield had a partial buy signal on 5/6/24, reversing some of the sells on 4/16 & 17/2024 - the other portion of the signal remains on a sell as high yields continue to oscillate.
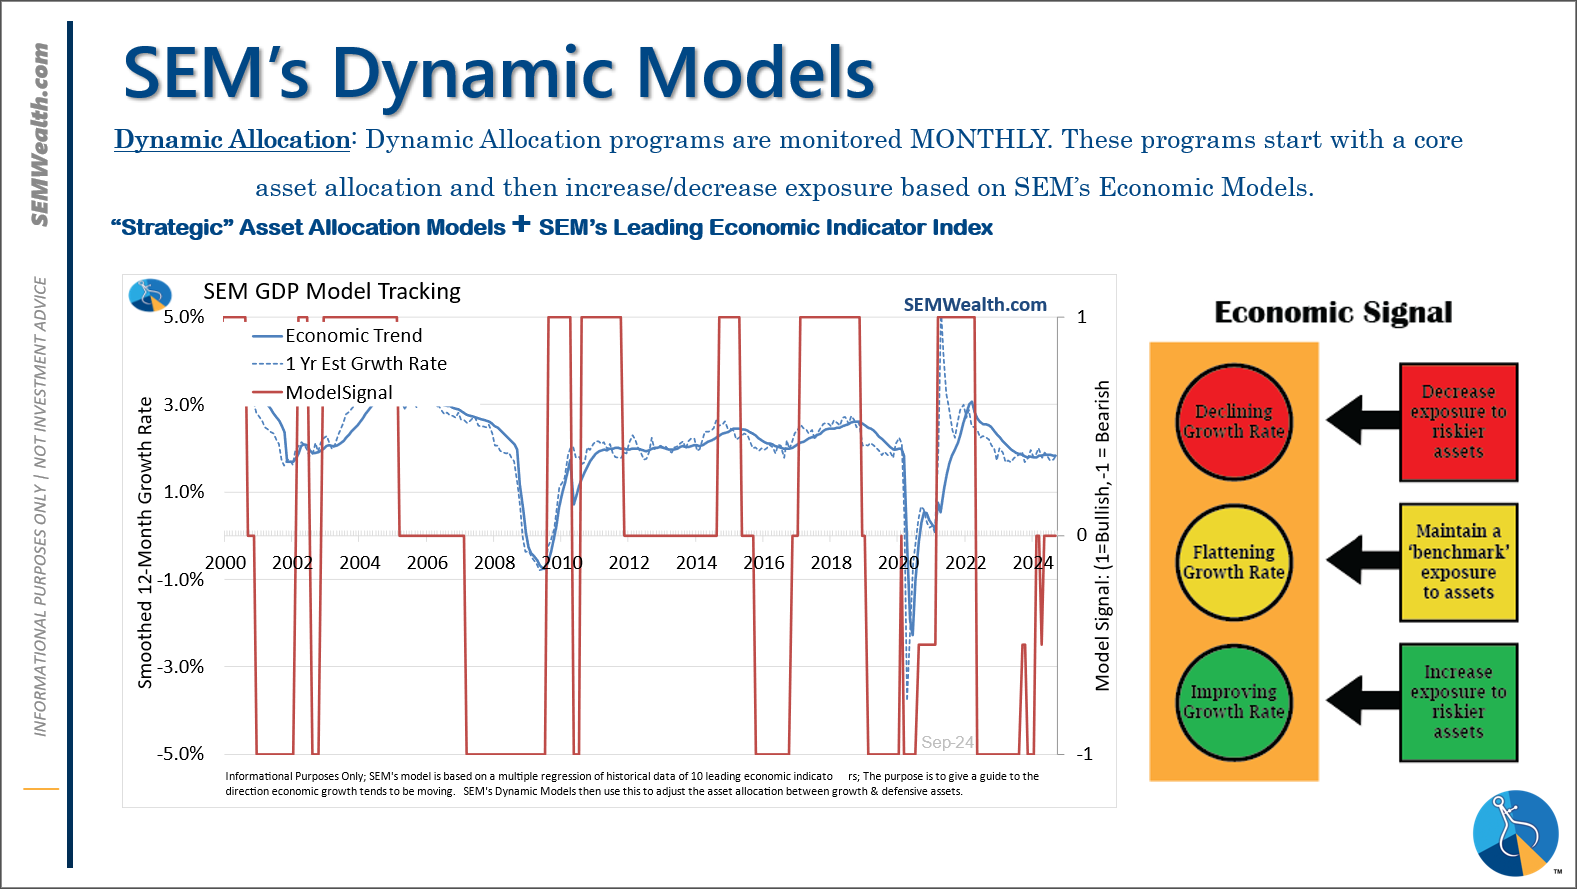
-Dynamic Models are 'neutral' as of 6/7/24, reversing the half 'bearish' signal from 5/3/2024. 7/8/24 - interest rate model flipped from partially bearish to partially bullish (lower long-term rates).
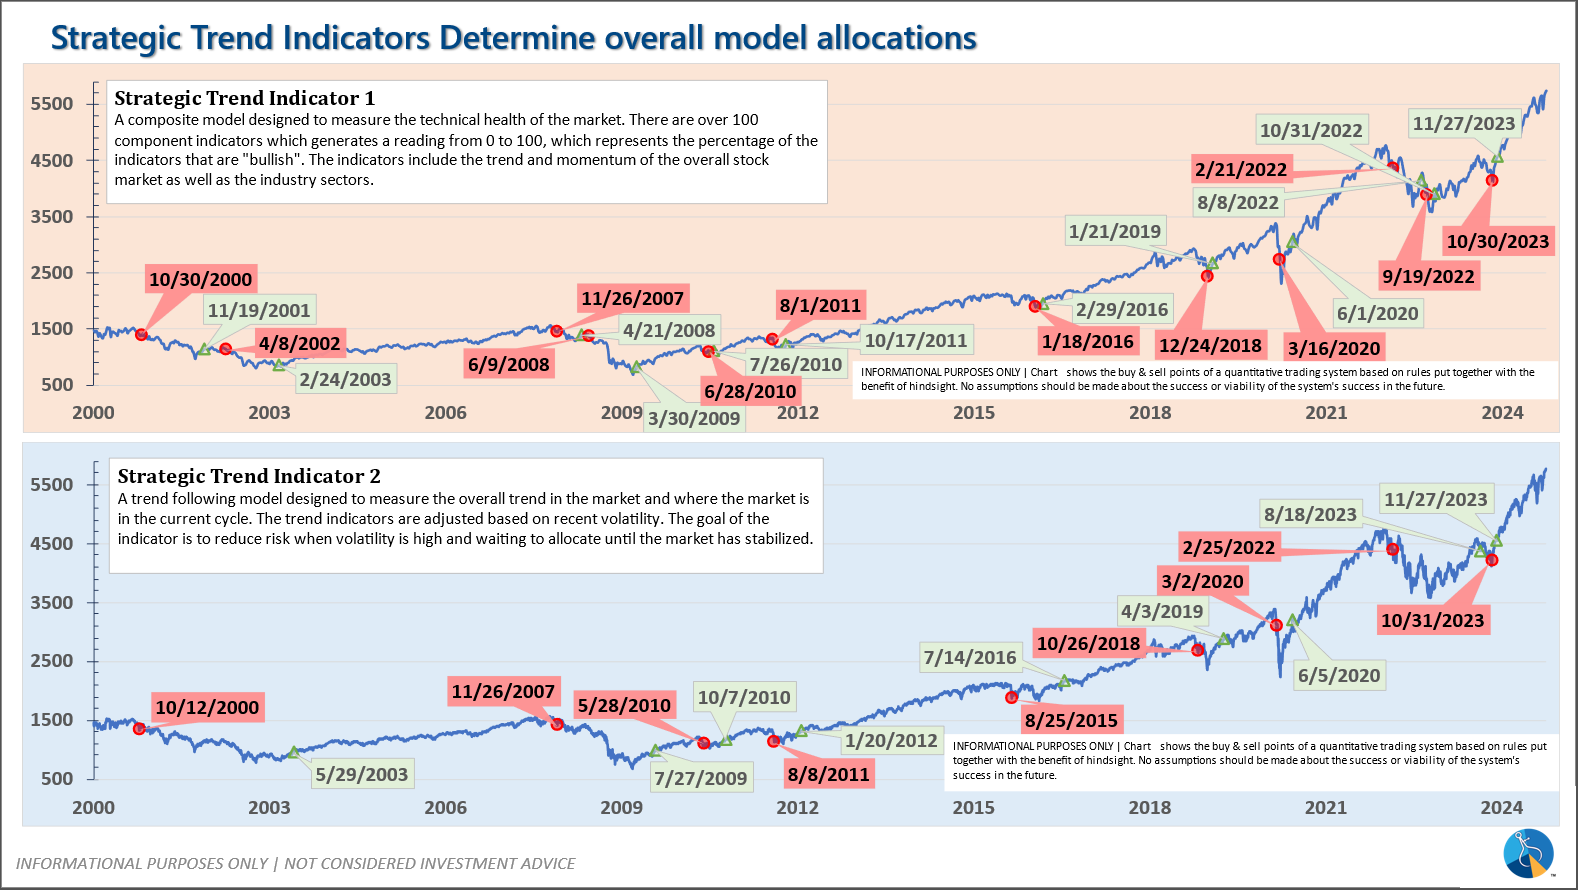
-Strategic Trend Models went on a buy 11/27/2023; 7/8/24 – small and mid-cap positions eliminated with latest Core Rotation System update – money shifted to Large Cap Value (Dividend Growth) & International Funds
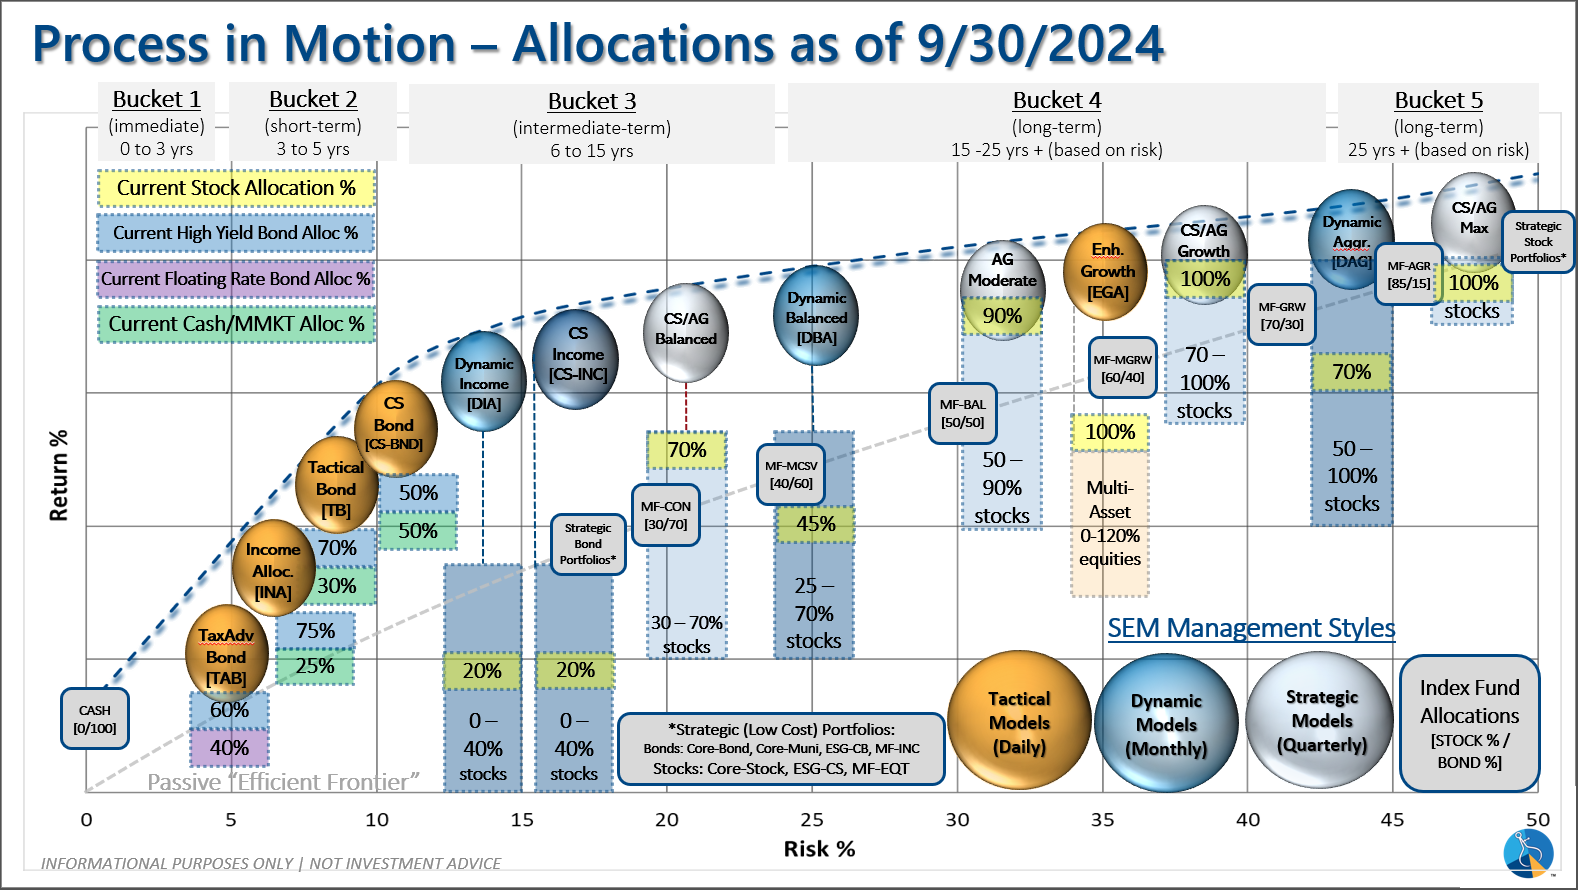
SEM deploys 3 distinct approaches – Tactical, Dynamic, and Strategic. These systems have been described as 'daily, monthly, quarterly' given how often they may make adjustments. Here is where they each stand.
Tactical (daily): On 5/6/24 about half of the signals in our high yield models switched to a buy. The other half remains in money market funds. The money market funds we are currently invested in are yielding between 4.3-4.8% annually.
Dynamic (monthly): The economic model was 'neutral' since February. In early May the model moved slightly negative, but reversed back to 'neutral' in June. This means 'benchmark' positions – 20% dividend stocks in Dynamic Income and 20% small cap stocks in Dynamic Aggressive Growth. The interest rate model is slightly 'bullish'.
Strategic (quarterly)*: BOTH Trend Systems reversed back to a buy on 11/27/2023
The core rotation is adjusted quarterly. On August 17 it rotated out of mid-cap growth and into small cap value. It also sold some large cap value to buy some large cap blend and growth. The large cap purchases were in actively managed funds with more diversification than the S&P 500 (banking on the market broadening out beyond the top 5-10 stocks.) On January 8 it rotated completely out of small cap value and mid-cap growth to purchase another broad (more diversified) large cap blend fund along with a Dividend Growth fund.
The * in quarterly is for the trend models. These models are watched daily but they trade infrequently based on readings of where each believe we are in the cycle. The trend systems can be susceptible to "whipsaws" as we saw with the recent sell and buy signals at the end of October and November. The goal of the systems is to miss major downturns in the market. Risks are high when the market has been stampeding higher as it has for most of 2023. This means sometimes selling too soon. As we saw with the recent trade, the systems can quickly reverse if they are wrong.
Overall, this is how our various models stack up based on the last allocation change:
Questions or comments - drop us a note?
Curious if your current investment allocation aligns with your overall objectives and risk tolerance? Take our risk questionnaire


