After one of the worst May’s in decades, the S&P 500 is on the verge of the best June in over half a century. This follows the best start to the year since 1987 and the worst Christmas Eve on record. It is easy to see the stock market has become quite volatile recently.
One of the reasons the markets have experienced the wild swings is fewer and fewer stocks represent a higher and higher percentage of the overall “market”. This is a function of a long bull market and the way the primary gauge of the market is calculated. The S&P 500 is a “capitalization weighted” index, meaning the larger the company the higher percentage it represents of the overall total. This leads to the hottest stocks becoming a much larger percentage of the portfolio for those following a passive index approach.
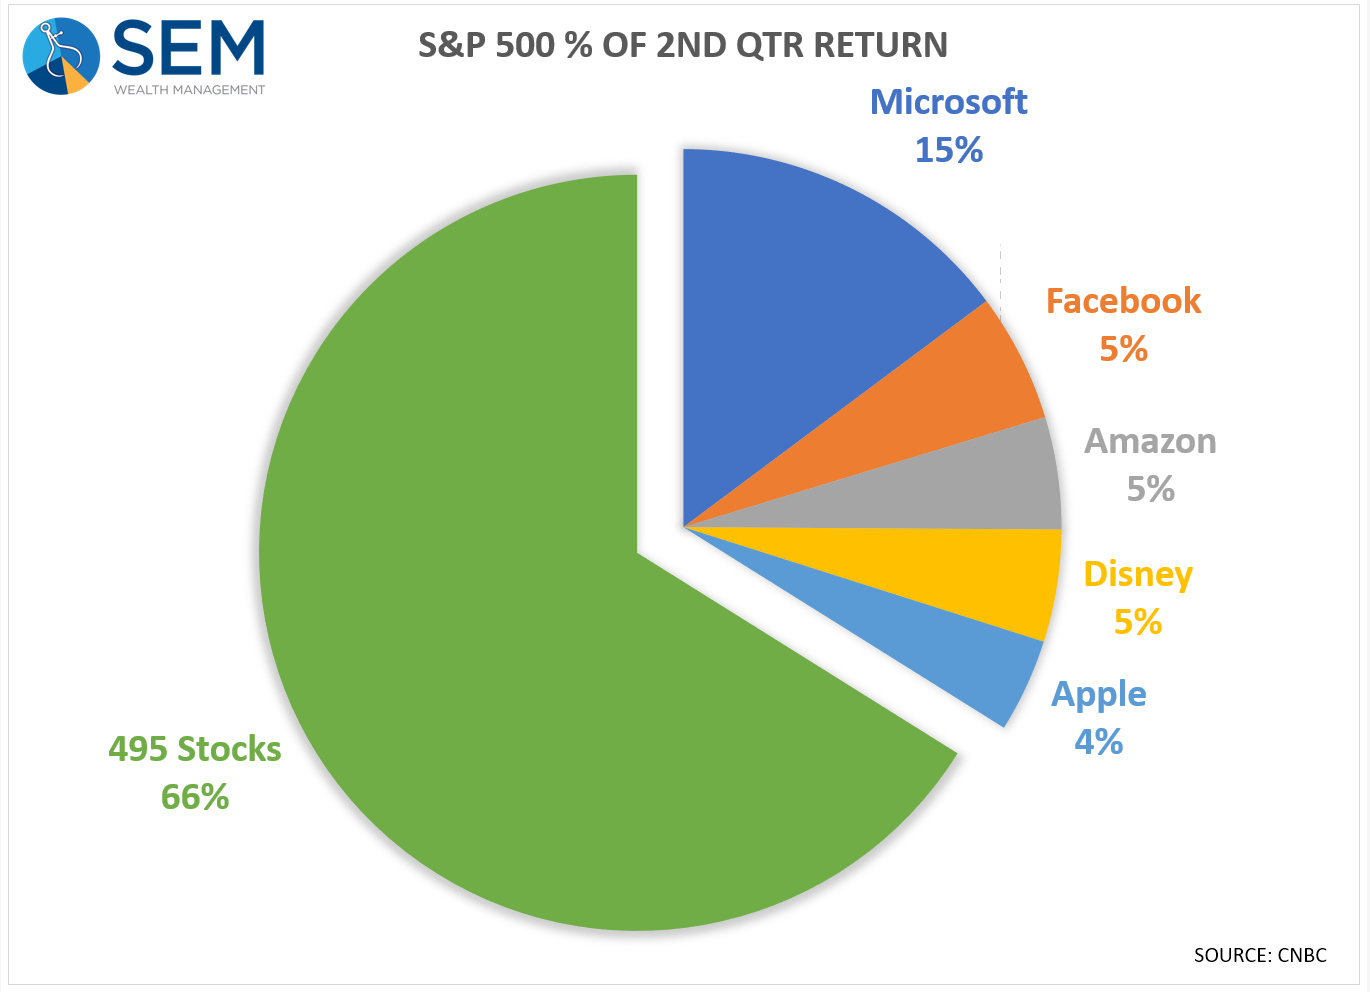
The 2nd Quarter was one of the most narrow quarter’s we’ve seen during the bull market. According to a recent CNBC report 5 stocks accounted for 34% of the gains during the quarter. Another way to look at it, an “equal weight” portfolio of all 500 stocks would have generated 33% less return during the quarter. Going beyond just large cap US stocks, mid-cap stocks finished the quarter flat, while small cap and international stocks were down.

ILLUSTRATIVE PURPOSES ONLY — PLEASE SEE DISCLAIMER AT BOTTOM OF PAGE
It can be misleading and often frustrating to compare your portfolio to the S&P 500. In order to keep up with the S&P 500 we would not only have to risk half of our clients’ account values, we would also have to have an undiversified allocation to fewer and fewer stocks and industries.
While we did not keep up with the S&P 500 we are pleased with our performance during the past quarter and for the past 9 months. Each of our models is doing what we expected them to do. Most importantly, our returns are not tied to the performance of 5 stocks.


