
"It's the economy, stupid!" was a phrase often uttered in the 90s when people asked why Bill Clinton had such a high approval rating. Based on the overall economic sentiment in our country and the underlying economic data, it is not always about the economy.....or at least what the data says is happening.
We learned last week Consumer Spending grew by over 5% for the 38th time in 40 months.
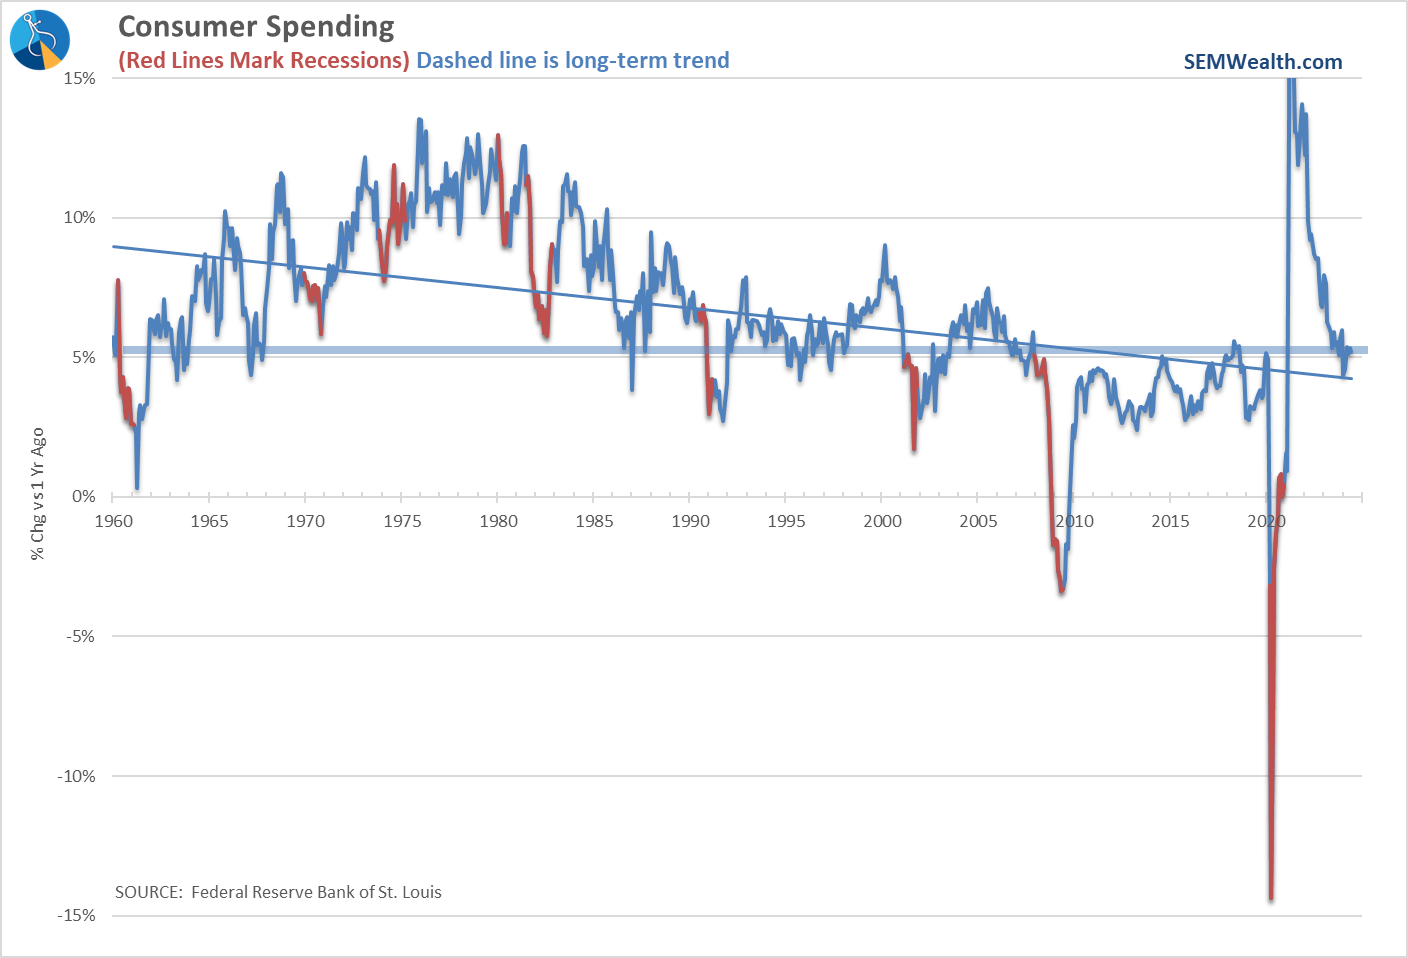
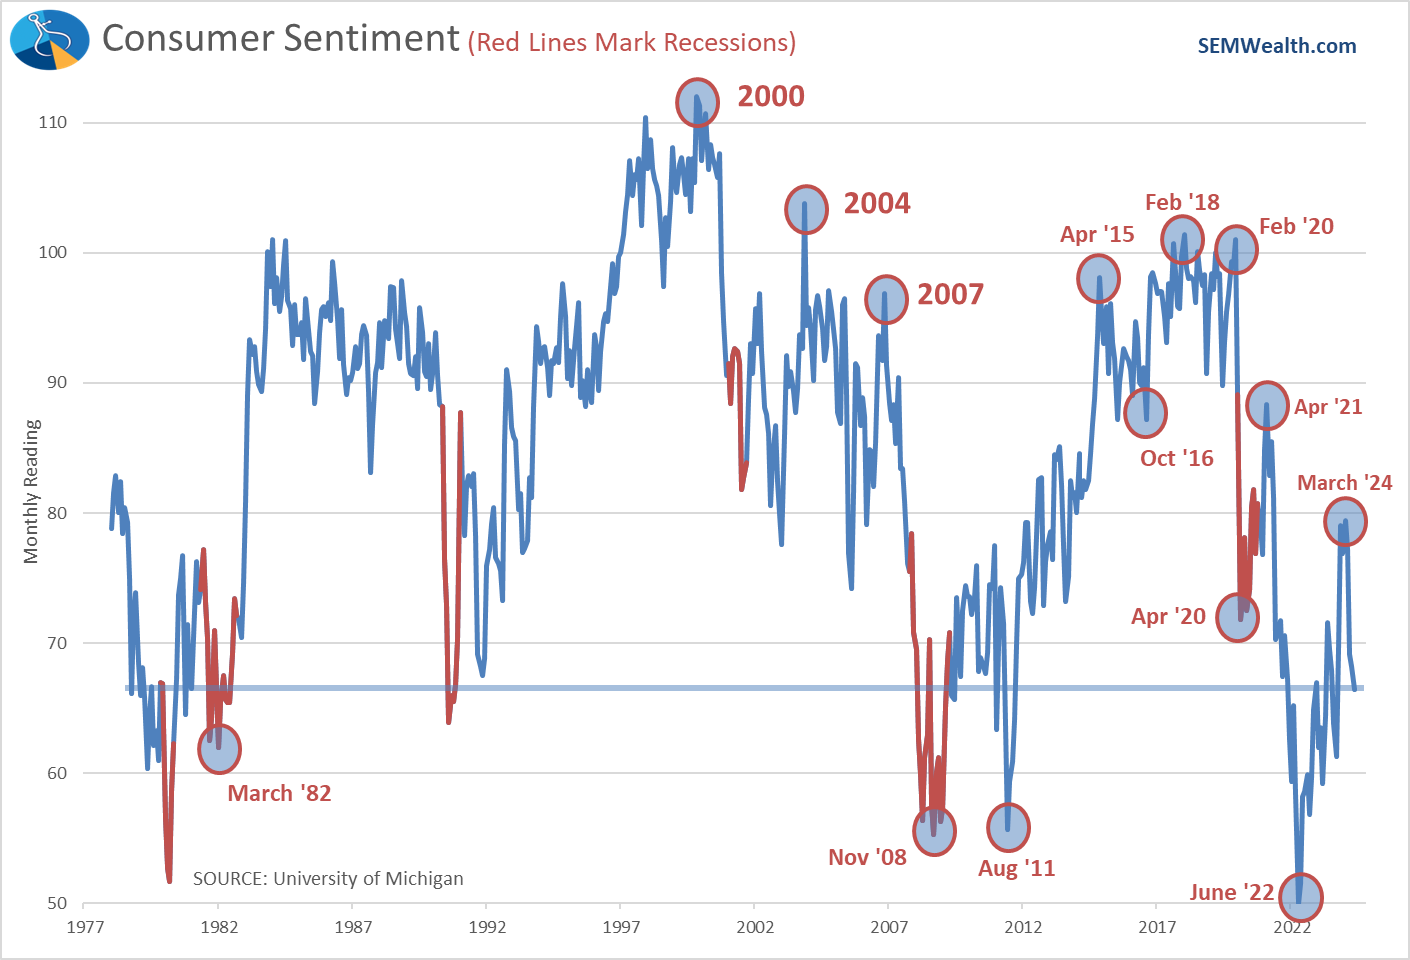
Negative consumer sentiment does not seem to be filtering down to aggregate spending with sentiment continuing to fall last month.
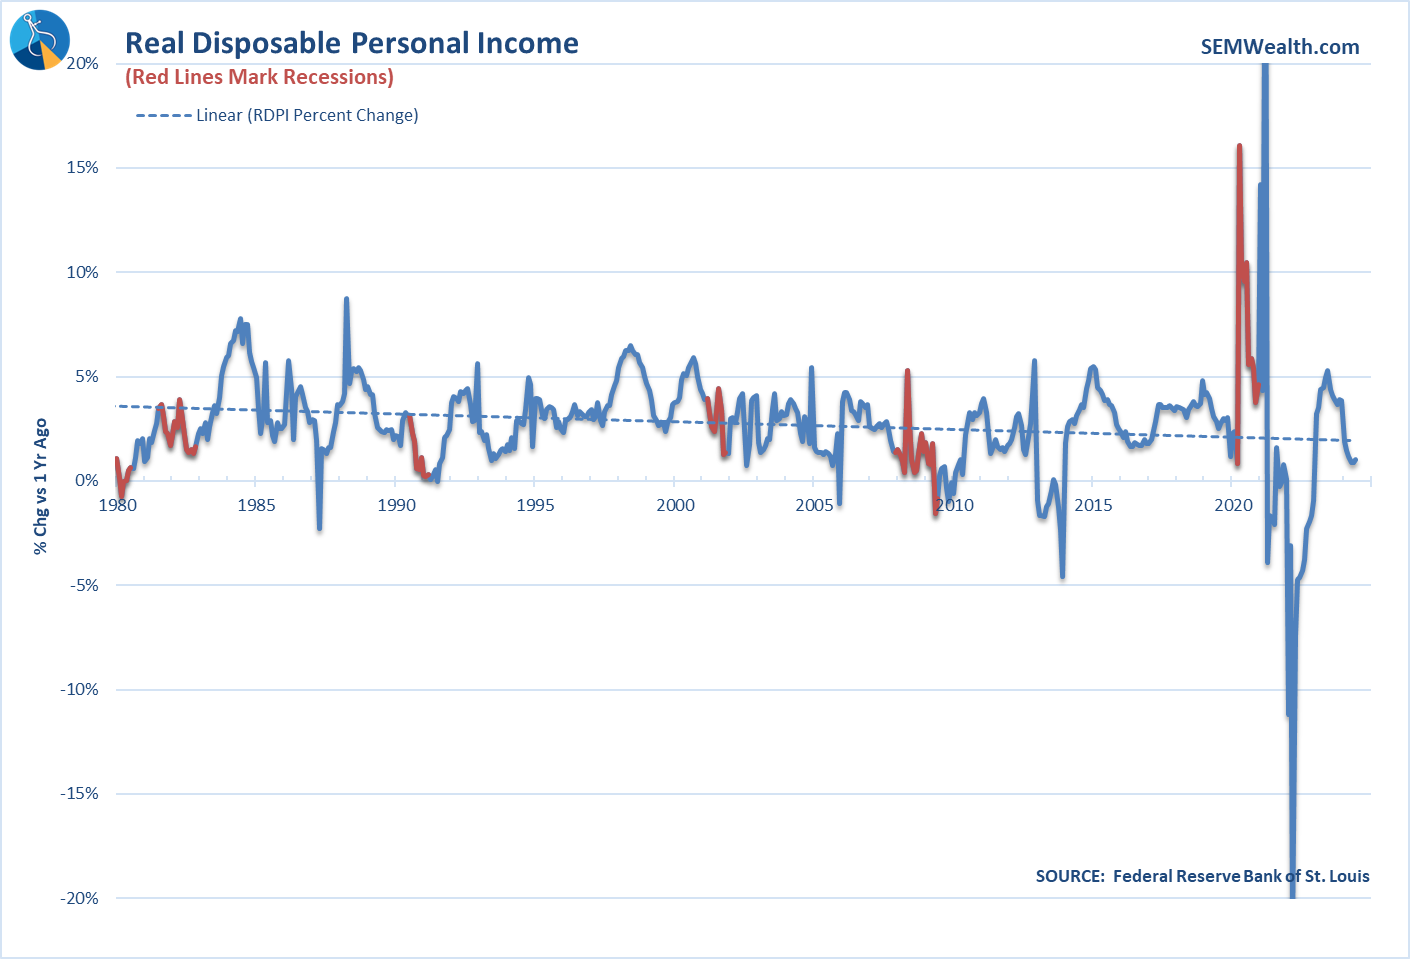
Personal income, however once again grew well below the pace of spending, climbing just 1% on an annual basis, the 6th consecutive month below 2%.
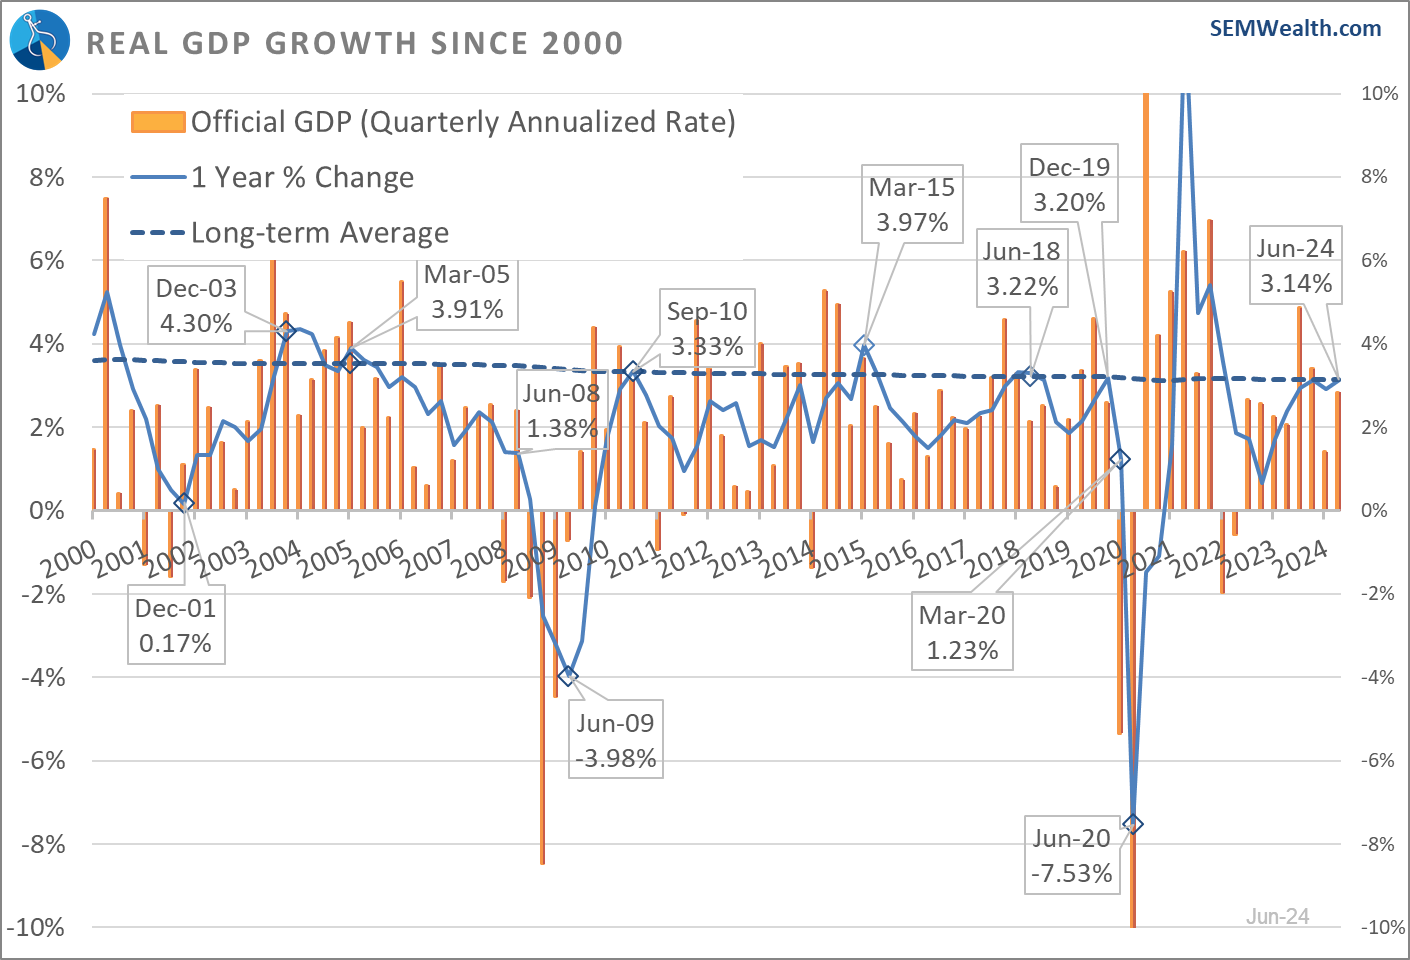
Overall, economic growth in the 2nd quarter exceeded 3% for just the 7th non-COVID skewed quarter since 2000. We are nearly back to the same rate of growth we enjoyed in December 2019, just before the COVID shutdown.
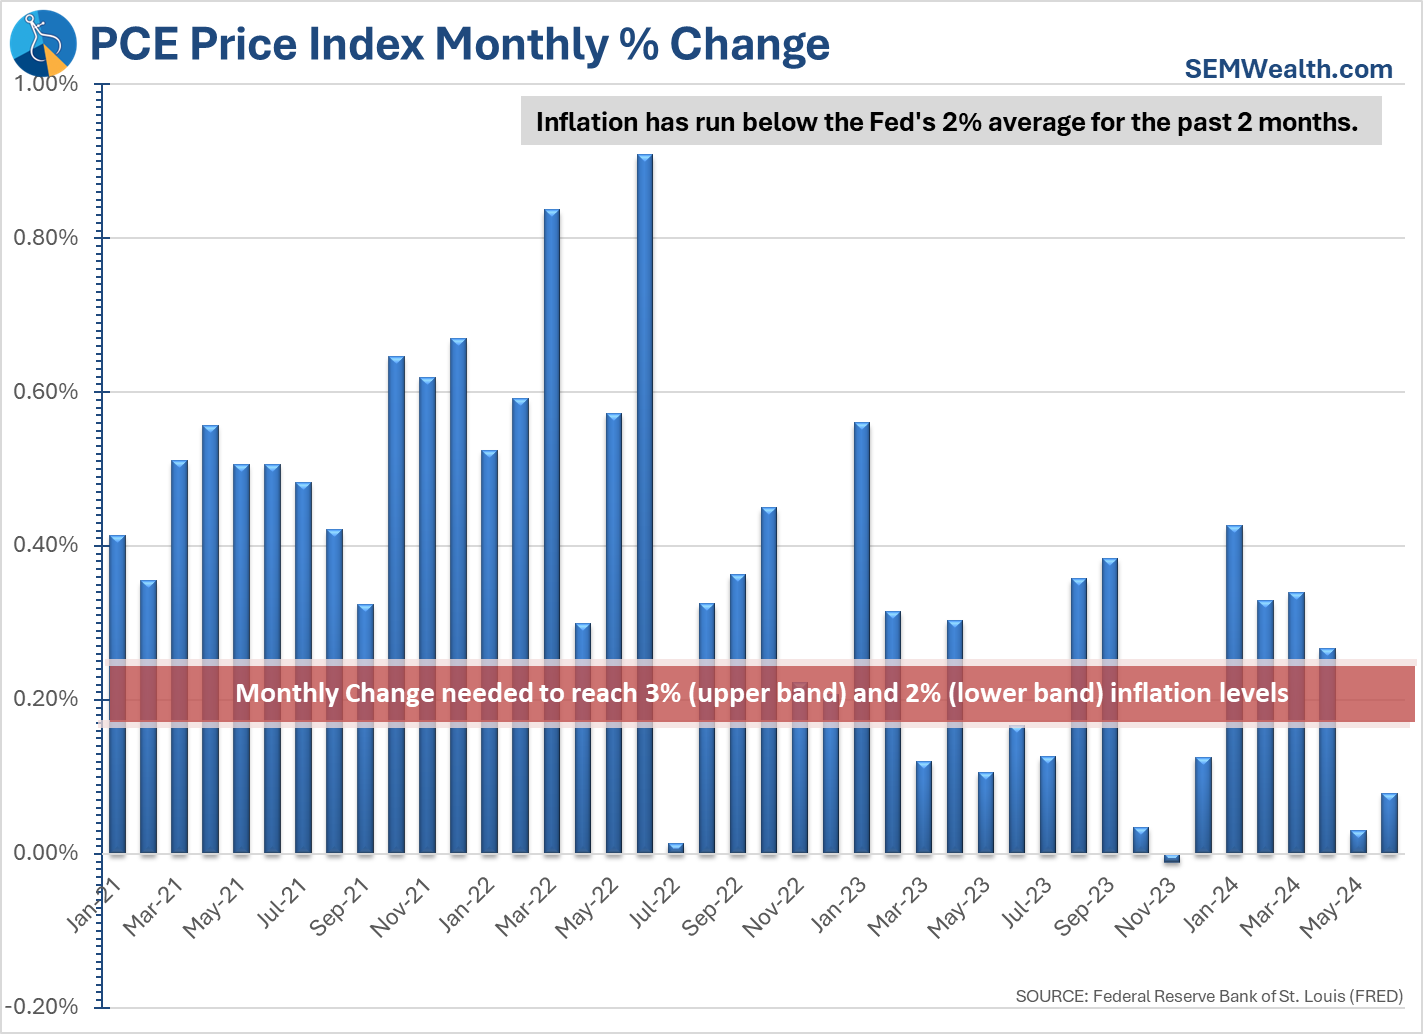
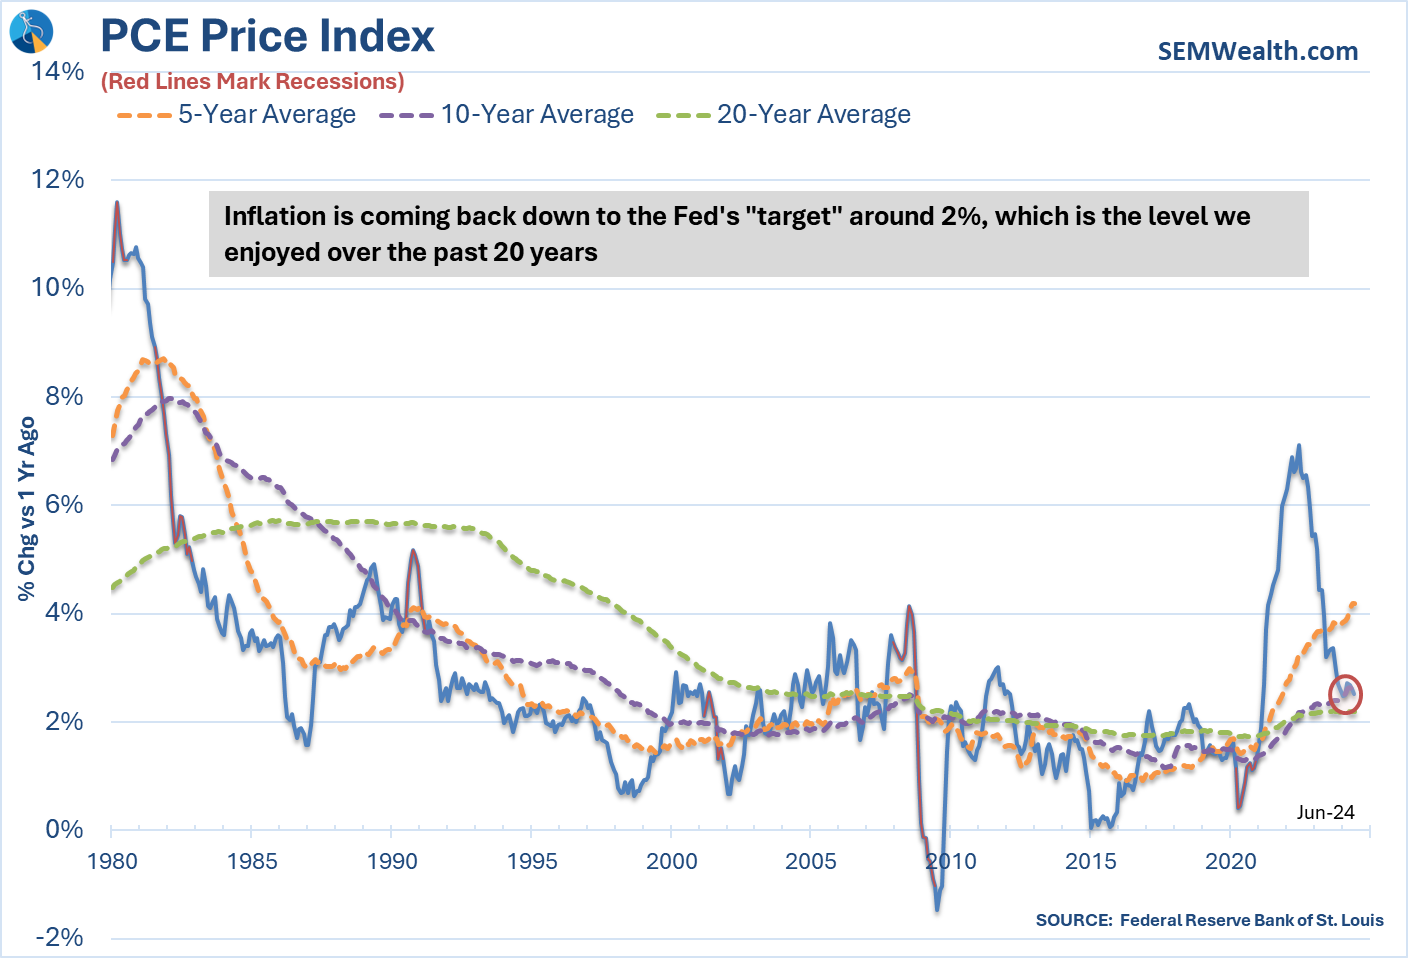
Stocks were punished for most of the week as it appeared the prospect of Fed rate cuts was pushed well into the future. That changed again on Friday as we saw the Fed's preferred inflation index continue a nice downward trend.
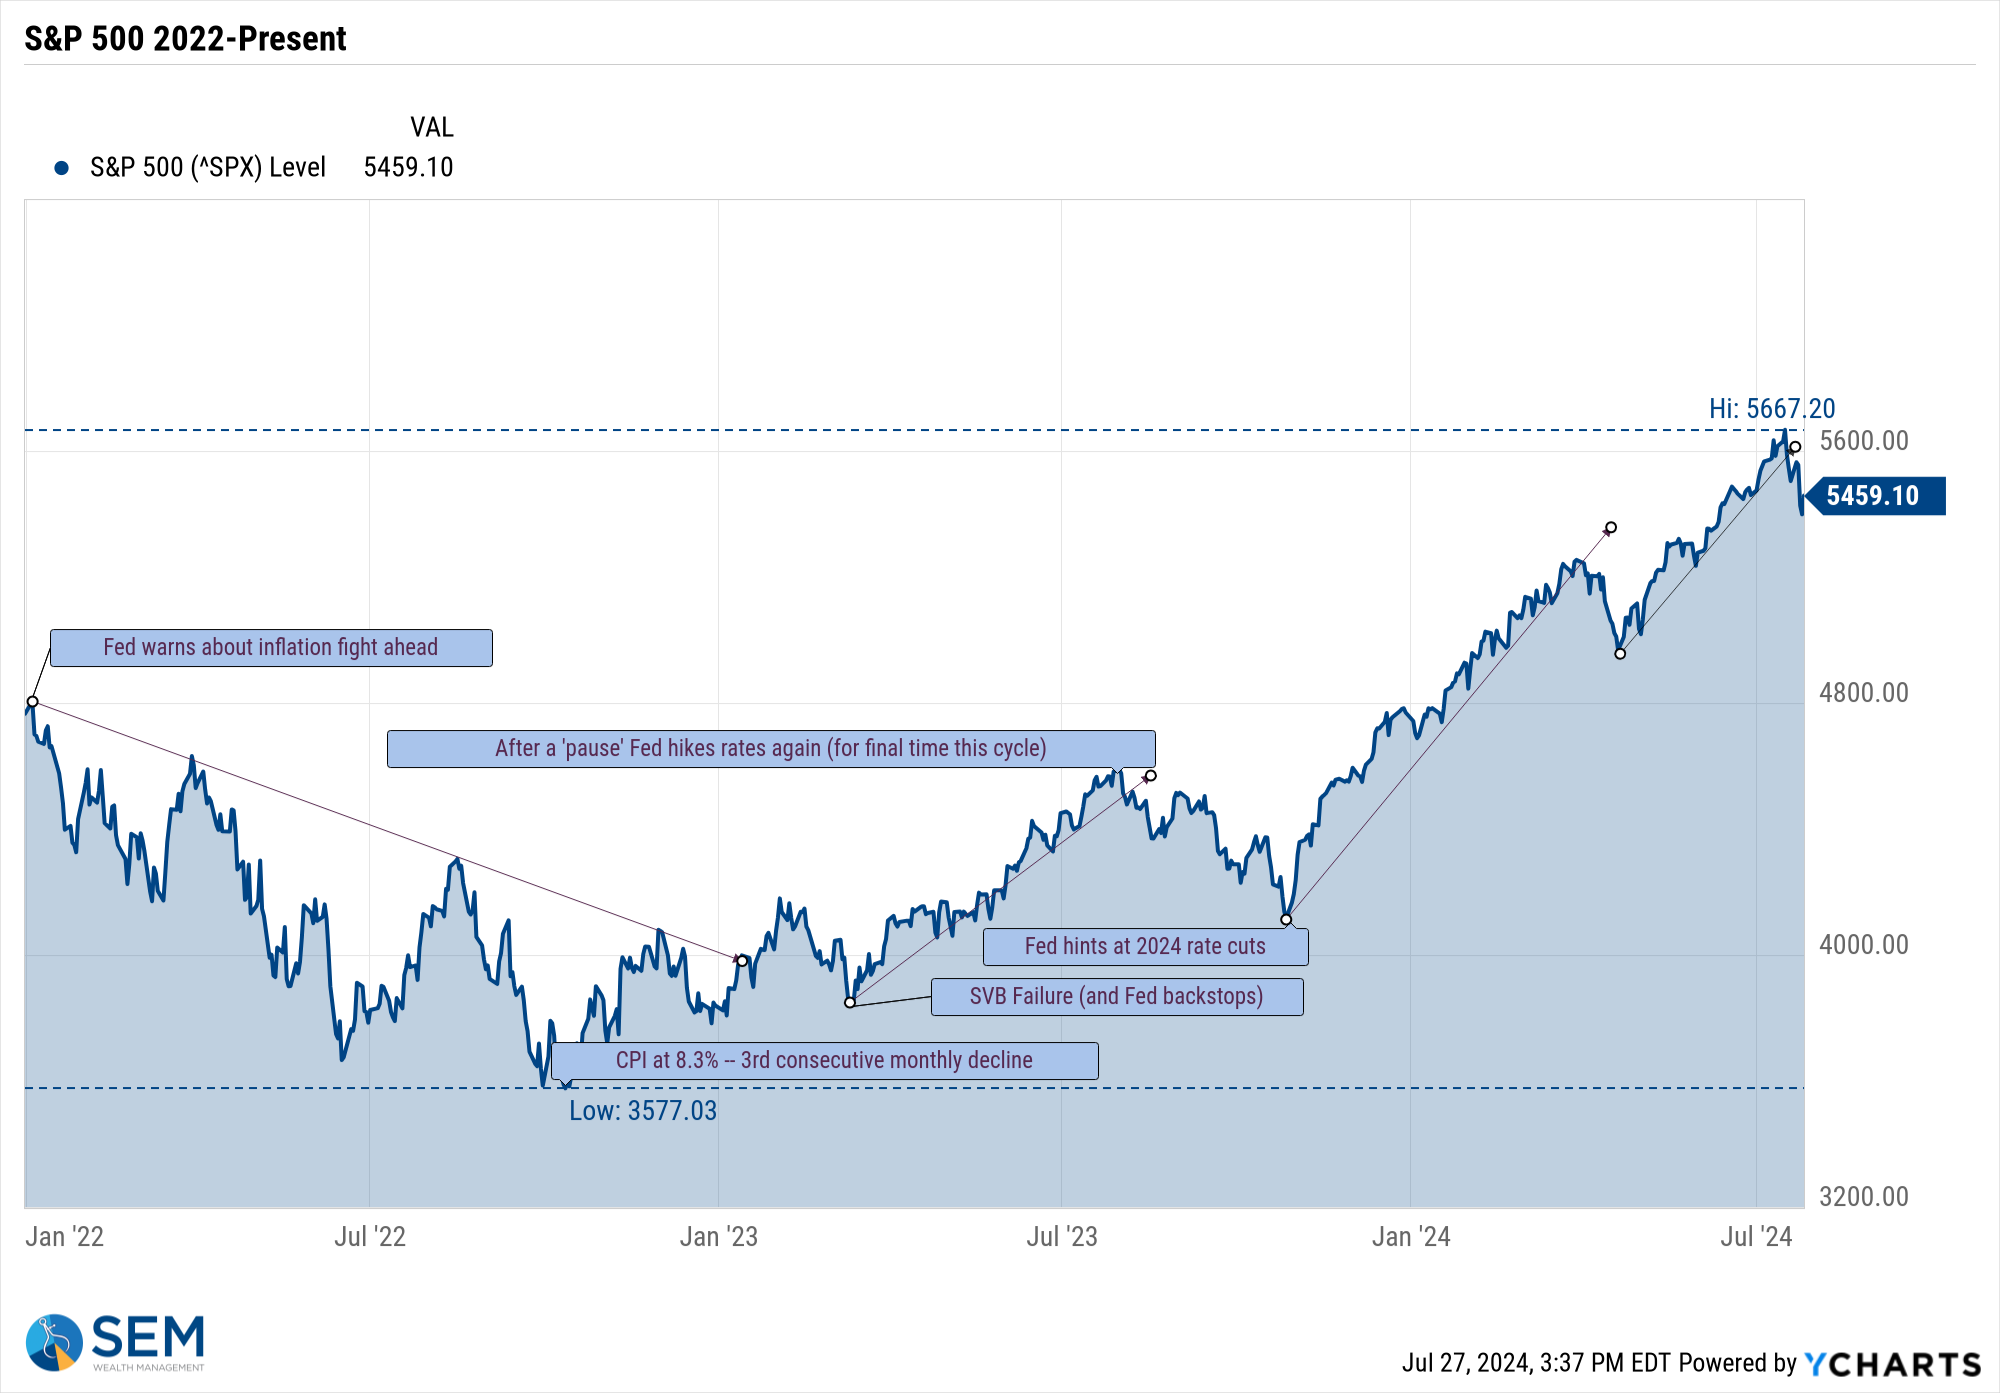
The Fed is "data dependent" which makes the market data dependent. We have seen an impressive rally since November of 2023 following the Fed's first hint they could be looking at cutting rates in 2024. As I frequently point out, the Fed has a terrible track record of predicting recessions and preventing them from worsening with some rate cuts.
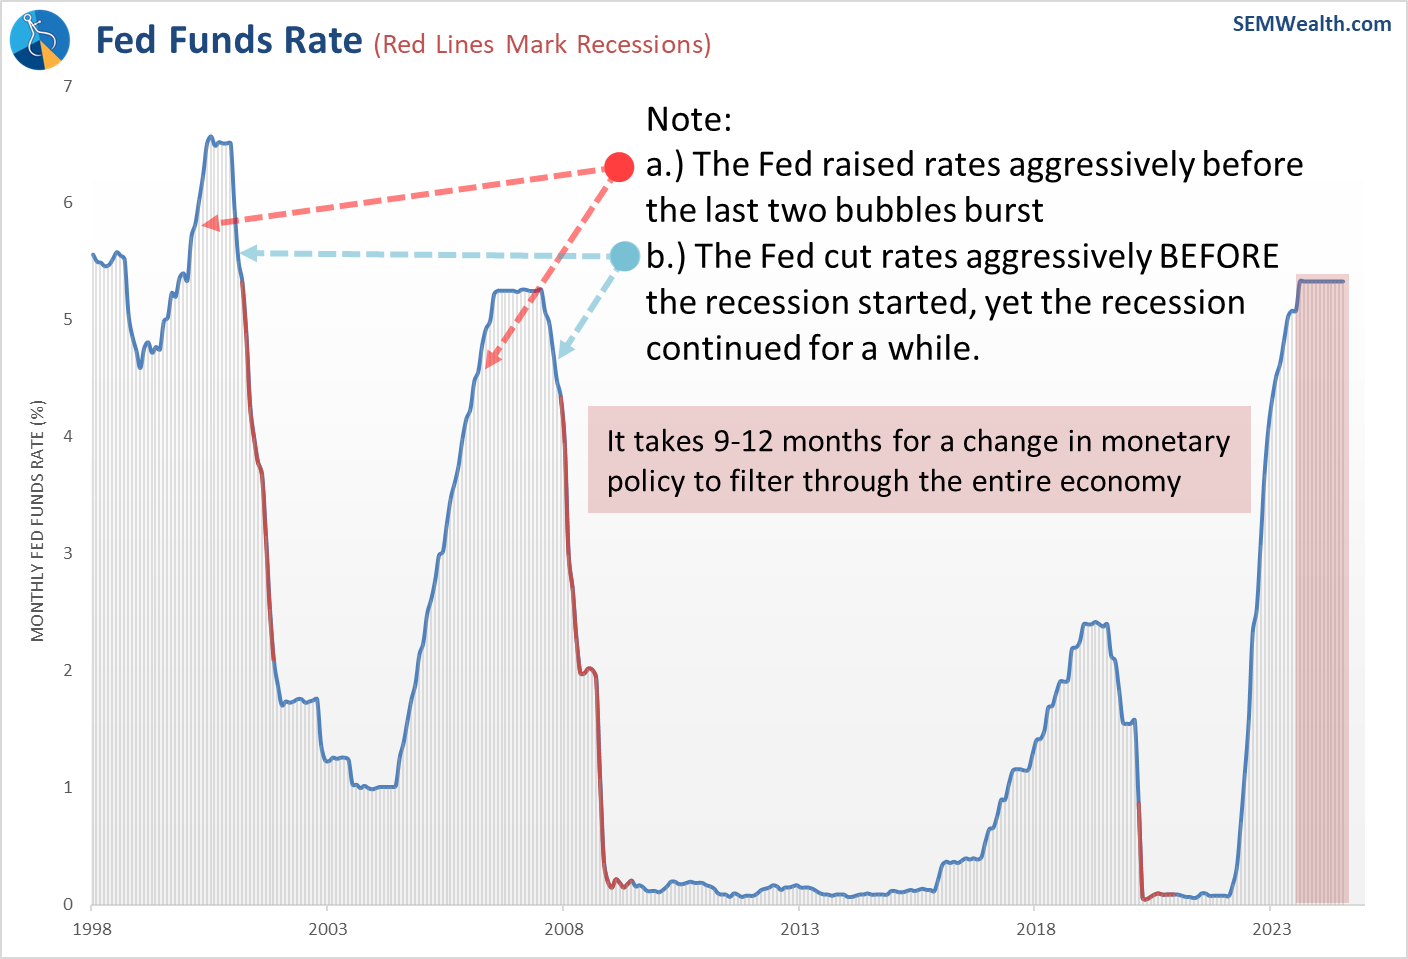
We seem to have survived the impact of the massive hikes, but the question remains whether the Fed can shift quickly enough to prevent a recession while also not sparking another round of inflation. We also had renewed alarms about the ability of corporate earnings to hit the optimistic growth targets which led to this year's technology driven rally. Time will tell whether or not they will prevail. At SEM it doesn't really matter. We will continue to adjust to what the market gives us based on the data, not our opinions.
Market Charts
The S&P 500 broke its steep uptrend line, so this correction is well overdue.
This combined with a rotation into small cap stocks has allowed the Small/Large ratio we track to return to positive territory.
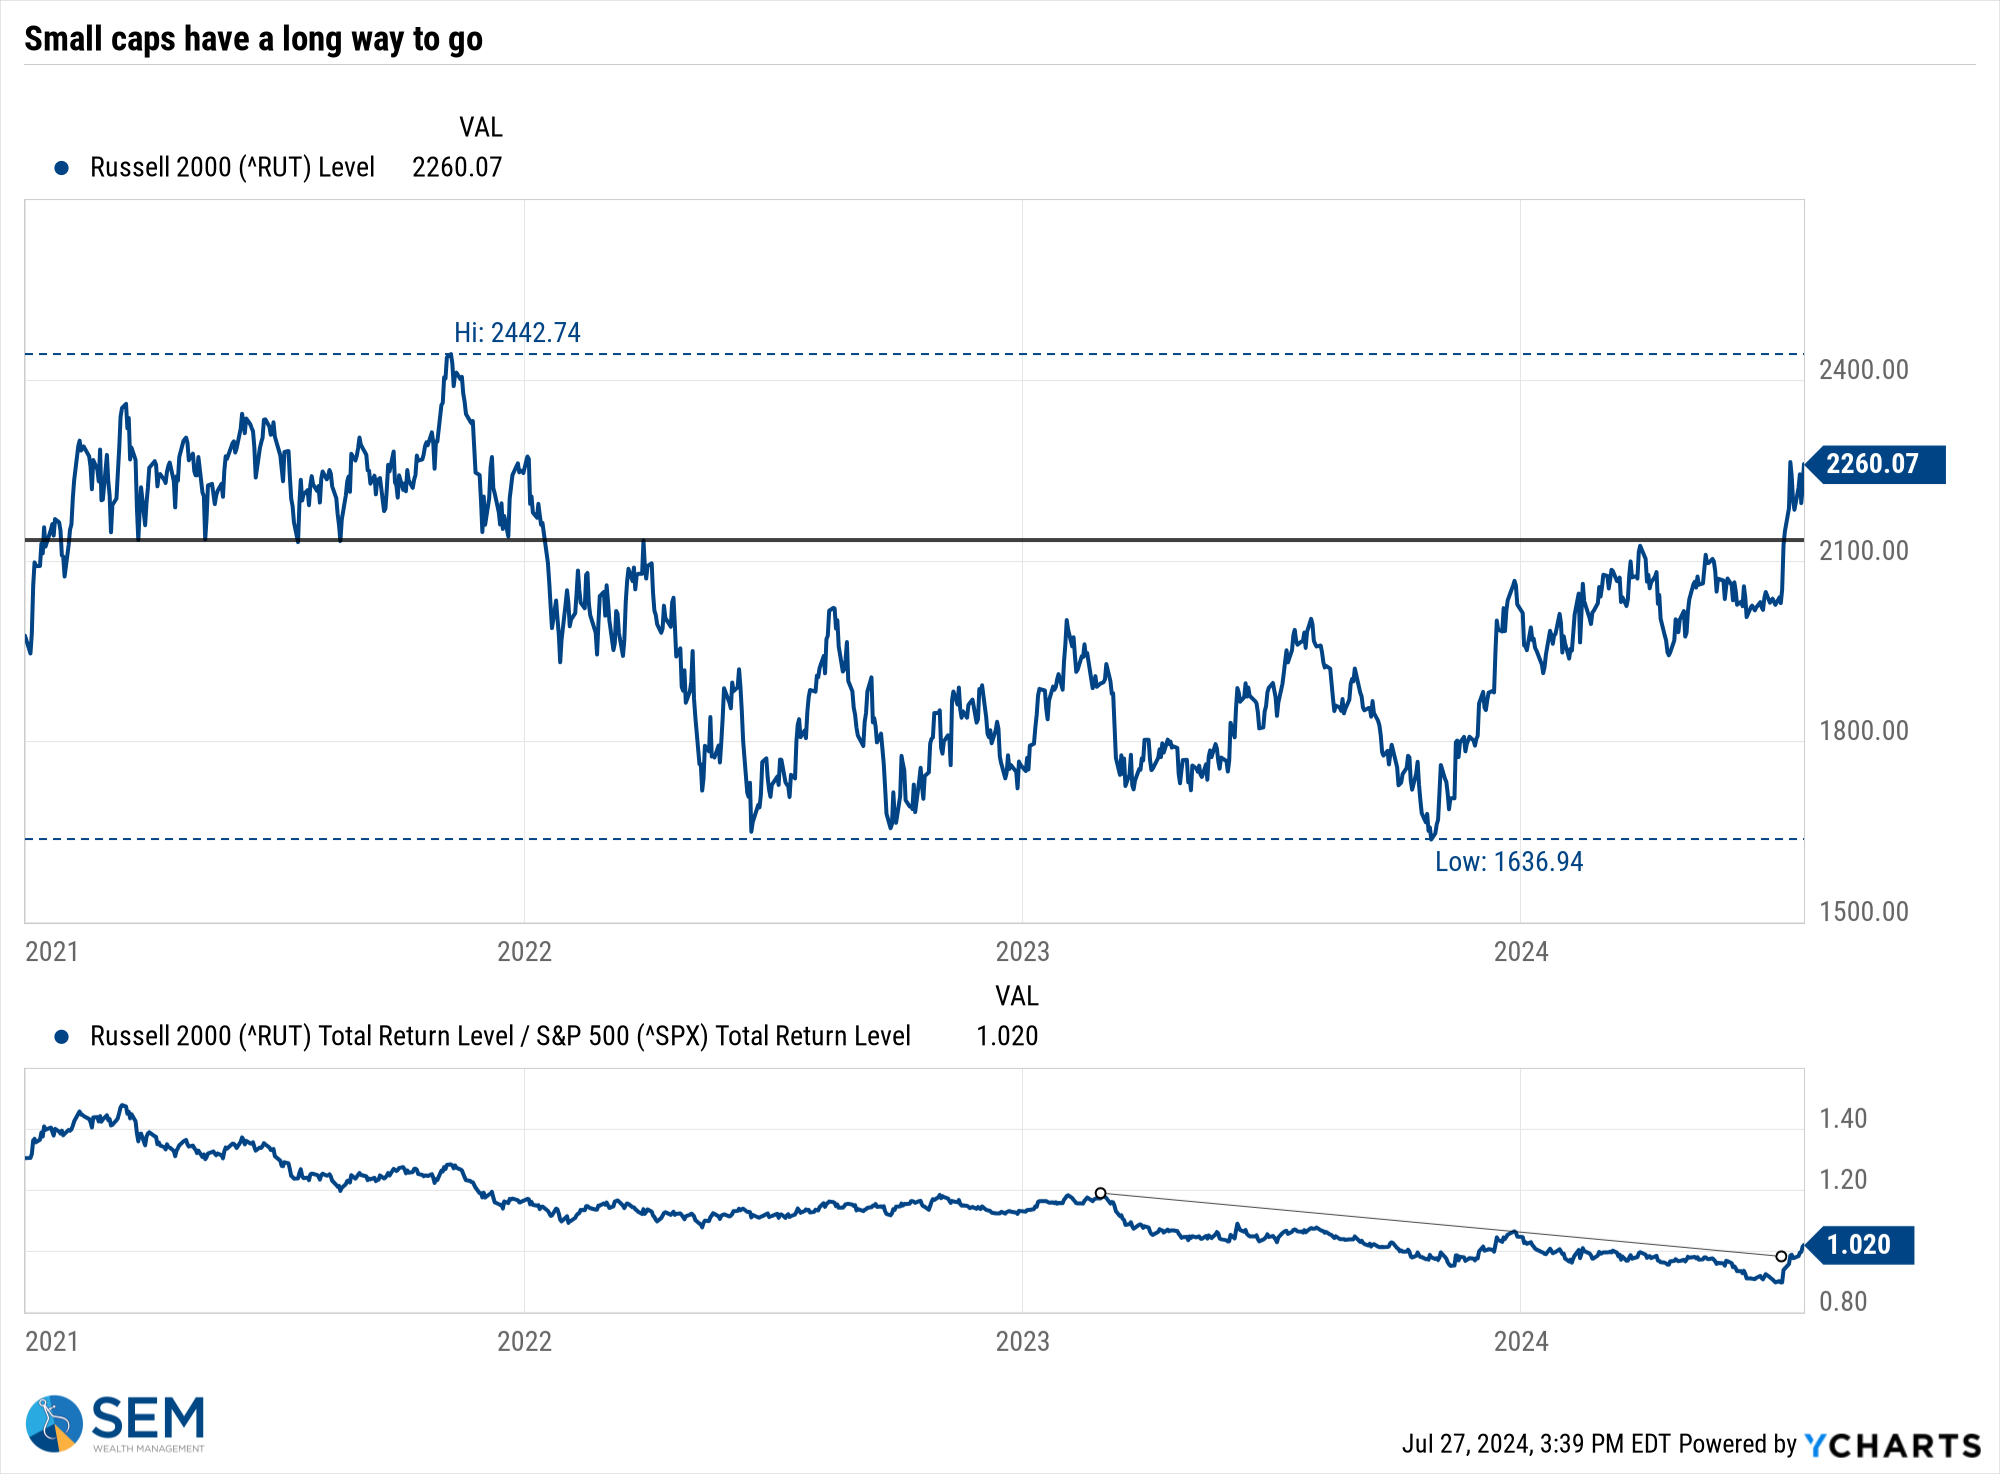
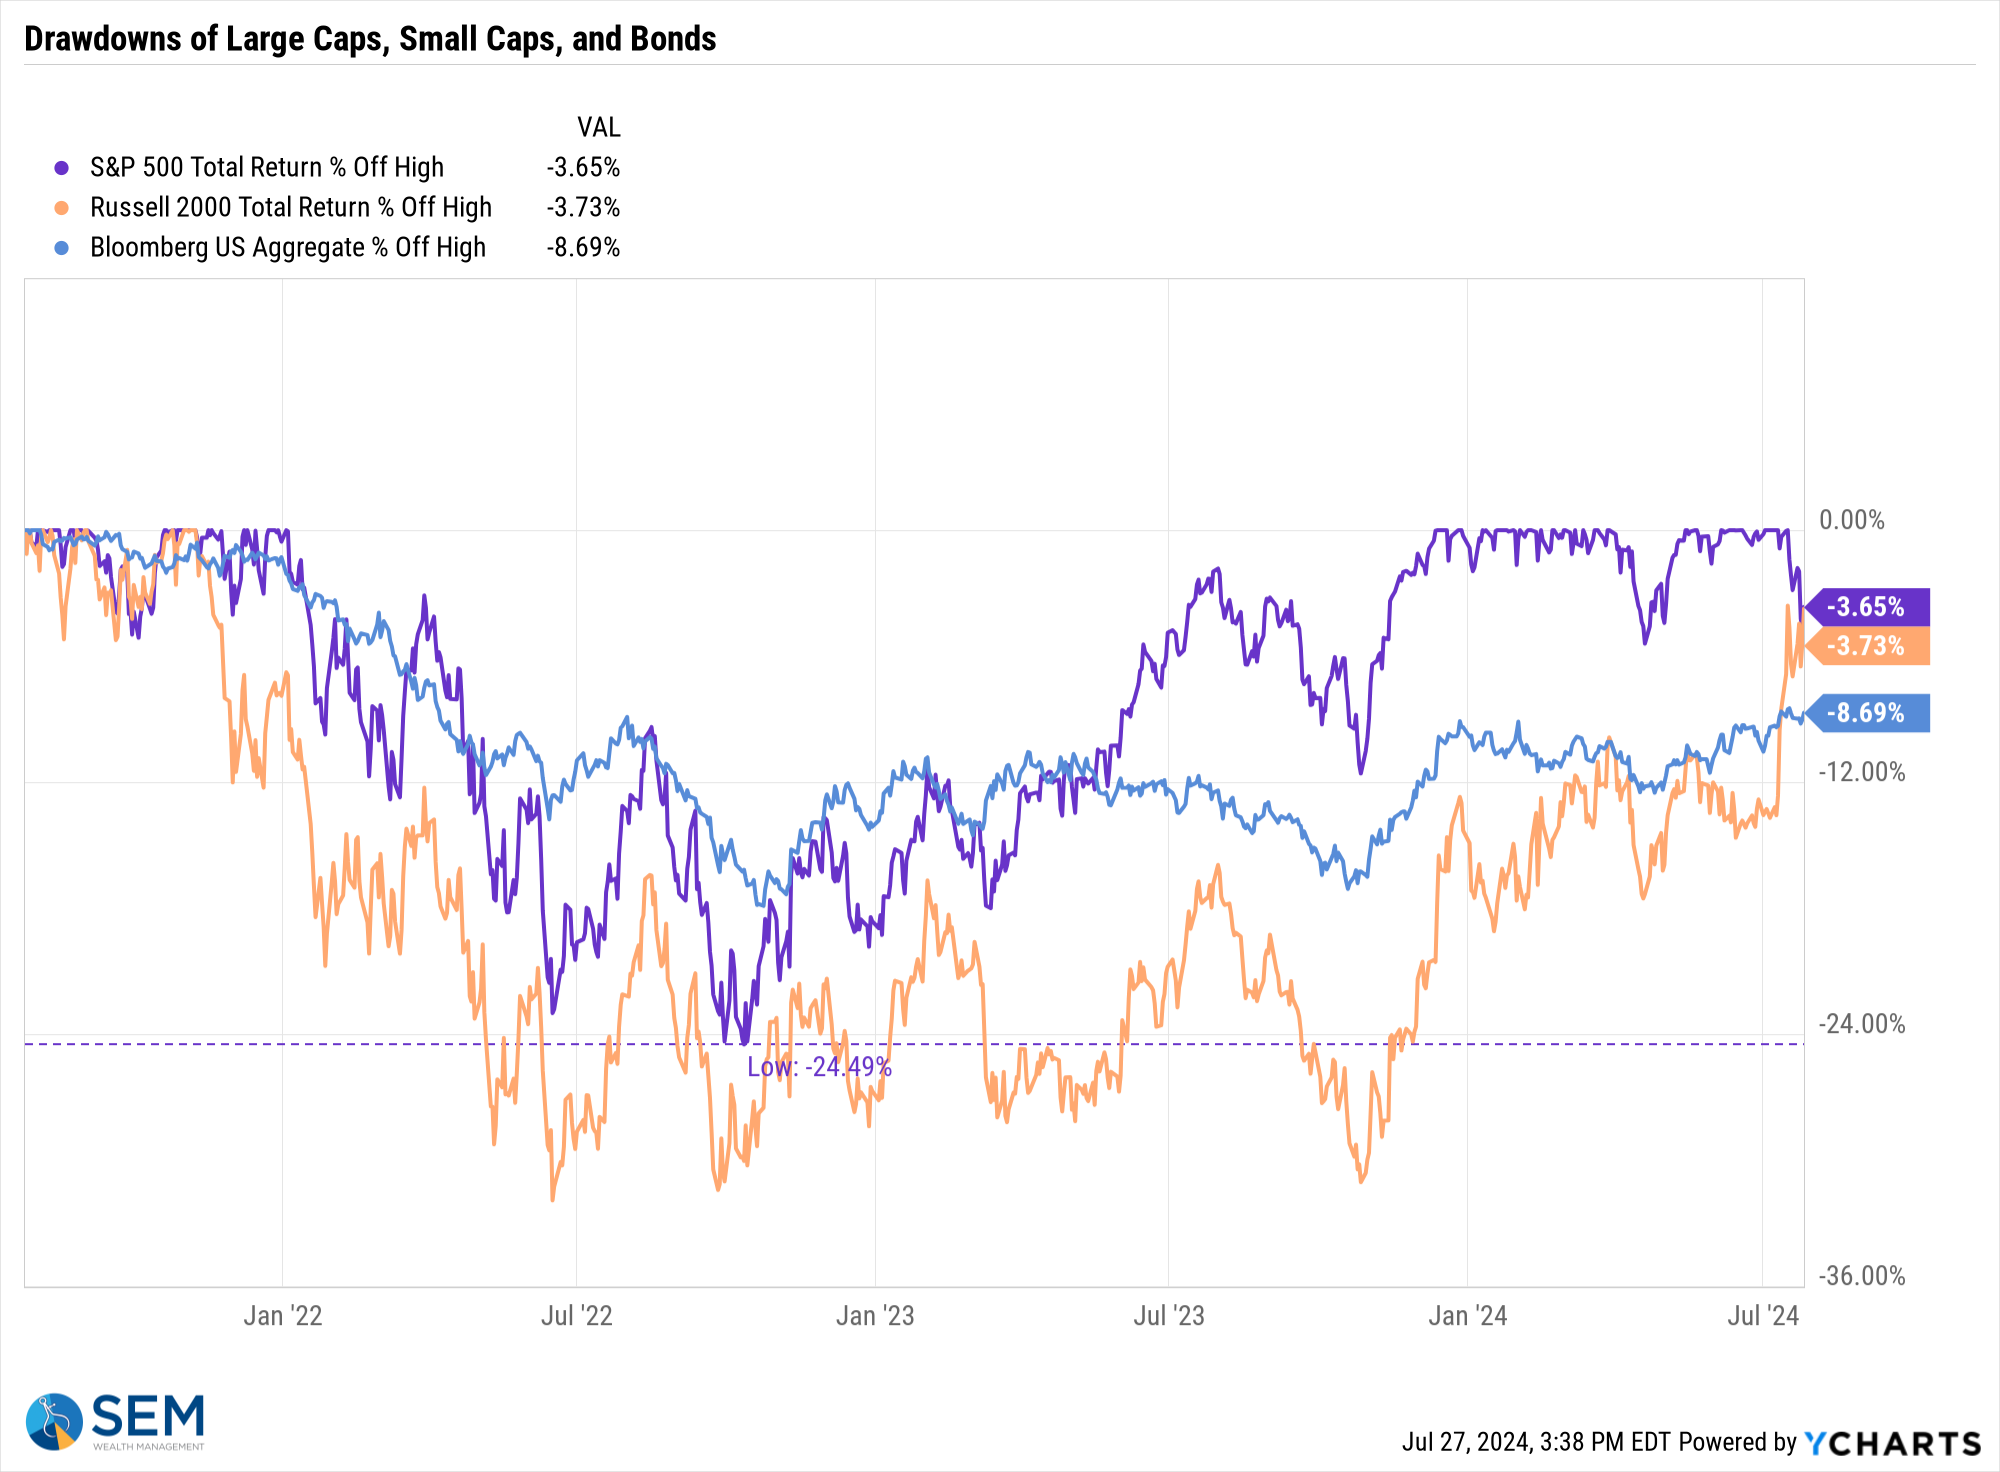
An interesting note, while the small cap index has not yet recovered its 2021 highs, it is now (slightly) better than the S&P 500's current "drawdown".
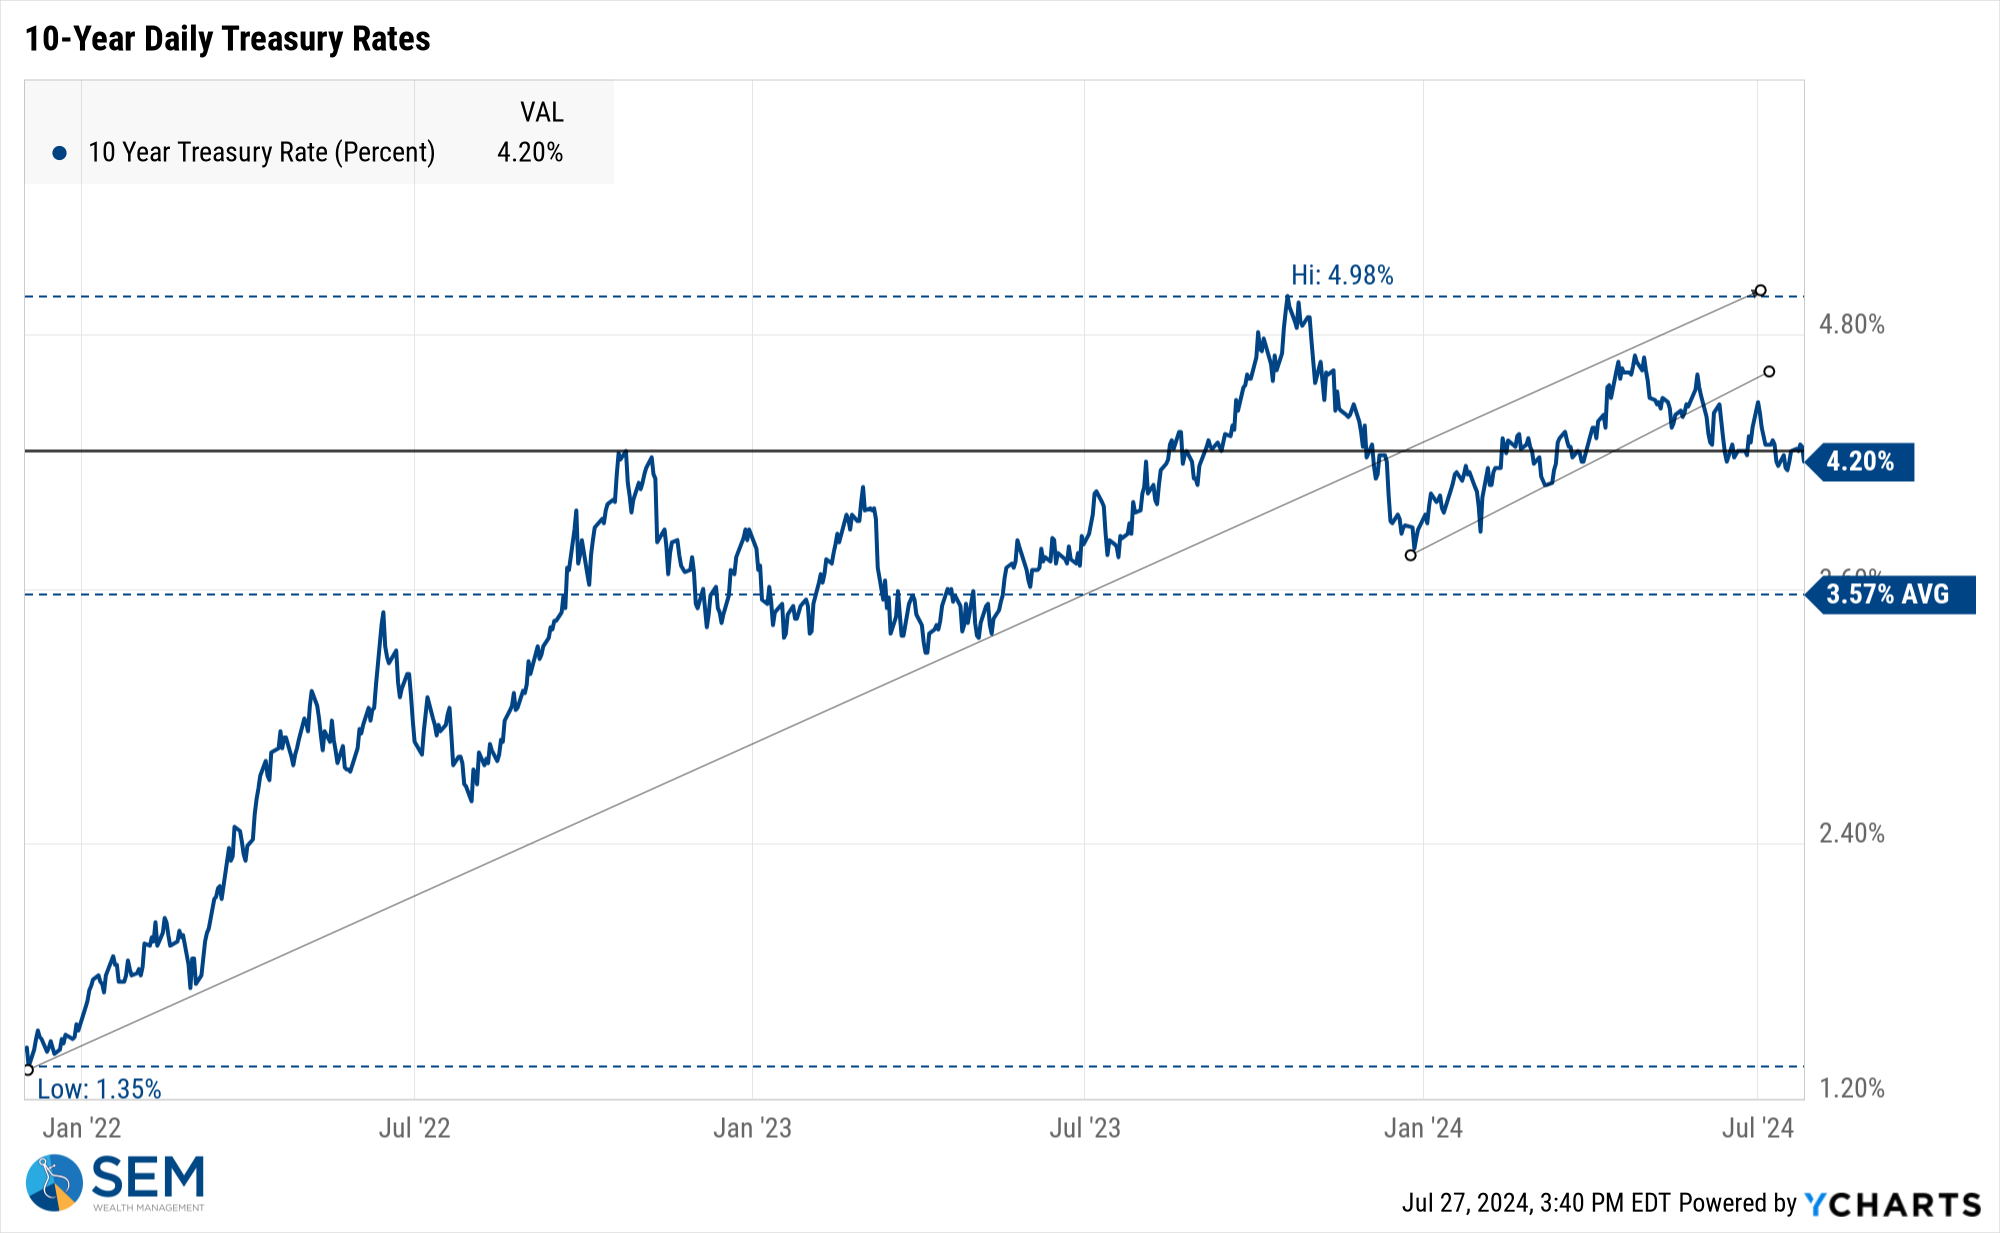
Interest rates continue to muddle around the 4.2% area on the 10-year Treasury. We will have to wait and see if whatever the Fed says this week will help push it in one direction or the other.
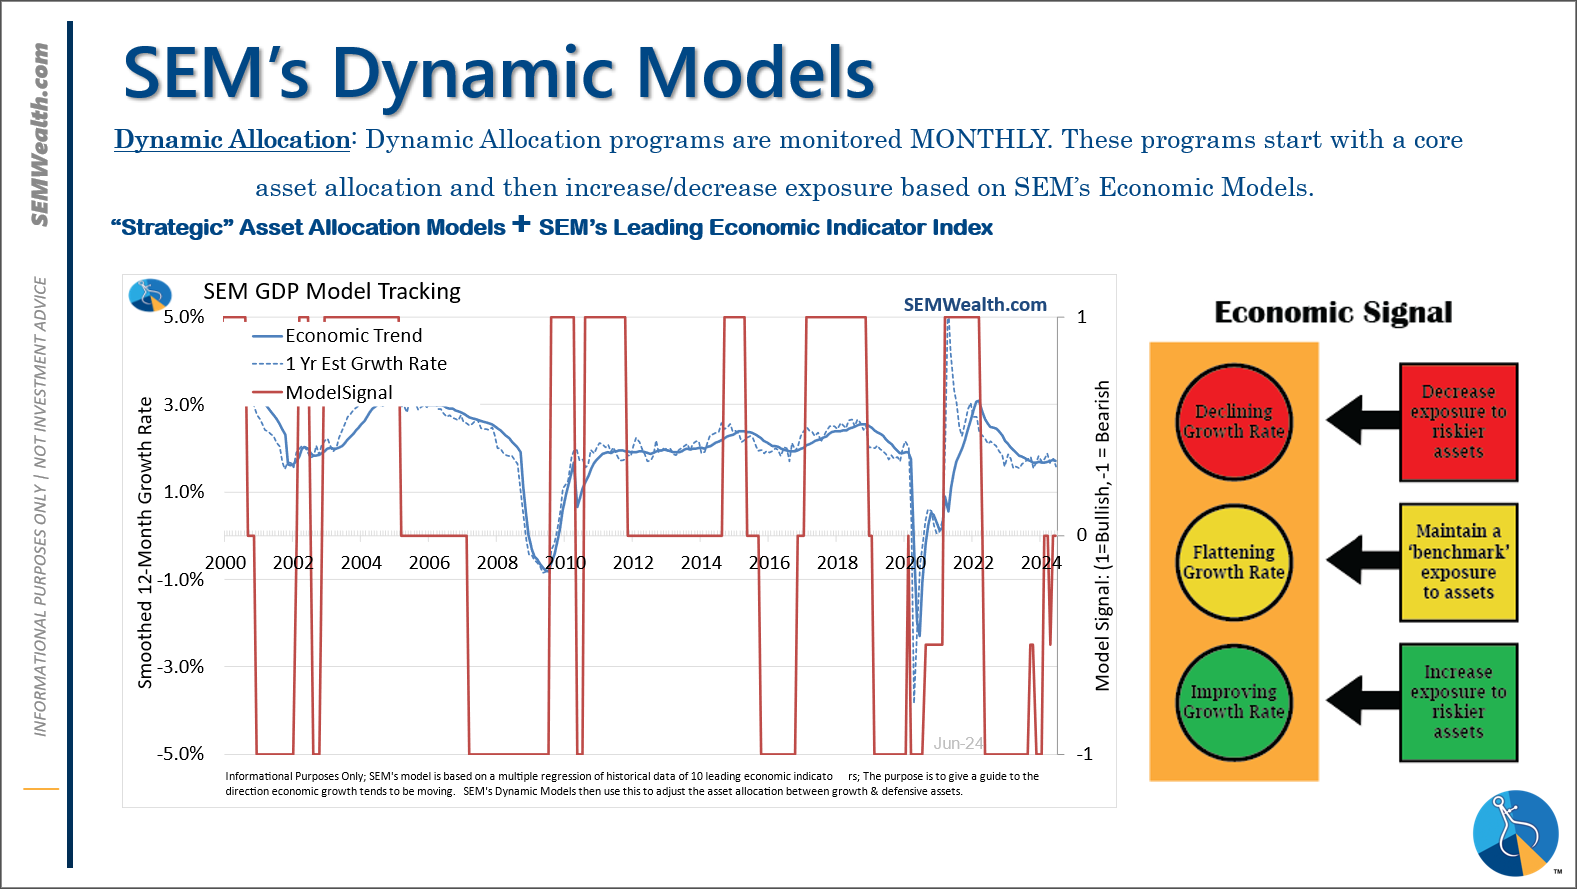
SEM Model Positioning
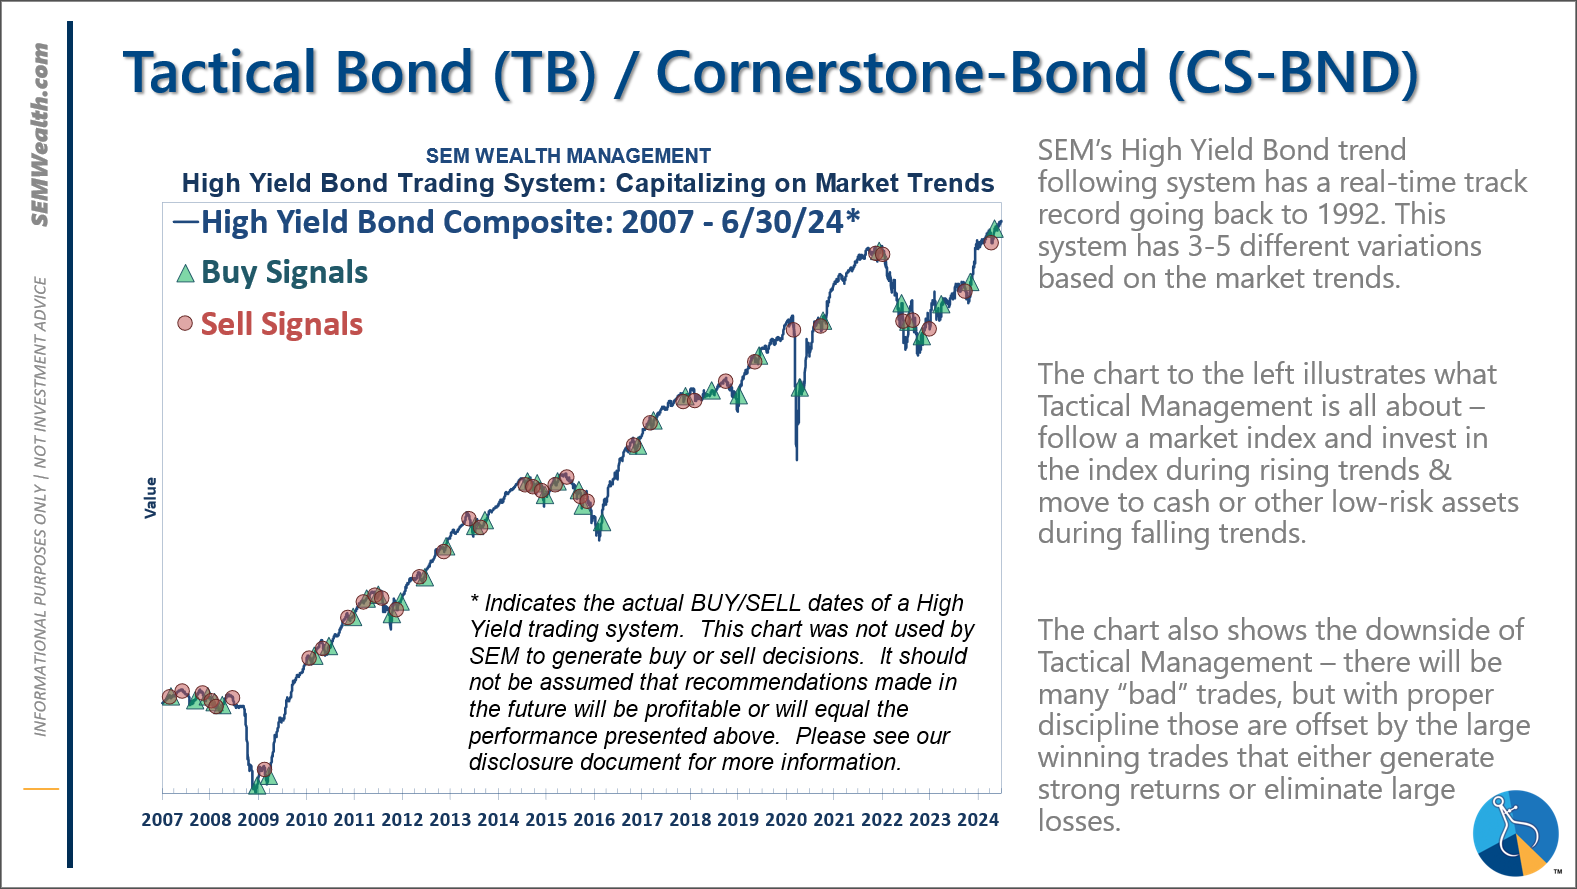
-Tactical High Yield had a partial buy signal on 5/6/24, reversing some of the sells on 4/16 & 17/2024 - the other portion of the signal remains on a sell as high yields continue to oscillate.
-Dynamic Models are 'neutral' as of 6/7/24, reversing the half 'bearish' signal from 5/3/2024. *NEW* 7/8/24 - interest rate model filled from partially bearish to partially bullish (lower long-term rates).
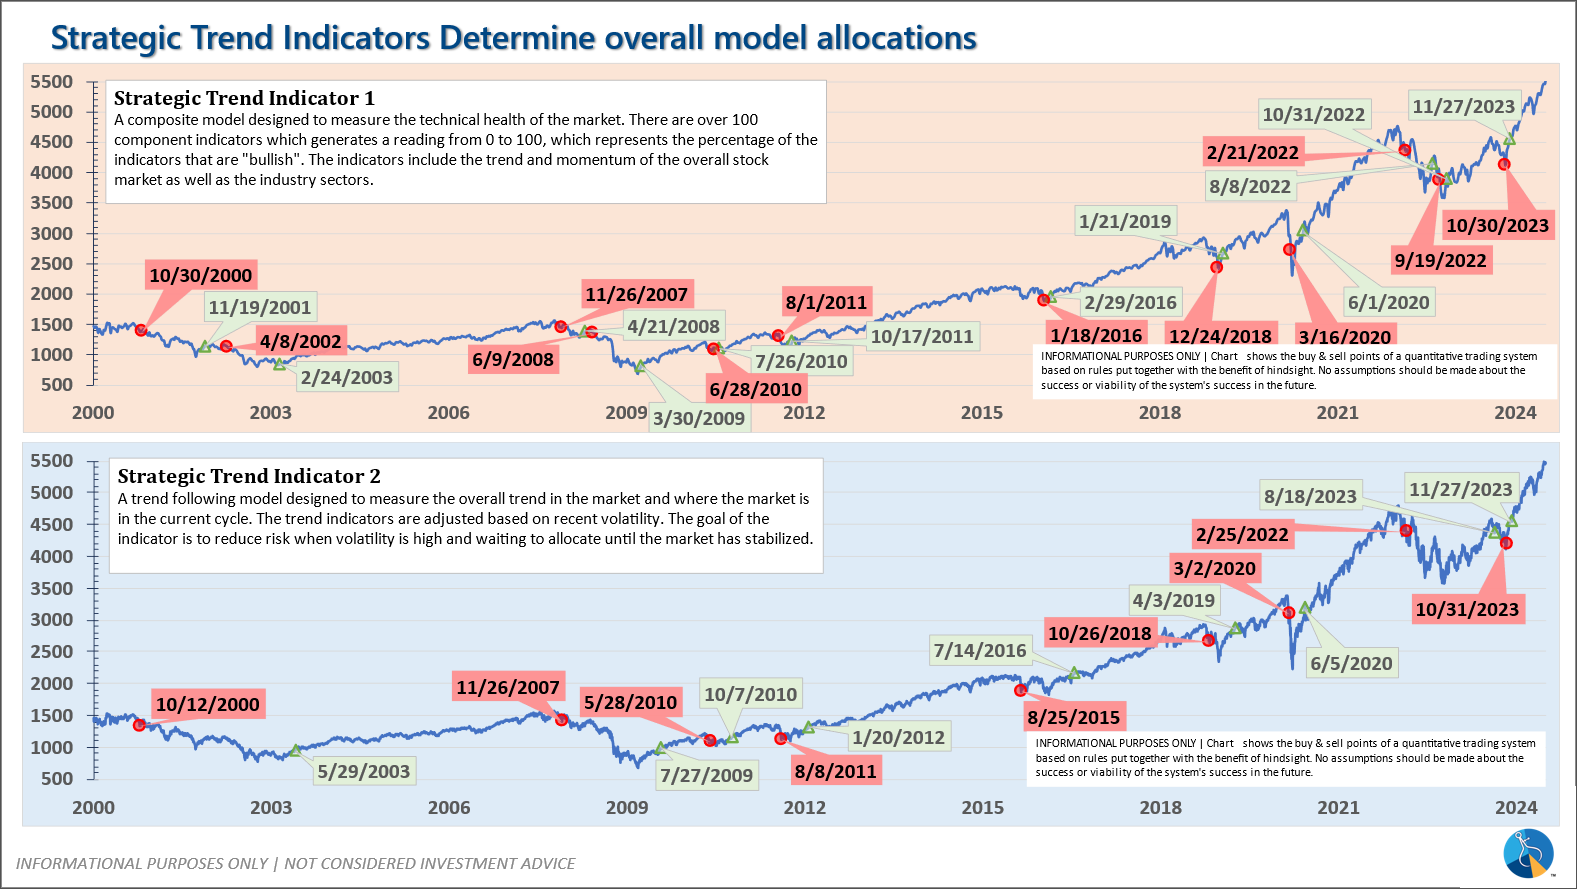
-Strategic Trend Models went on a buy 11/27/2023; *NEW* 7/8/24 – small and mid-cap positions eliminated with latest Core Rotation System update – money shifted to Large Cap Value (Dividend Growth) & International Funds
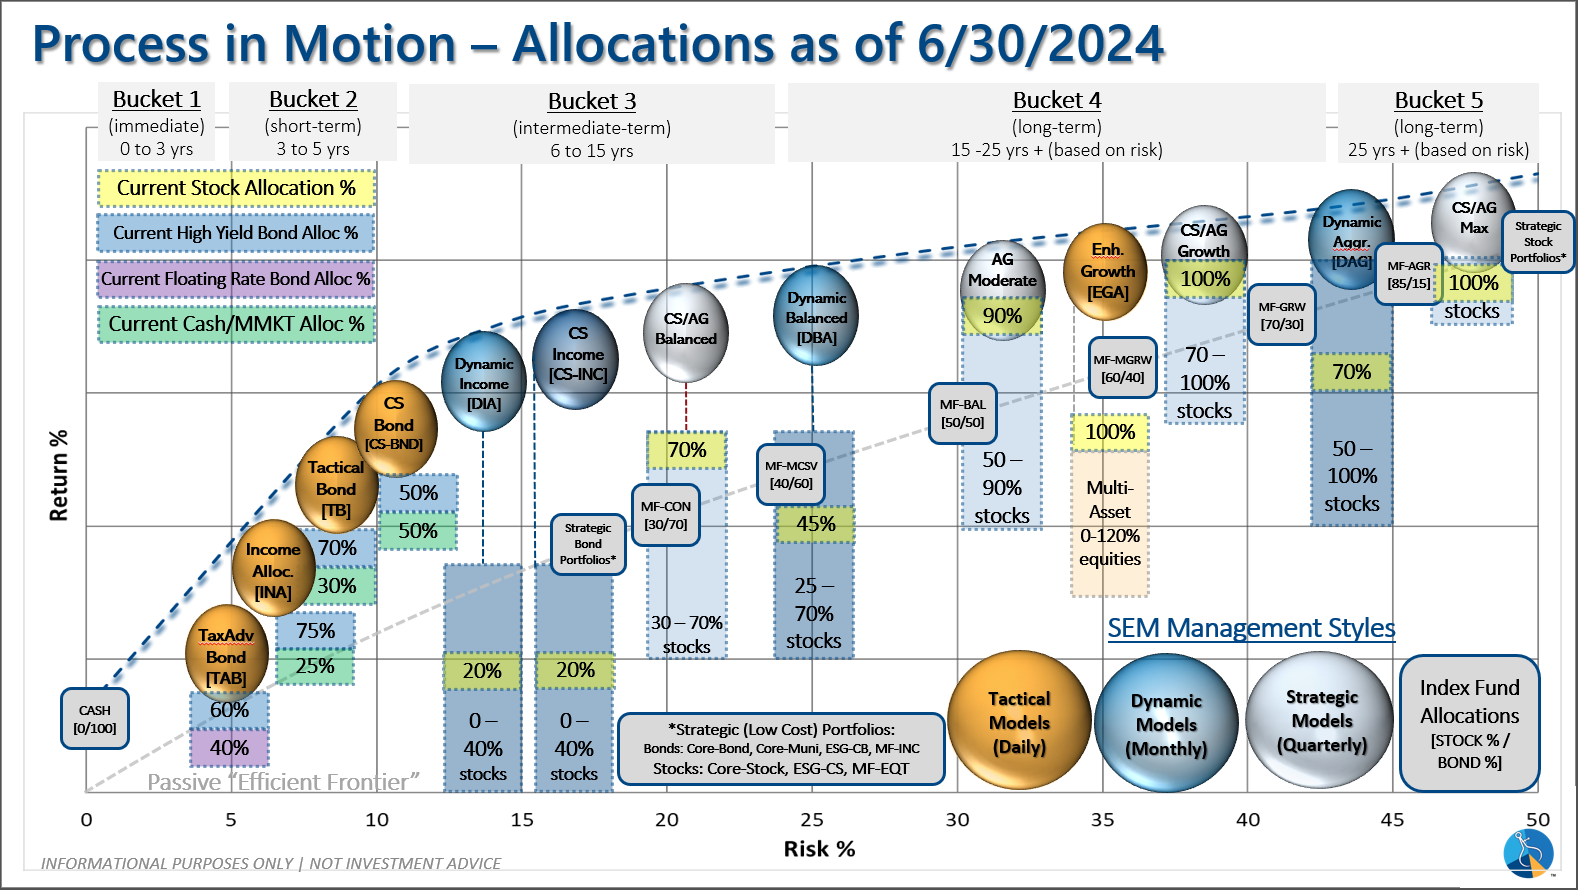
SEM deploys 3 distinct approaches – Tactical, Dynamic, and Strategic. These systems have been described as 'daily, monthly, quarterly' given how often they may make adjustments. Here is where they each stand.
Tactical (daily): On 5/6/24 about half of the signals in our high yield models switched to a buy. The other half remains in money market funds. The money market funds we are currently invested in are yielding between 4.8-5.3% annually.
Dynamic (monthly): The economic model was 'neutral' since February. In early May the model moved slightly negative, but reversed back to 'neutral' in June. This means 'benchmark' positions – 20% dividend stocks in Dynamic Income and 20% small cap stocks in Dynamic Aggressive Growth. The interest rate model is slightly 'bullish'.
Strategic (quarterly)*: BOTH Trend Systems reversed back to a buy on 11/27/2023
The core rotation is adjusted quarterly. On August 17 it rotated out of mid-cap growth and into small cap value. It also sold some large cap value to buy some large cap blend and growth. The large cap purchases were in actively managed funds with more diversification than the S&P 500 (banking on the market broadening out beyond the top 5-10 stocks.) On January 8 it rotated completely out of small cap value and mid-cap growth to purchase another broad (more diversified) large cap blend fund along with a Dividend Growth fund.
The * in quarterly is for the trend models. These models are watched daily but they trade infrequently based on readings of where each believe we are in the cycle. The trend systems can be susceptible to "whipsaws" as we saw with the recent sell and buy signals at the end of October and November. The goal of the systems is to miss major downturns in the market. Risks are high when the market has been stampeding higher as it has for most of 2023. This means sometimes selling too soon. As we saw with the recent trade, the systems can quickly reverse if they are wrong.
Overall, this is how our various models stack up based on the last allocation change:
Questions or comments - drop us a note?
Curious if your current investment allocation aligns with your overall objectives and risk tolerance? Take our risk questionnaire


