
The problem with the Fed telling the financial markets who have become Fed policy dependent over the past 10 years that they are "data dependent", is every single piece of data is viewed as "critical". Every data release has been under a microscope with giant leaps being made as to what it means for the Fed, inflation, and the economy.
A few weeks back the market was staging a strong rally even after the Fed held steady on rate cuts. The thought was the cuts were coming soon. Then a "disappointing" jobs report put the market in a free fall for a few days as everyone jumped to the conclusion the Fed was "too late" cutting rates and could not avoid a recession. This was followed by an often-ignored initial jobless claims number that showed slight improvement and the market was off to the races once again.
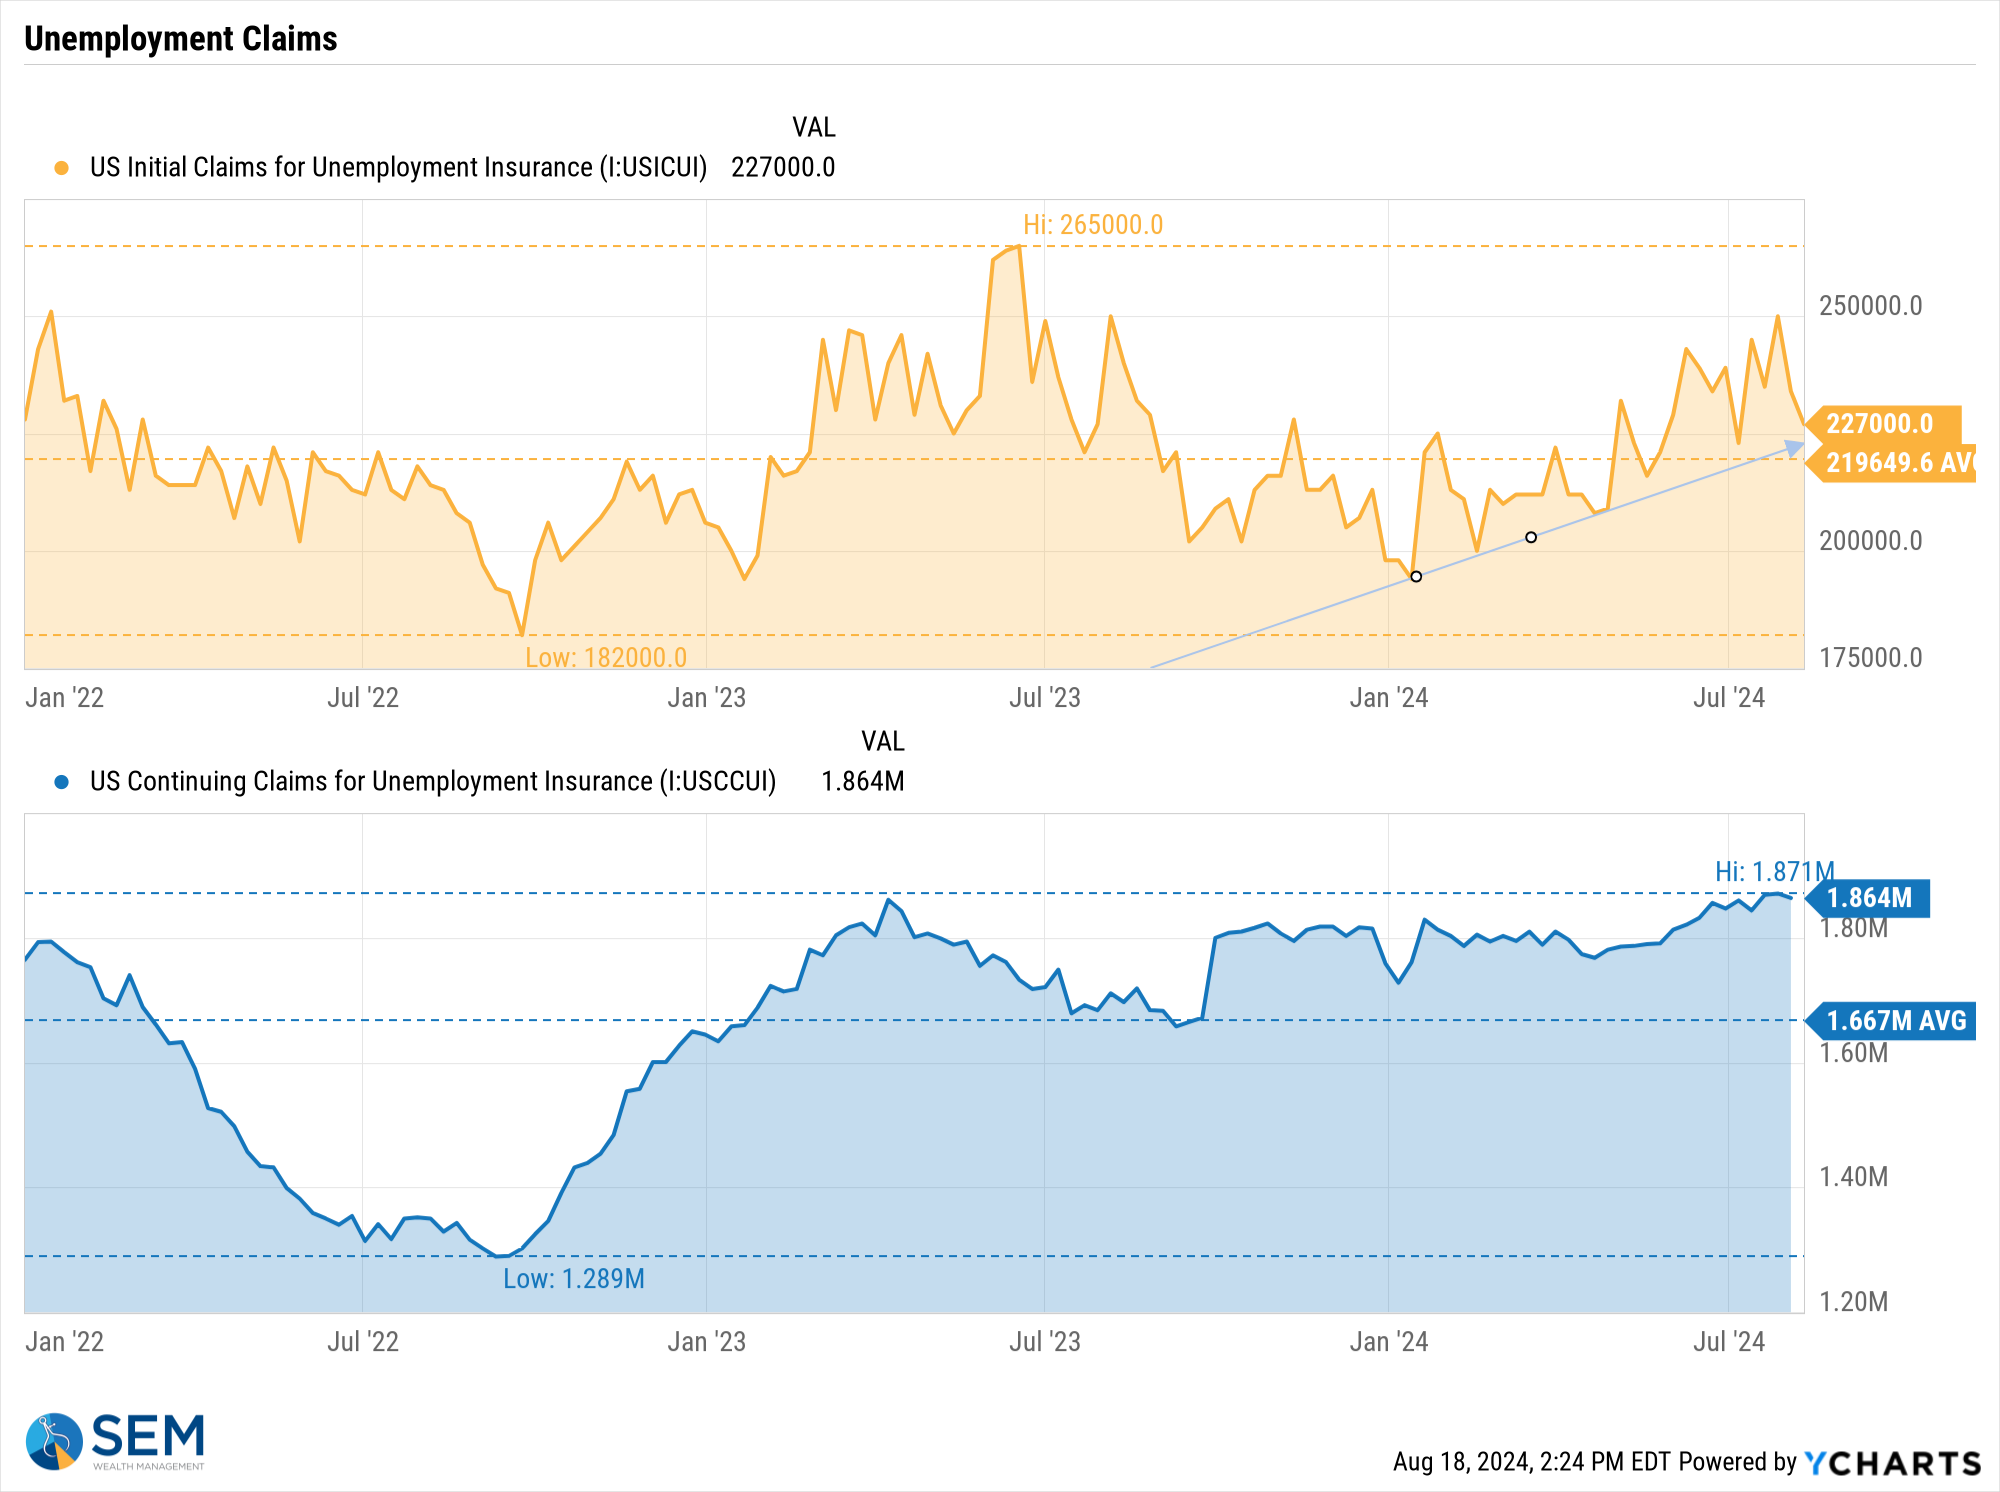
Since then we've seen "in-line" inflation readings and "better than expected" retail sales numbers. This has allowed the stock market to recover 2/3 of the 6% loss sparked by recession fears. The chart of unemployment claims tells a different story, in my opinion. The overall pace of initial unemployment claims is climbing (bad news) and the continuing claims number is near a 1-year high (worse news). The weekly fluctuations are noise unless we truly break the upward climb in claims.
Hopefully our readers have learned by now a few things:
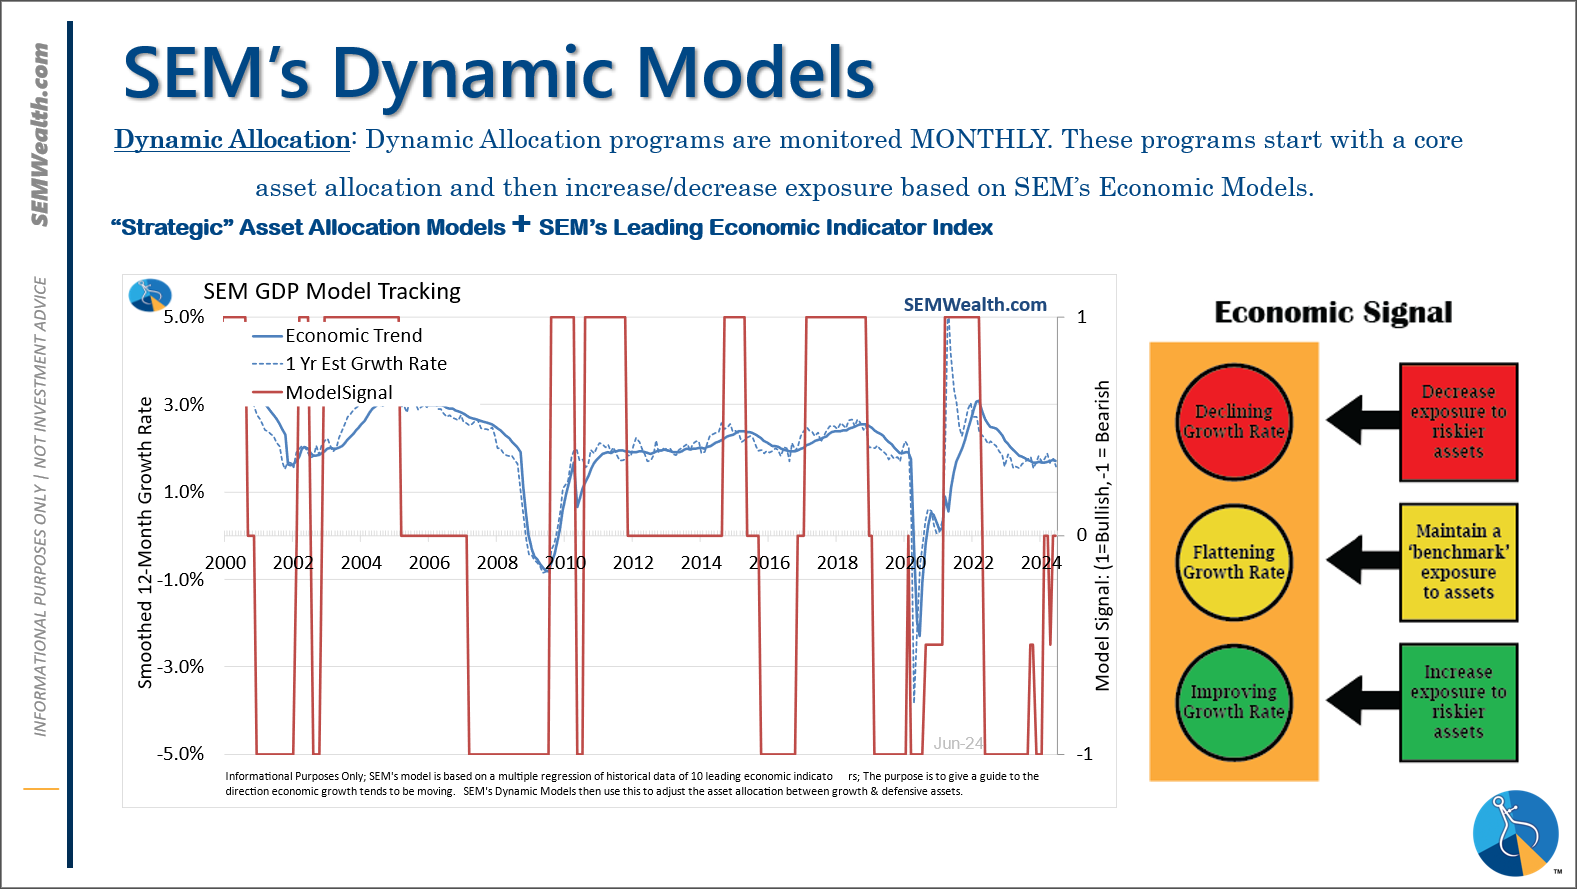
1.) No single data point can correctly predict the economy (which is why we use 10 leading indicators in our quantitative economic model).
2.) One month in any set of data points does not make a trend (which is why we have statistical smoothing techniques in our quantitative economic model).
We've not seen anything significant develop over the past two weeks to change our economic model – check out the latest update here. Likewise, we have not seen anything improve enough to justify the nearly record high valuation levels for the stock market. This leaves us right back where we were a few weeks back:
1.) The economy is slowing, but not entering a recession.
2.) Stocks are pricing in ABOVE average economic growth.
3.) Due to #2 above, stocks are at EXTREMELY high valuation levels.
Over-valued readings for stocks are not good timing mechanisms. They instead are very good at predicting long-term returns from that starting point. Right now we should EXPECT 10-year TOTAL returns for stocks to be WELL BELOW AVERAGE – until we see a major correction which makes the likelihood of ABOVE AVERAGE returns much higher. Patience is the key.
Despite the emotional and return whiplash the past several weeks, our systems have not flinched. For more on the markets and how we are positioned, check out the next two sections below.
Market Charts
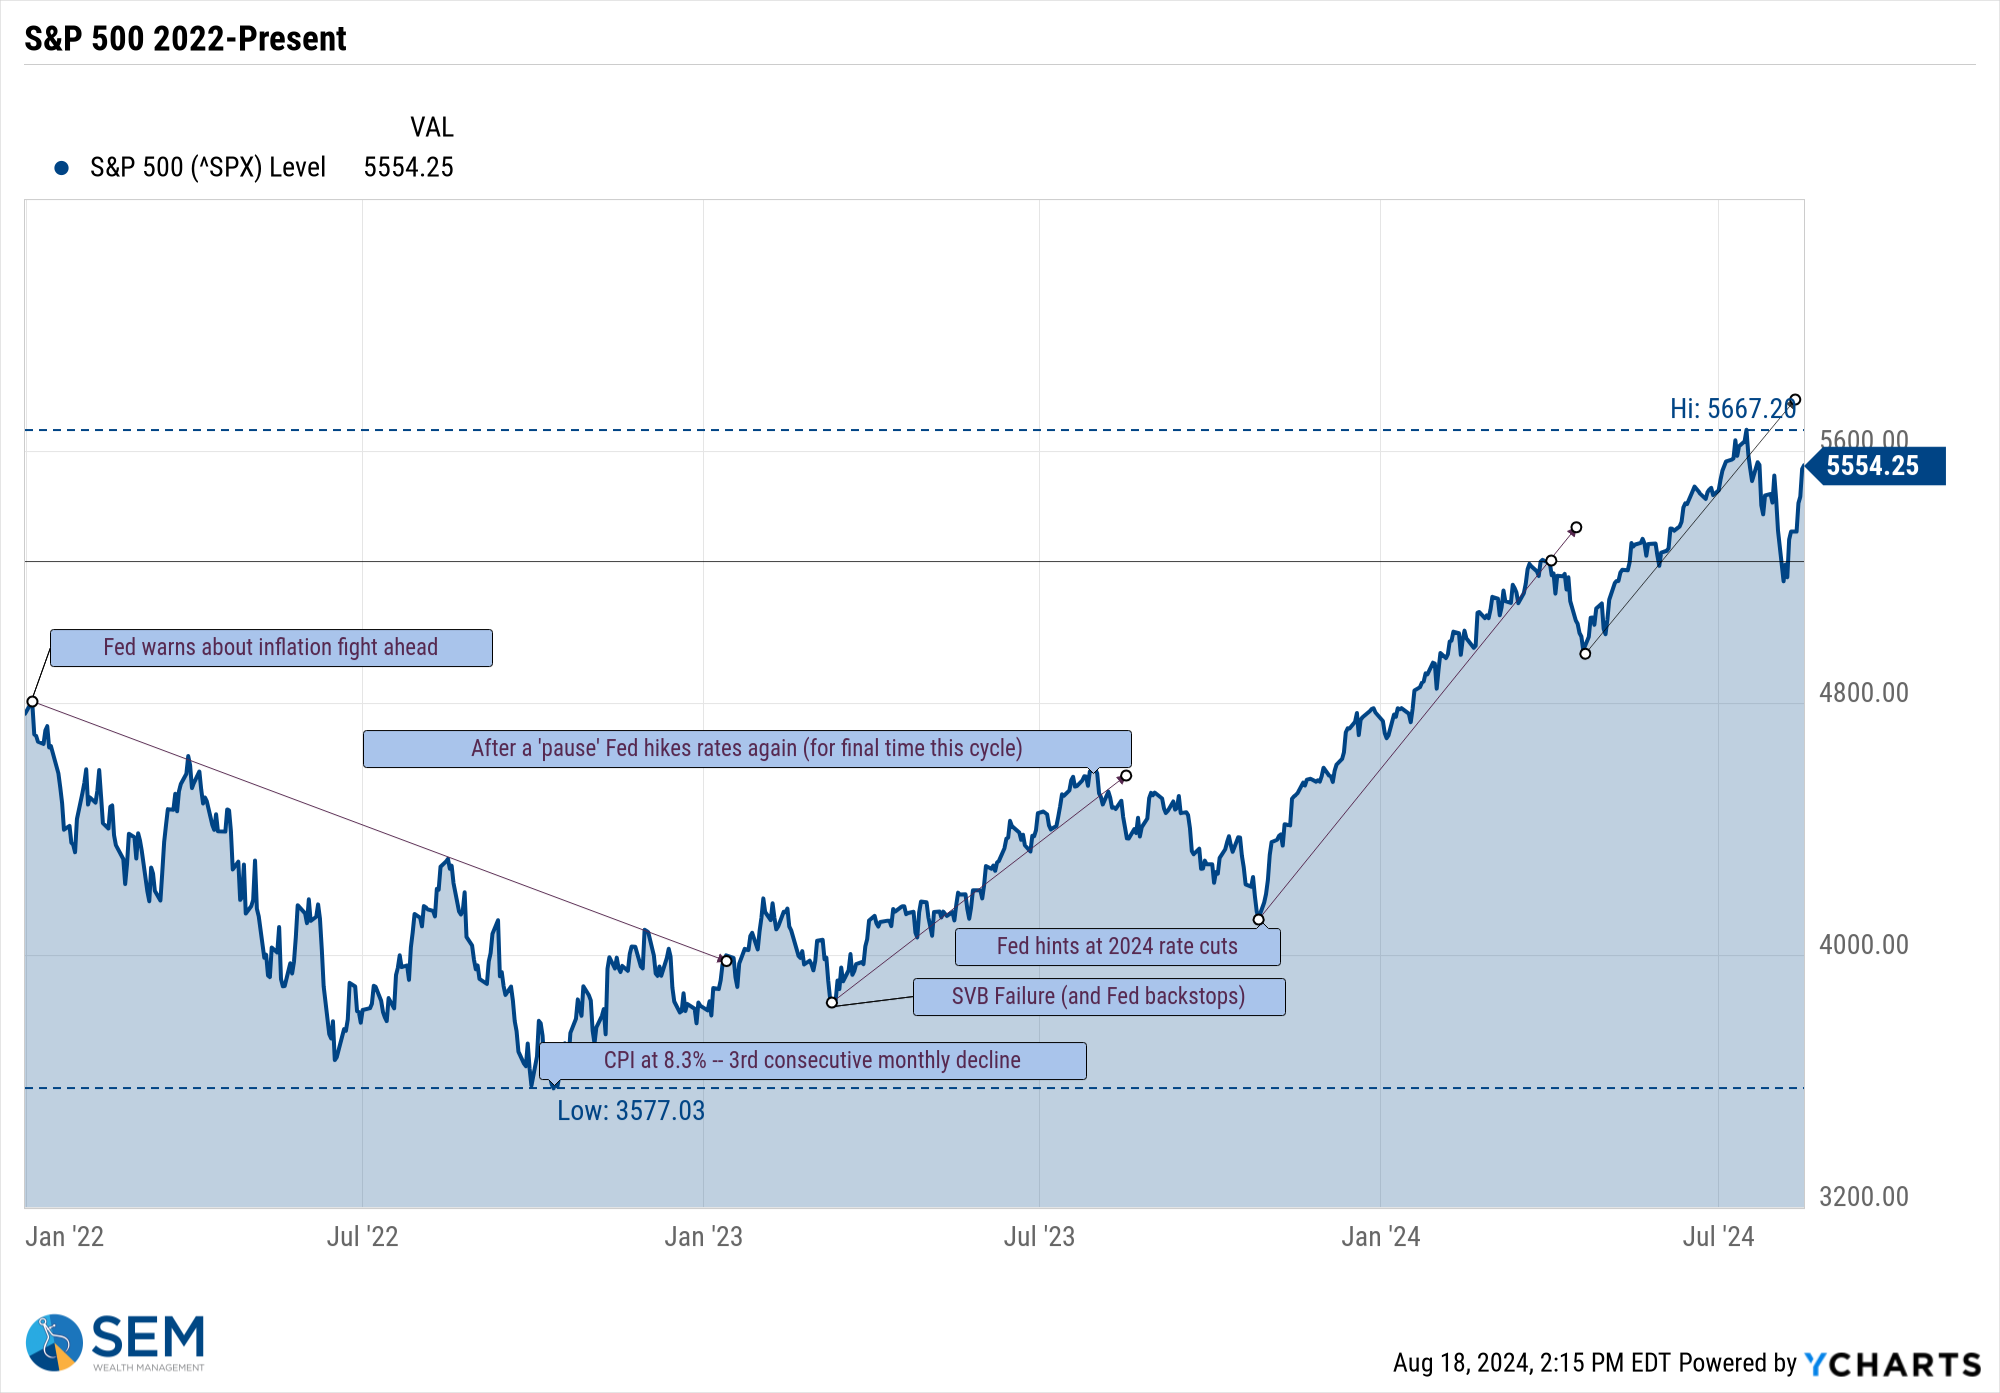
The mega-cap growth heavy S&P 500 chart shows the data whiplash quite clearly.
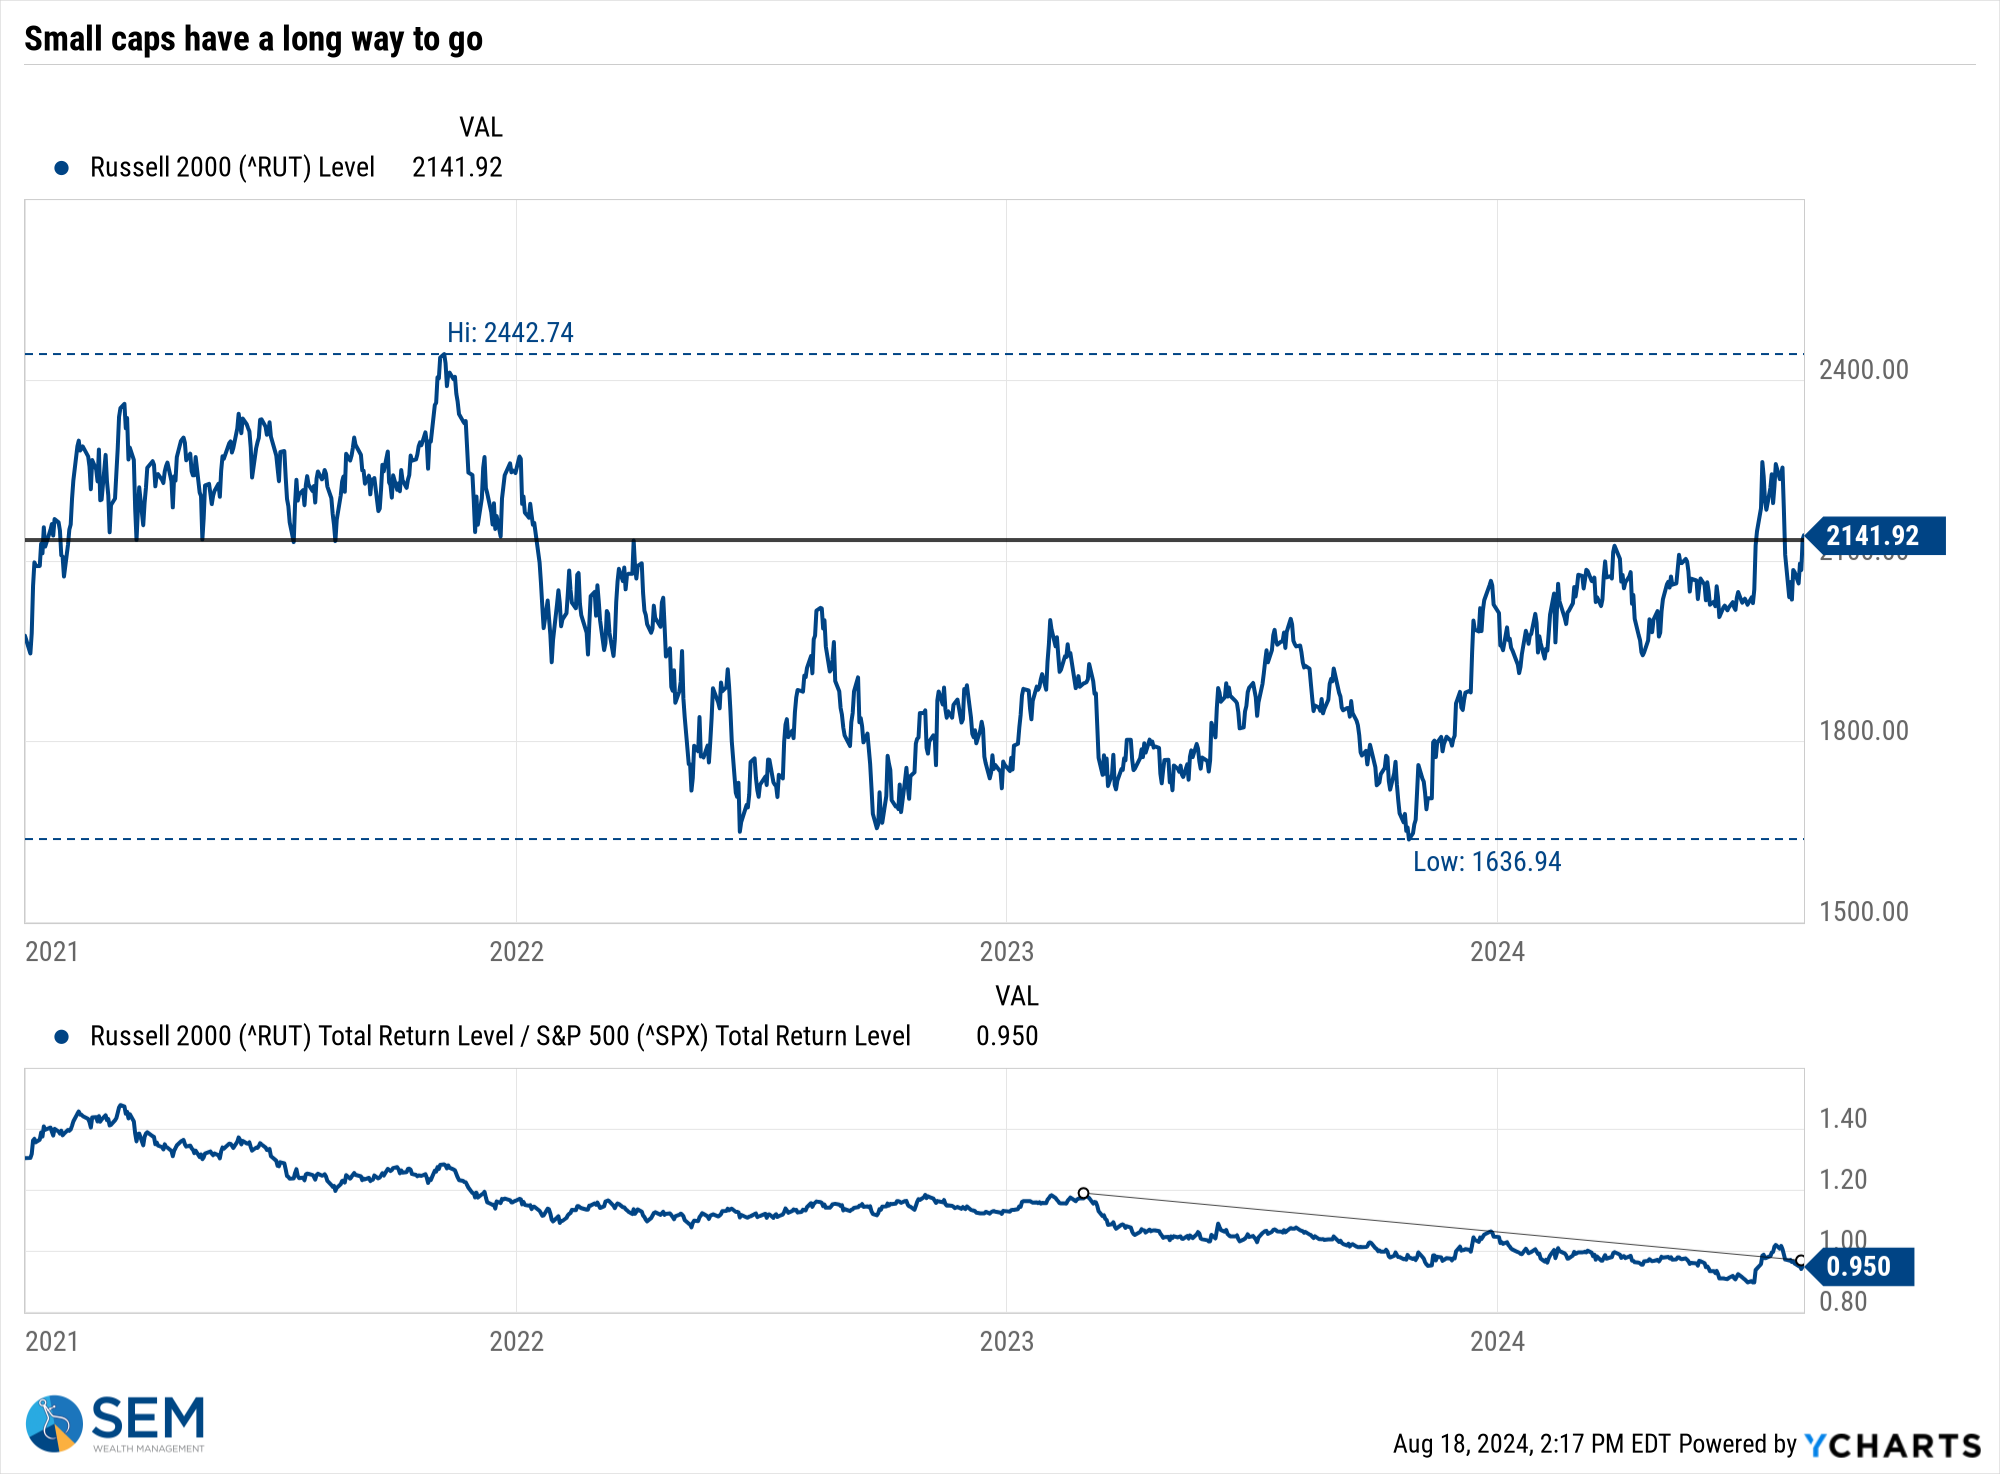
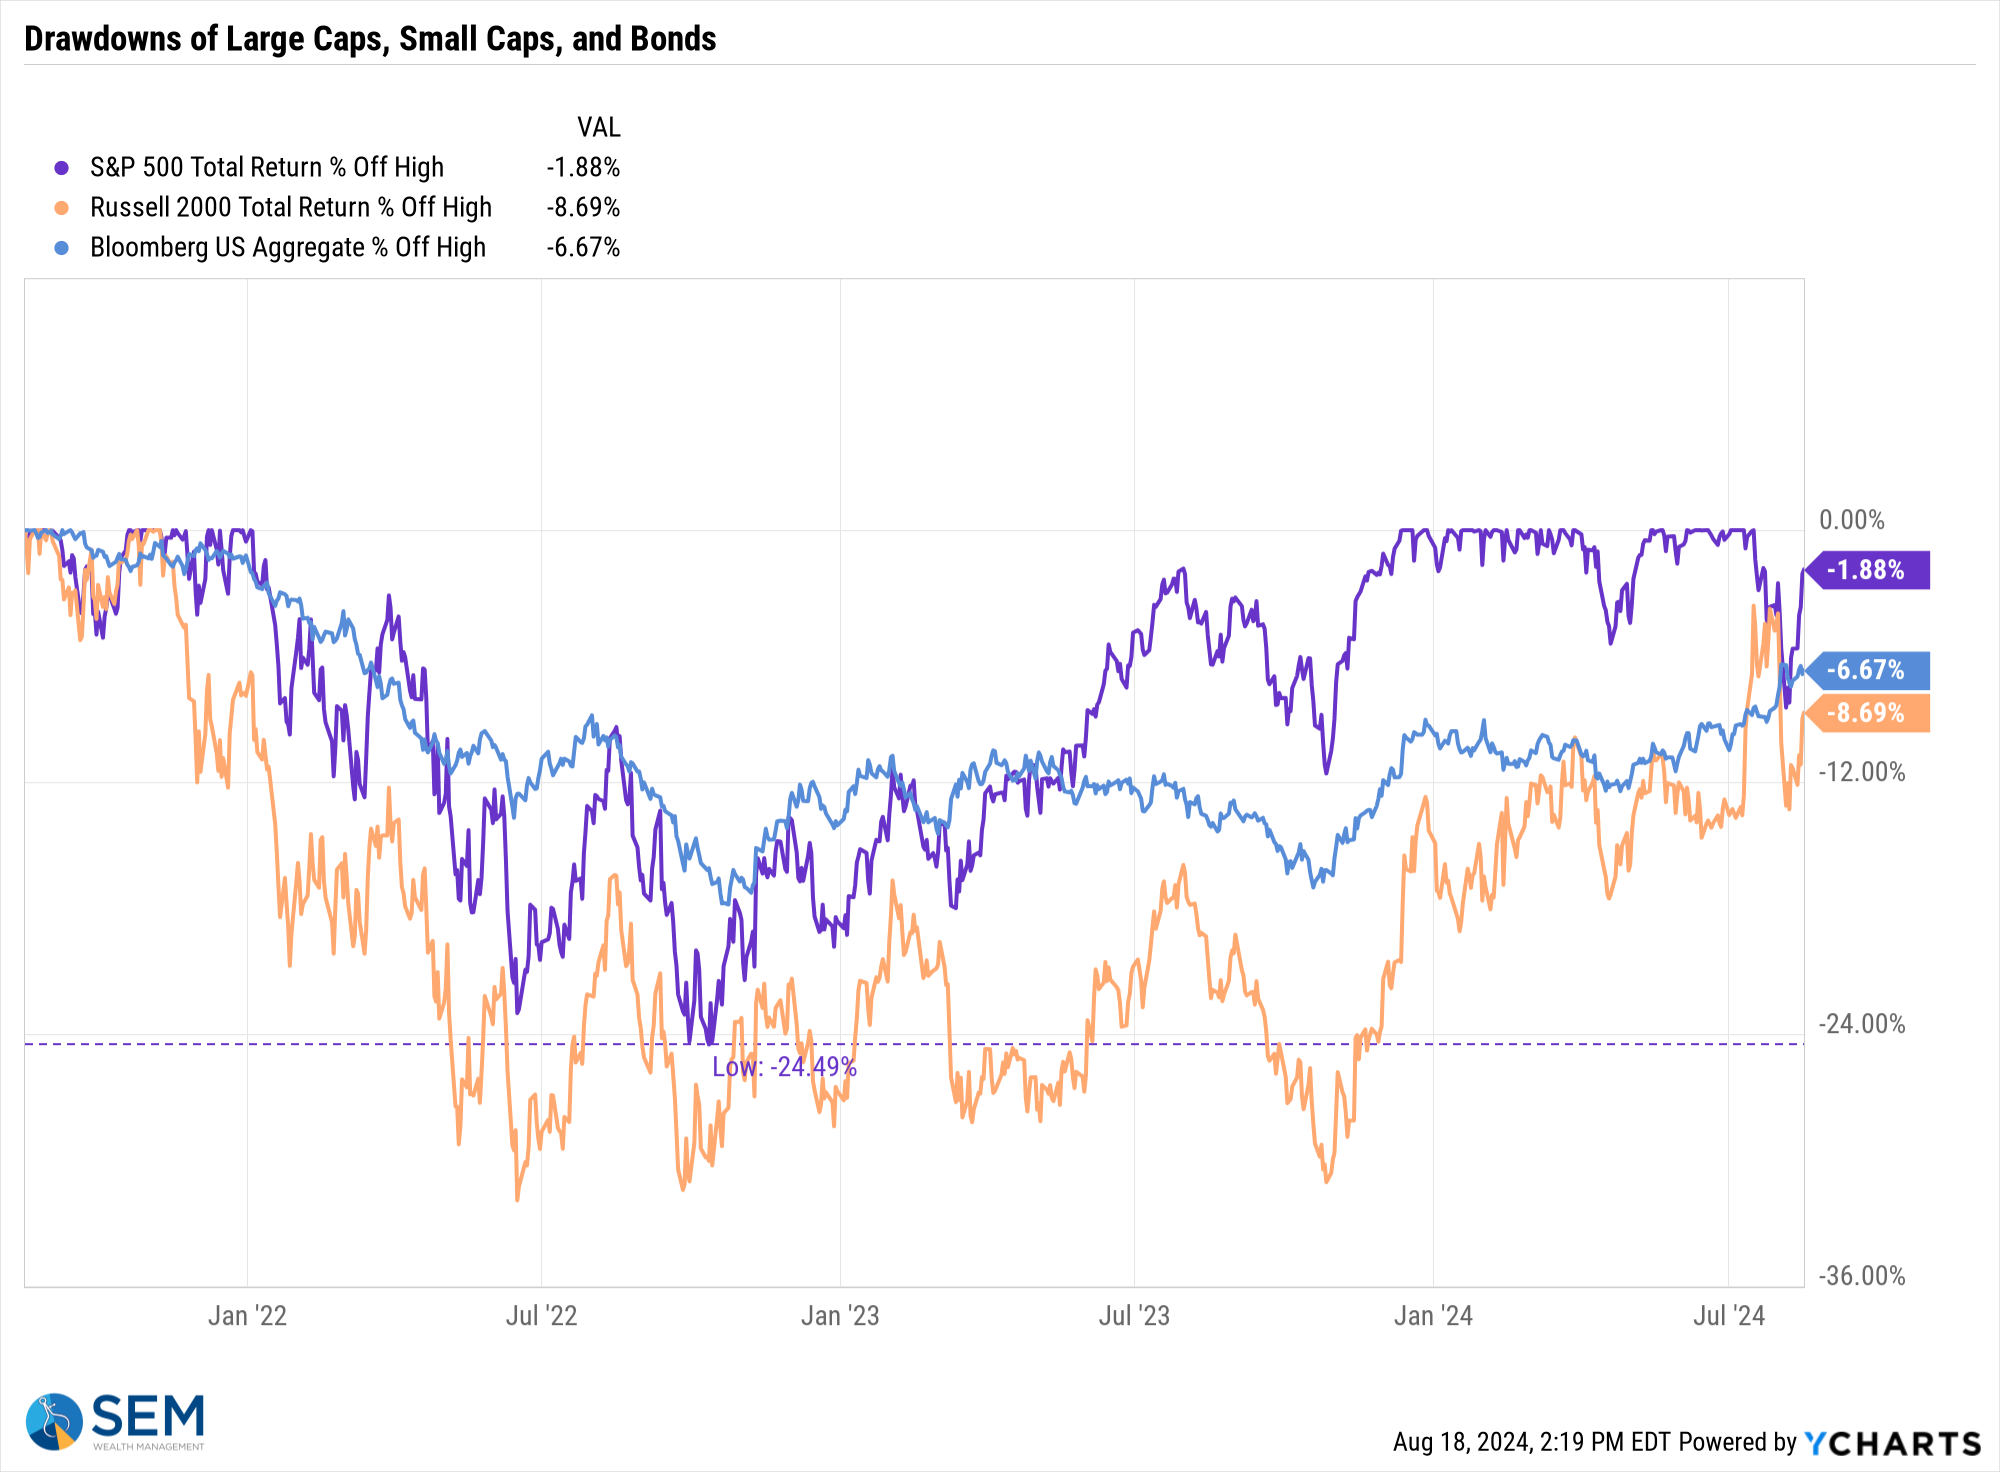
After enjoying a brief period of outperformance versus large caps, small caps are once again lagging, which is not a good sign for INVESTORS expecting stocks to be able to withstand a slowing economy.
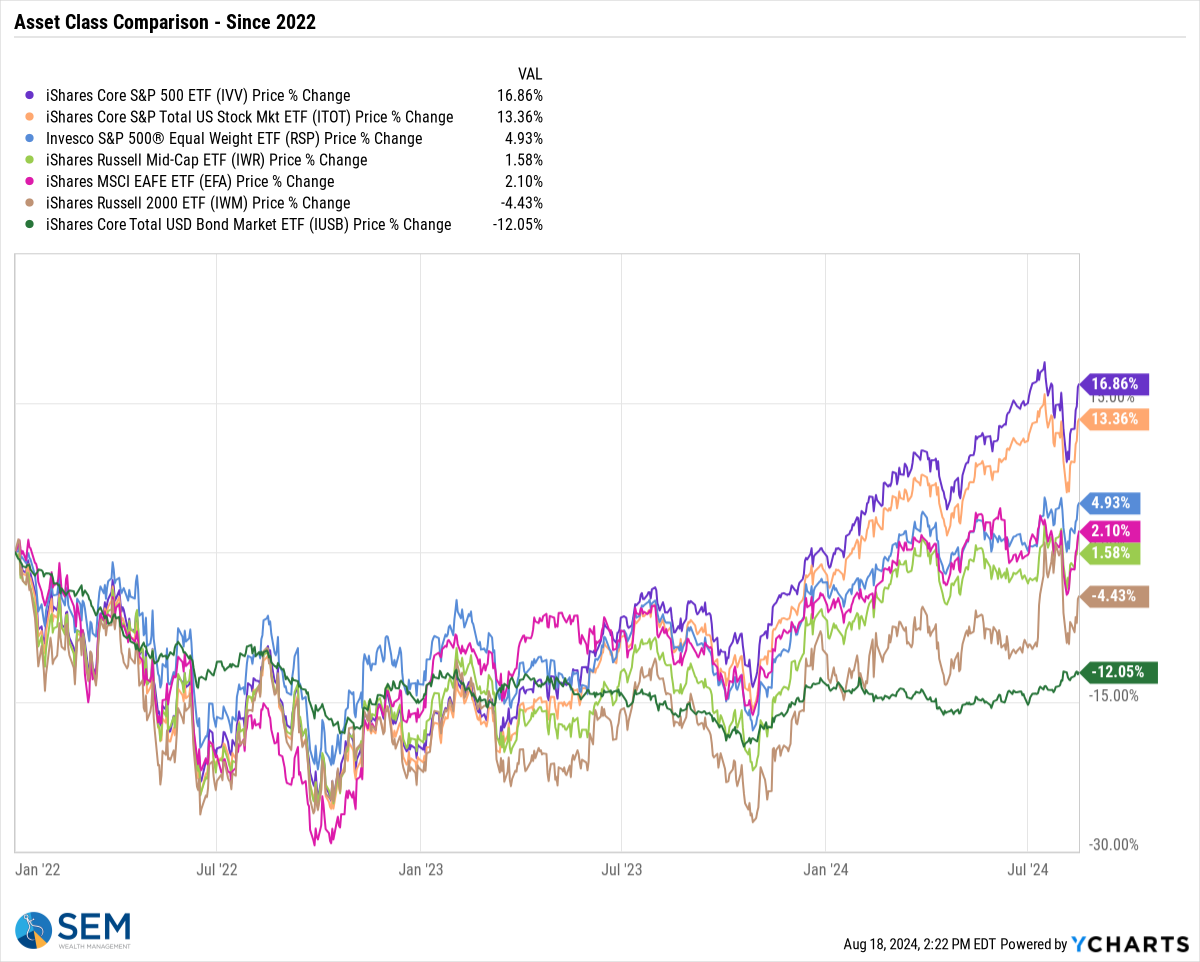
This chart shows the performance of various asset classes since the end of 2021. There is a very wide disparity.
The 'drawdown' chart also illustrates the different experiences of the major asset classes.
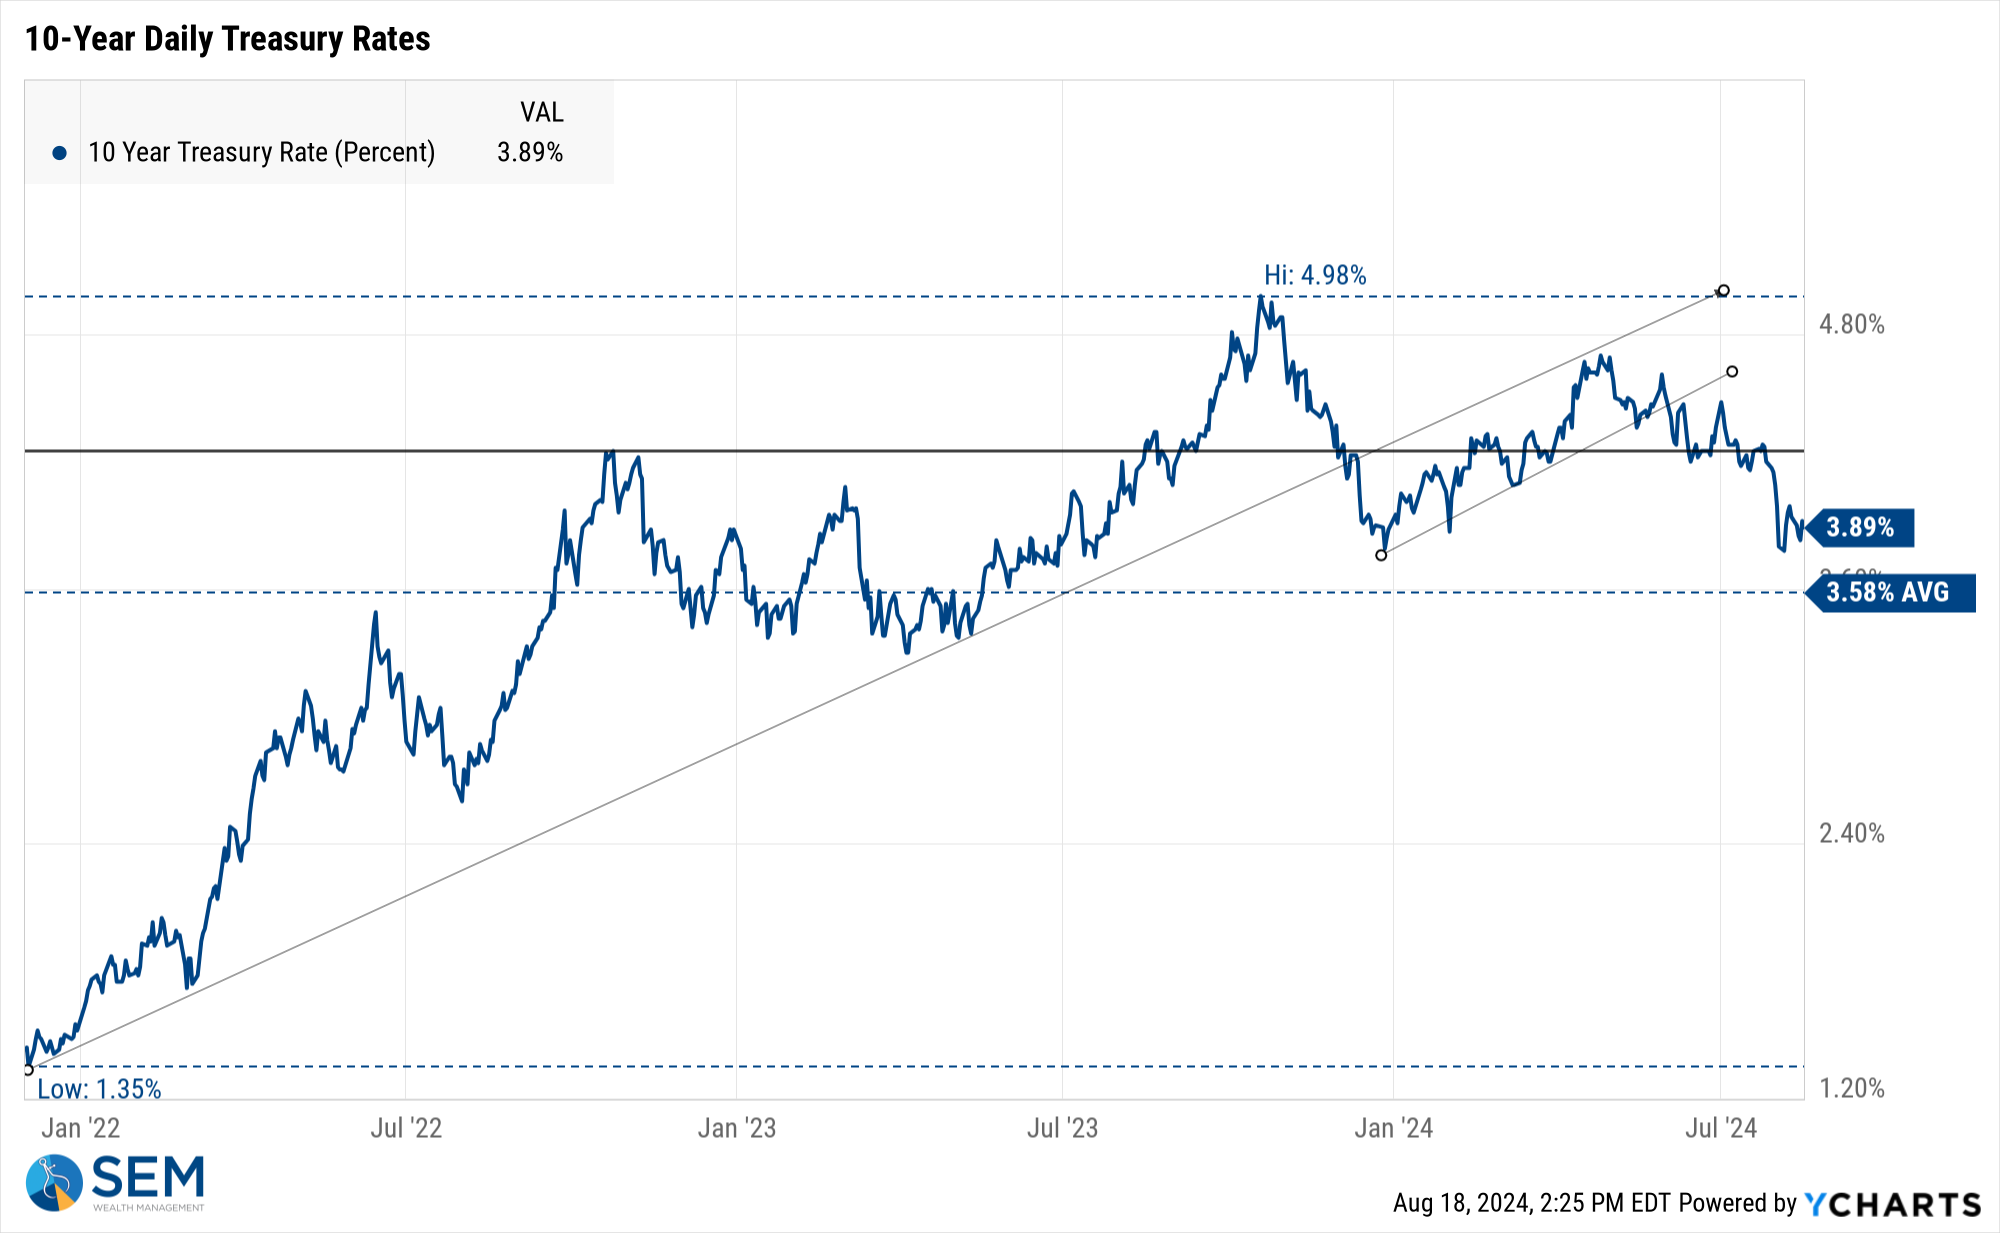
Turning to bonds, the 10-year Treasury yield while off the lows continues in a nice downtrend.
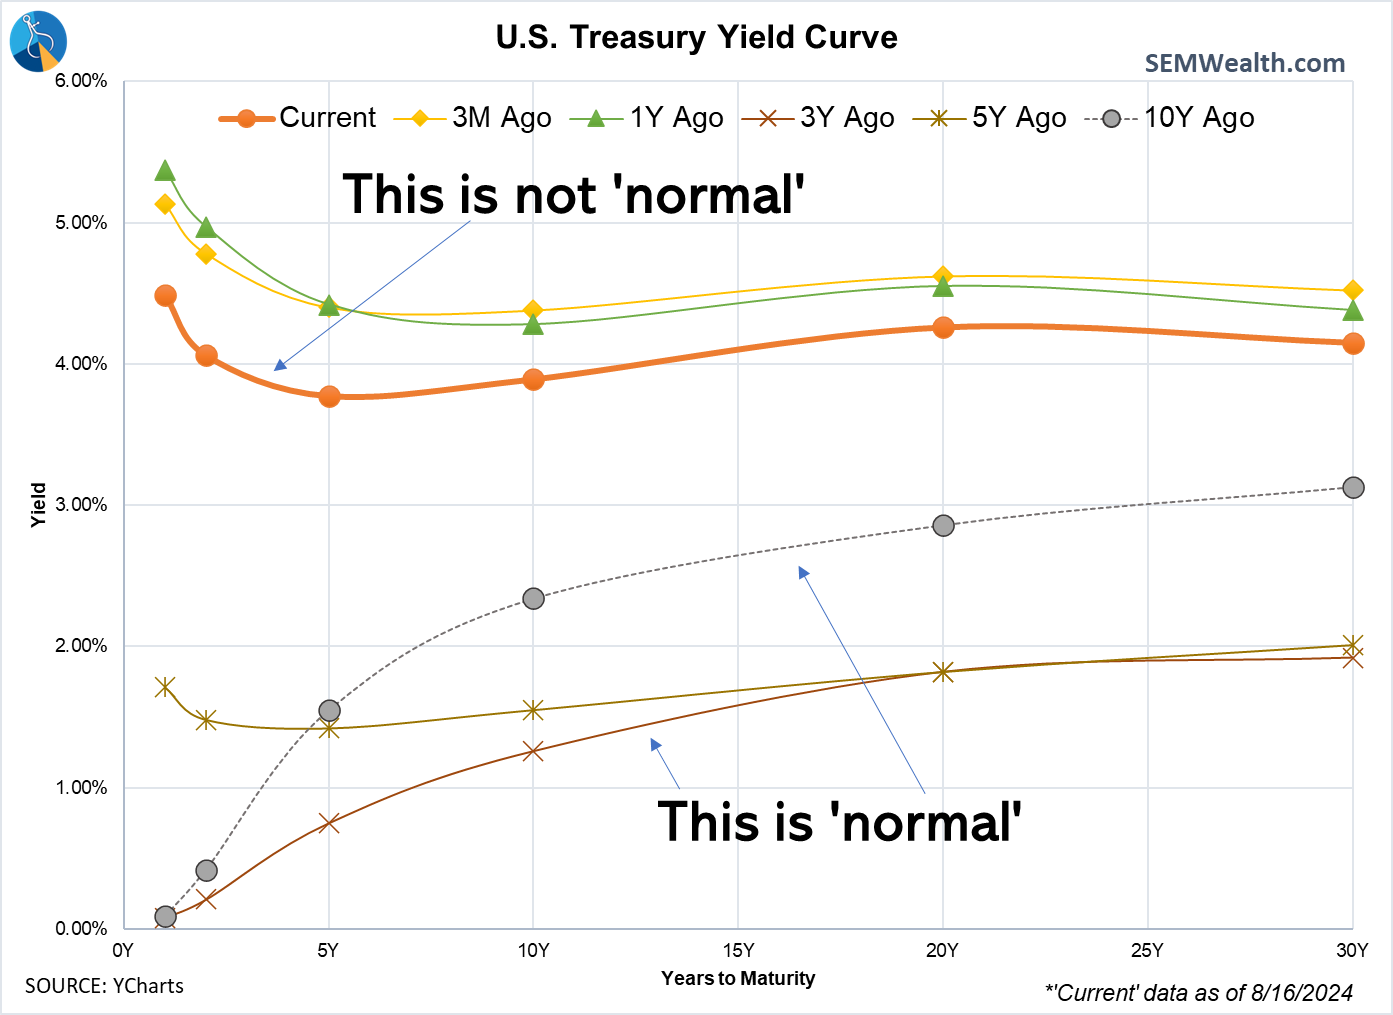
The yield curve remains "abnormal". We should remember this any time we are making decisions based on TODAY's environment, especially when it comes to fixed income investments. Things will revert to normal eventually and the longer we spend in "abnormal" territory, the more difficult that reversion will be.
SEM Model Positioning
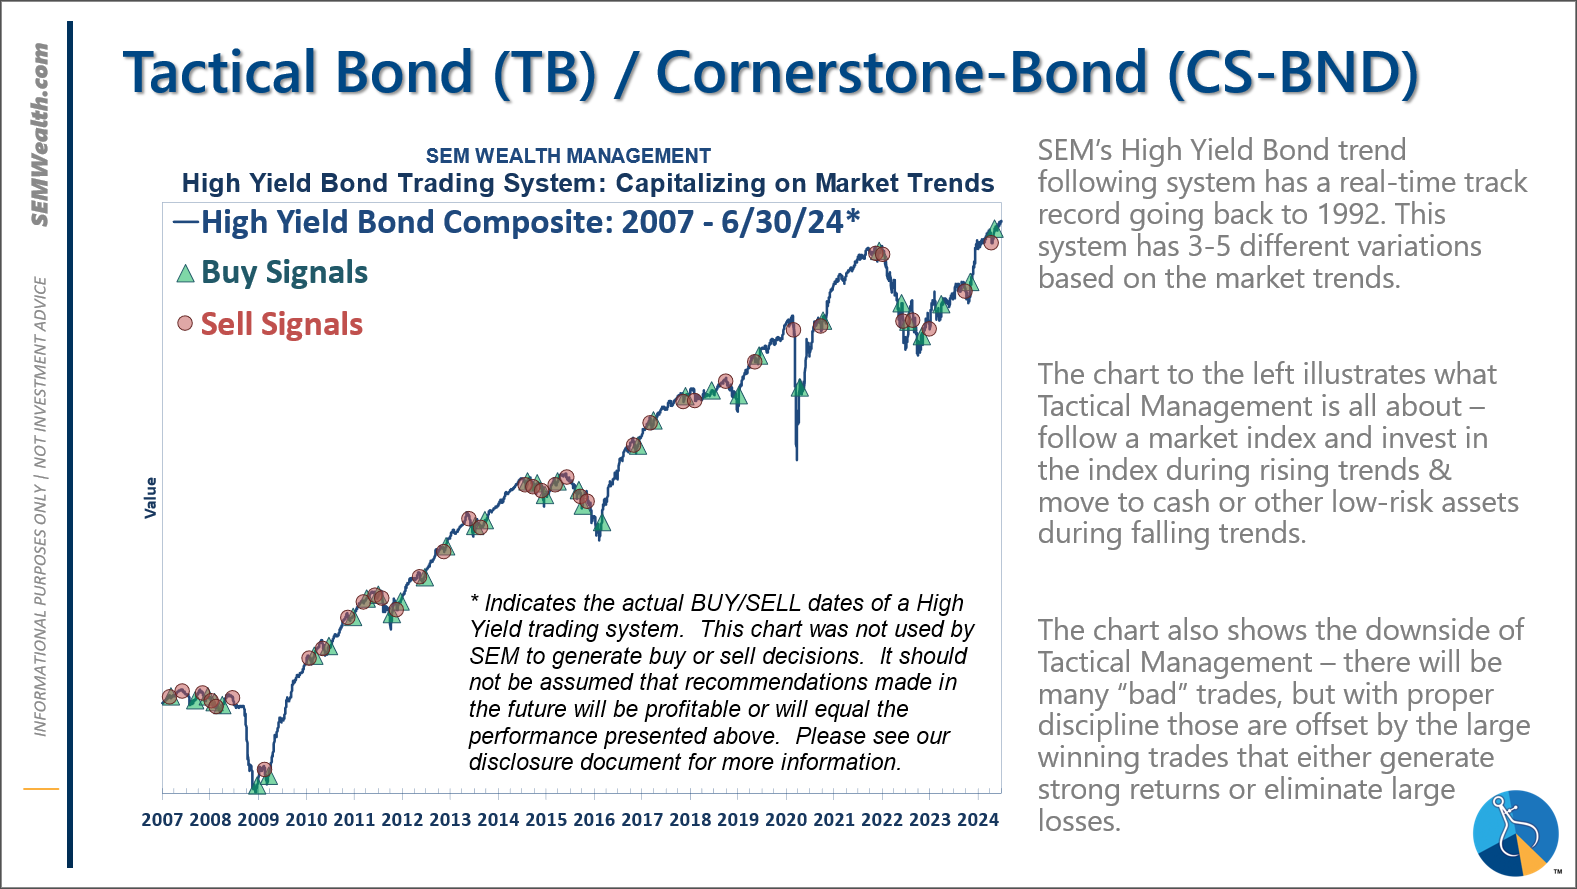
-Tactical High Yield had a partial buy signal on 5/6/24, reversing some of the sells on 4/16 & 17/2024 - the other portion of the signal remains on a sell as high yields continue to oscillate.
-Dynamic Models are 'neutral' as of 6/7/24, reversing the half 'bearish' signal from 5/3/2024. *NEW* 7/8/24 - interest rate model filled from partially bearish to partially bullish (lower long-term rates).
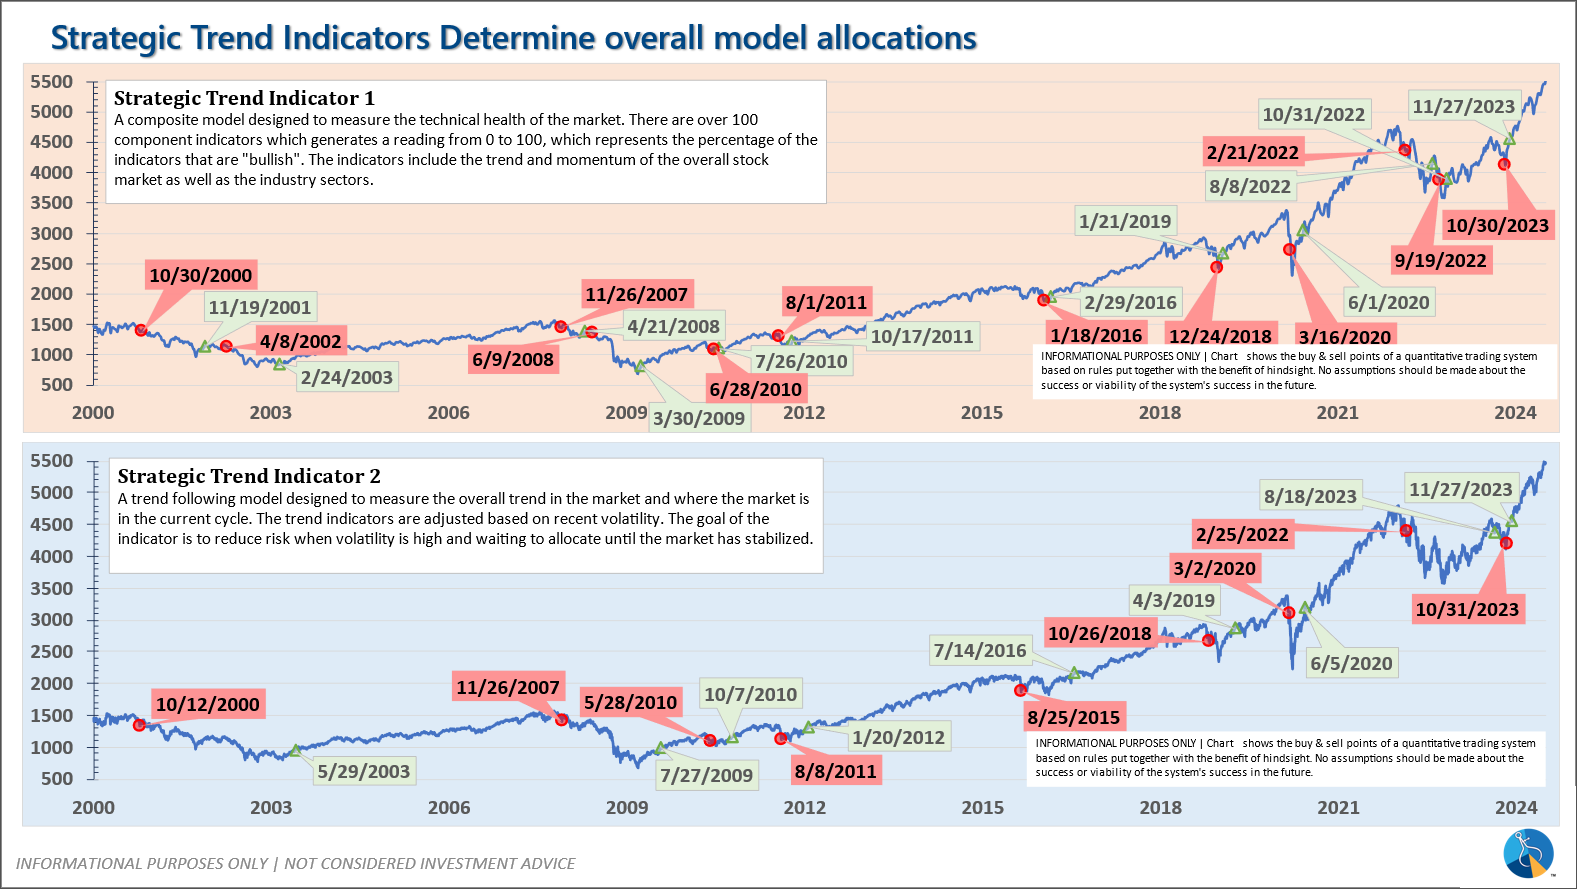
-Strategic Trend Models went on a buy 11/27/2023; *NEW* 7/8/24 – small and mid-cap positions eliminated with latest Core Rotation System update – money shifted to Large Cap Value (Dividend Growth) & International Funds
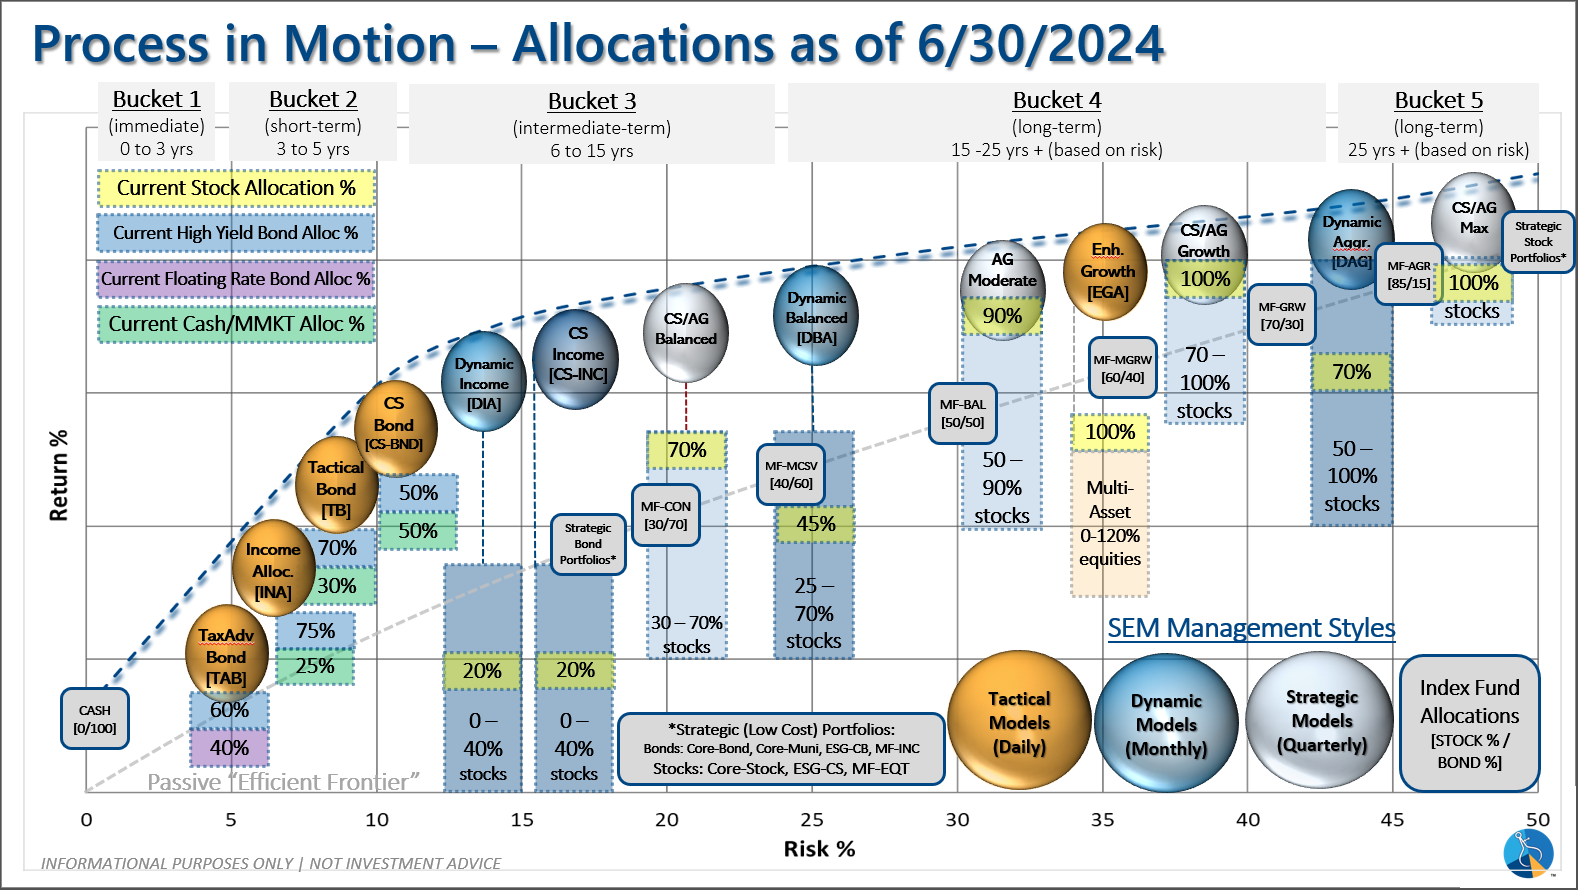
SEM deploys 3 distinct approaches – Tactical, Dynamic, and Strategic. These systems have been described as 'daily, monthly, quarterly' given how often they may make adjustments. Here is where they each stand.
Tactical (daily): On 5/6/24 about half of the signals in our high yield models switched to a buy. The other half remains in money market funds. The money market funds we are currently invested in are yielding between 4.8-5.3% annually.
Dynamic (monthly): The economic model was 'neutral' since February. In early May the model moved slightly negative, but reversed back to 'neutral' in June. This means 'benchmark' positions – 20% dividend stocks in Dynamic Income and 20% small cap stocks in Dynamic Aggressive Growth. The interest rate model is slightly 'bullish'.
Strategic (quarterly)*: BOTH Trend Systems reversed back to a buy on 11/27/2023
The core rotation is adjusted quarterly. On August 17 it rotated out of mid-cap growth and into small cap value. It also sold some large cap value to buy some large cap blend and growth. The large cap purchases were in actively managed funds with more diversification than the S&P 500 (banking on the market broadening out beyond the top 5-10 stocks.) On January 8 it rotated completely out of small cap value and mid-cap growth to purchase another broad (more diversified) large cap blend fund along with a Dividend Growth fund.
The * in quarterly is for the trend models. These models are watched daily but they trade infrequently based on readings of where each believe we are in the cycle. The trend systems can be susceptible to "whipsaws" as we saw with the recent sell and buy signals at the end of October and November. The goal of the systems is to miss major downturns in the market. Risks are high when the market has been stampeding higher as it has for most of 2023. This means sometimes selling too soon. As we saw with the recent trade, the systems can quickly reverse if they are wrong.
Overall, this is how our various models stack up based on the last allocation change:
Questions or comments - drop us a note?
Curious if your current investment allocation aligns with your overall objectives and risk tolerance? Take our risk questionnaire


