The past few weeks we've discussed the current positioning of the market. Most investors like to believe they are following a 'buy low, sell high' philosophy, but too many times our emotions get the best of us and we end up buying high, which means our only hope is that we can sell even higher. Unfortunately, most investors end up buying high and selling low after the inevitable correction comes along that resets valuations back to where they should have been.
Check out parts 1 & 2 here:


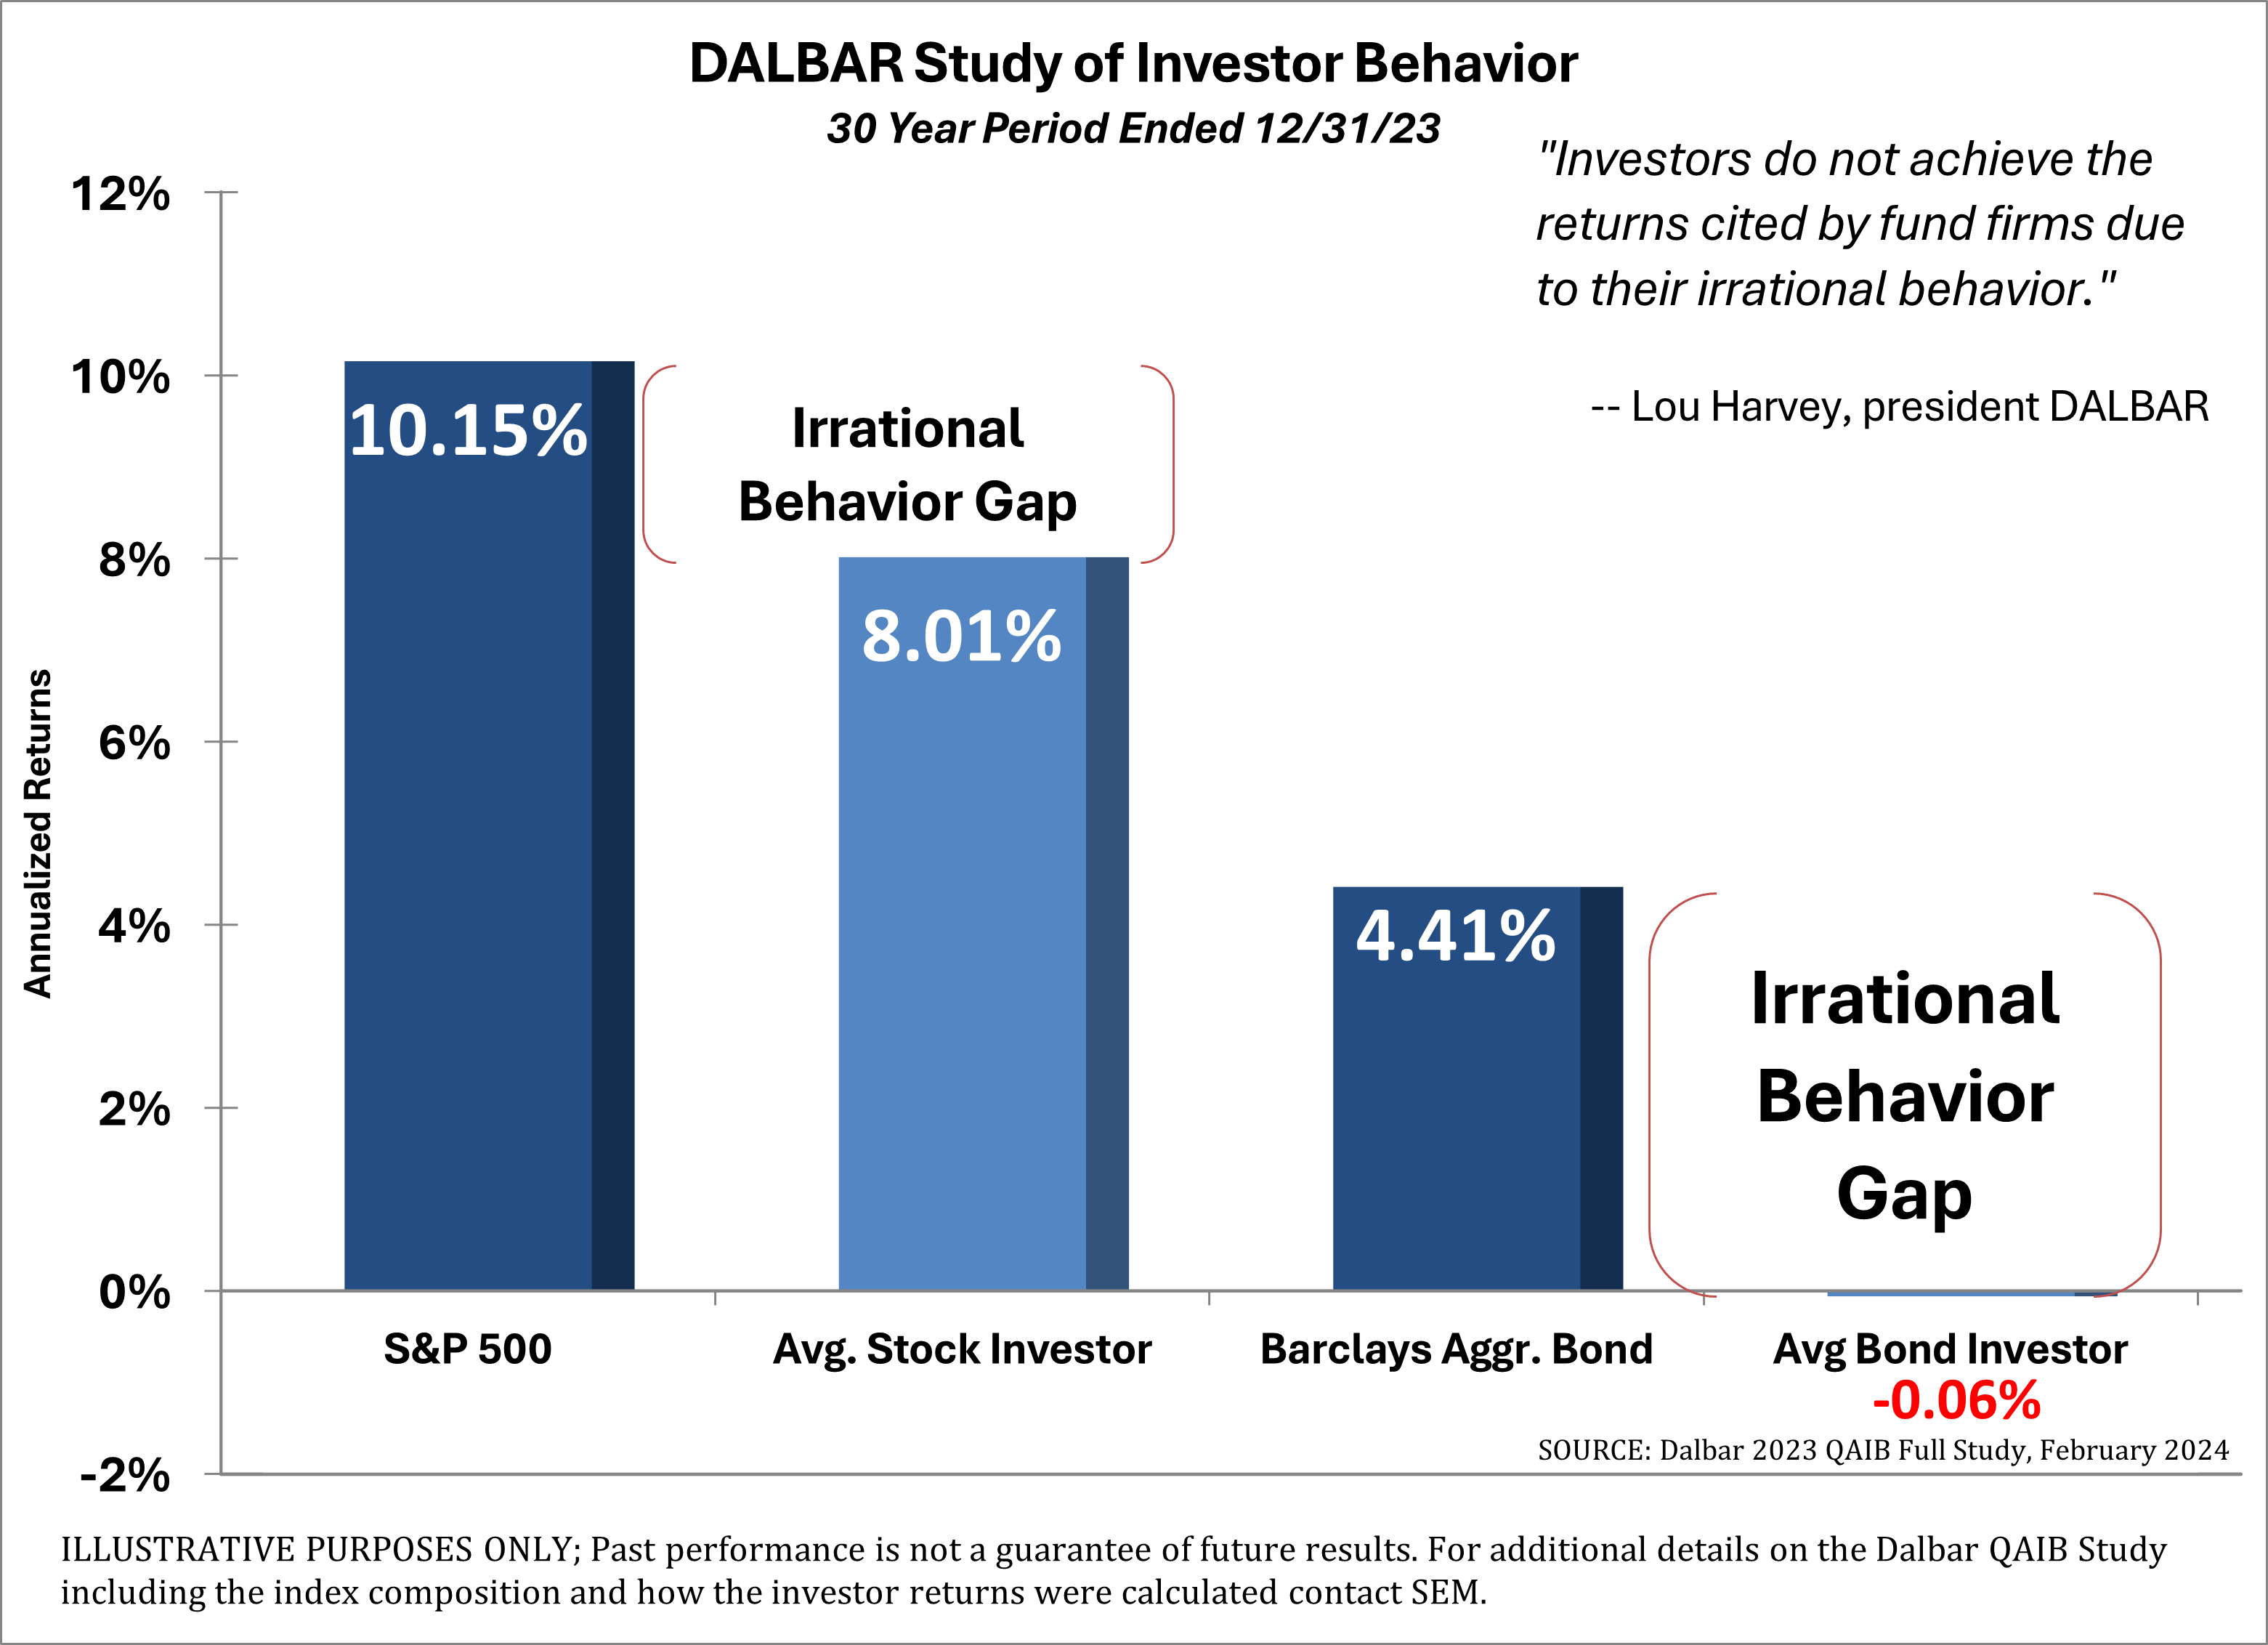
Over and over again the average investor ends up buying high and selling low. Few are able to buy high and sell at even higher prices. The DALBAR study shows the poor performance of the average investor despite decades of research that has told us to ignore the short-term fluctuations and 'the market always comes back'.
Last week we walked through some various valuation metrics and studied how well each predict the returns for the next 10-years. The most popular, the P/E ratio is actually the worst. The metrics which smooth out the business cycle, focus on the underlying economy, or are less easy to manipulate all have a much better history of predicting long-term returns. (The R-squared is how well the model 'fits').

Based on this data, we should expect the 10-year AVERAGE returns for stocks to range somewhere between +2% to -8%. This seems pretty dire and isn't necessarily what we would predict, but it does serve as a warning. Don't believe us? What about some bigger names such as Morningstar, Vanguard, and Blackrock? Here are what they are predicting for the next 10 years based on the current market environment?

Why do the biggest money managers in the world believe the next 10 years will be below average while individuals are optimistic? What ends up happening is fairly simple. During market bubbles, buying the dip always seems to be the right thing to do. Investors see the 'recent' time frame and believe "it's different this time." Look at the chart of the S&P 500 since 2009.

However, this is not the first time in recent history we've enjoyed stretches like this. In fact, based on valuation levels this is the third bubble in the last 35 years. When we zoom out back to 1990 we can see what happens when the high valuations are inevitably corrected back to more reasonable levels.
When valuations are too high, we don't end up compounding at below average rates every year for 10 years. Instead we end up having a large, scary correction in prices followed by years of clawing back up.

What should you do?
We can obviously not give out individual advice here. Everybody should have their own personalized plan. We can give you a few general statements:
- If you have a long (20+ year) time horizon none of this matters. Keep pouring money monthly into your investment accounts and let the power of compounding and economic growth benefit you.
- If you have a shorter-term time horizon (less than 10 years before you start using your investment dollars) you should probably have your portfolio stress tested to make sure you can endure (at best) returns about half the long-term average or (at worst) a 35-40% drop in stock values.
- If your time horizon is between 10 & 20 years your financial & investment plan SHOULD account for the likelihood of below average returns for a decade. If it doesn't, there could be a chance your plan doesn't work and adjustments need to be made.
If you are working with an SEM financial advisor and would like a check-up on your plan, click here. If you're not working with a financial advisor currently, let us know here and we can refer you to somebody in your area.
As you will note in the sections below, we are continuing to ride this wave higher as much as we can, but know from our experience and studying for history the good times will not last forever. This is one of the most dangerous times to be an investor valuation wise. When you add in the possible volatility around the election and it gets even more difficult.
Speaking of the election, in case you missed it, here's the replay of our webinar discussing the election and its impact on the economy.
Market Charts
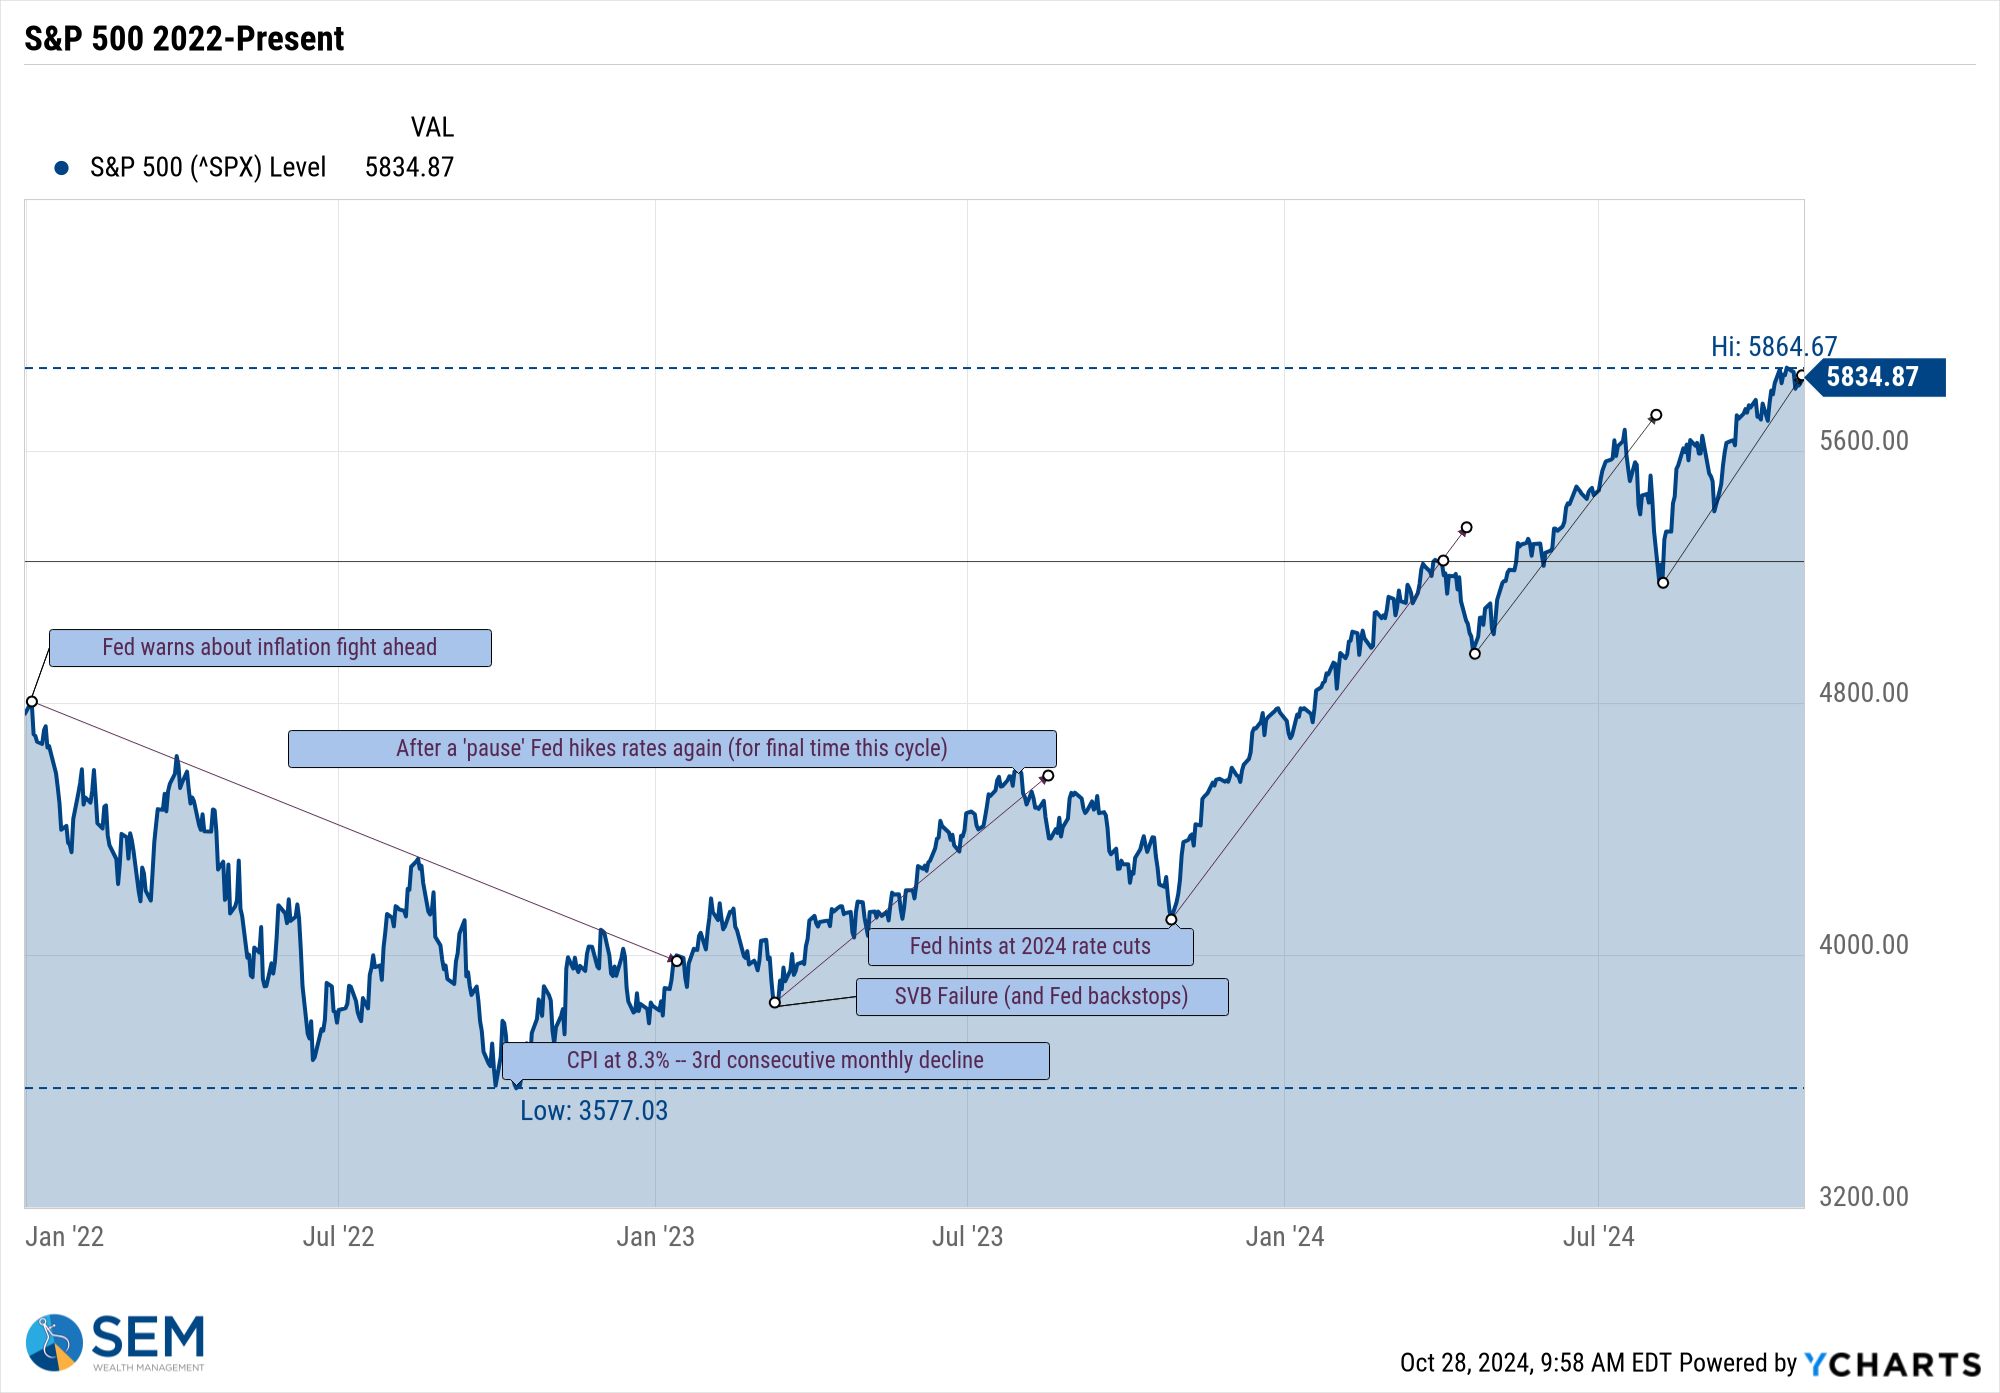
Readers should have this part memorized in 2024 – higher highs lead to higher highs......until something significant comes along to change the trend. Even though it was a slightly down week for stocks last week, we are still basically at all-time highs.
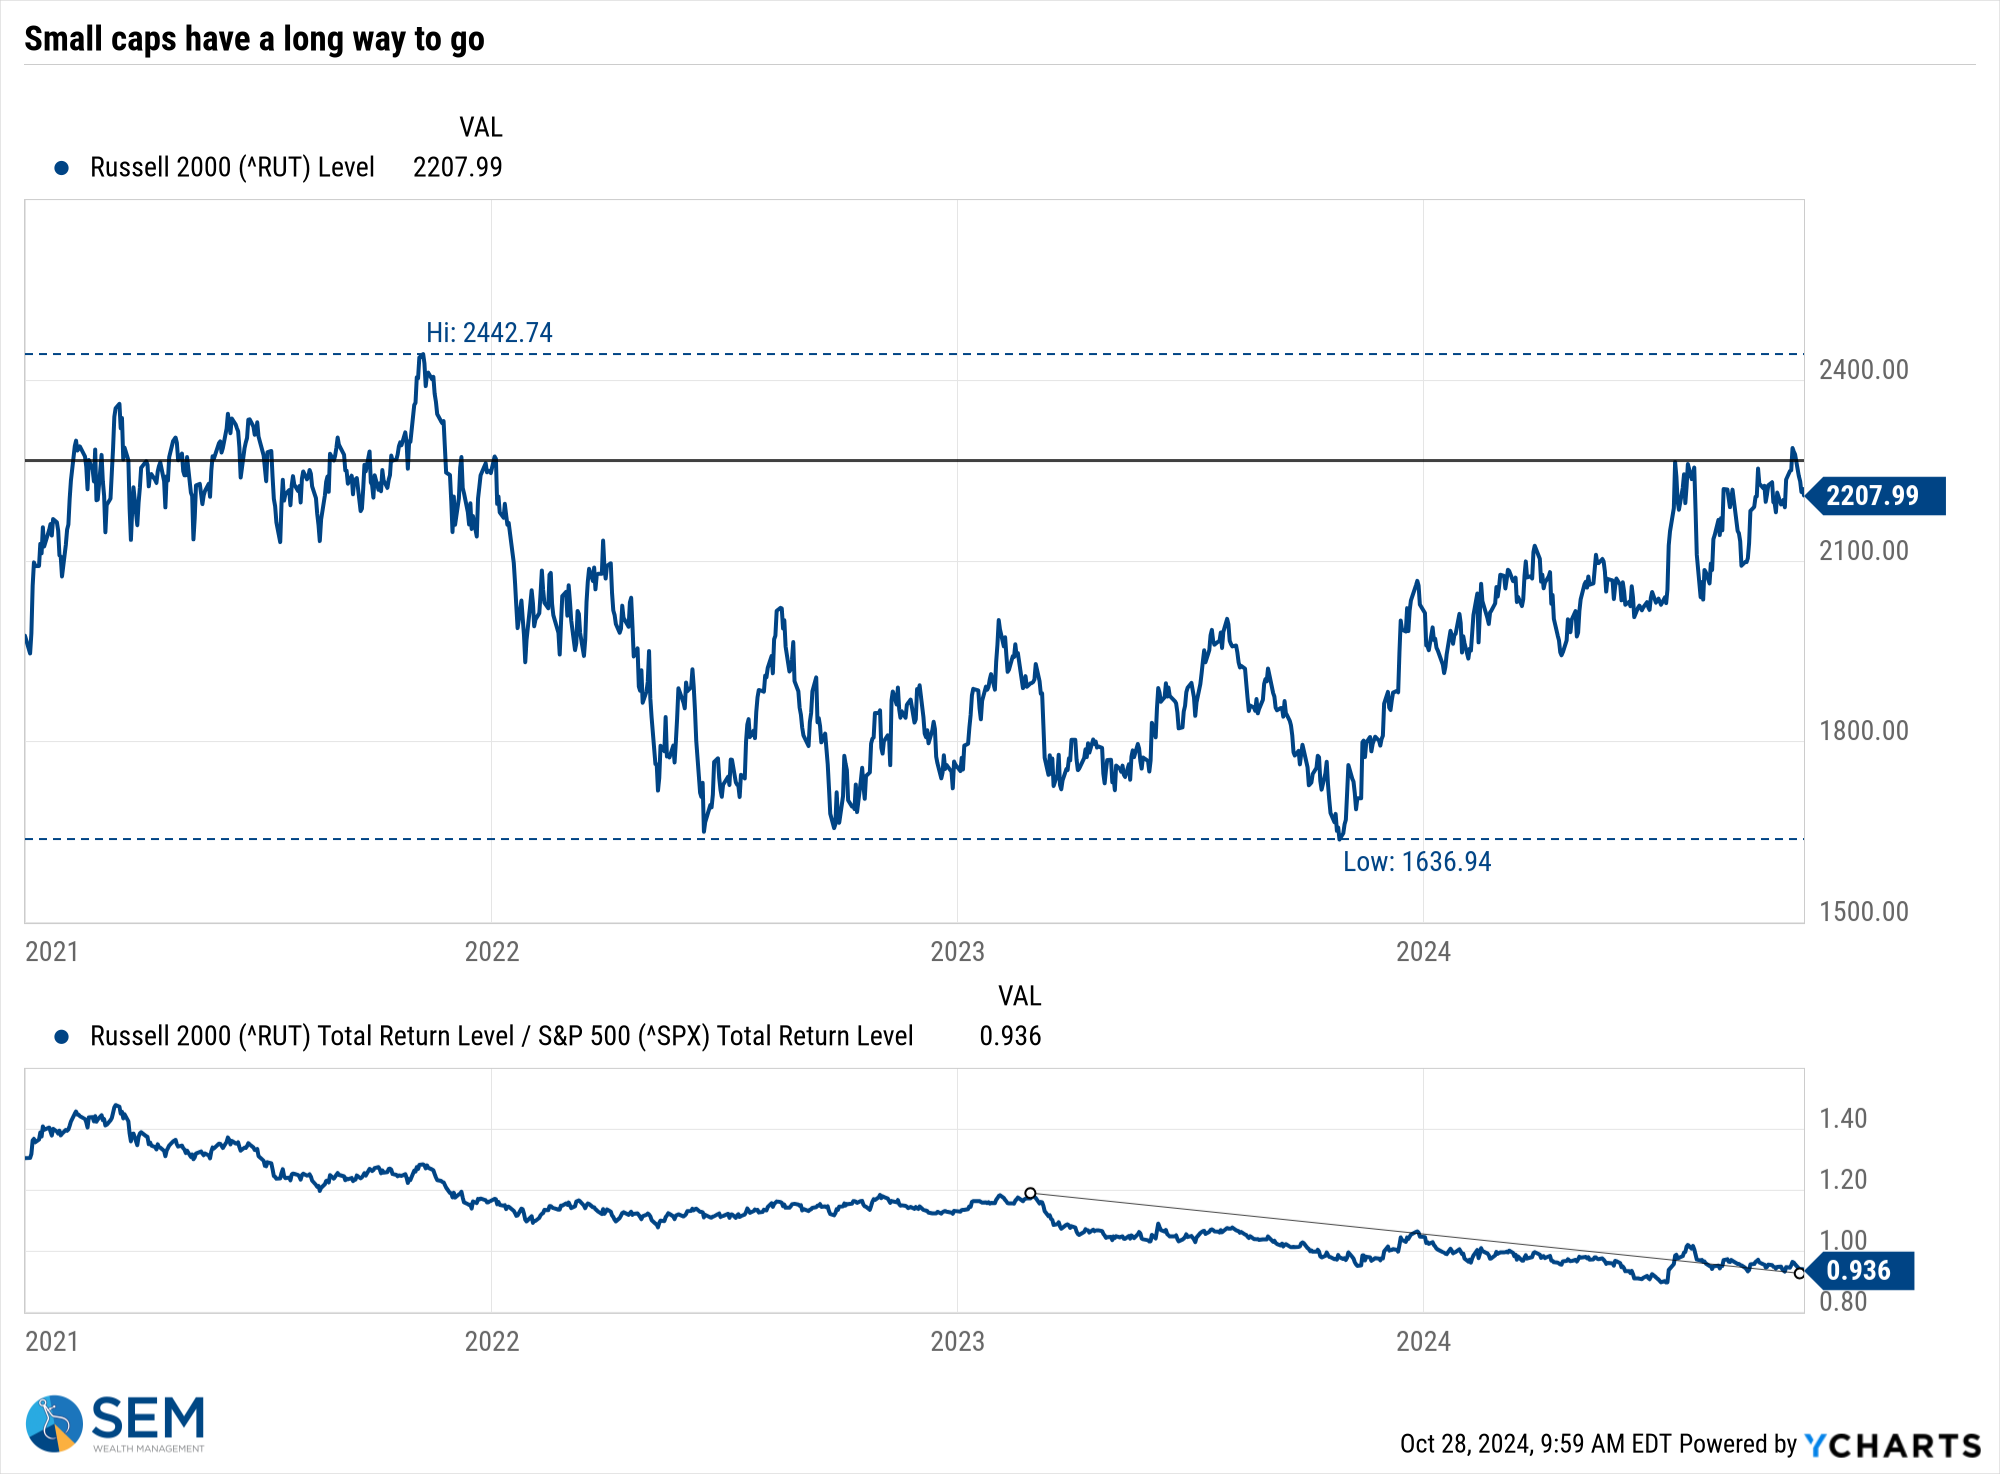
More disappointing though was small caps getting beat-up once again. If we are indeed going to hit the above average growth estimates priced into the market, we should expect small caps to also be participating. They are not.
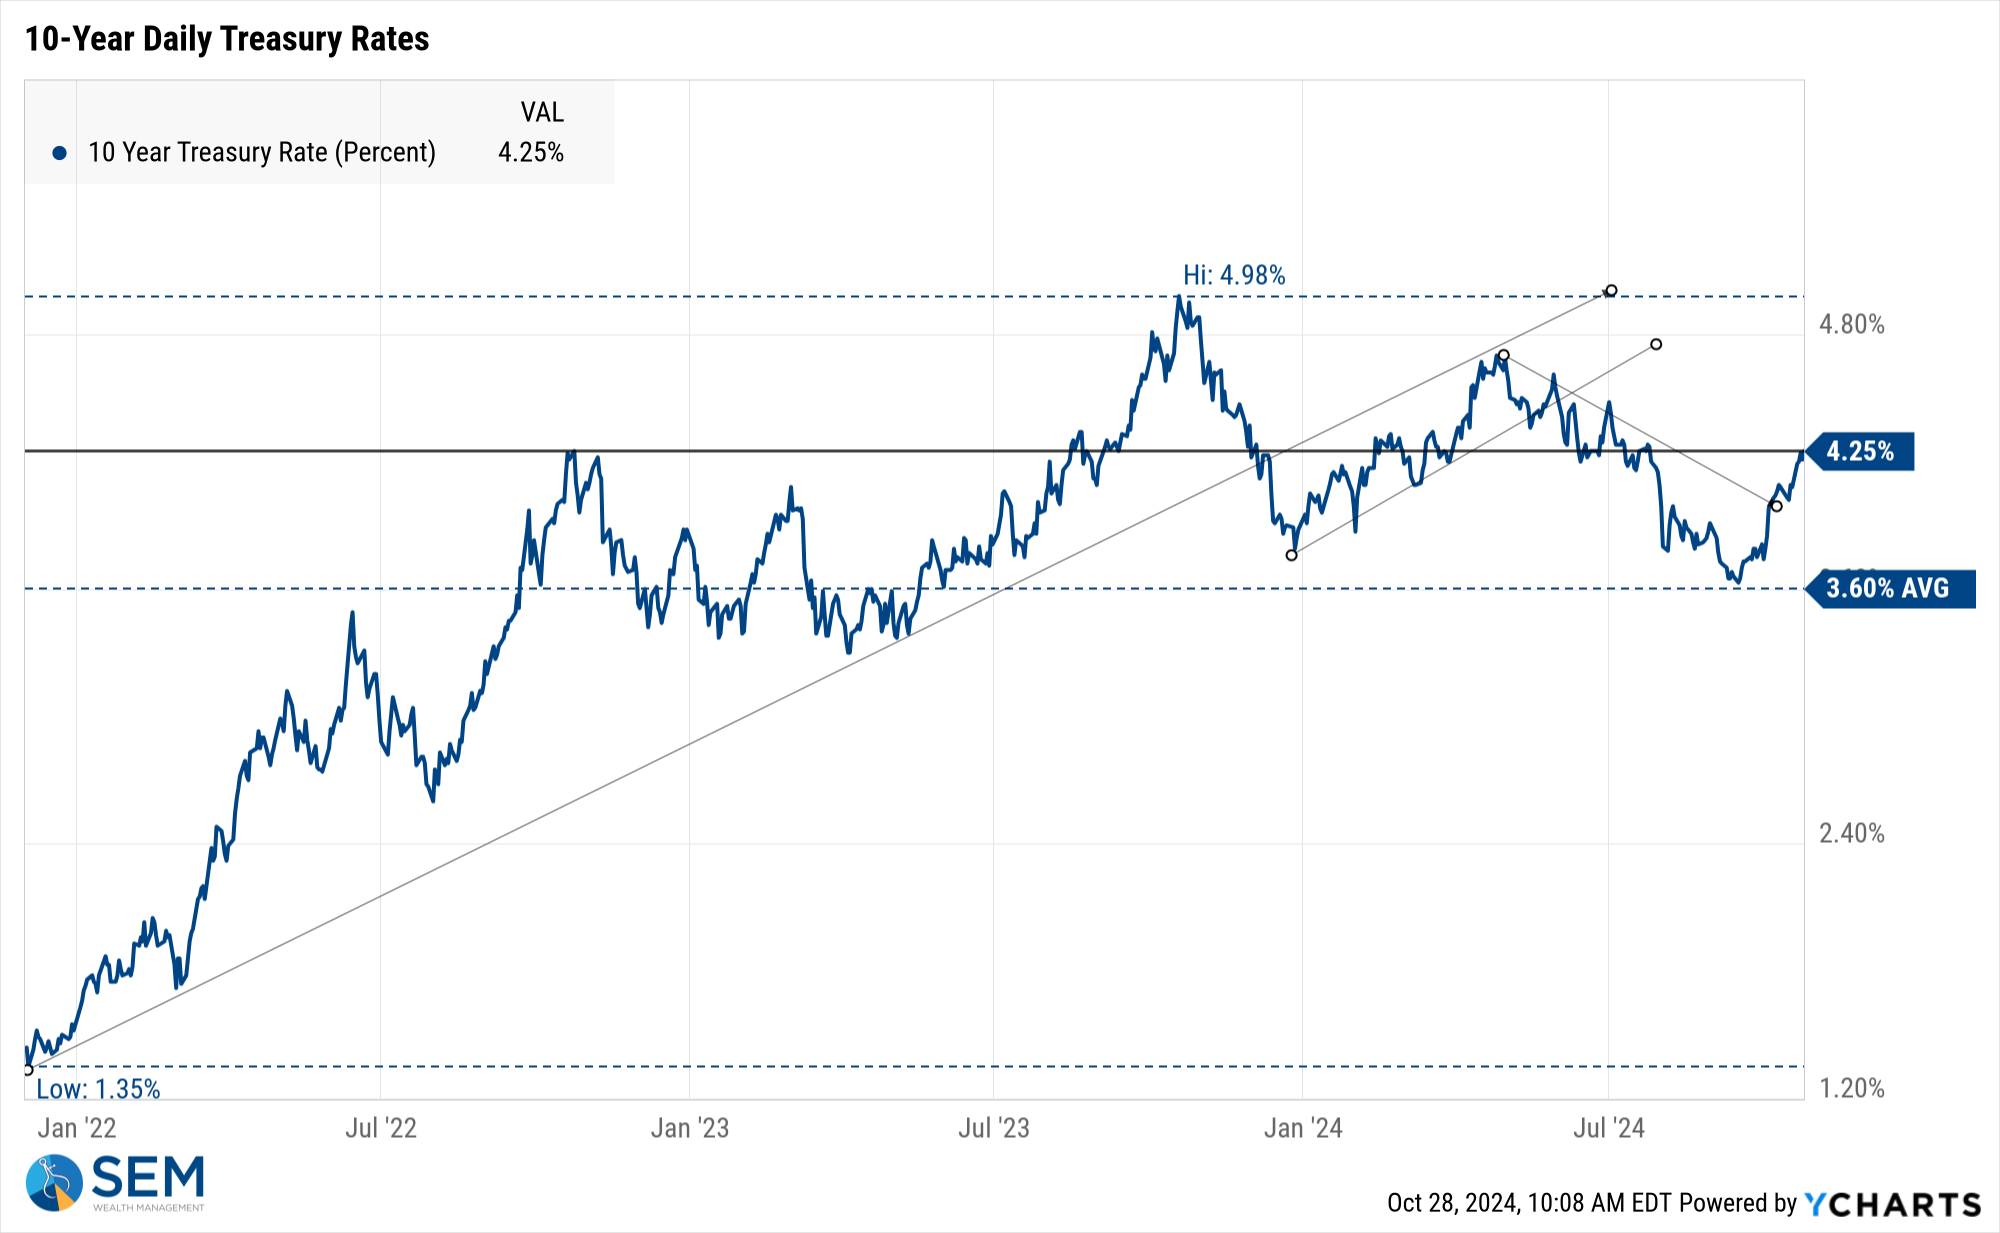
The Federal Reserve has a problem – the FREE MARKET is not buying that their inflation fight is over. The 10-year yield has rocketed higher since they cut rates, but surprisingly the rest of the yield curve has also shifted up since they CUT rates.

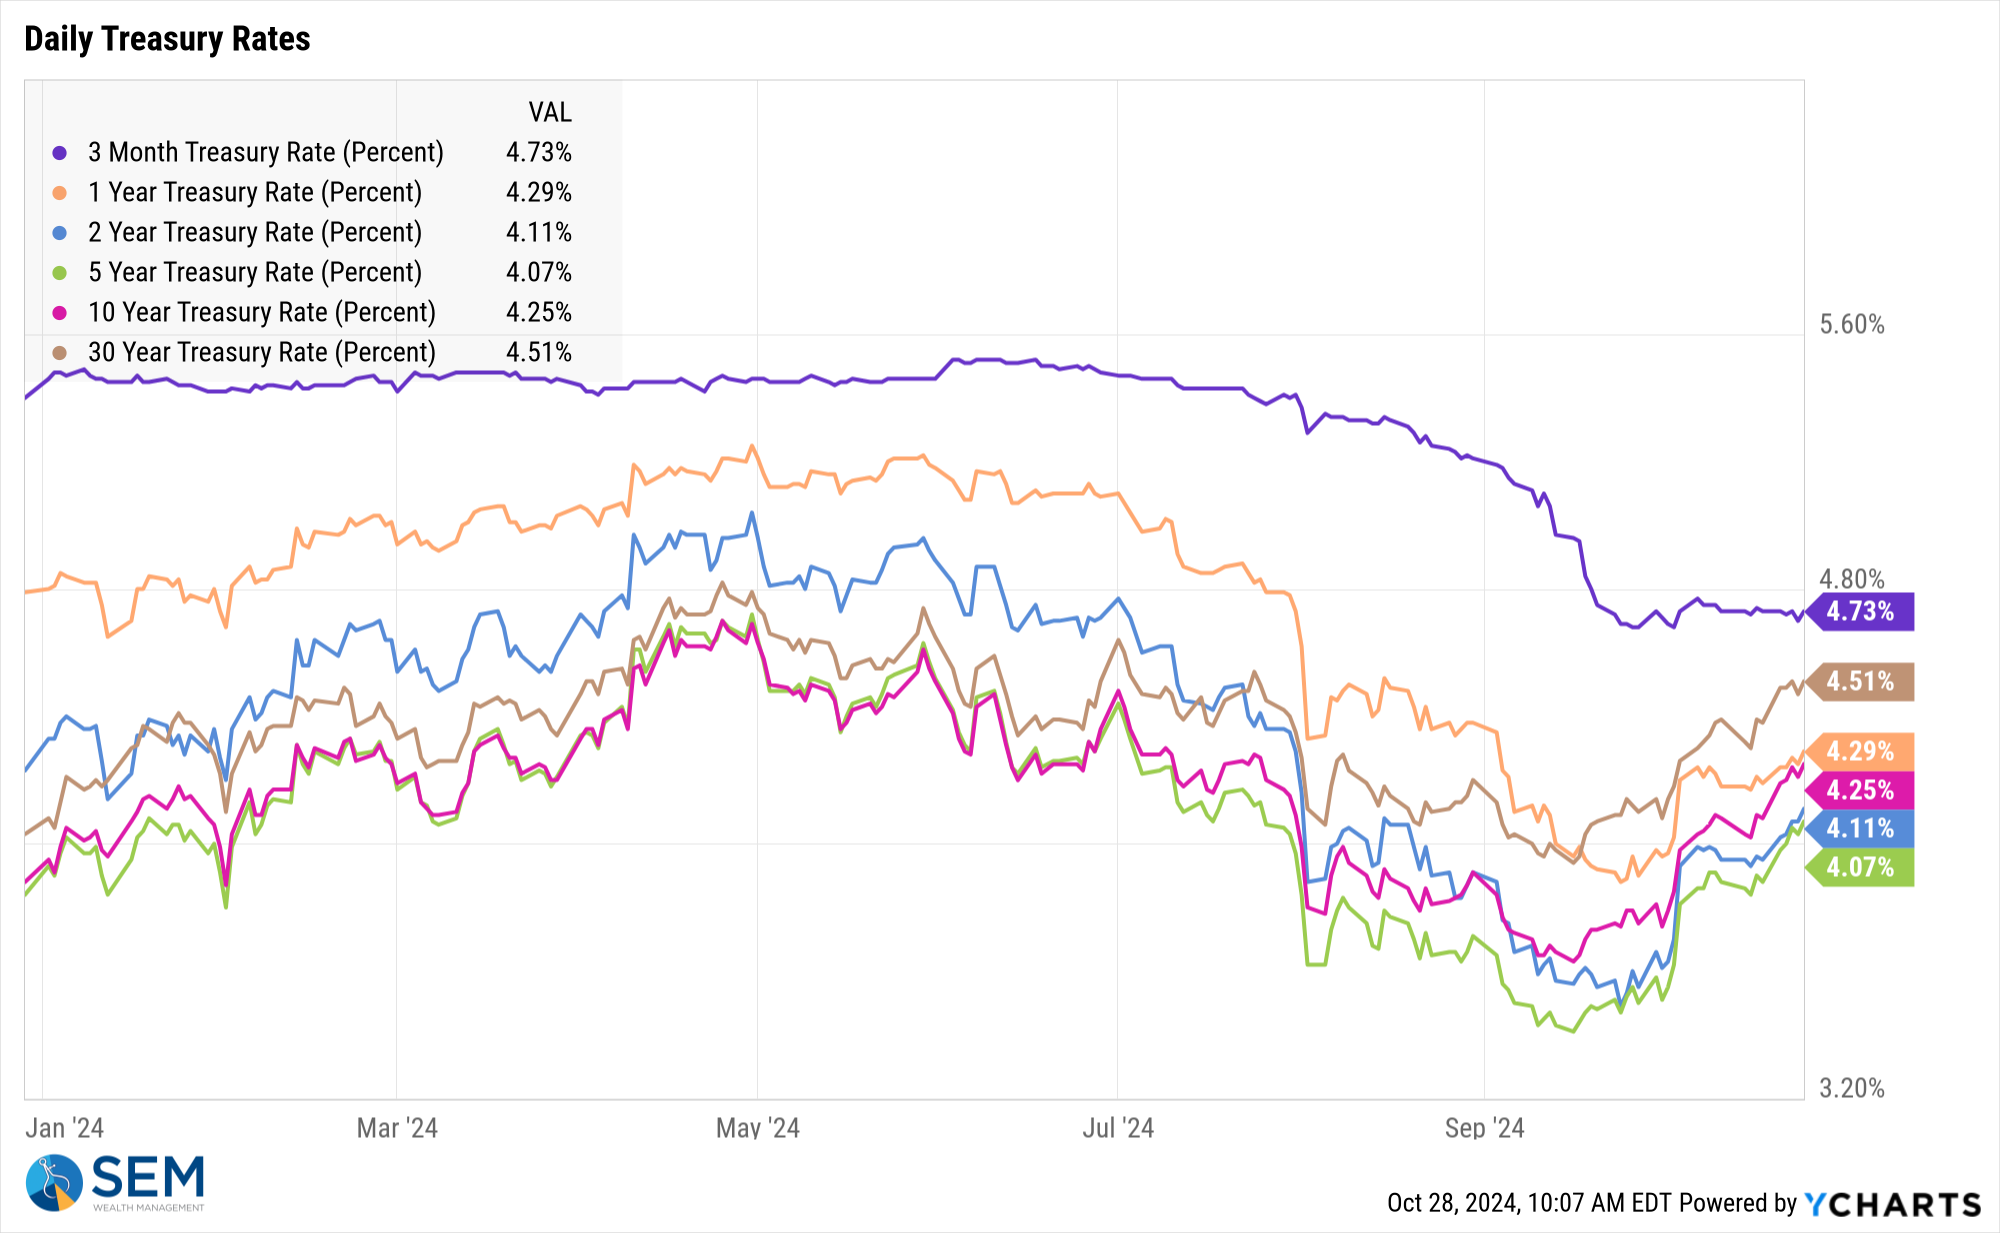
This is a problem for the Fed and something we all should be watching. So much of the rally this year was banking on the Fed easing their interest rate policy. Nobody bothered to ask, "what if the FREE MARKET raises interest rates?" All those companies waiting to refinance their debt at lower yields or people waiting for lower mortgage rates will have to wait if this trend continues.
SEM Model Positioning
-Tactical High Yield had a partial buy signal on 5/6/24, reversing some of the sells on 4/16 & 17/2024 - the other portion of the signal remains on a sell as high yields continue to oscillate.
-Dynamic Models are 'neutral' as of 6/7/24, reversing the half 'bearish' signal from 5/3/2024. 7/8/24 - interest rate model flipped from partially bearish to partially bullish (lower long-term rates).
-Strategic Trend Models went on a buy 11/27/2023; 7/8/24 – small and mid-cap positions eliminated with latest Core Rotation System update – money shifted to Large Cap Value (Dividend Growth) & International Funds
SEM deploys 3 distinct approaches – Tactical, Dynamic, and Strategic. These systems have been described as 'daily, monthly, quarterly' given how often they may make adjustments. Here is where they each stand.
Tactical (daily): On 5/6/24 about half of the signals in our high yield models switched to a buy. The other half remains in money market funds. The money market funds we are currently invested in are yielding between 4.3-4.8% annually.

Dynamic (monthly): The economic model was 'neutral' since February. In early May the model moved slightly negative, but reversed back to 'neutral' in June. This means 'benchmark' positions – 20% dividend stocks in Dynamic Income and 20% small cap stocks in Dynamic Aggressive Growth. The interest rate model is slightly 'bullish'.

Strategic (quarterly)*: BOTH Trend Systems reversed back to a buy on 11/27/2023
The core rotation is adjusted quarterly. On August 17 it rotated out of mid-cap growth and into small cap value. It also sold some large cap value to buy some large cap blend and growth. The large cap purchases were in actively managed funds with more diversification than the S&P 500 (banking on the market broadening out beyond the top 5-10 stocks.) On January 8 it rotated completely out of small cap value and mid-cap growth to purchase another broad (more diversified) large cap blend fund along with a Dividend Growth fund.
The * in quarterly is for the trend models. These models are watched daily but they trade infrequently based on readings of where each believe we are in the cycle. The trend systems can be susceptible to "whipsaws" as we saw with the recent sell and buy signals at the end of October and November. The goal of the systems is to miss major downturns in the market. Risks are high when the market has been stampeding higher as it has for most of 2023. This means sometimes selling too soon. As we saw with the recent trade, the systems can quickly reverse if they are wrong.

Overall, this is how our various models stack up based on the last allocation change:

Questions or comments - drop us a note?
Curious if your current investment allocation aligns with your overall objectives and risk tolerance? Take our risk questionnaire


