We're at that point of the year between Christmas and New Year where it's hard to remember what day of the week it is. At SEM where we have advisors across the country it will be a heavy dose of "out of office" messages when we try to contact them along with the usual handful of urgent messages trying to get something done at the last minute.
Since this is typically the least read blog post of each year, I'll just post a bunch of charts I've been gathering highlighting where we stand following the second consecutive 20%+ increase for the S&P 500.

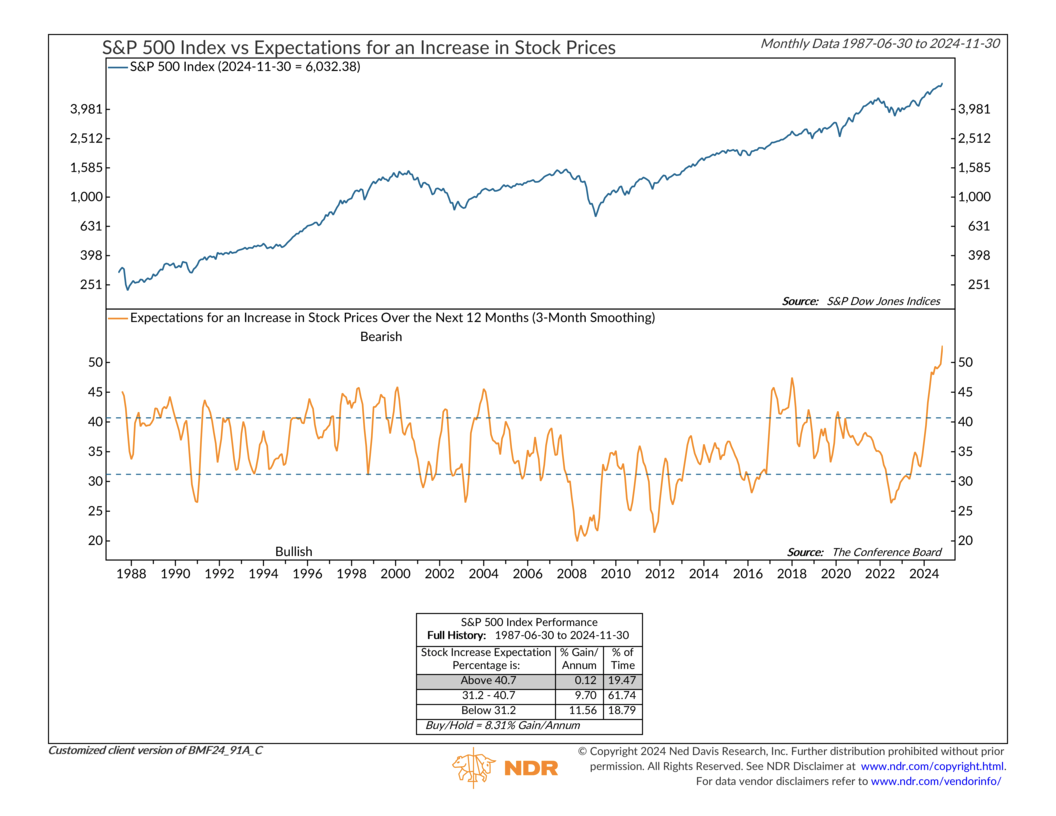
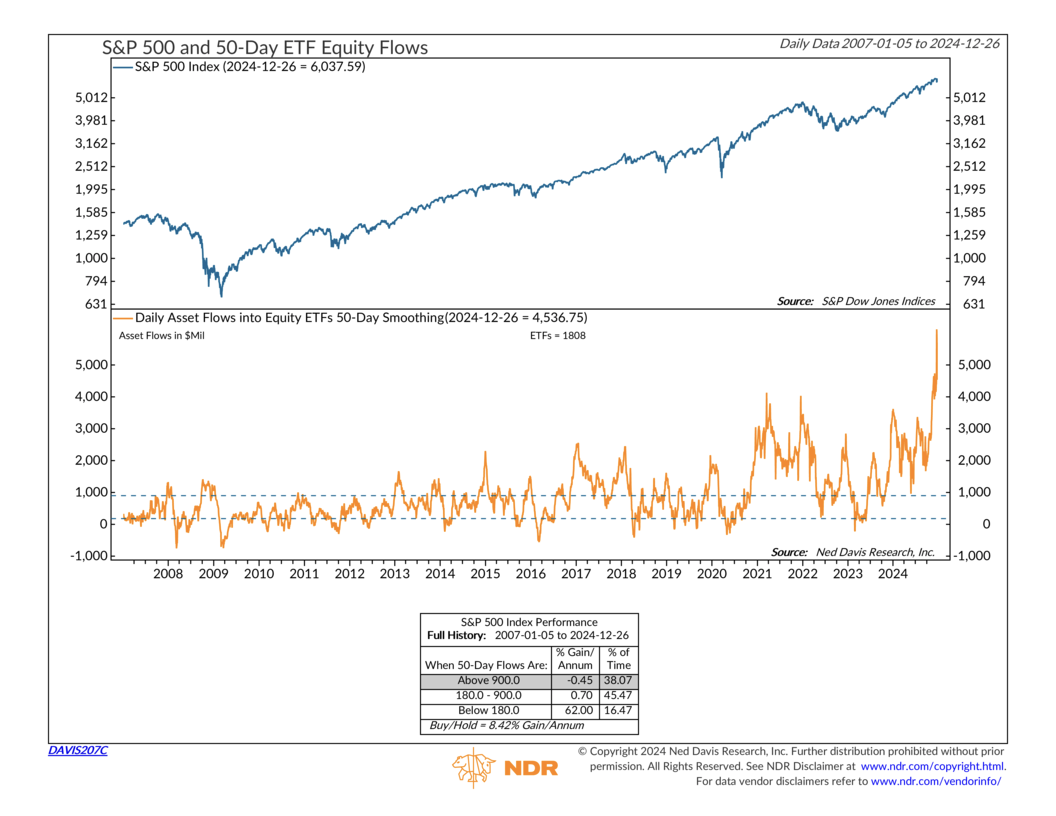
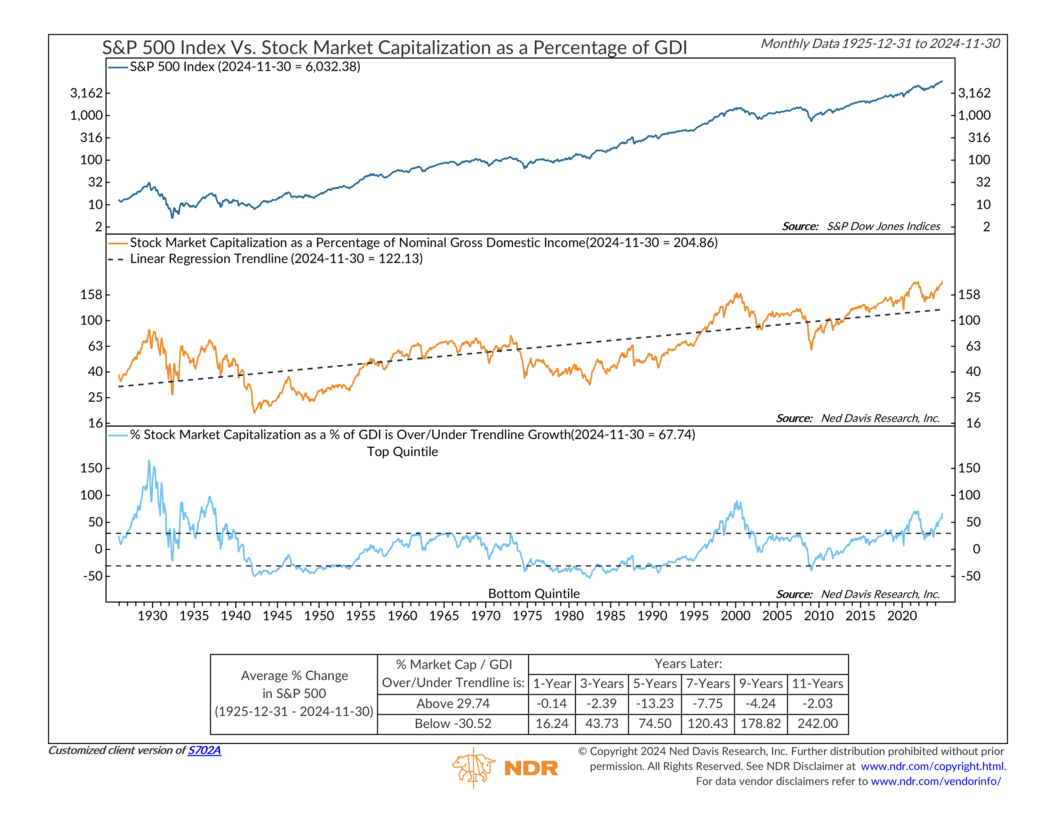
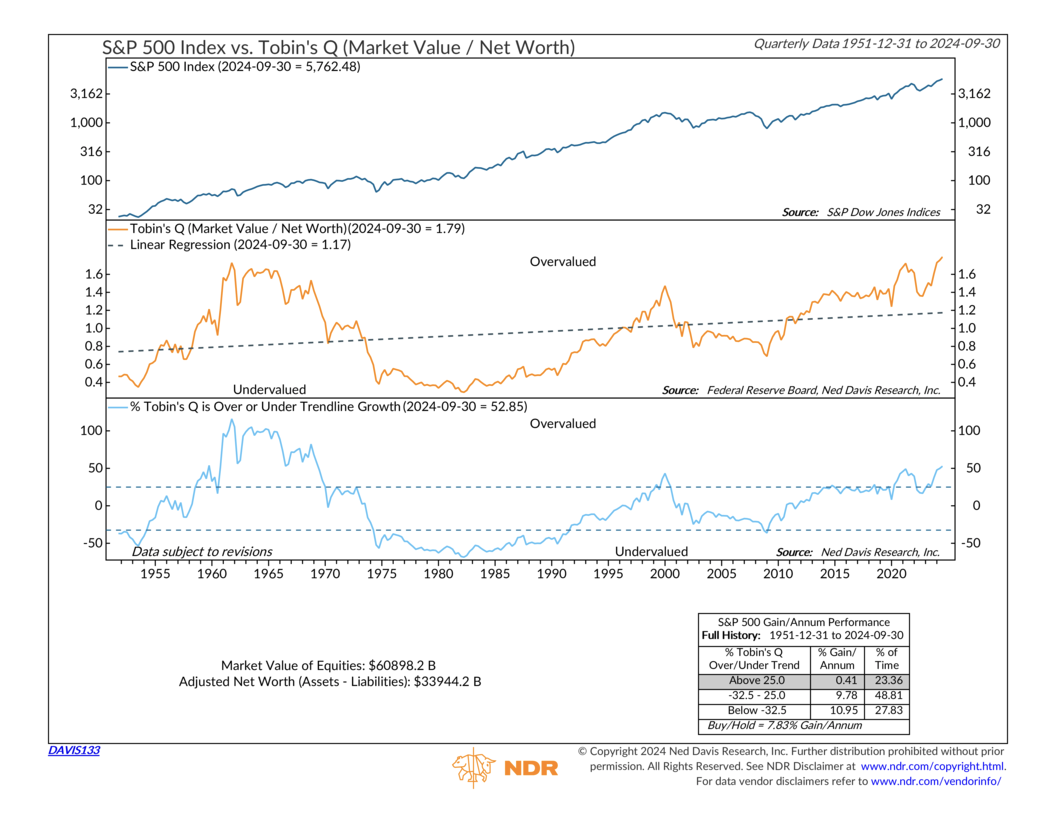
Ned Davis Research is by far one of the best data services out there for nerds like me. If you're in charge of managing money for others, I highly recommend them. Their charts can be a little confusing to newcomers, but I like to focus on the "bands" they usually show on their charts as well as the performance of the markets based on that band to help keep things in perspective.
One thing you will notice, is the "band" we are currently in has historically meant negative or barely positive buy & hold returns. This doesn't meant that's what will happen, but certainly means EVERYTHING has to go perfectly to see another solid year for stocks in 2025.
Record High Expectations for Increasing Stock Prices

Record 50-Day inflows into ETFs

Buffet Indicator at all-time high

Hussman's Version of Buffet Indicator also at all-time high

Buffet Indicator Predicts difficult 12 years for buy & hold investors

Stocks relative to net worth at all-time highs

Top 10 S&P 500 Stocks now 40% of the index

Don't listen to the forecasts
The next few charts illustrate how useless the Wall Street market forecasts really are. Despite this, everyone still seems to take them as a fact.
Anchoring Bias – starting with a number and working out
Most forecasts are clumped around the 10% level (the long-term average return for the S&P 500.)

Strategists are often VERY wrong

Some Firms have a TERRIBLE track record

While we do not use any of the above charts for our investment models, it does help set proper EXPECTATIONS for what the next year (or 3 or 5 or 10) could look like, especially for buy & hold investors.
Market Charts
The most important chart (for now) continues to be this one, which starts on election day. Last Friday, following the "shock" the Fed may not continue cutting rates because the economy is doing fairly well, which makes inflation tougher to control (this shouldn't be a surprise and should be GOOD news in a NORMAL market), the S&P 500 fell below the post-election opening print, which led to some buying activity. That level is likely to continue to be a line in the sand especially for everyone who bought because they believe the next 4 years will be spectacular for stocks simply because of who is in the White House. As we saw from the charts above, that is a VERY large number of people.

What is more important, however, is the performance of the market since November 2023 when the Fed declared the end of their inflation fight. It climbed an astounding 43% over that time (remember the long-term average is 10% per year). Adding the 3.3% since the election, stocks are up 46% over the last 13 months. Is that sustainable? Is that reasonable? Is that logical? Who am I to say otherwise. As you will see from the section below, SEM's models are mixed, with the long-term stock focused models jumping into the market very near the November 2023 bottom and staying there.

The more important data point remains interest rates. I show this 20-year chart to keep things in perspective. Rates at these levels are not the worst thing – we obviously saw strong economic growth (and a housing bubble) with rates in the 4.3-5.3% range. The problem is businesses and investors alike are expecting rates to go much lower.

I often have to remind people of this simple fact. The Federal Reserve can only control SHORT-TERM interest rates. The free market sets long-term interest rates. The free market is saying the Fed's rate cuts are a mistake, could create more inflation, and eventually leave them to reverse course. The Fed has now cut short-term rates by 1% while at the same time the free market has raised rates by 1%.

SEM Model Positioning
-**NEW* Tactical High Yield* sold our high yield bond positions purchased last spring on 12/20/24. We had added a 30% position in floating rate bonds on 12/6/24, which currently have a 9% yield compared to a 6% yield in high yields and 4.6% in money markets. This follows the partial (about 67%) buy signal on 5/6/24.
-Dynamic Models are 'neutral' as of 6/7/24, reversing the half 'bearish' signal from 5/3/2024. 7/8/24 - interest rate model flipped from partially bearish to partially bullish (lower long-term rates).
-Strategic Trend Models went on a buy 11/27/2023; 7/8/24 – small and mid-cap positions eliminated with latest Core Rotation System update – money shifted to Large Cap Value (Dividend Growth) & International Funds
SEM deploys 3 distinct approaches – Tactical, Dynamic, and Strategic. These systems have been described as 'daily, monthly, quarterly' given how often they may make adjustments. Here is where they each stand.
Tactical (daily): On 12/20/2024 our tactical high yield model sold out of high yield bond (about 70% of our holdings) into money market. The other 30% is invested in shorter duration, higher yielding floating rate bonds. These instruments are not as sensitive to credit risk and are typically allocated to in the early and late stages of a high yield bond move in our model.

Dynamic (monthly): The economic model was 'neutral' since February. In early May the model moved slightly negative, but reversed back to 'neutral' in June. This means 'benchmark' positions – 20% dividend stocks in Dynamic Income and 20% small cap stocks in Dynamic Aggressive Growth. The interest rate model is slightly 'bullish'.

Strategic (quarterly)*: BOTH Trend Systems reversed back to a buy on 11/27/2023
The core rotation is adjusted quarterly. On August 17 it rotated out of mid-cap growth and into small cap value. It also sold some large cap value to buy some large cap blend and growth. The large cap purchases were in actively managed funds with more diversification than the S&P 500 (banking on the market broadening out beyond the top 5-10 stocks.) On January 8 it rotated completely out of small cap value and mid-cap growth to purchase another broad (more diversified) large cap blend fund along with a Dividend Growth fund.
The * in quarterly is for the trend models. These models are watched daily but they trade infrequently based on readings of where each believe we are in the cycle. The trend systems can be susceptible to "whipsaws" as we saw with the recent sell and buy signals at the end of October and November. The goal of the systems is to miss major downturns in the market. Risks are high when the market has been stampeding higher as it has for most of 2023. This means sometimes selling too soon. As we saw with the recent trade, the systems can quickly reverse if they are wrong.

Overall, this is how our various models stack up based on the last allocation change:

Questions or comments - drop us a note?
Curious if your current investment allocation aligns with your overall objectives and risk tolerance? Take our risk questionnaire


