
For old people like me who remember getting the newspaper every morning, there was a section on the inside of the front page titled "Corrections". This was the place where if necessary, the publication would fix anything that was printed previously which ended up not being true. Remember back in the 1900s when I started my career the only sources of news you had was the newspaper, the radio, the nightly TV news, and the burgeoning 24 hour news channels like CNN.
Despite having 24/7 access to news and information, my sense is we are less informed either because we can pick and choose where we get our news or the algorithms feed us news it thinks will keep us engaged with their apps. This has led to longer cycles where the "consensus" all seems to be the same. When new information begins to take hold, the U-turn in the opposite direction can be swift and surprising.
I could imagine investors waking up at in mid-February and seeing this on the inside of their morning newspaper:
Corrections: Trump Administration main focus is on immigration, cutting government jobs, and the trade deficit. Following the election, we had reported the Trump Administration would only focus on pro-growth policies, which would lead to a third consecutive year of both above average earnings growth and stock market performance. These policies were also designed to take away inflation pressure, allowing the Federal Reserve to cut rates an estimated 3/4 - 1% in 2025. Three weeks into the administration, it has become clear the focus has changed. We apologize for this mistake.
I spent the bulk of last week on calls with advisors and clients explaining what happened and more importantly, what adjustments (if any) we should make. Every call came with the same advice I had before and after the election:
If your financial plan or cash flow strategy has not changed, no changes are necessary.
The reason for the current drop in stocks is simple – investors expected only the "good" Trump policies to be implemented with the "bad" ones being slowly implemented because the President did not want to hurt the market. (When I say "good" and "bad" I'm not talking about anything other than the short and intermediate-term impact on the economy.)
The S&P 500 started the year at 5800. After back-to-back 20%+ rallies, Wall Street expected at a minimum an "average" year of 10% growth, with Oppenheimer, Wells Fargo, Yardeni Research, and Deutsche Bank expecting 20% gains for stocks. Only Stiefel predicted a small decline.
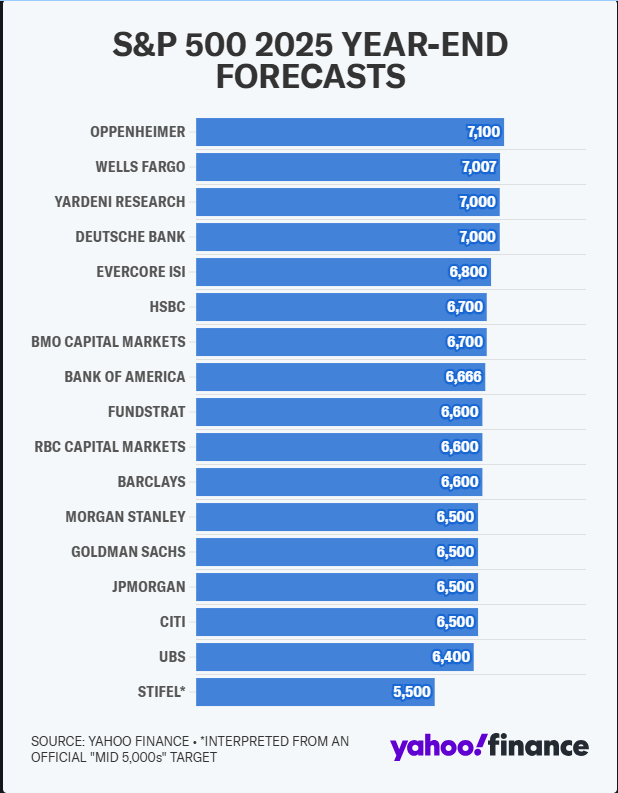
The year is early, but it is safe to say a few firms should be printing a correction and an apology to their clients who fell for their overly optimistic predictions.
Normally, we include the "Market Charts" near the end of each week's blog, but since the news of the week is the "correction" in the S&P 500, that is the main focus this week.
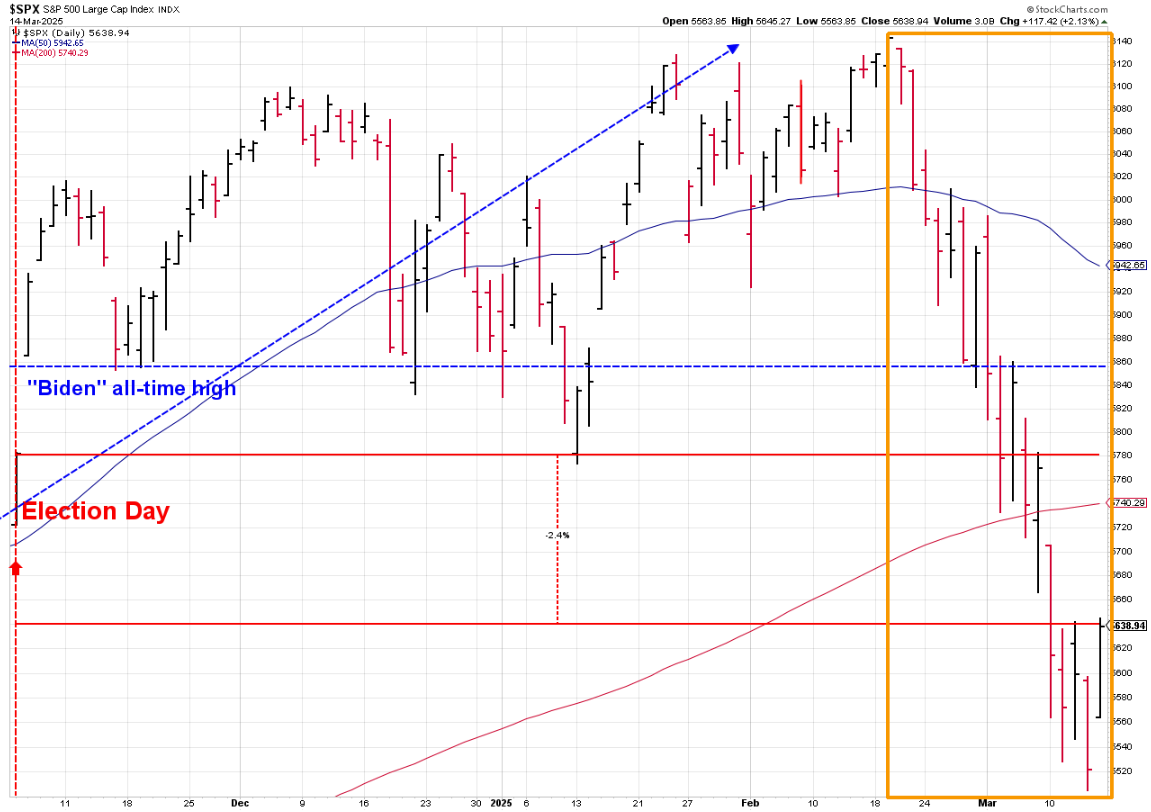
I've been starting with this chart ever since President Trump in December started taking credit for the rally in stocks. I show this simply as a real-time way to track my number one saying when it comes to investing: "Do not let your political opinions influence your investment decisions." During our pre and post election webinars I also added: "Not one President, not one Congress, and not one political party can change the direction of our economy (or market)." The market is bigger than any one person, Congress, or party. As we've seen since November, the market can also lose focus on the big picture at times.
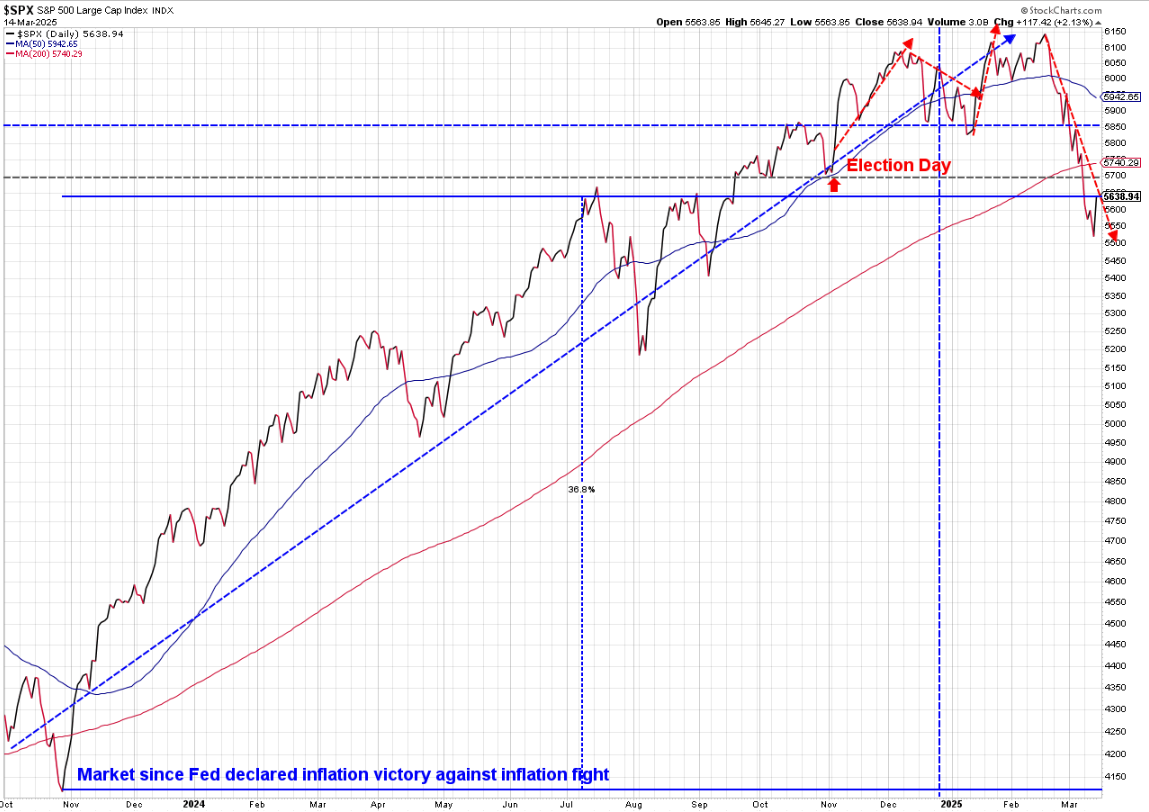
I've also been showing this chart each week, which is much more important for perspective. The "Trump rally" actually started way before he was the clear winner. It started when the Fed announced they were ending their inflation fight in late 2023. For perspective, even after the 10% correction in stocks, the S&P 500 is still up nearly 37% since October 2023!
We do see some issues, though. While steep, the downtrend line is still in place even after the big rally on Friday. The S&P also broke the 200 day moving average, which many allocators use as a signal for overall trends. Finally, the "support" of the election day levels around 5700 was broken last week.
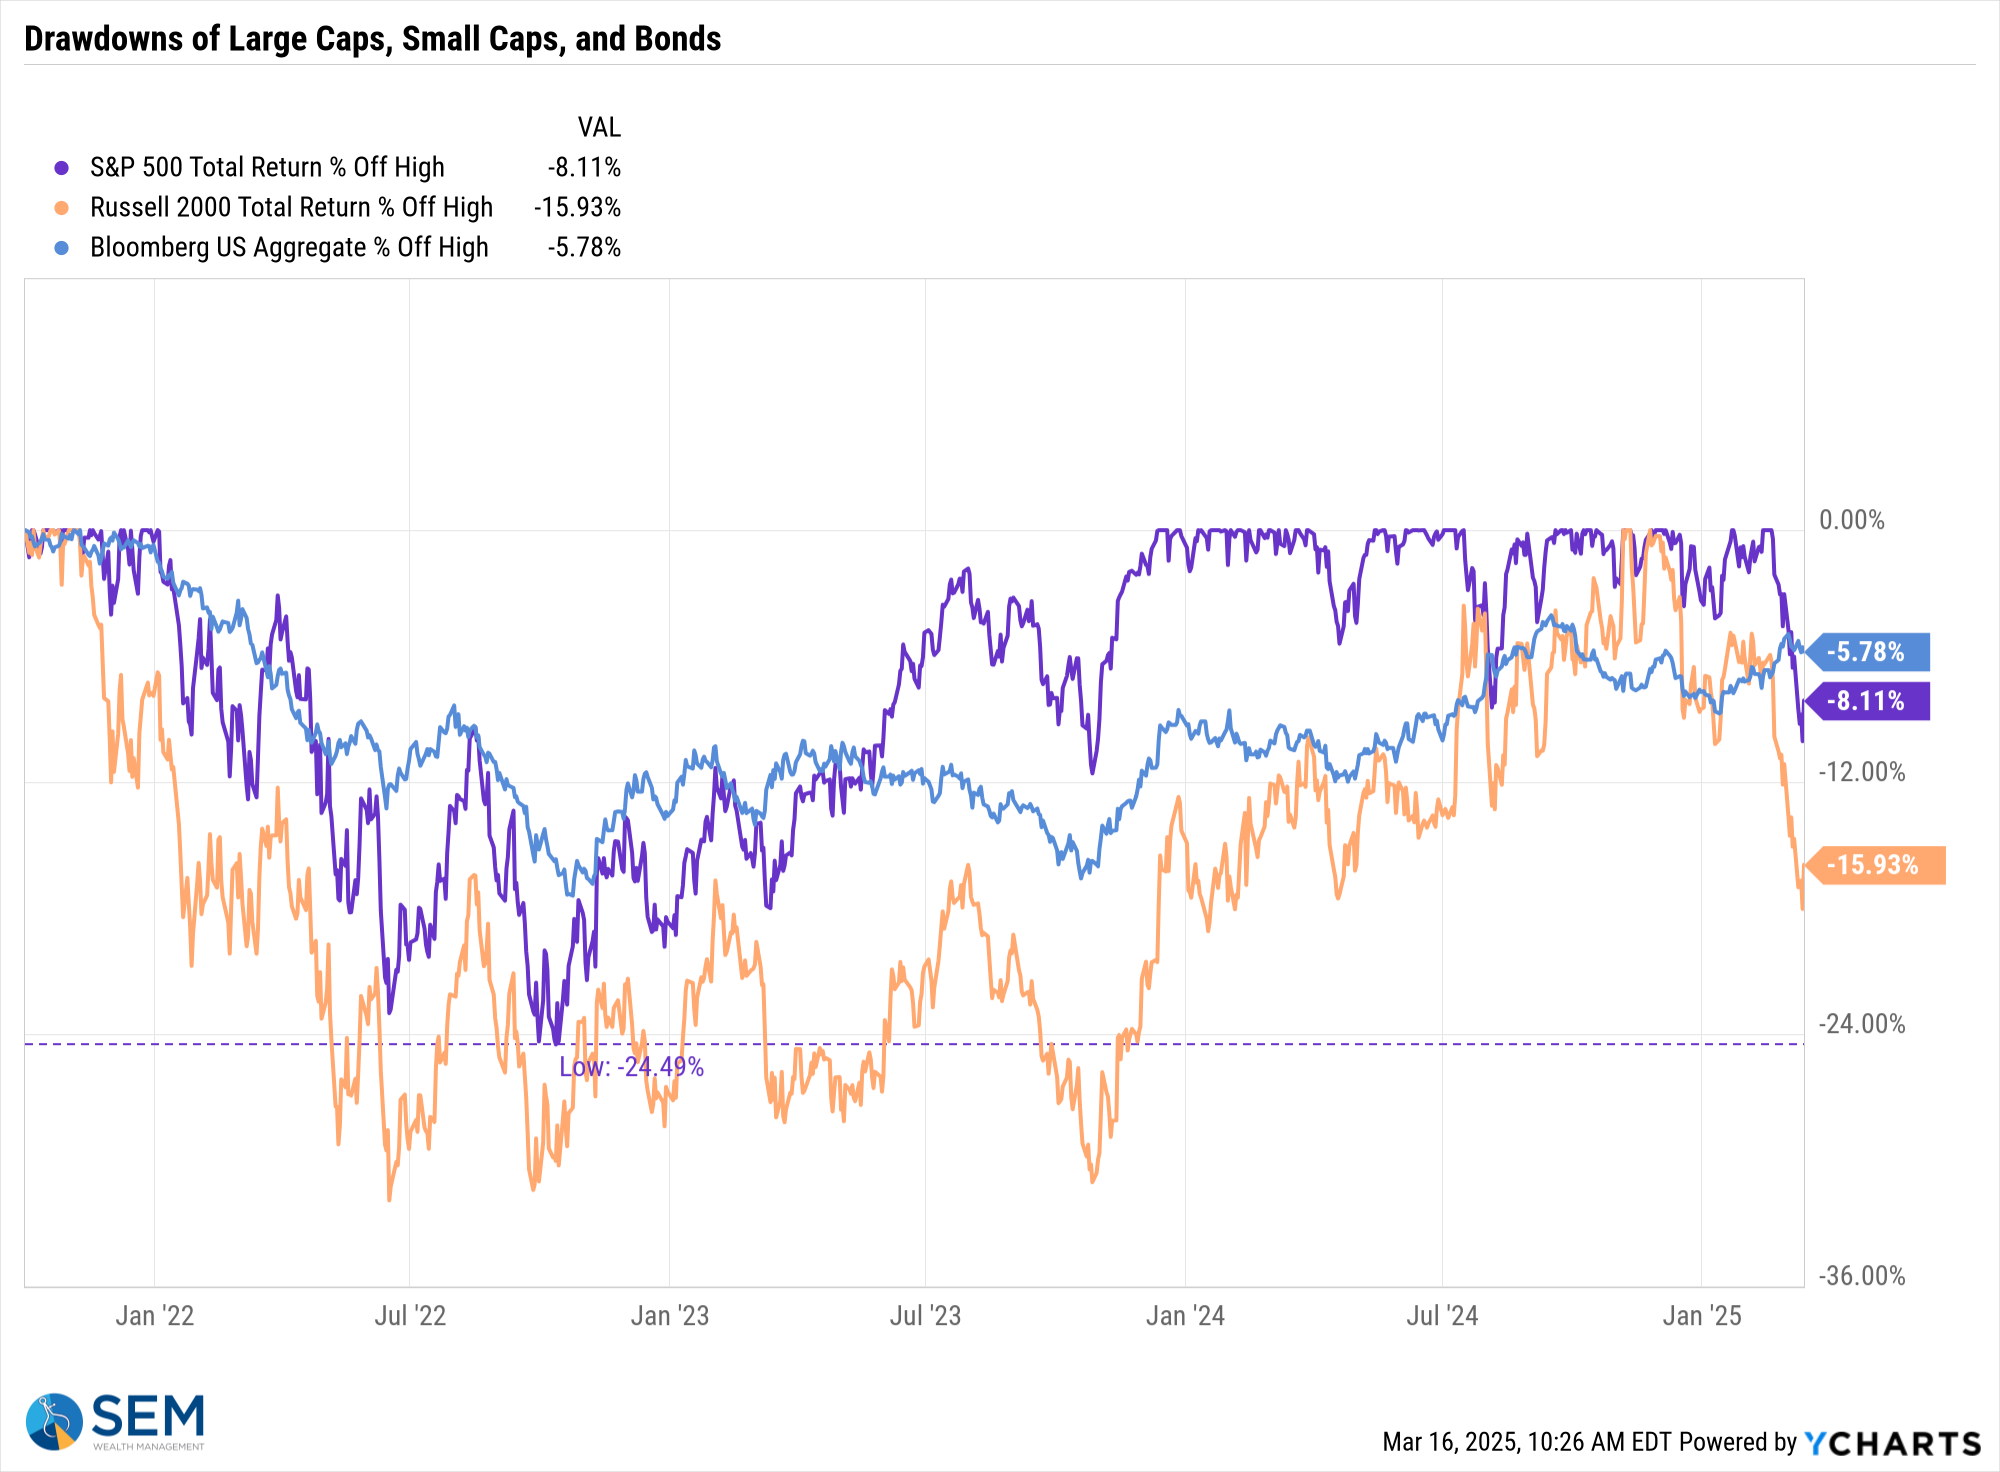
This next chart shows the "drawdown", which is the percentage drop from the highs. Note how again the S&P 500 (the purple line) has outperformed small caps (the orange line) in a big way.
For a greater perspective, here's the same chart going back to 1999.
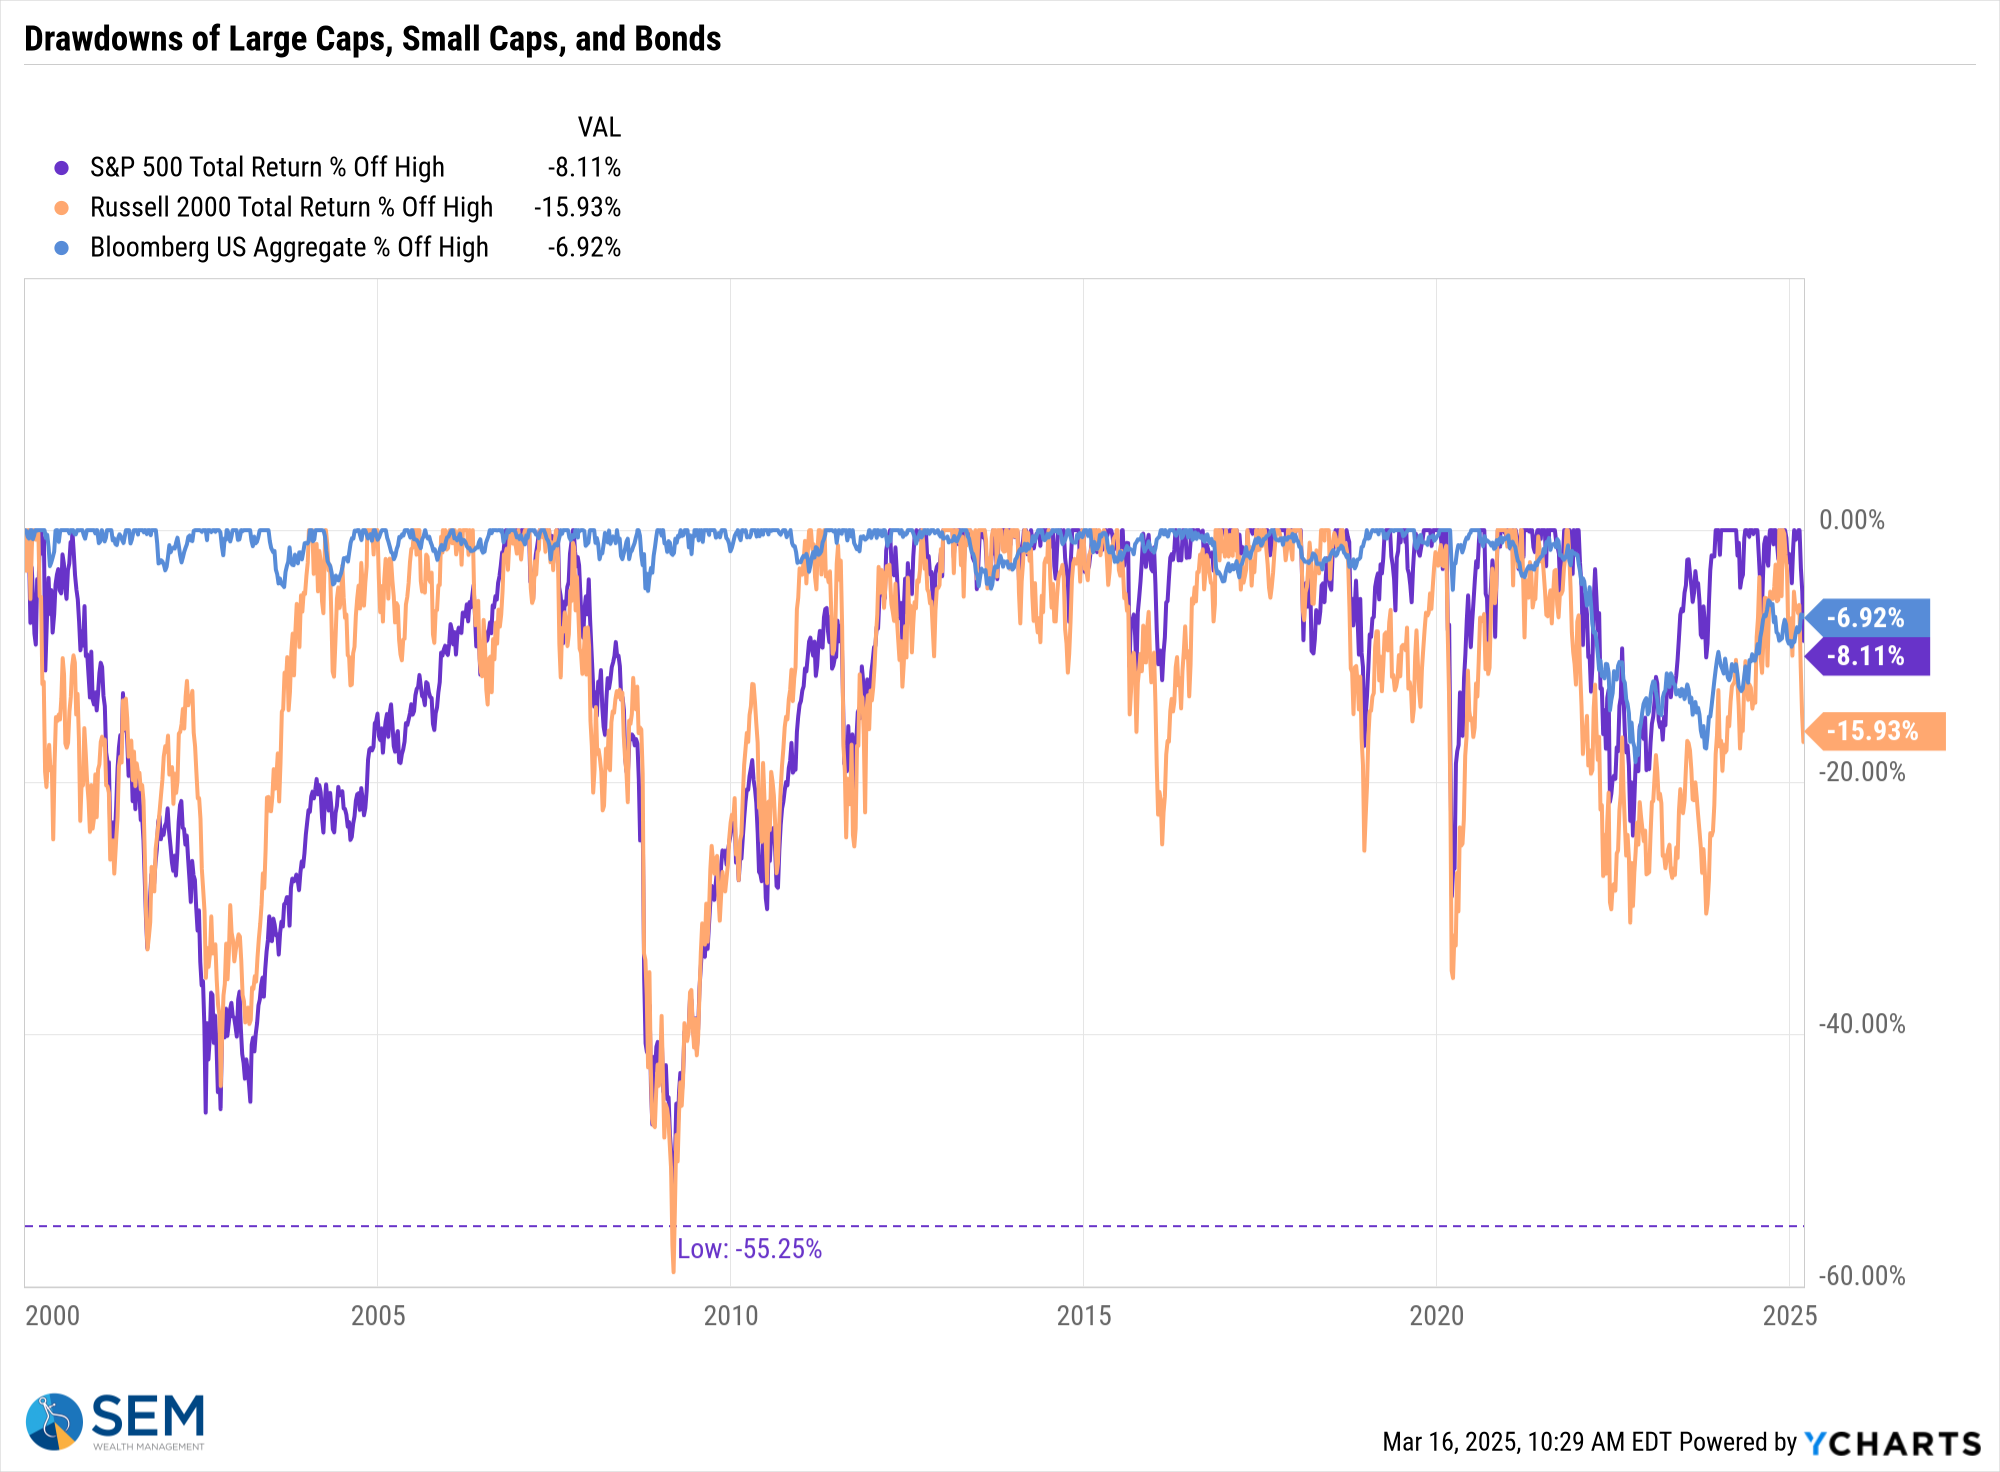
Here is something important to remember — on average, stocks have drawdowns of 5% about 3 times per year, 10% about every 18 months, 20% every 3-5 years, and have had 50%+ drawdowns twice in the last 25 years. In other words, after a 45% run in 14 months, a 10% drop should be EXPECTED. Could it get worse, most certainly. We are due for a bear market and a recession (see Consumer Pessimism Grows below).
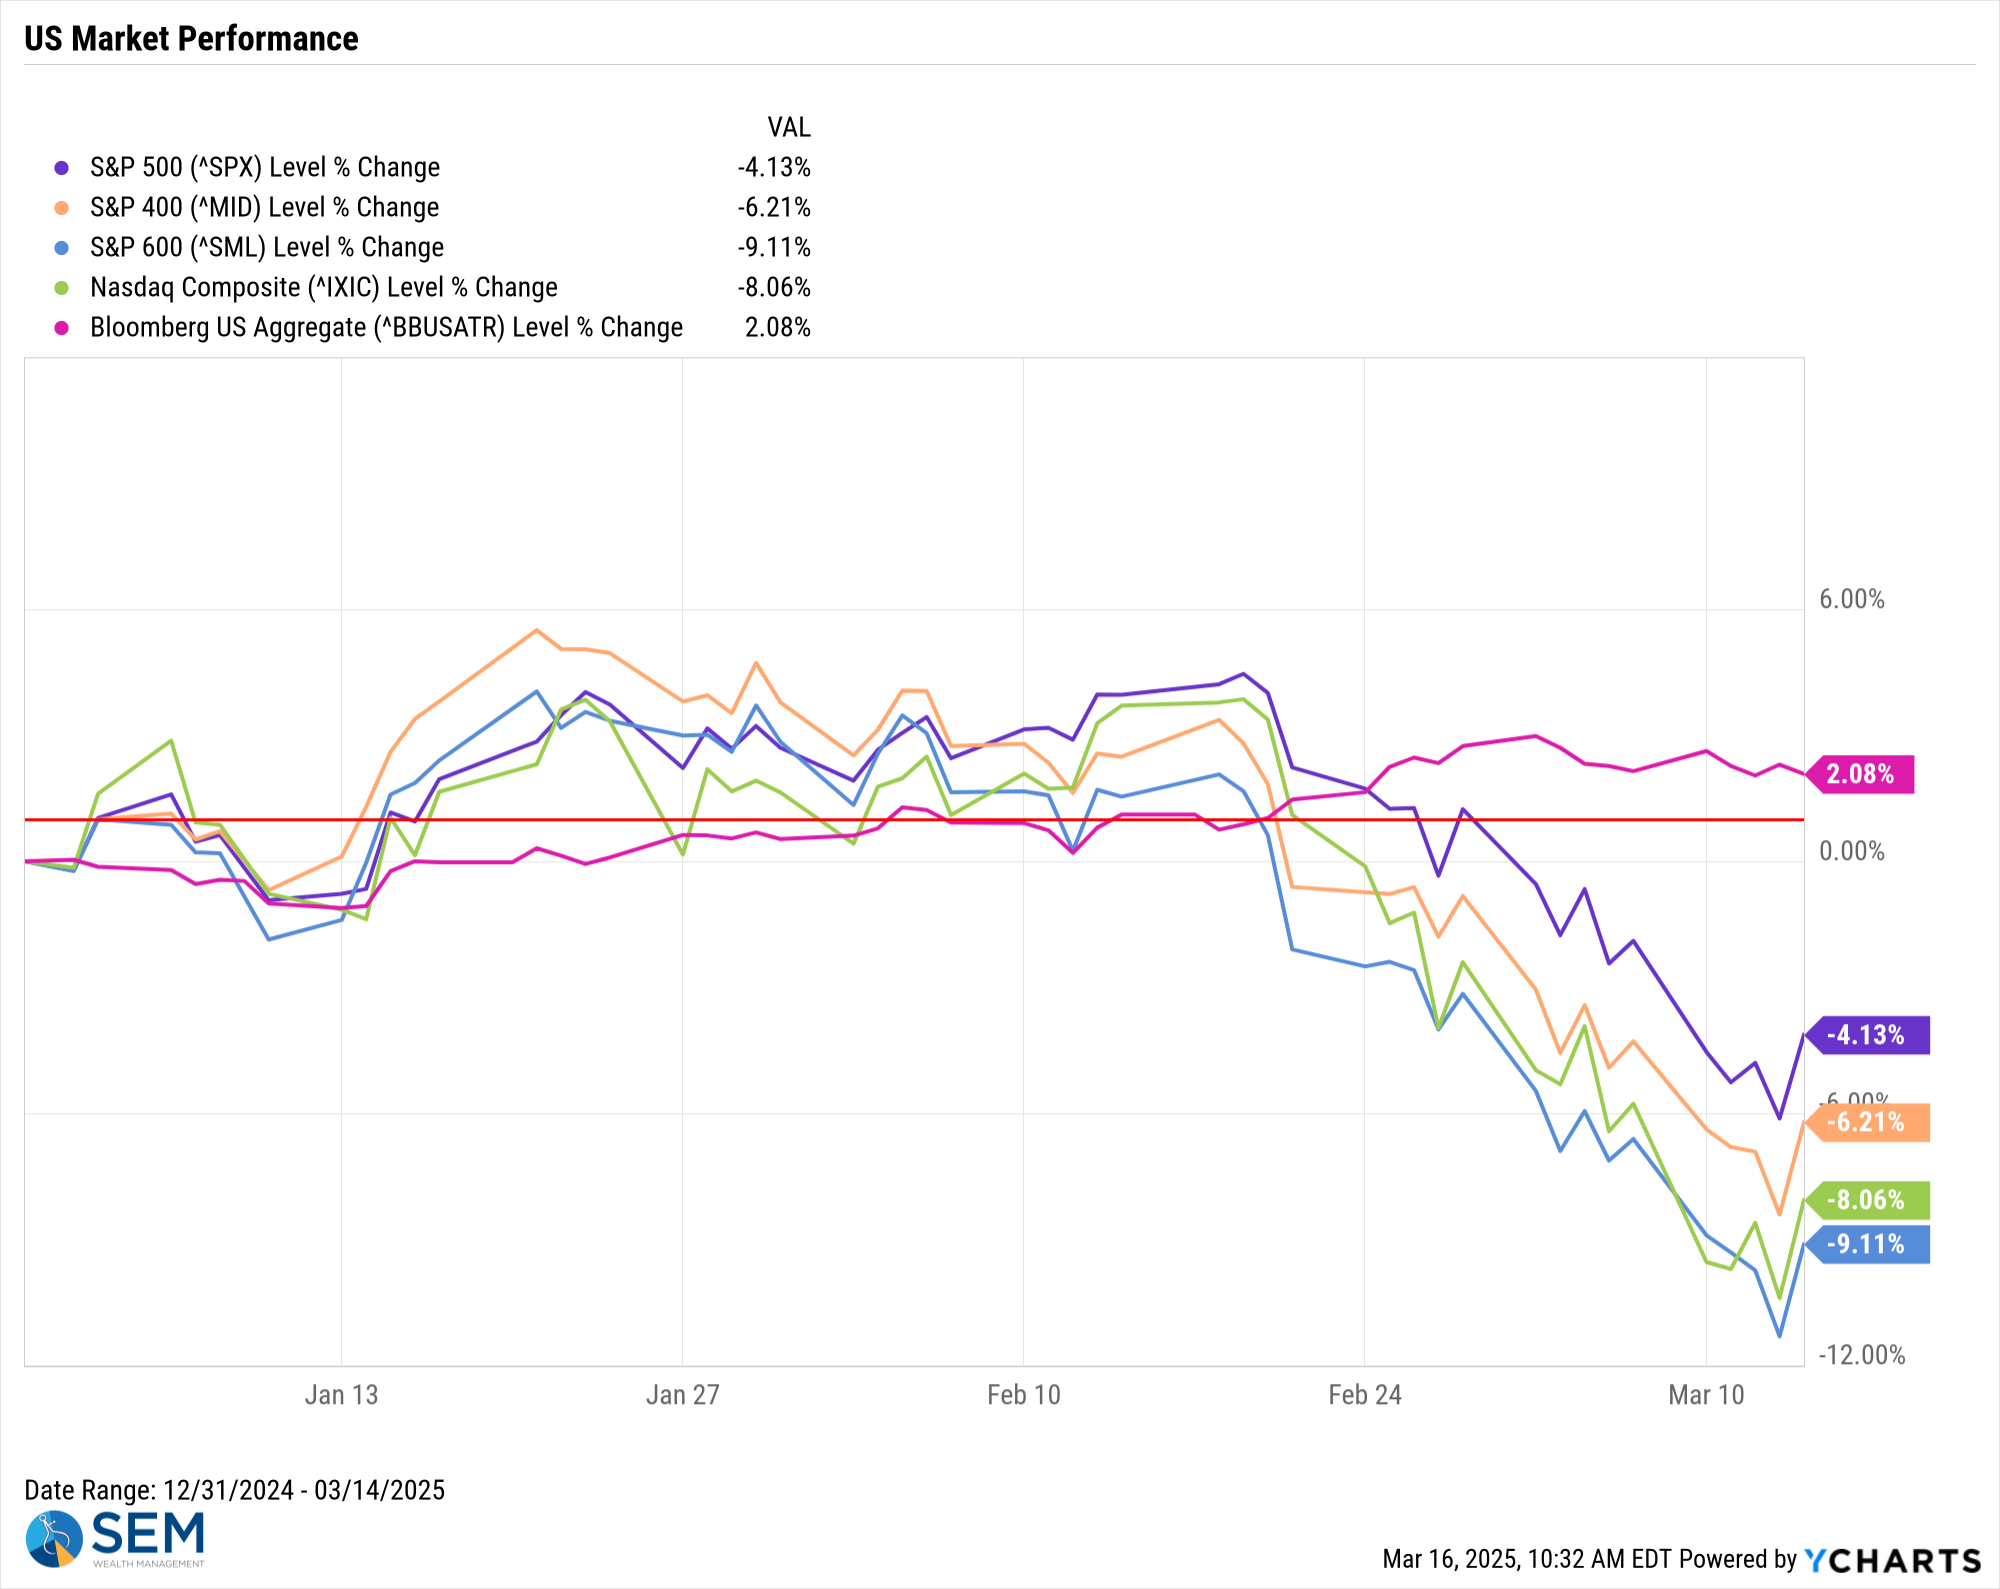
Overall, technology stocks and small cap stocks are getting hit the most.
What I'm having a hard time understanding and maybe why I'm not more alarmed at this recent drop is the fact high yield bonds are not giving the same signals as small cap stocks. If the economy is getting bad, this is bad news for small companies. However, it is also bad news for high yield (junk) bond issuers. The spreads in corporate bonds, while higher, or still very near all-time lows.
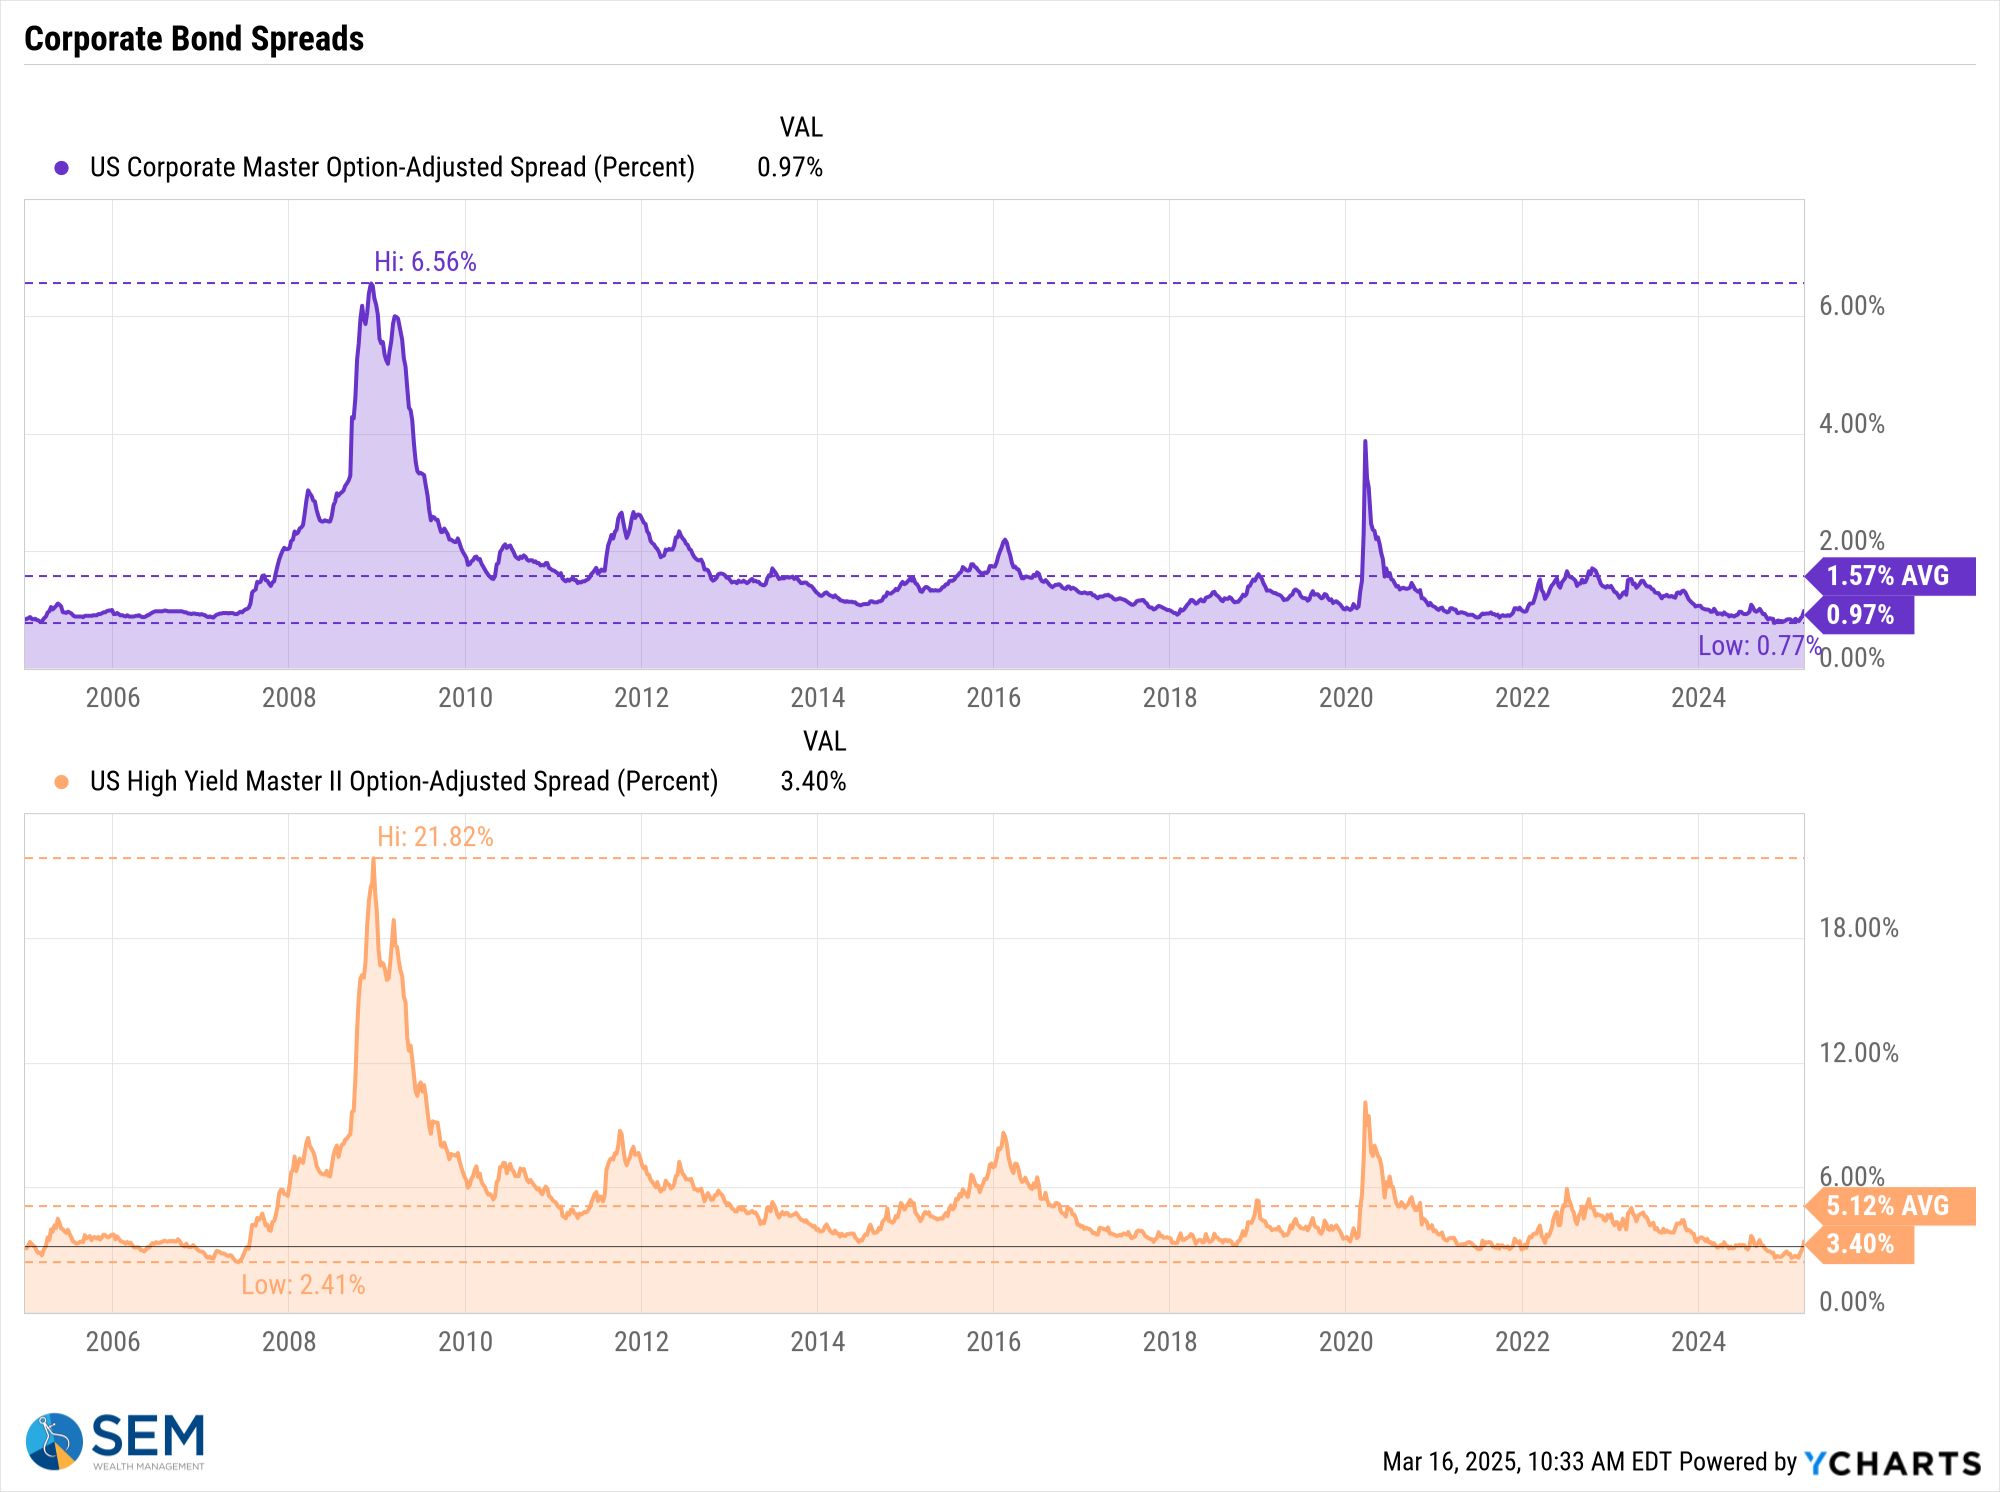
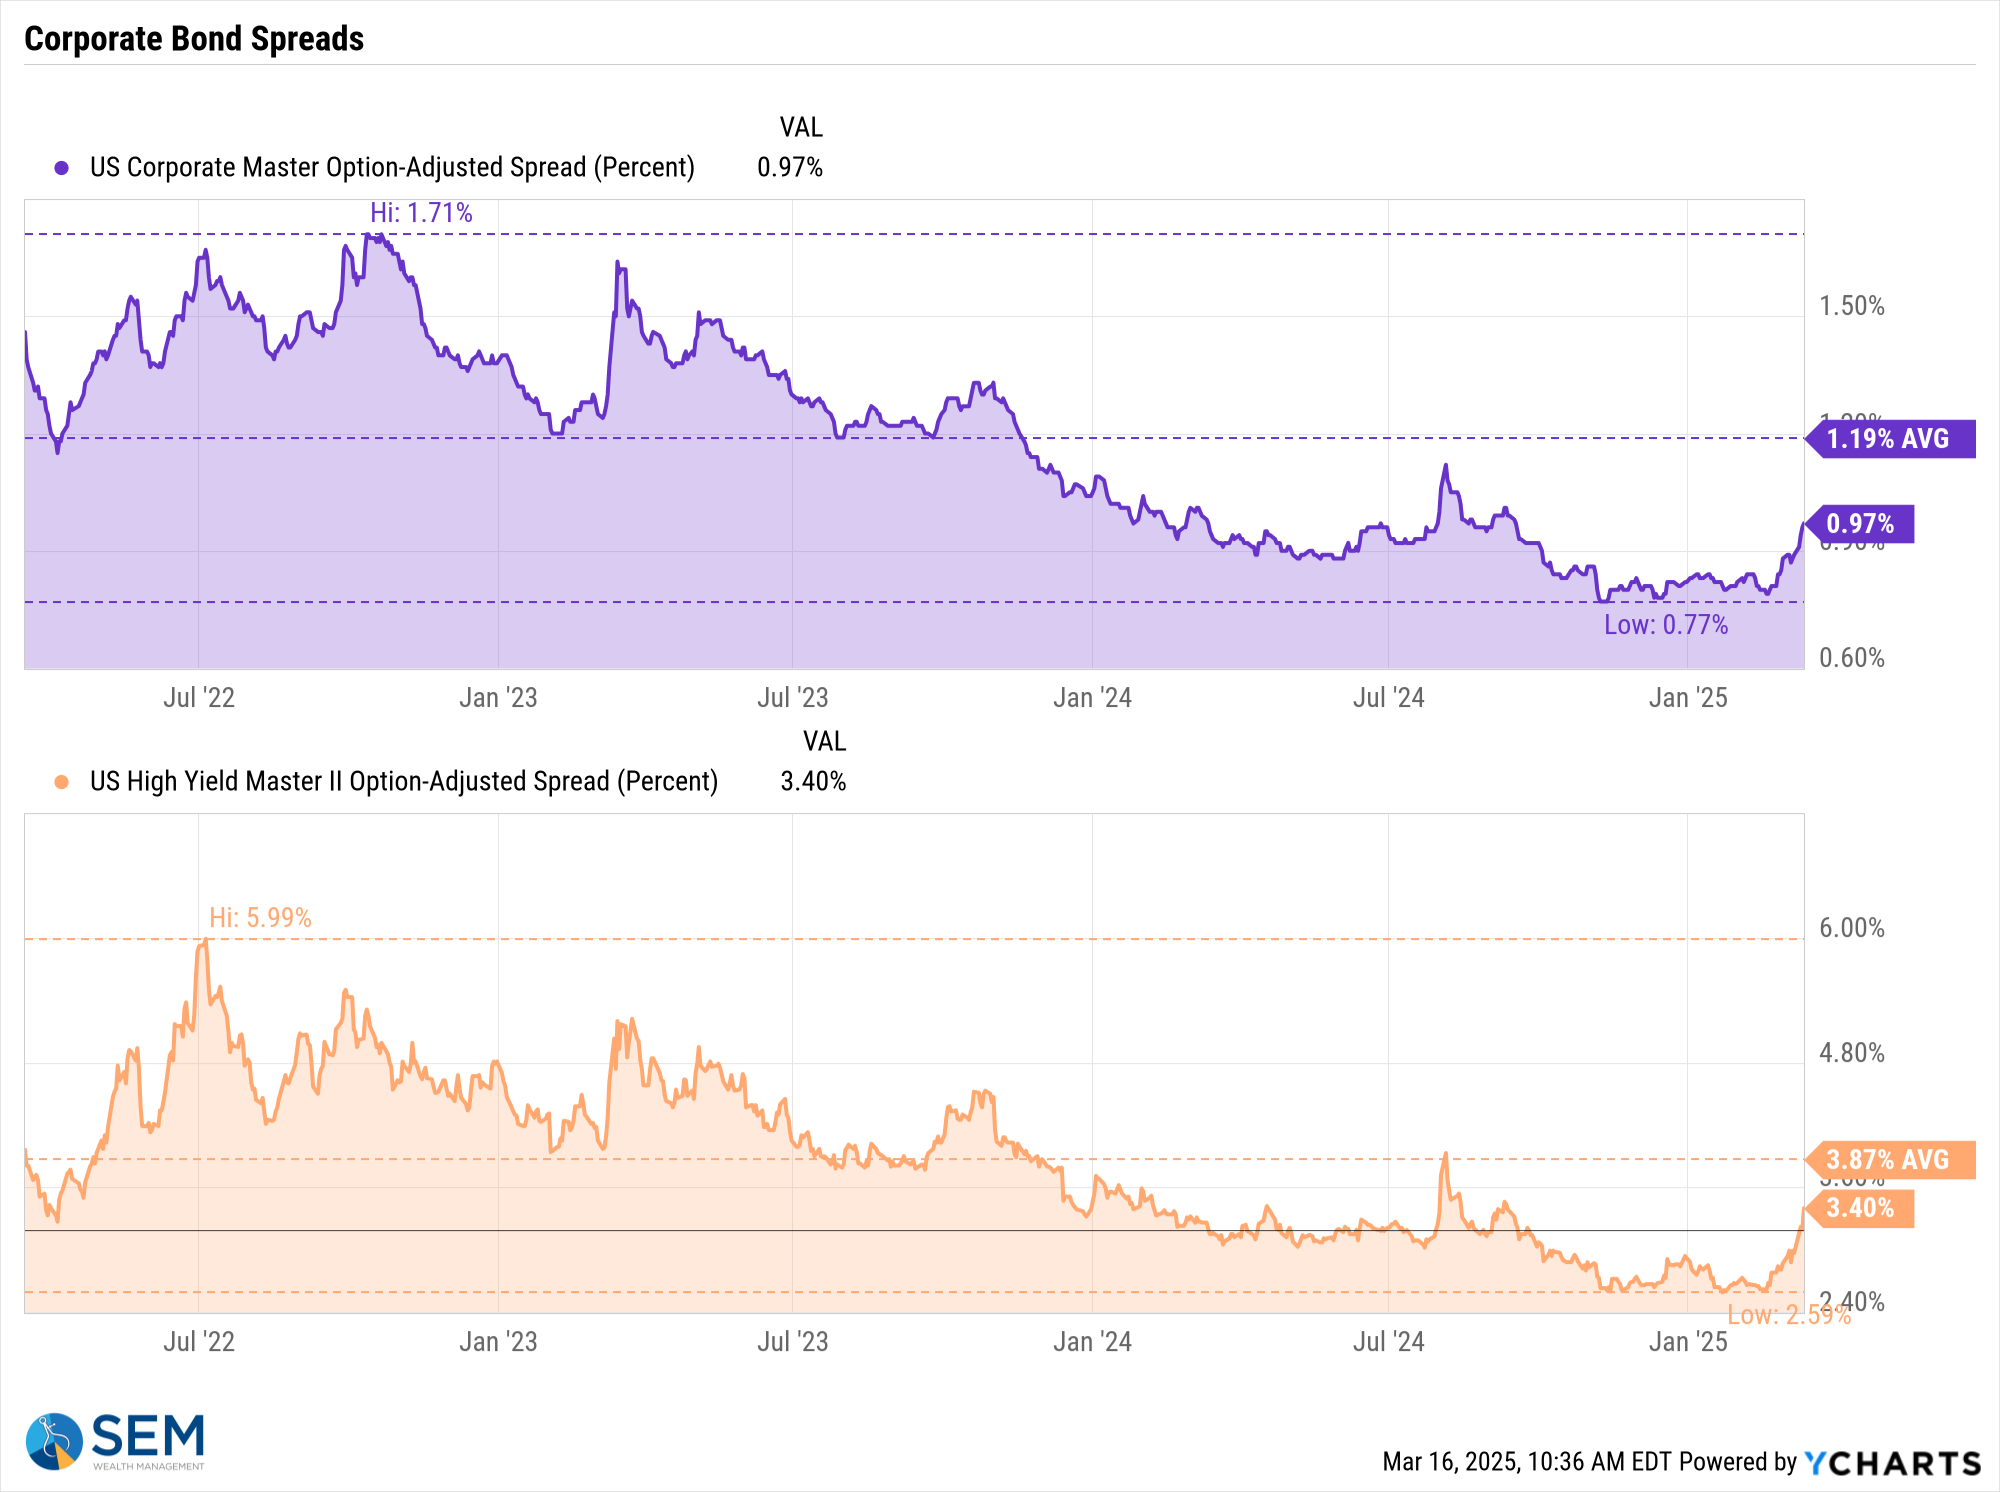
Yes, spreads have moved up for high yield bonds, nearly 80 basis points, but compared to where we were in 2022, they are still quite low.
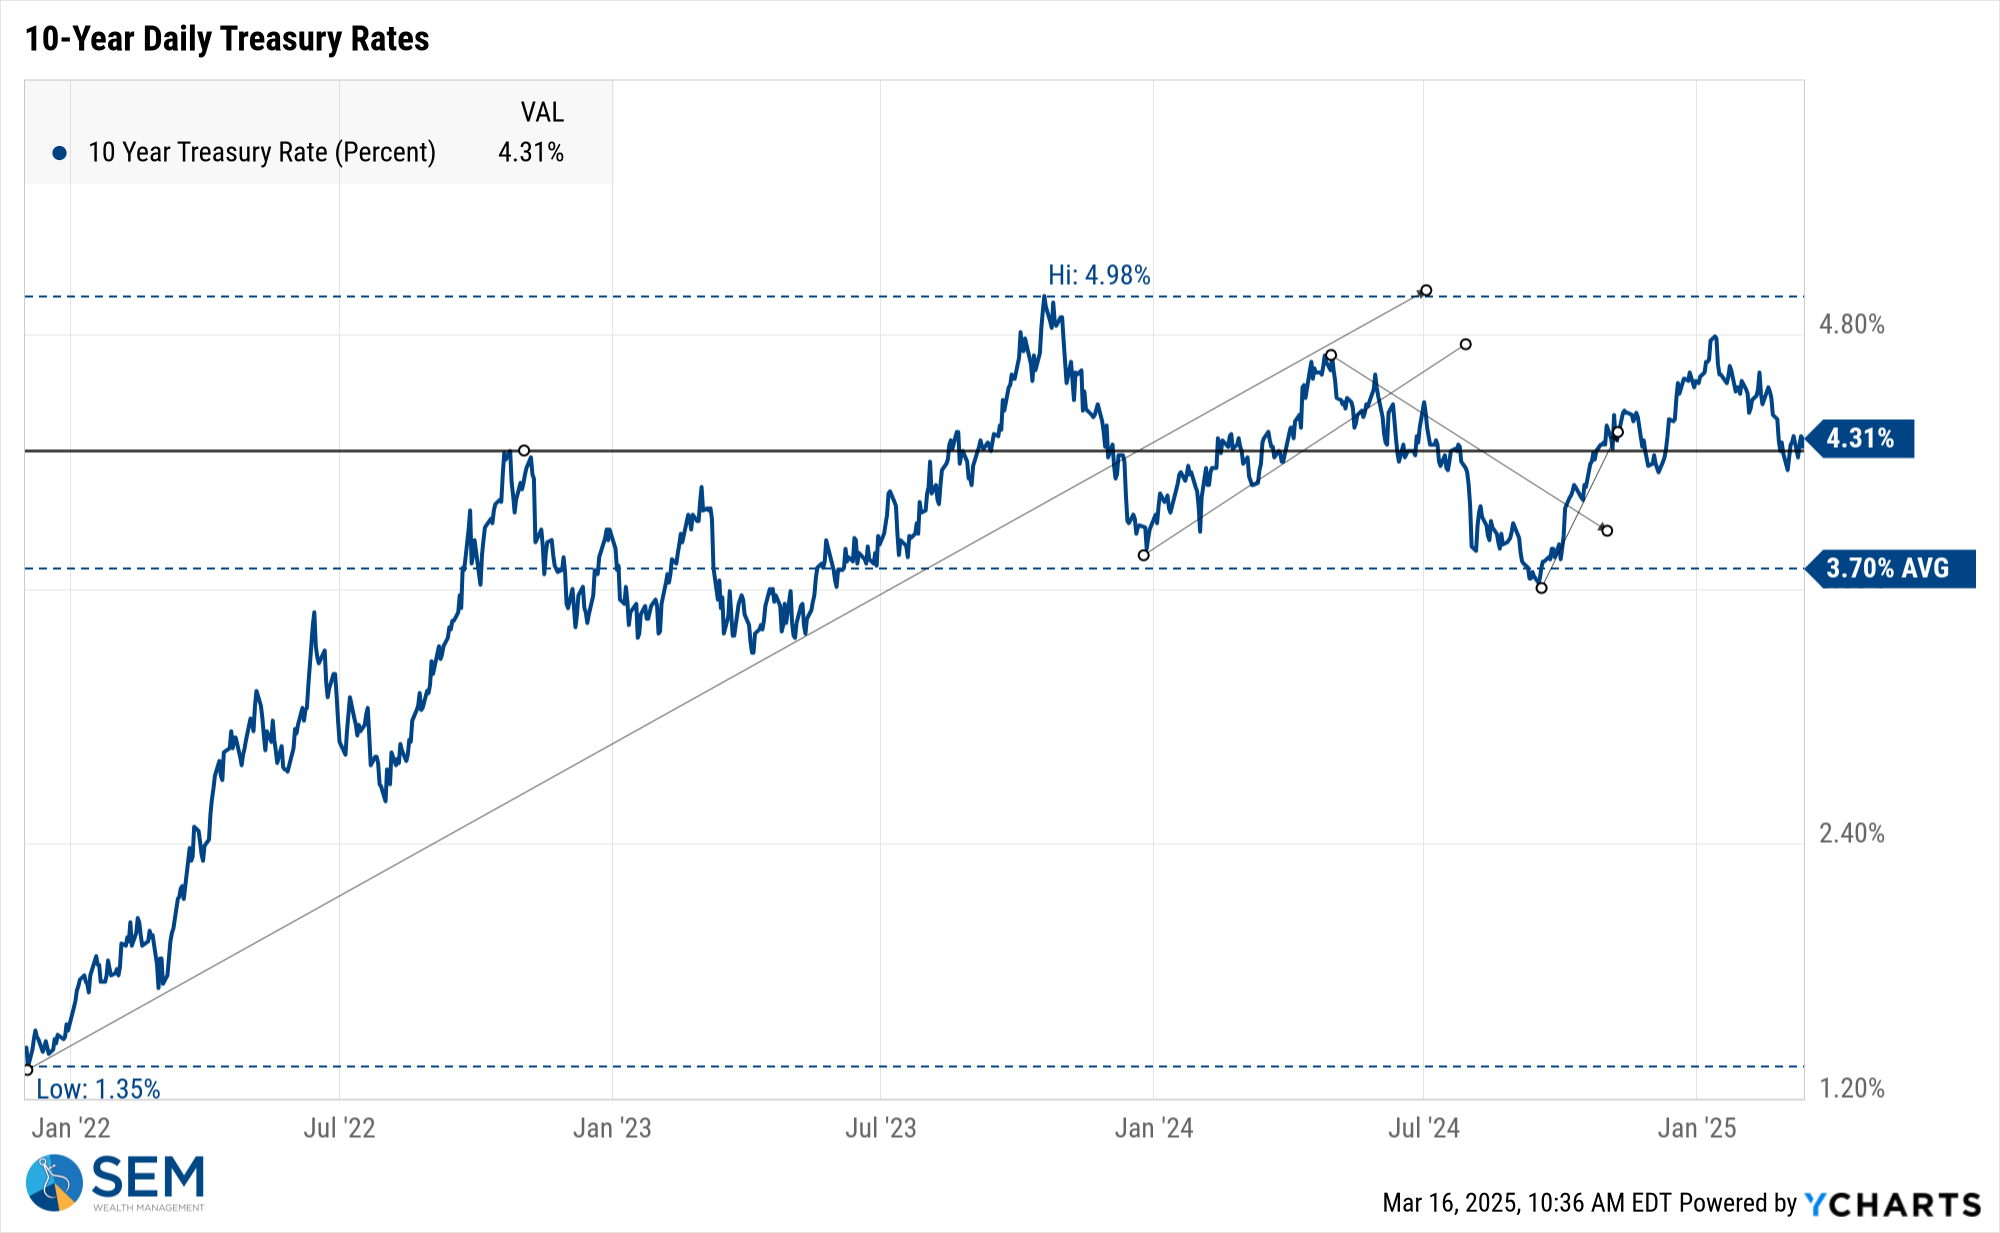
Treasury Bonds also have not given us a clear signal on what to expect for the economy with the 10-year yield essentially back to where we were in December, Last July, late 2023, and late 2022.
In other words, just as our economic model said in our update last week – things are not great, but they also aren't terrible (yet). The primary issue seems to be Wall Street for whatever reason predicted a third consecutive year of above average growth in earnings, which led them to believe stocks would also grow 10-22% this year. The actions by the Trump administration and the latest economic data is making it clear those expectations were probably too high and thus stocks are correcting.

Consumer Pessimism Grows
Once again I will reiterate something I've been saying for close to 20 years – we have severe STRUCTURAL problems which need to be fixed. The fixes all involve short and intermediate-term pain. The last time anybody tried to fix them was in 2011 when Republicans led by the Tea Party forced Congress to make concessions to reign in the budget deficit. (Those concessions were reversed when Donald Trump became president in 2017.)
One reason we've not seen anything meaningful done is the 2-year election cycle. The current living generations of Americans have shown no desire to endure short or intermediate-term pain in order to solve long-term problems which will make us more prosperous down the road. Like him or not, President Trump seems to be the ideal candidate to implement policies which attempt to tear down some of those structural problems. He cannot run for re-election so for the next 4 years he does not need to worry about where he is polling. He can simply do what he believes is right (so long as he has the support of Congress and doesn't violate the Constitution as decided by a Supreme Court where he helped push to a super-majority of conservative judges.)
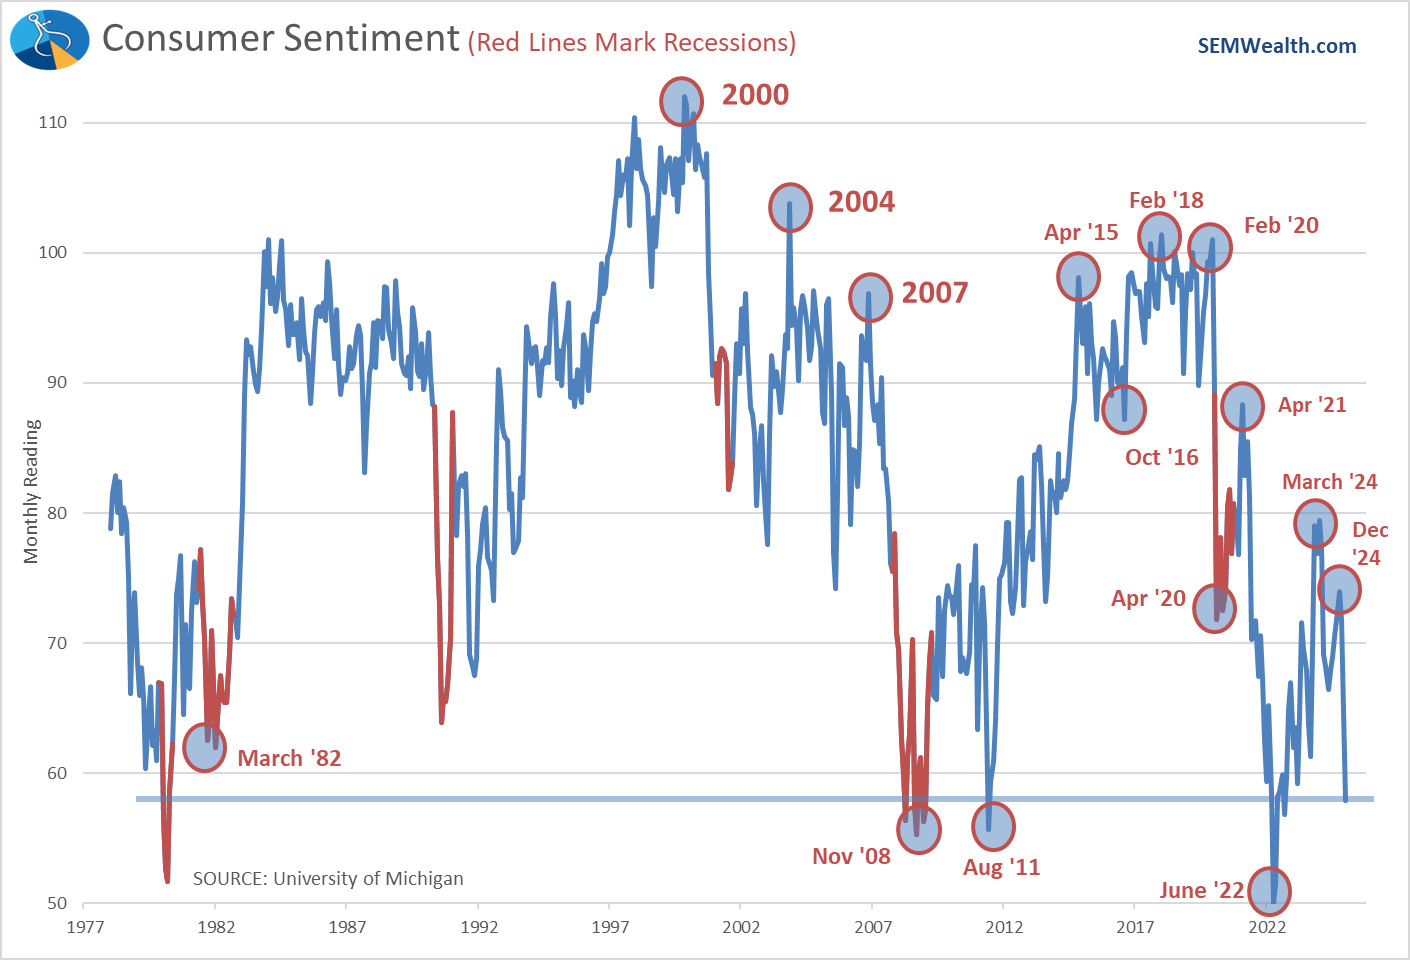
As you would expect, Americans are not happy as these policies will create higher prices, fewer jobs, and slower economic growth (over the short-term). It is no coincidence that Consumer Sentiment has plummeted to levels we've only seen during the raging inflation of 2022, the 'debt ceiling circus' of 2011 (the last time Republicans cared about the deficit), the Great Financial Crisis of 2008, and during the early years of Regan when the Fed was finally getting aggressive in ending the double digit inflation of the 1970s.
Of course, how you feel about inflation depends on which party you belong to, with Democrats showing extreme pessimism and Republicans about as optimistic as they were back in 2018.
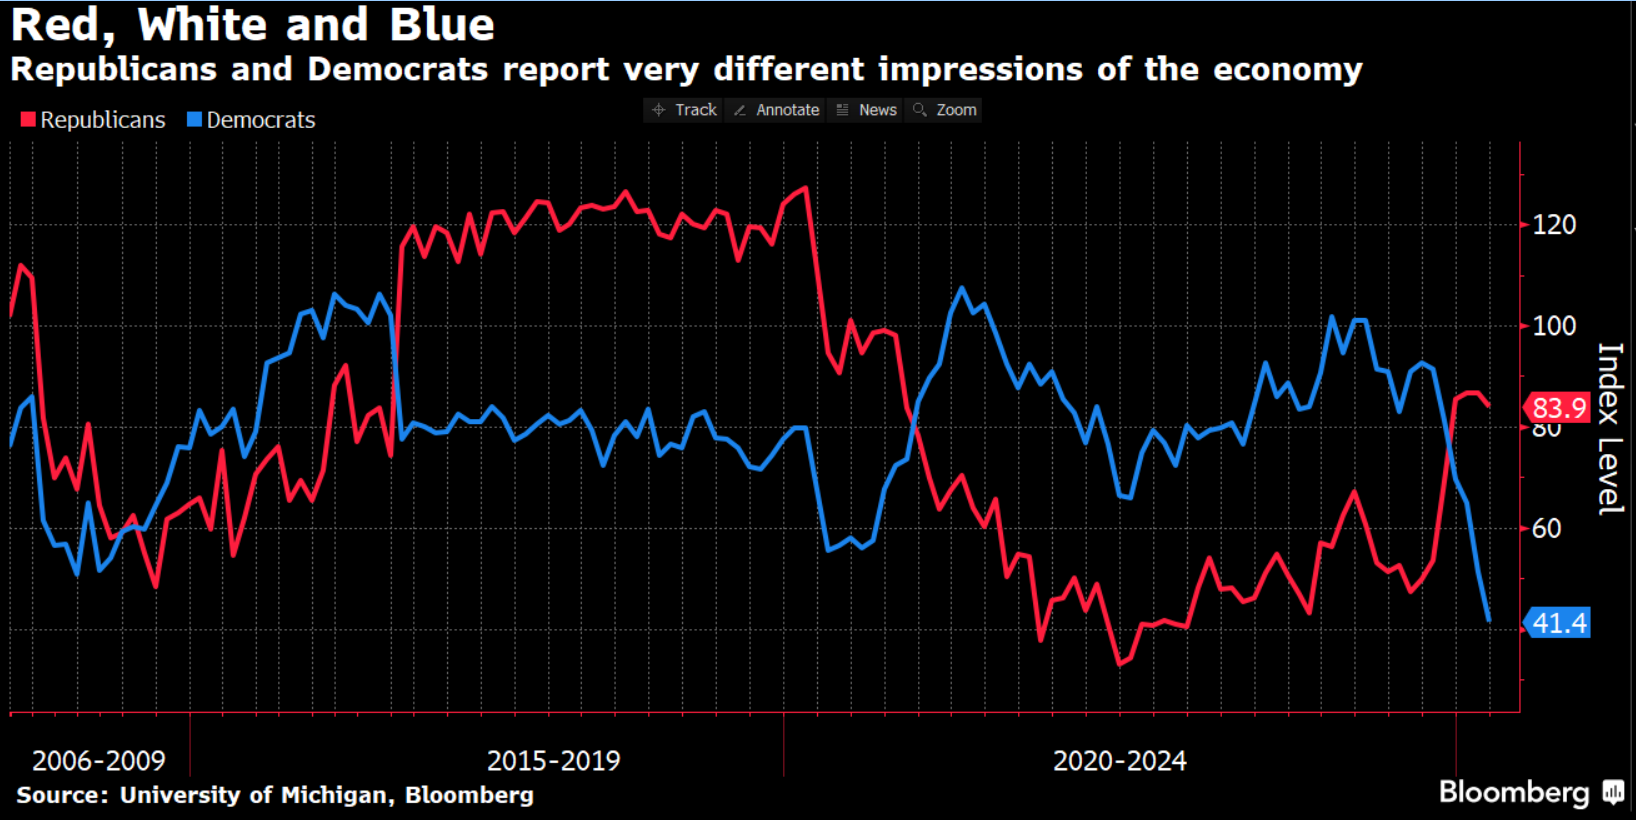
Keep in mind, at last count 42% of Americans were independent, so the two fringes above only represent about 30% of Americans on each side. A pessimistic consumer is not necessarily a predictor of a recession as the market and economy actually bottomed several months after the prior extreme readings in 1982, 2008, 2011, & 2022. It will be interesting if the President is able to continue focusing on the policies he believes are most important even if it means a recession.
SEM Model Positioning
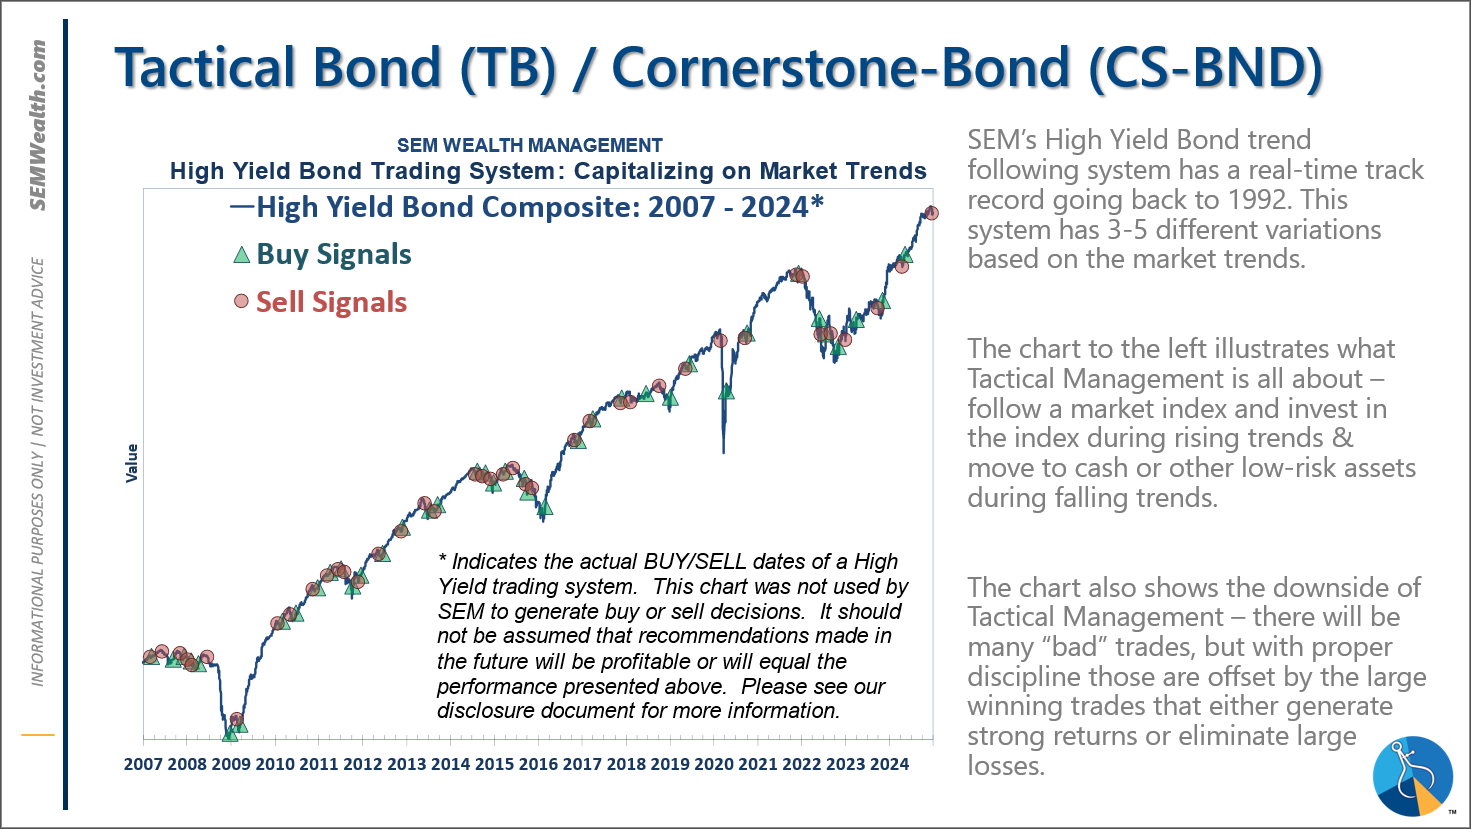
As of this morning, March 17 both our Tactical High Yield and the trend models inside of AmeriGuard and Cornerstone are within a whisker of a sell signal. The action most of last week was negative, but the bounce on Friday if met with follow-through this week could mark a short-term bottom.
Stay tuned.
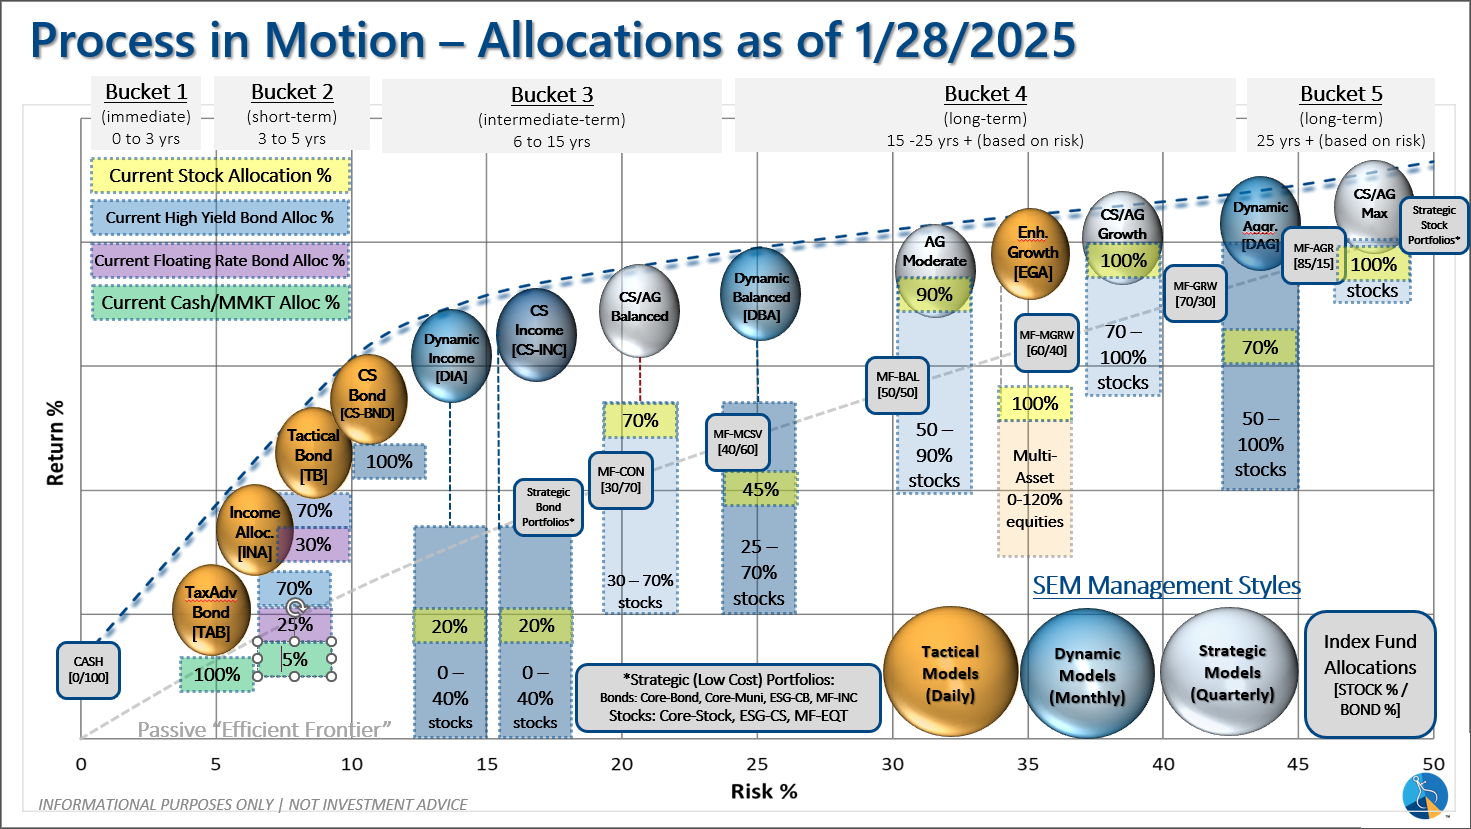
-Tactical High Yield reentered the high yield bond market on 1/27/25 after about 5 weeks on the sidelines. We had added a 30% position in floating rate bonds on 12/6/24, which currently have a 9% yield compared to a 6% yield in high yields and 4.6% in money markets.
-Dynamic Models are 'neutral' as of 6/7/24, reversing the half 'bearish' signal from 5/3/2024. 7/8/24 - interest rate model flipped from partially bearish to partially bullish (lower long-term rates).
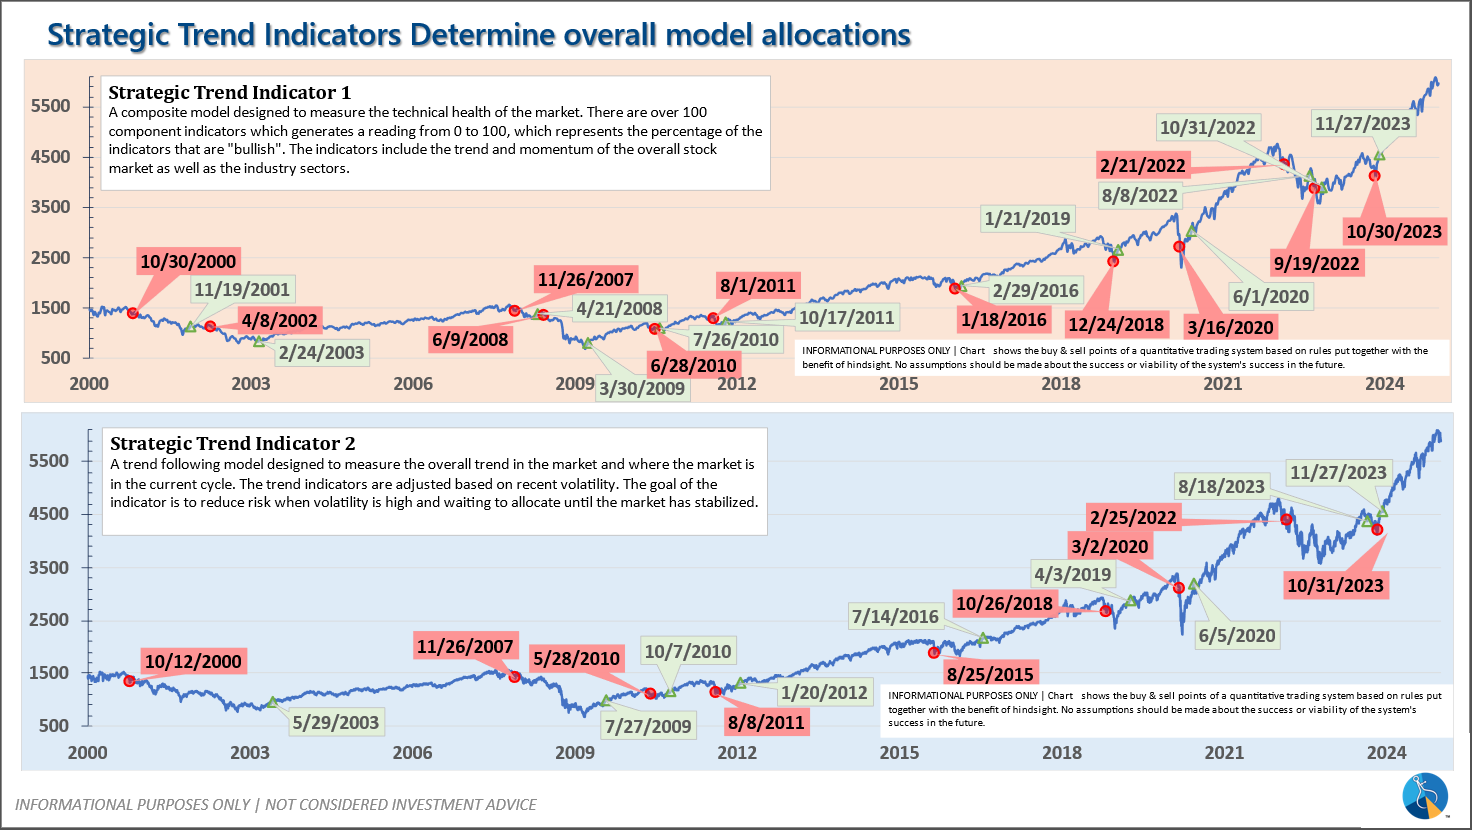
-Strategic Trend Models went on a buy 11/27/2023; 7/8/24 – small and mid-cap positions eliminated with latest Core Rotation System update – money shifted to Large Cap Value (Dividend Growth) & International Funds
SEM deploys 3 distinct approaches – Tactical, Dynamic, and Strategic. These systems have been described as 'daily, monthly, quarterly' given how often they may make adjustments. Here is where they each stand.
Tactical (daily): On 12/20/2024 our tactical high yield model sold out of high yield bond (about 70% of our holdings) into money market. The other 30% is invested in shorter duration, higher yielding floating rate bonds. These instruments are not as sensitive to credit risk and are typically allocated to in the early and late stages of a high yield bond move in our model.
Dynamic (monthly): The economic model was 'neutral' since February. In early May the model moved slightly negative, but reversed back to 'neutral' in June. This means 'benchmark' positions – 20% dividend stocks in Dynamic Income and 20% small cap stocks in Dynamic Aggressive Growth. The interest rate model is slightly 'bullish'.
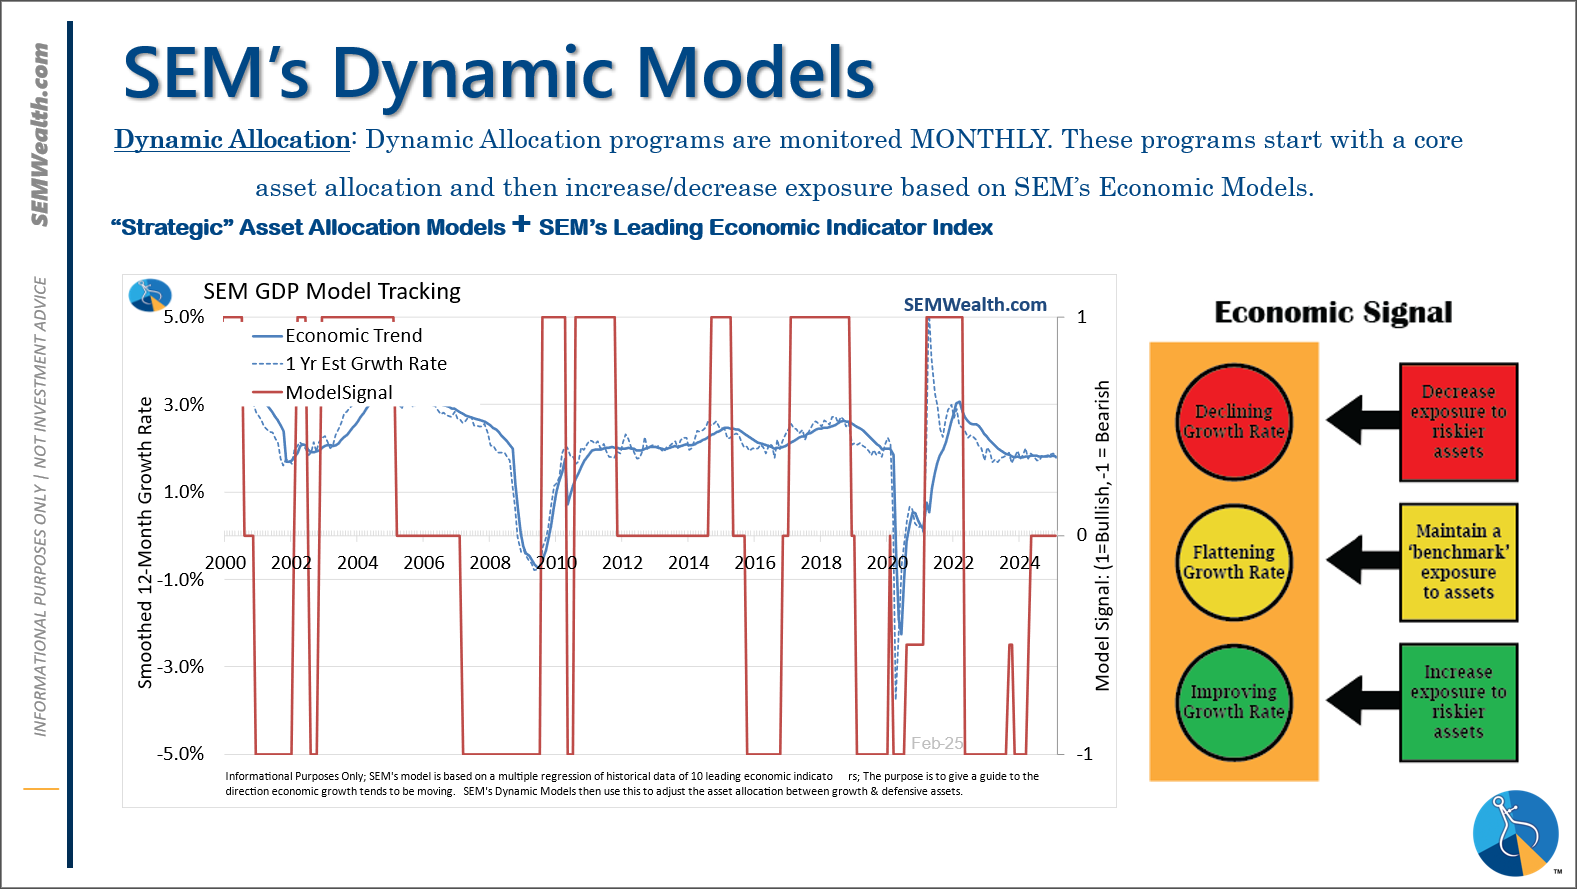
Strategic (quarterly)*
: BOTH Trend Systems reversed back to a buy on 11/27/2023
The core rotation is adjusted quarterly. On August 17 it rotated out of mid-cap growth and into small cap value. It also sold some large cap value to buy some large cap blend and growth. The large cap purchases were in actively managed funds with more diversification than the S&P 500 (banking on the market broadening out beyond the top 5-10 stocks.) On January 8 it rotated completely out of small cap value and mid-cap growth to purchase another broad (more diversified) large cap blend fund along with a Dividend Growth fund.
The * in quarterly is for the trend models. These models are watched daily but they trade infrequently based on readings of where each believe we are in the cycle. The trend systems can be susceptible to "whipsaws" as we saw with the recent sell and buy signals at the end of October and November. The goal of the systems is to miss major downturns in the market. Risks are high when the market has been stampeding higher as it has for most of 2023. This means sometimes selling too soon. As we saw with the recent trade, the systems can quickly reverse if they are wrong.
Overall, this is how our various models stack up based on the last allocation change:
Questions or comments - drop us a note?
Curious if your current investment allocation aligns with your overall objectives and risk tolerance? Take our risk questionnaire


