
Nobody likes going through anything uncomfortable. That's just human nature. This is also true when investing.
Over the long-term, stock market returns have averaged around 10% per year. This is true whether you go back to 1990, 1950, or even 1926. When you start investing the 10% sounds great. What is lost is the way we get to the 10% average — by having years above 10% and years below 10%. It's rare, in fact to have any calendar year where returns were right around 10%.
The chart below looks at the 10-year annualized returns going back to 1938. Note returns are above 10% about half the time and below 10% the other half. Also note the cycles of above and below average returns.
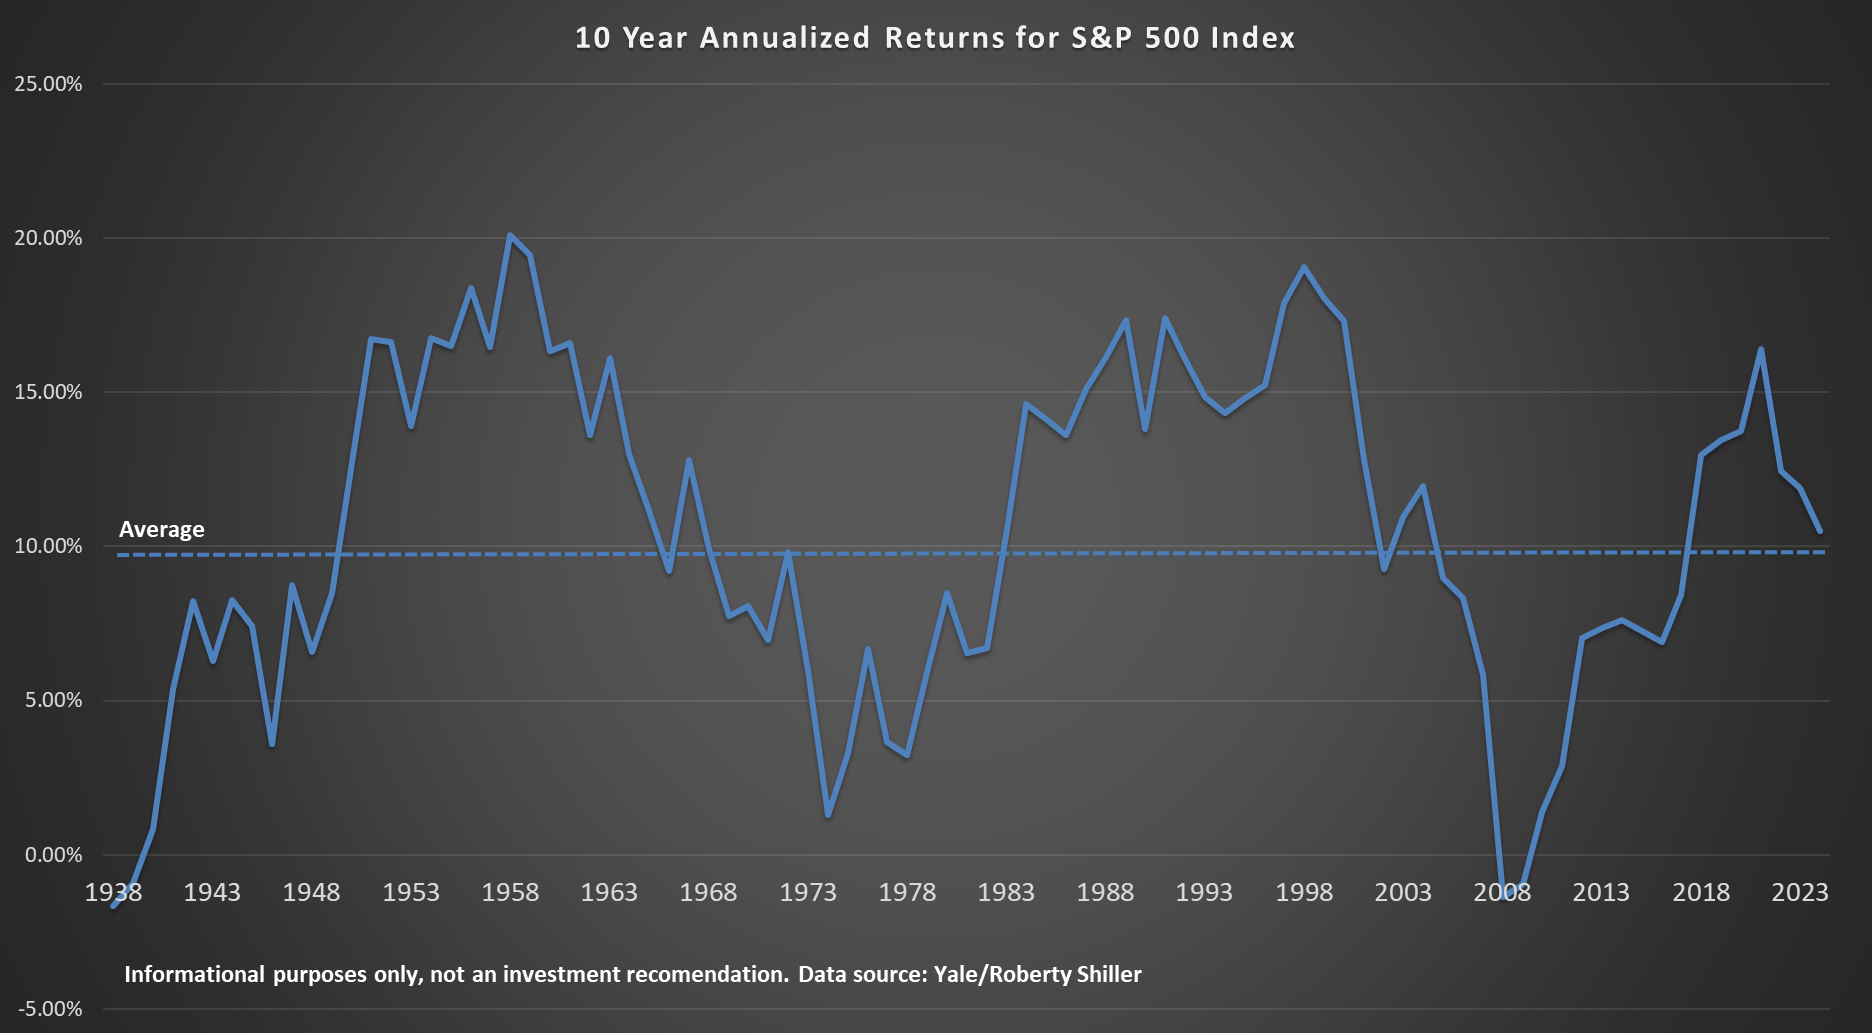
Fundamentally, the stock market of any country can only mathematically grow at the sum of Economic Growth + Dividend Yield + Inflation. Since we do not know the future and because humans are involved, investors are forced to anticipate what all of the growth factors will be and act accordingly. This leads to periods of time where the market is overly optimistic on growth followed by periods of time the market is overly pessimistic.
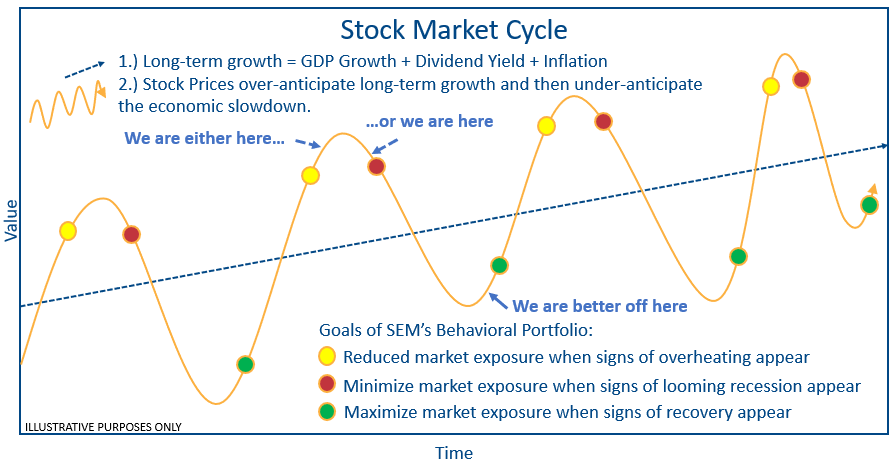
Looking at the long-term averages:
- GDP = 3.1%
- Inflation = 3.1%
- S&P 500 Dividend Yield = 3.7%
Sum those up and we get 9.9%. This is not a coincidence. That's just fundamental economics.
When the fundamentals do not match the anticipated growth rate, prices correct. How much depends on how extended a rally has been. Here are some statistics to keep in mind.
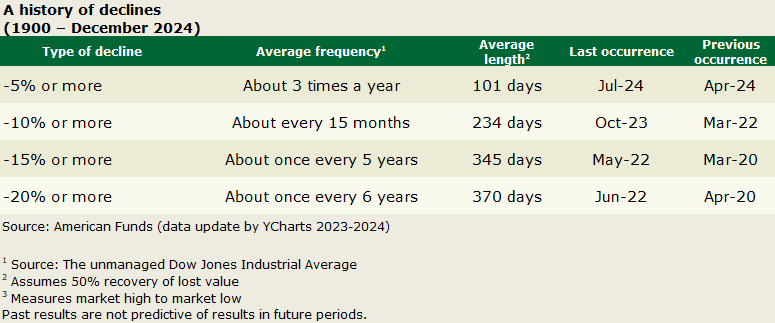
Keep in mind, the "average" 5% correction bottoms around 7% and the "average" 10% correction bottoms around a 14.5% drop. The "average" 20% correction (the typical definition of a bear market) bottoms at a 35% drop. With 5% corrections happening 3 times a year we should consider this a normal event. Even a once every 15 month 10% drop is pretty standard for long-term investors. The drops we are more concerned about at SEM is when the 10% drop turns into a 15% drop. Those can easily turn into 20% "bear markets" which spiral down 35% before it's over.
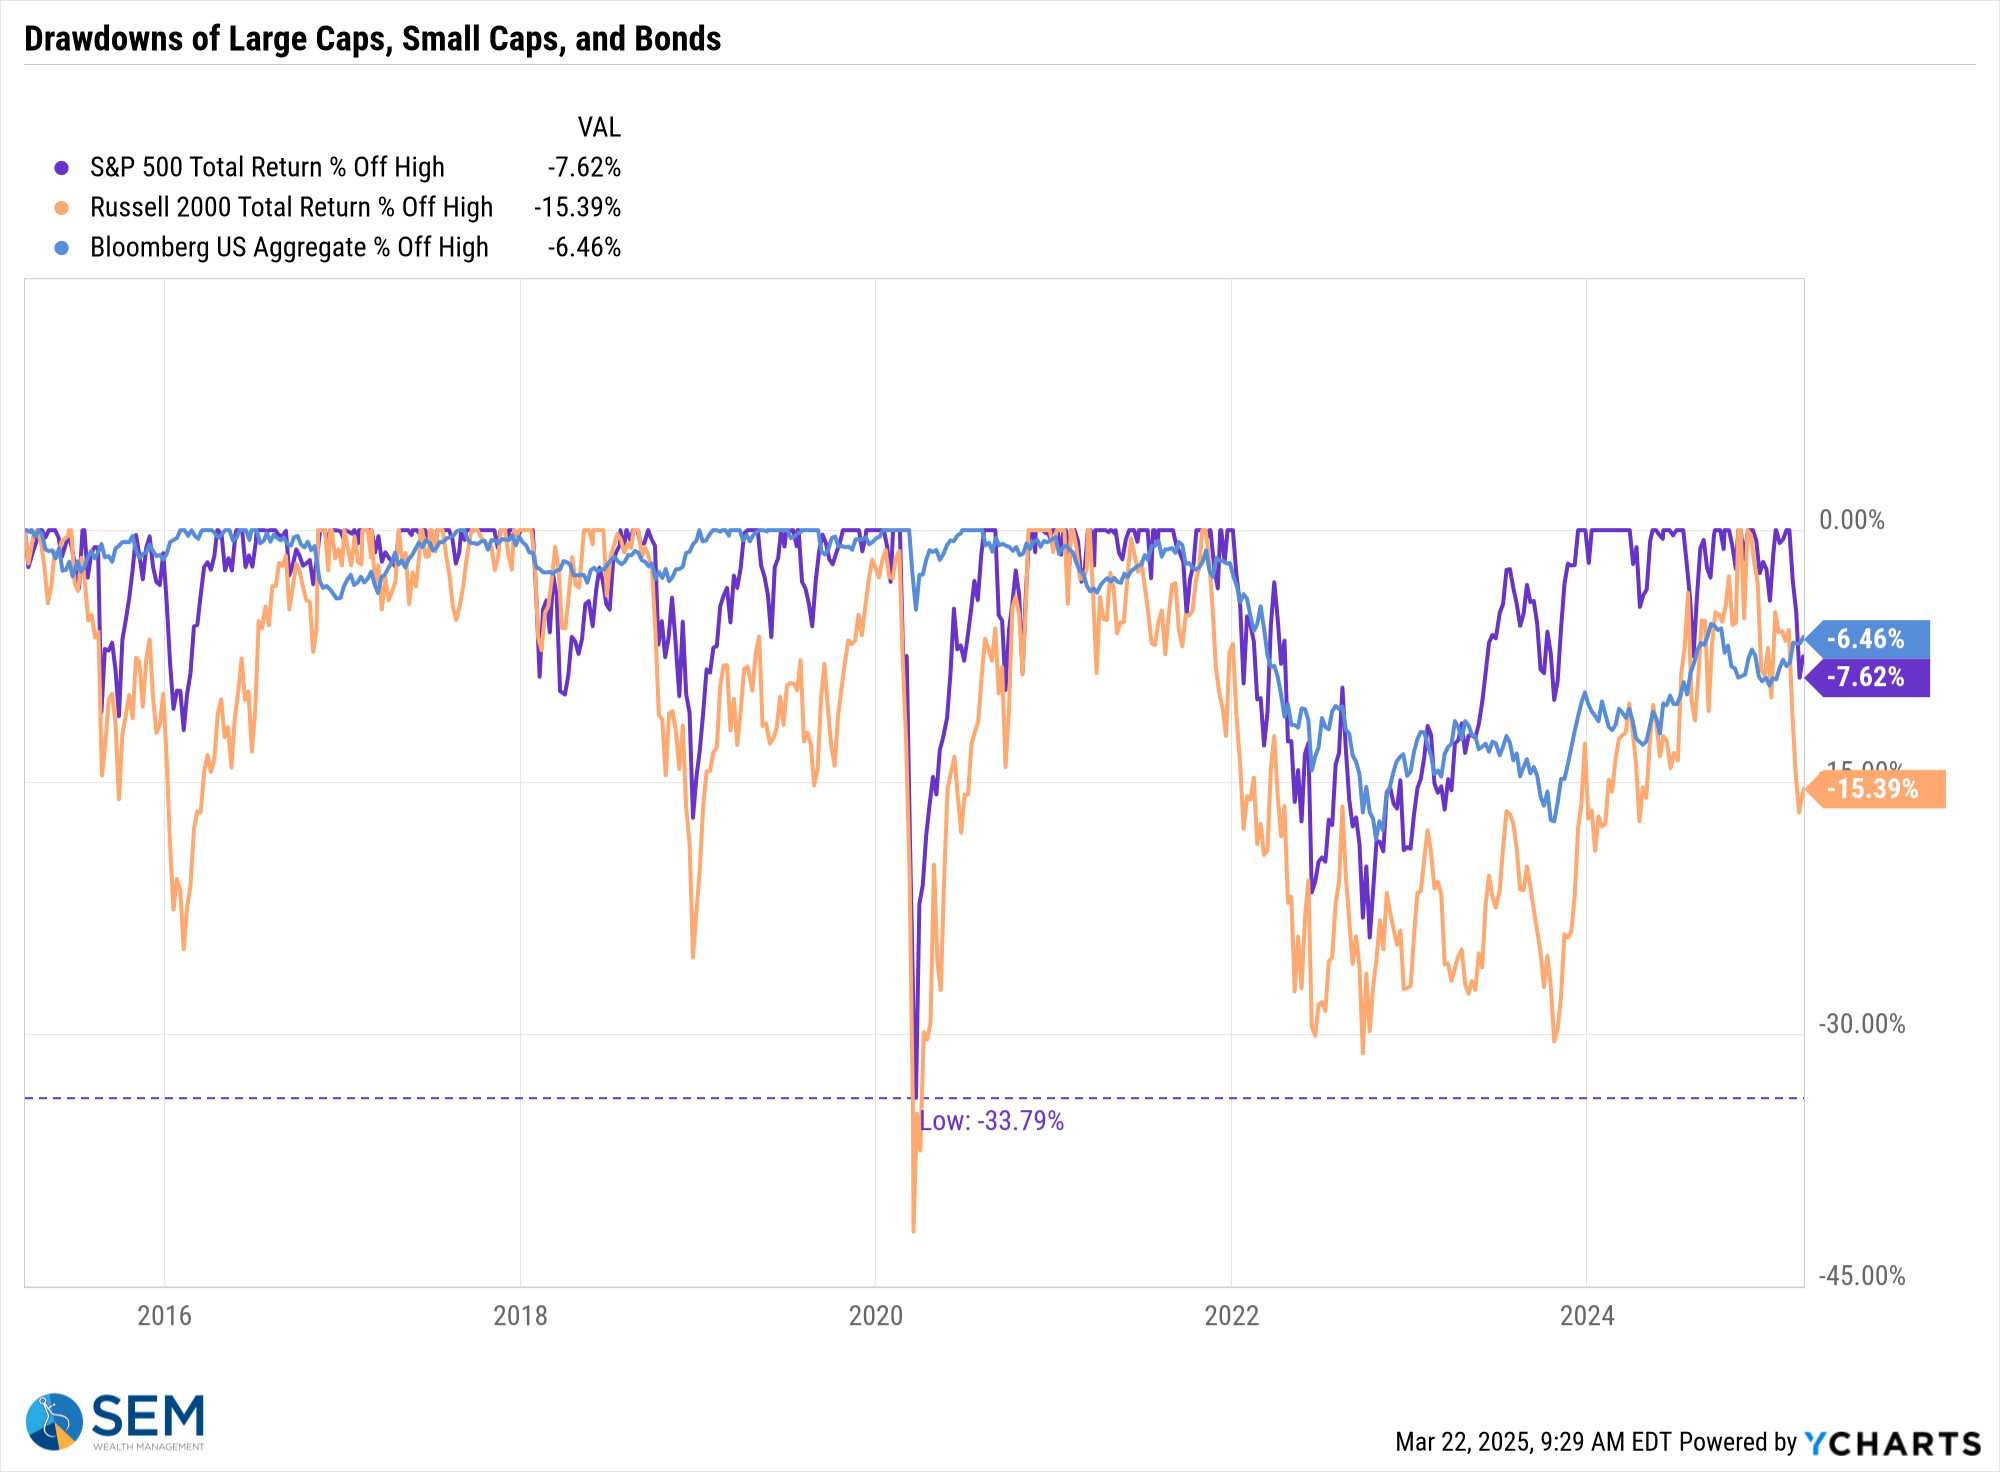
The S&P 500 is currently down 7.6% from its high. The bottom so far was down 10.04% on March 13. So far, according to our models, this appears to be a "normal" correction. They typically will not start getting worried until we get around the 12-13% drop because historically those turn into 15% corrections, which often turn into the 20% "bear markets" (which average a 35% drop overall.)
We are most certainly due for a correction bigger than 10% simply because of the spectacular growth both since the bottom in 2022 and all the way back to the end of the financial crisis in 2009.
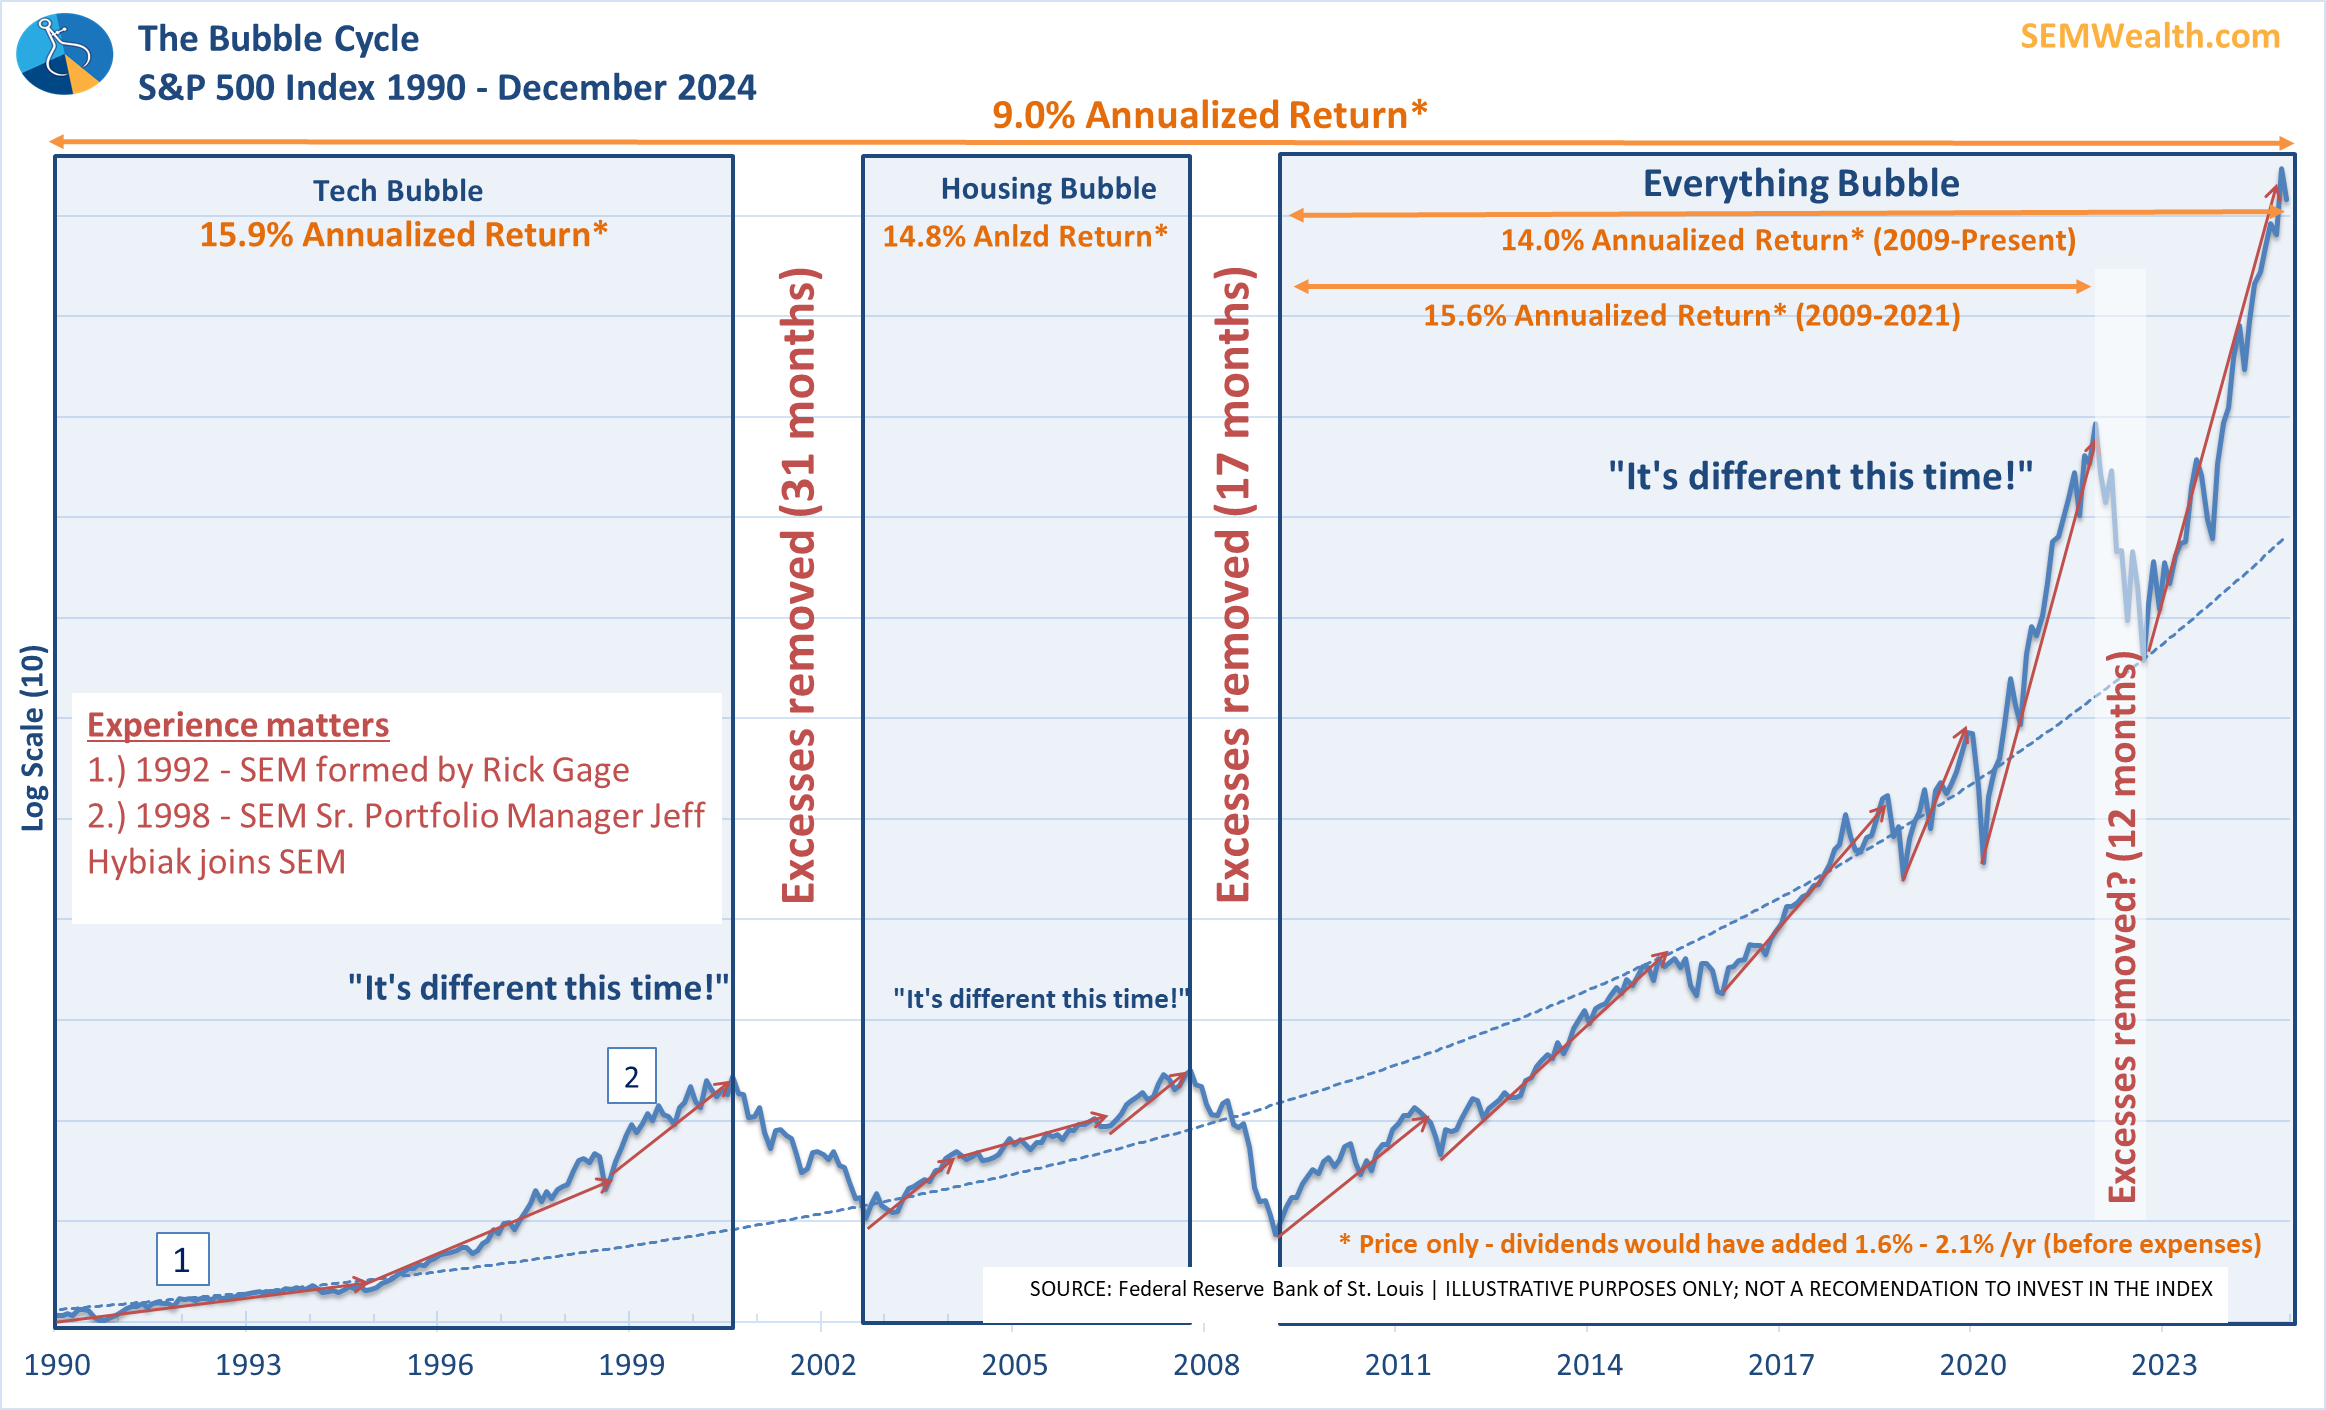
Going back to the fundamental return expectations for the market, one thing that we have been concerned about is what seems to be unreasonable expectations.
- GDP Growth (3.1% historic average) — currently tracking around 2.5% according to our model.
- Inflation (3.1% historic average) – we are more likely to be at 3% than 2% for the foreseeable future
- Dividend Yield (3.7% historic average) – currently 1.3% (close to the all-time low of 1.1% in April 2000, just as the tech bubble was bursting).
Sum those up and we get 6.8% long-term expected returns for the S&P 500. With returns averaging 14% going back to 2009 and Wall Street still expecting somewhere between 10-18% returns for 2025, something seems off.
While painful, a correction bigger than 10% is necessary to correct the excesses which have built up due to the Fed and government policies following the financial crisis and COVID. We need the market to become overly pessimistic if we want to have above average returns. Wiping out the excesses actually creates more efficient capital. Until that happens the market is living on borrowed time.
Part of these excesses are deep inside our economy. We are spending too much money to "stimulate" growth and we have created a massive trade deficit to support our standard of living. That cannot continue if we want to get to 3.1% GDP growth again. Which brings me to the next point.
Re-writing Trump's Message
As most of you know, we do our best to keep politics out of everything at SEM. However, politics at times will influence both the investment markets and the sentiment of our clients and advisors. During a call last week with a group of our largest advisors we discussed the short, intermediate, and long-term impact of two of President Trump's agenda items – tariffs and the Department of Government Efficiency (DOGE).
After explaining why the actions being taken are necessary, one of the advisors said, I wish this was the message President Trump was giving to the American people. Right now the American people simply do not understand why what is happening must be done. We would love to see White House Press Secretary Karoline Leavitt using this metaphor every single day from her podium.
Imagine the American economy as you at age 40. You go to the doctor and the doctor says, "You might feel ok now, but I see several things in your lifestyle and in your lab work which tells me your life expectancy will both be shorter than it should be and your later years are likely to be quite uncomfortable. If you take some actions now, you are likely to live longer and be healthier later in your life."
"So what do I need to do, doc?" you ask.
"First you need to start exercising and working out 4-5 times a week for at least 30-60 minutes. Beyond that, you need to make some modifications to your diet. You're taking in too much sugar, too many processed foods, and way too much fat."
"Those are some big changes," you say reluctantly.
"Yes," your doctor responds, "but notice I didn't say become a gym rat and completely eliminate all the foods which bring you joy. Small and purposeful changes now will make a huge difference in your life expectancy and quality of life. It may be painful in the beginning, but if you don't do this, the pain you face in the future will be much worse."
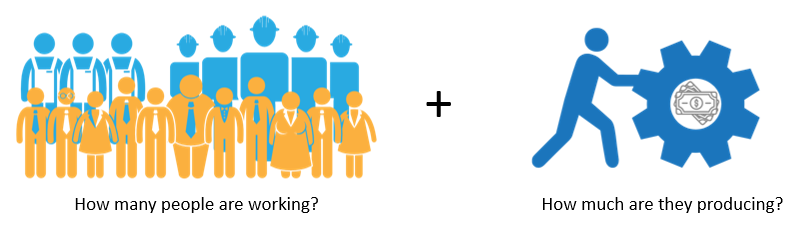
How does this relate to our economy, our future? It's quite simple. Mathematically the growth rate of our economy over the long-term is the sum of how many people are working and how much they are producing. This is called the potential GDP equation.
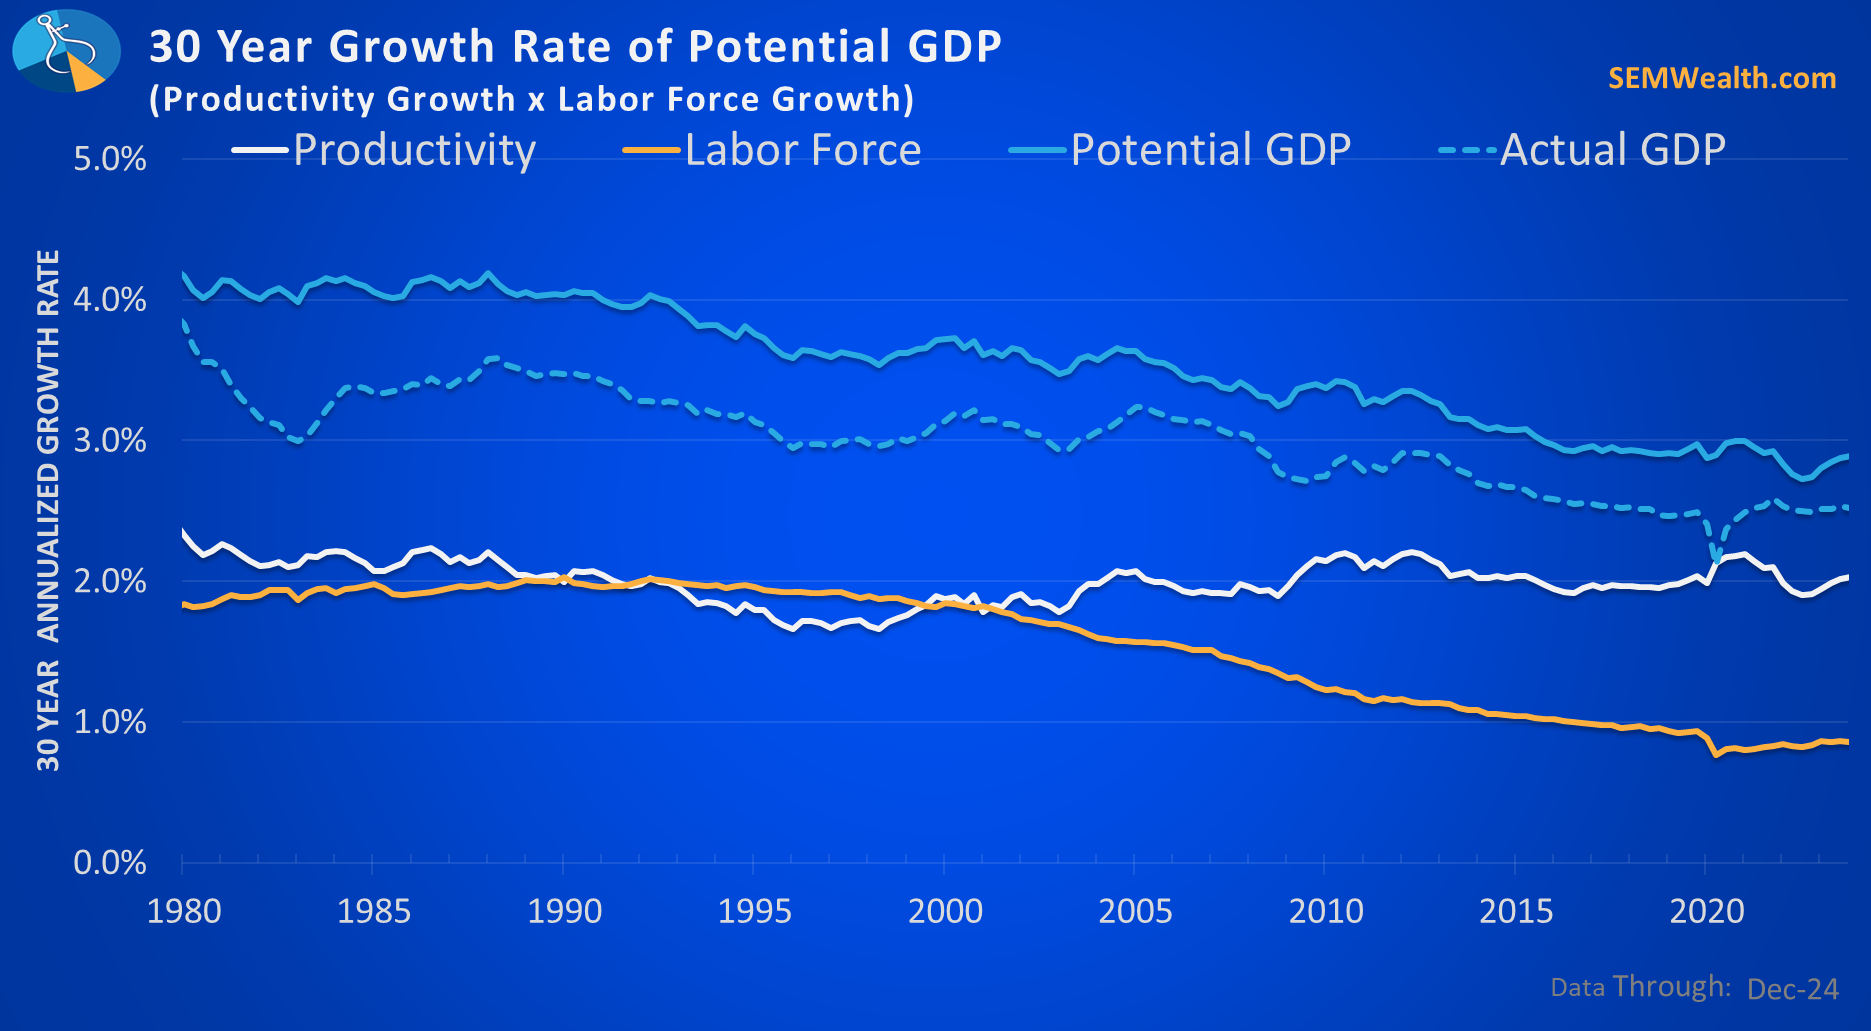
Over the long-term, the US economy has grown at a rate of 3.1%. However, the potential GDP equation says we should have been growing at a rate of 3.5%. Worse, over the last 30 years, as Babyboomers have retired our labor force has shrunk. Our economy has only grown at a 2.5% annual rate. The potential GDP equation says we should have grown at a 2.9% rate.
Why are we growing at a rate less than our potential? It is because we need to add a bit more to the equation.......our dual deficits.
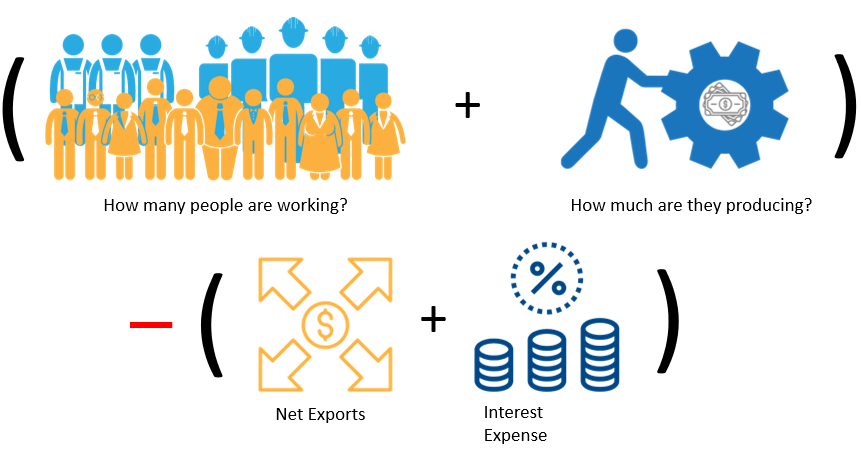
You see, when we import more than we export (the trade deficit) we send money out of our economy. When we borrow money, the interest expense leaves our economy and goes to the people who lent it to us. The bigger the trade and budget deficits, the more drag it has on our potential to grow.
The goal of the tariffs (the so-called Trade War) and DOGE is to take steps NOW so we can grow more in the future. If we continue to be fat and lazy our economy will not live as long as it should AND the end years will be much more painful. Tariffs and DOGE are simply our economy deciding to take some short-term pain and discomfort in order to have some long-term benefits.
This obviously takes time, but we CANNOT continue on this path. Despite all of the technological innovations since the 1980s, productivity growth has remained around 2%. This means we MUST grow our labor force.
It also means the growth in the labor force will not be enough. We CANNOT keep sending money to other countries to buy "stuff". We CANNOT keep borrowing more and more money to fund current spending.
Just like when you start a diet and exercise program, the first few months are not pleasant and we all want to quit. However, if you can make it 3 months, then 6 months and you start seeing the results, the next 9-18 months become that much easier. This is when the true benefits begin to show up.
If we want out economy to both survive and thrive, we need to take some pain over the next 6-9 months. It takes time to fix 30-50 years of sloth and gluttony, but if we stick to the plan, our future will be that much brighter.
Market Charts
Stocks seemed to have stabilized a bit over the past week. The market may be getting used to the on again, off again tariff chatter, or it was simply a quiet week on that front.
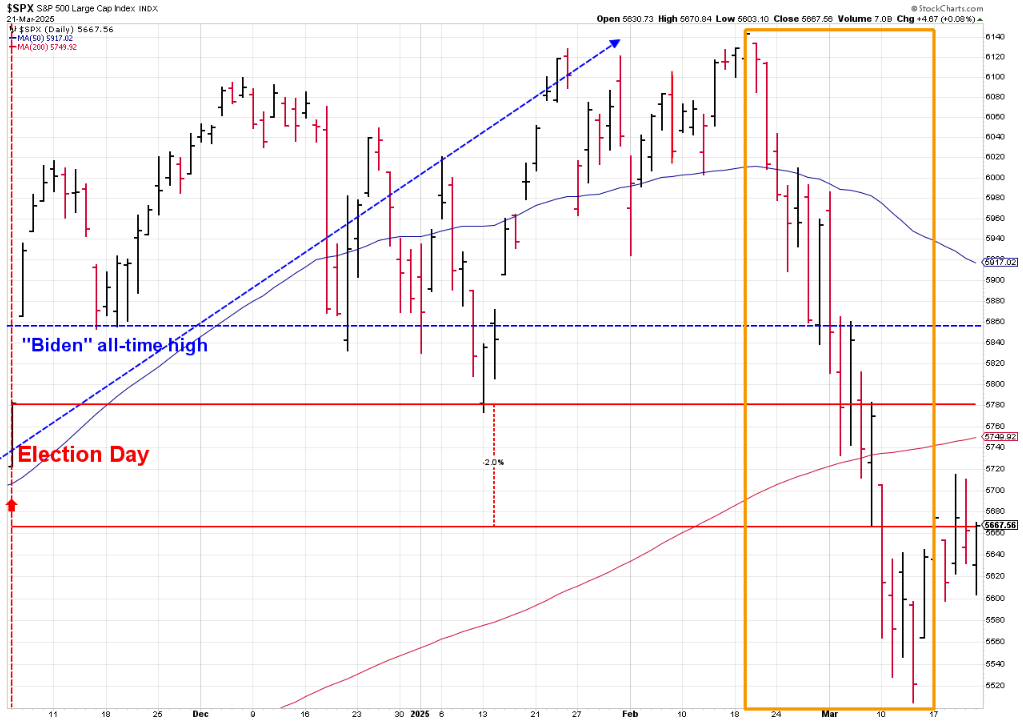
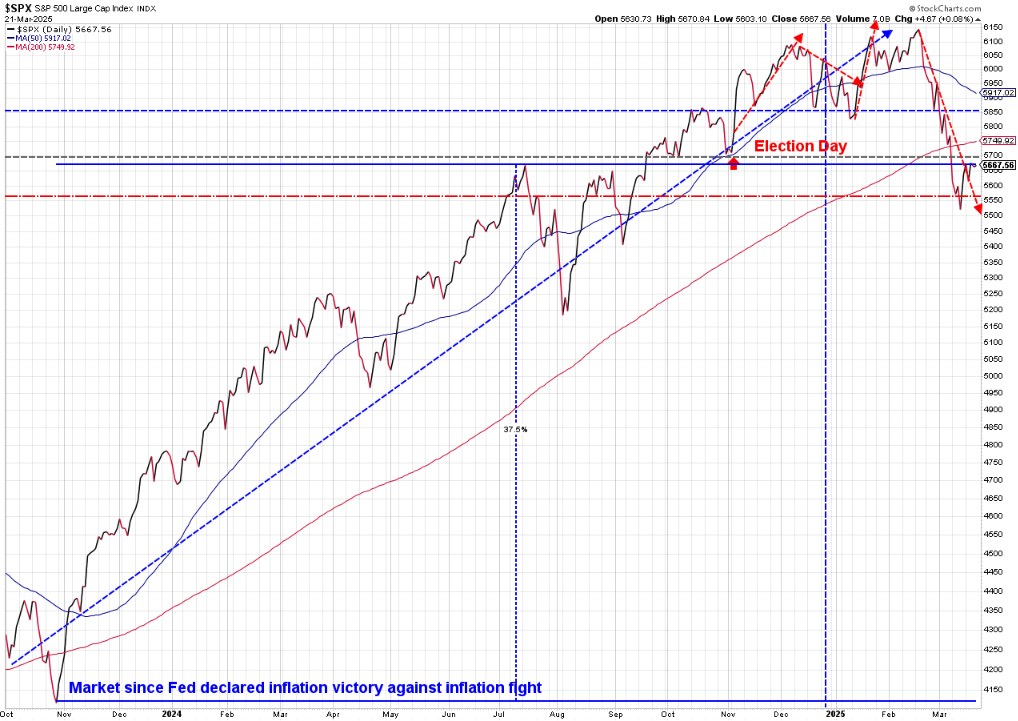
This chart is more important for perspective. While the uptrend line has been broken, it does appear the market is trying to stabilize. Around 5550 is the area some of our trend models will begin to sell (the red dashed line). The dashed grey line around 5700 (the Election Day opening price as well as the bottom just before the election) seems to be important psychologically as well.
Overall, the S&P 500 remains in the lead on the year-to-date board for stocks while bonds had a steady week.
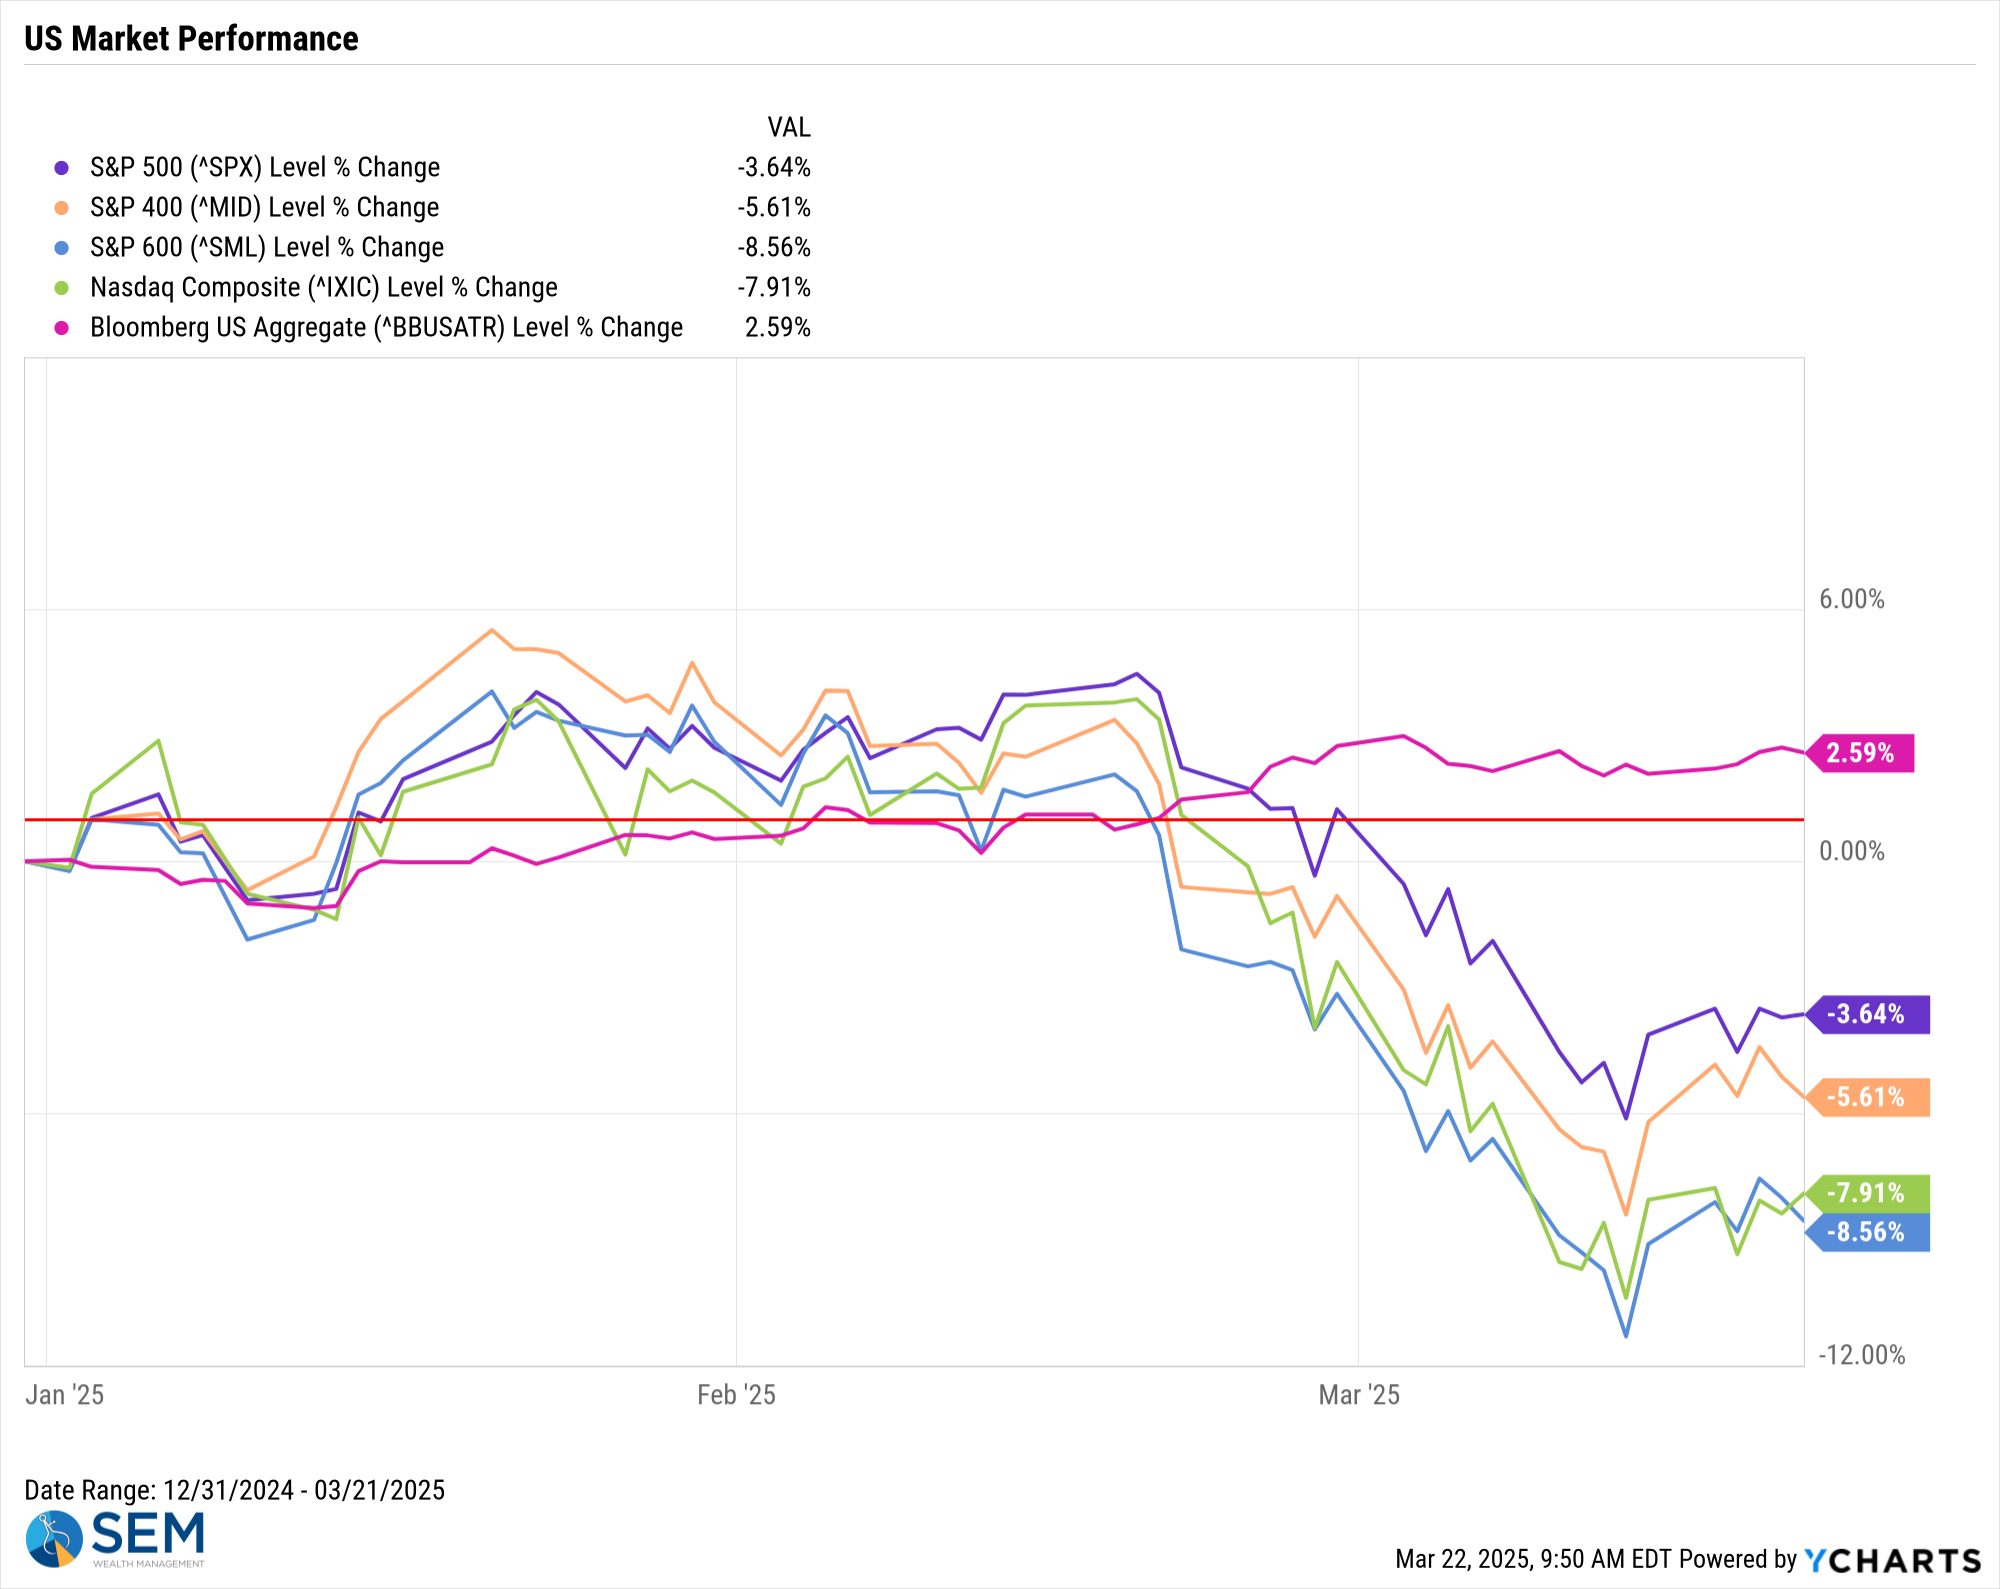
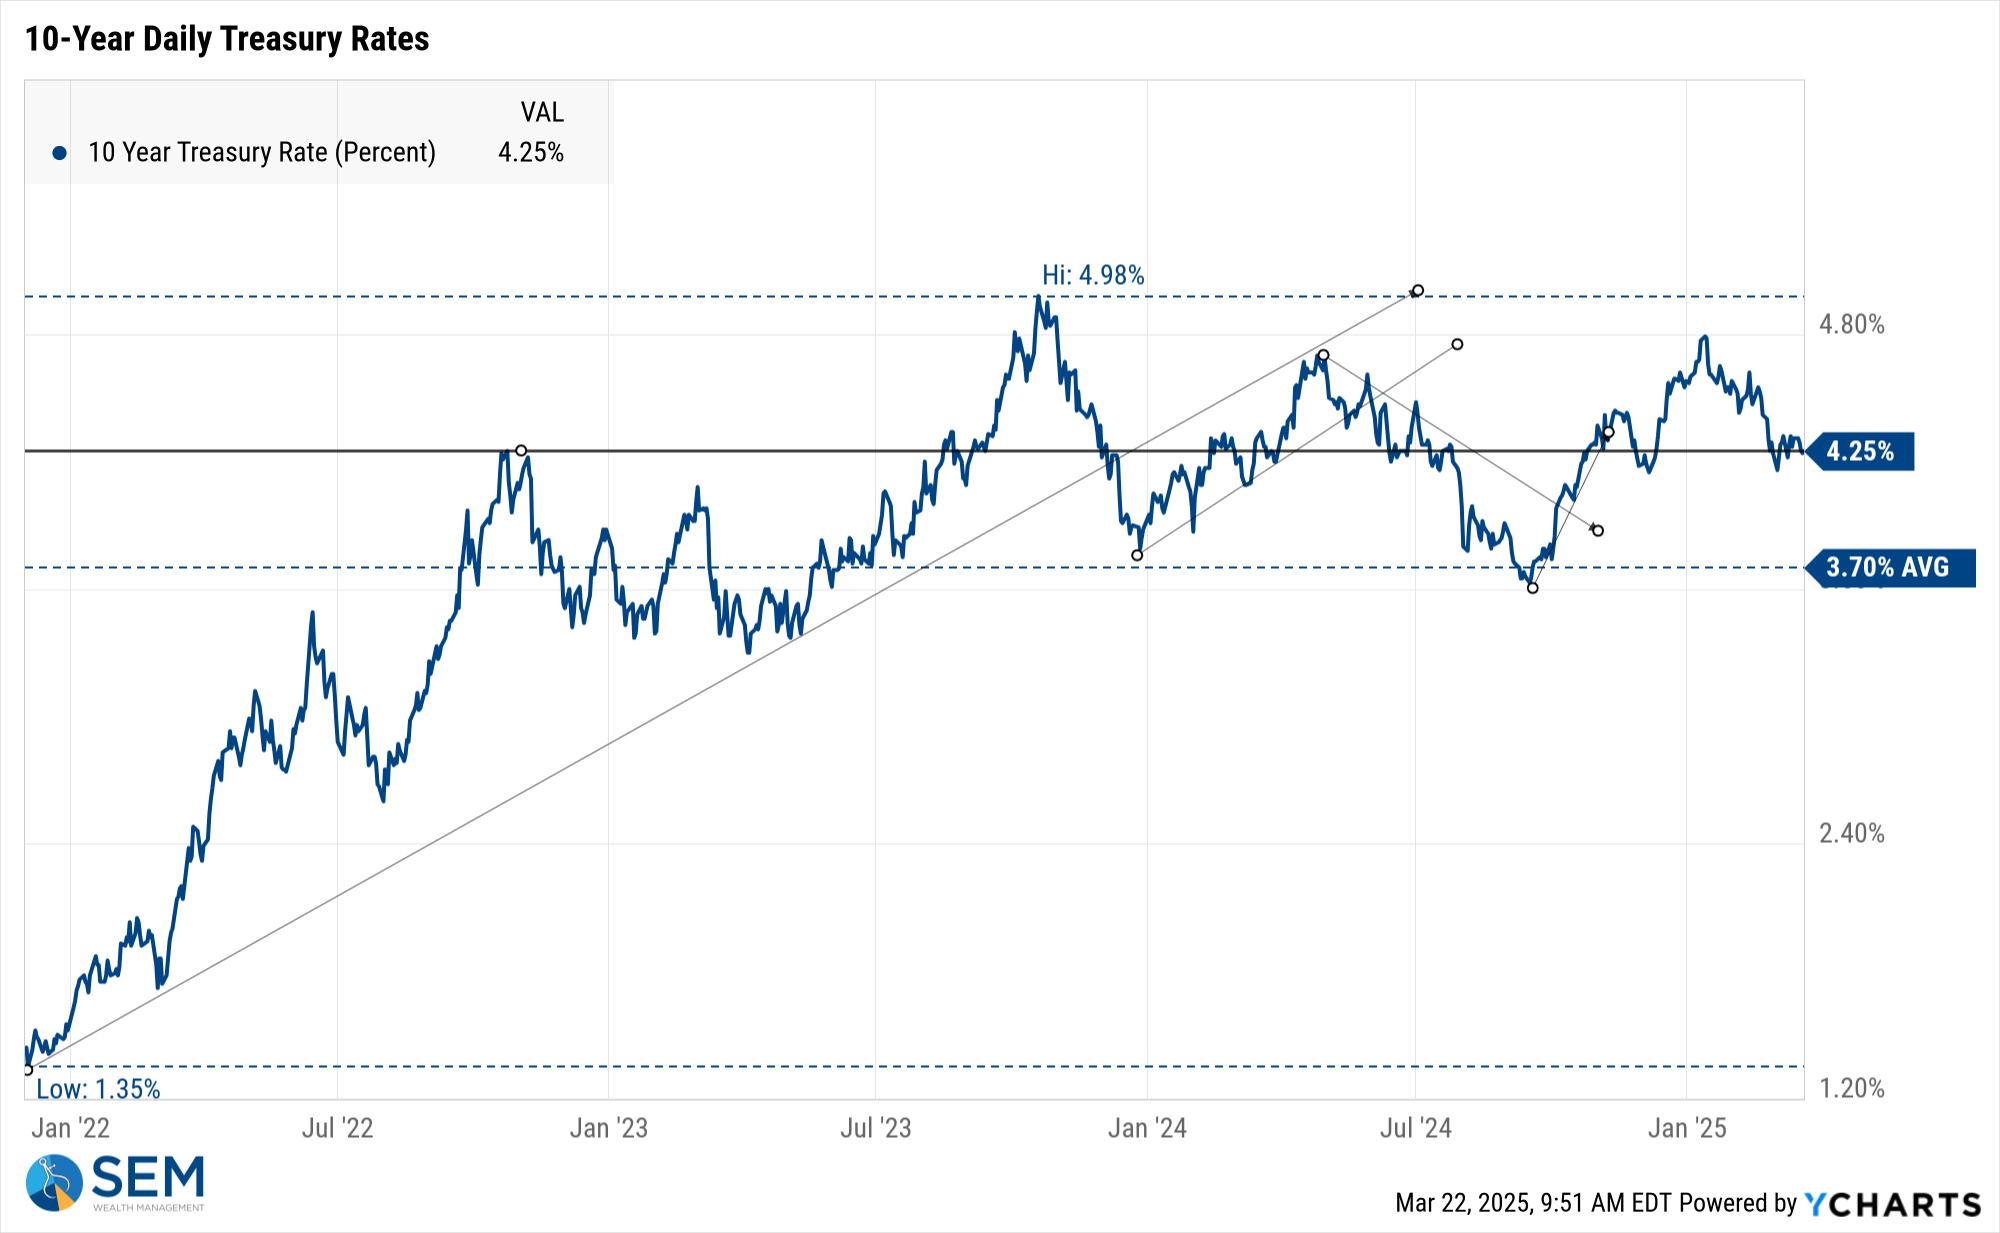
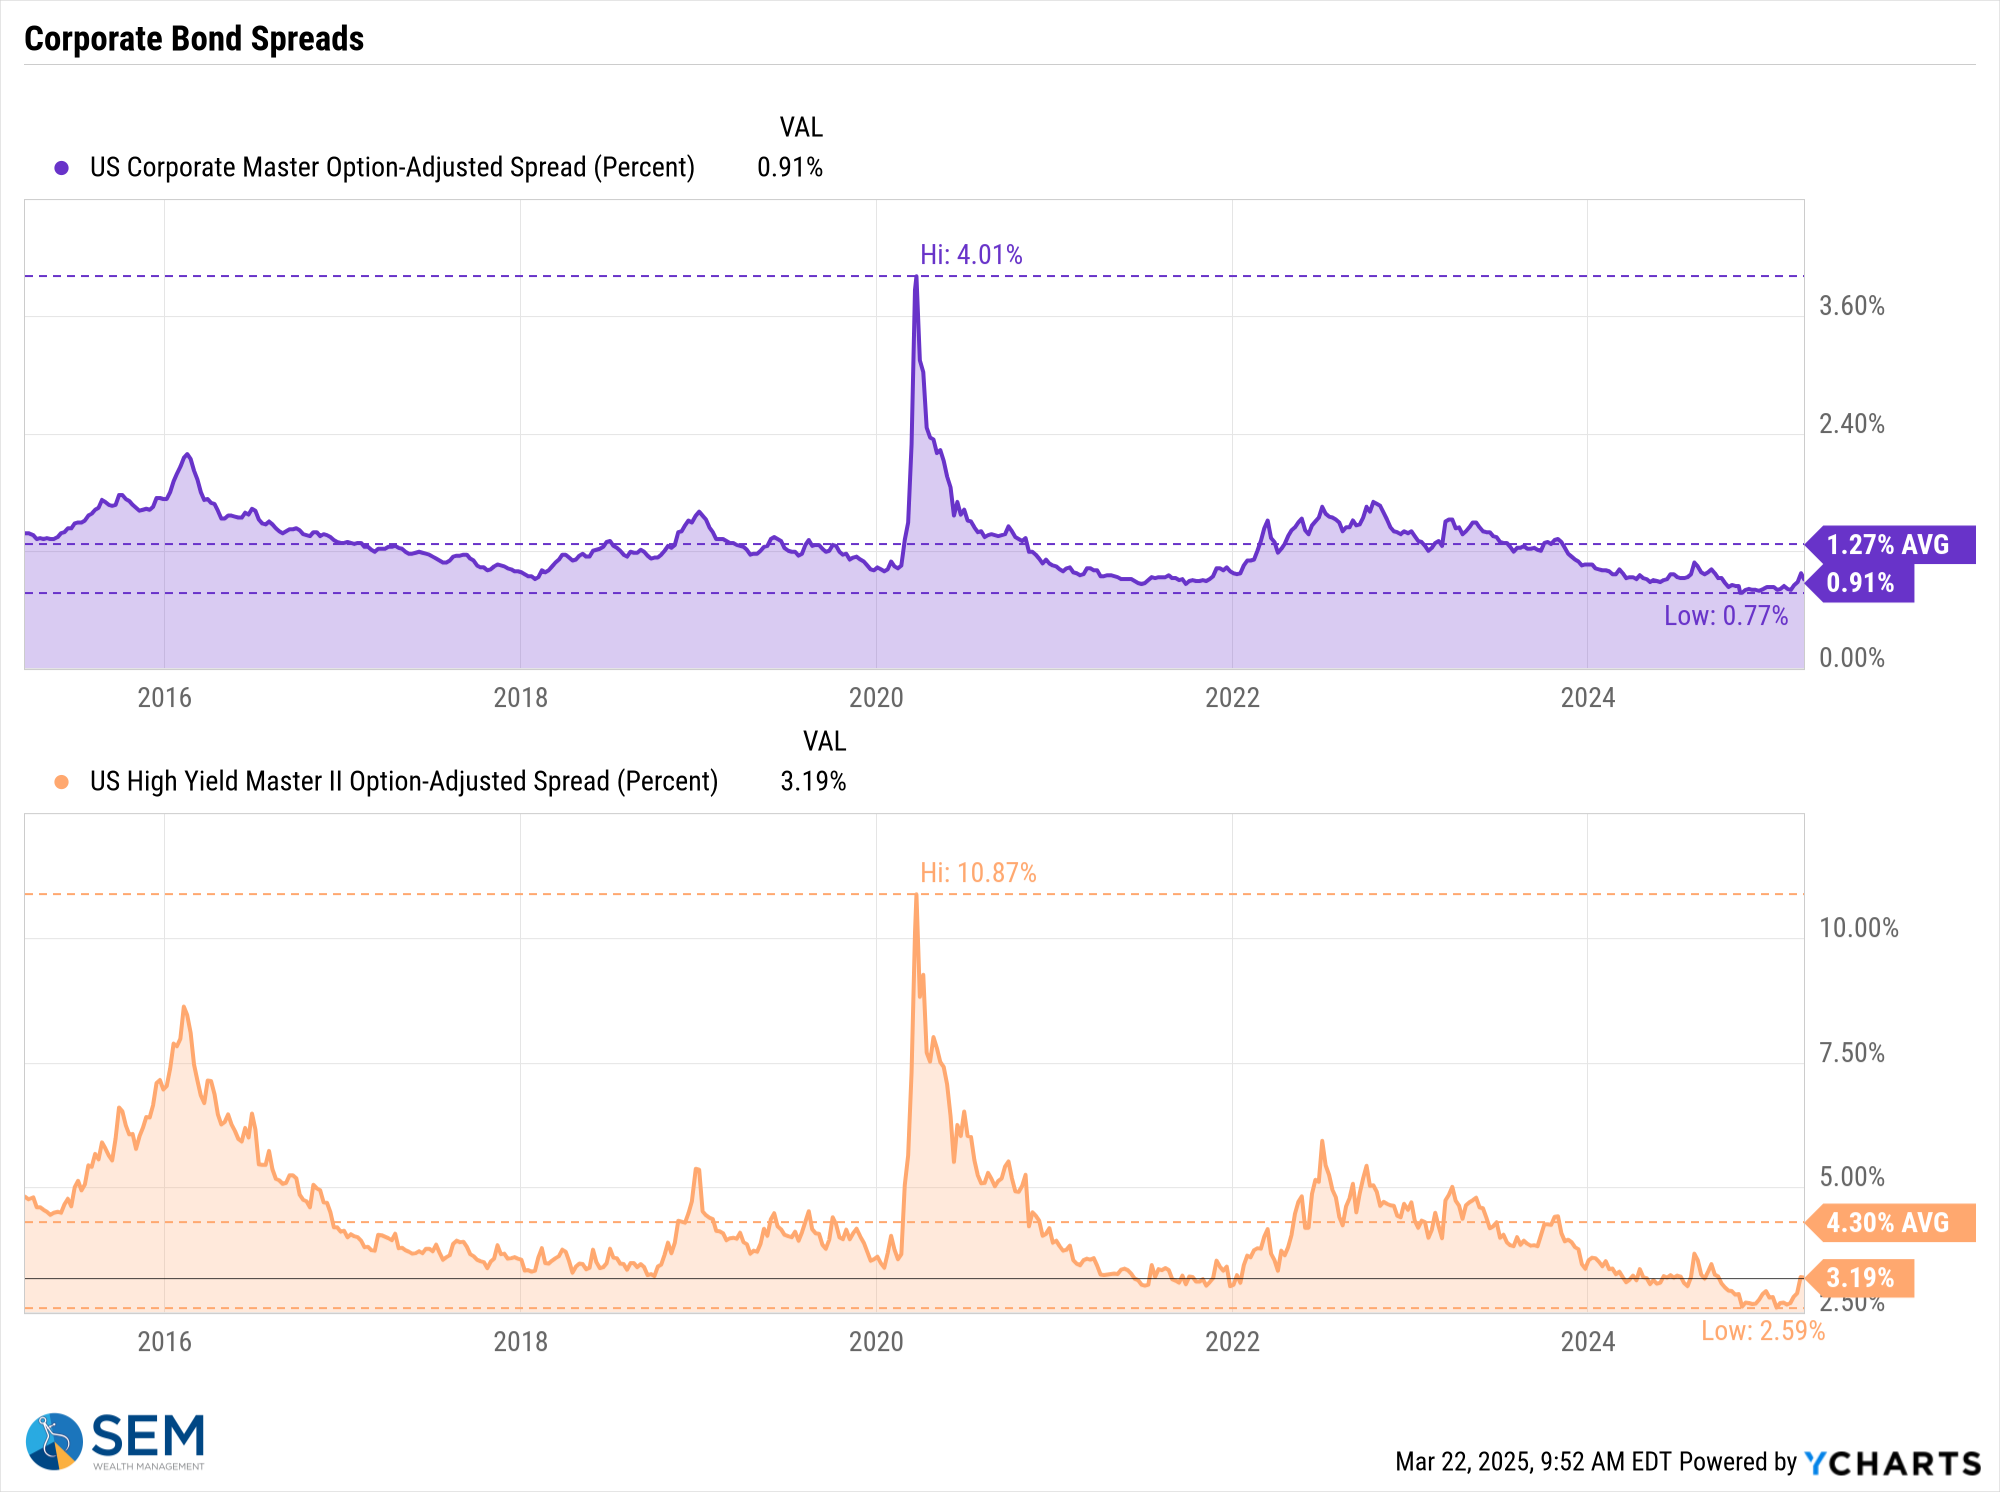
We continue to watch the corporate bond spreads for signals of concern out of the bond market. Small cap stocks are signaling economic weakness, but thus far the bond market does not seem to share that same viewpoint.
Our models remain on stand-by with several within a day or two of taking some risky assets off the table. Stay tuned.......
SEM Model Positioning
As of this morning, March 17 both our Tactical High Yield and the trend models inside of AmeriGuard and Cornerstone are within a whisker of a sell signal. The action most of last week was negative, but the bounce on Friday if met with follow-through this week could mark a short-term bottom.
Stay tuned.
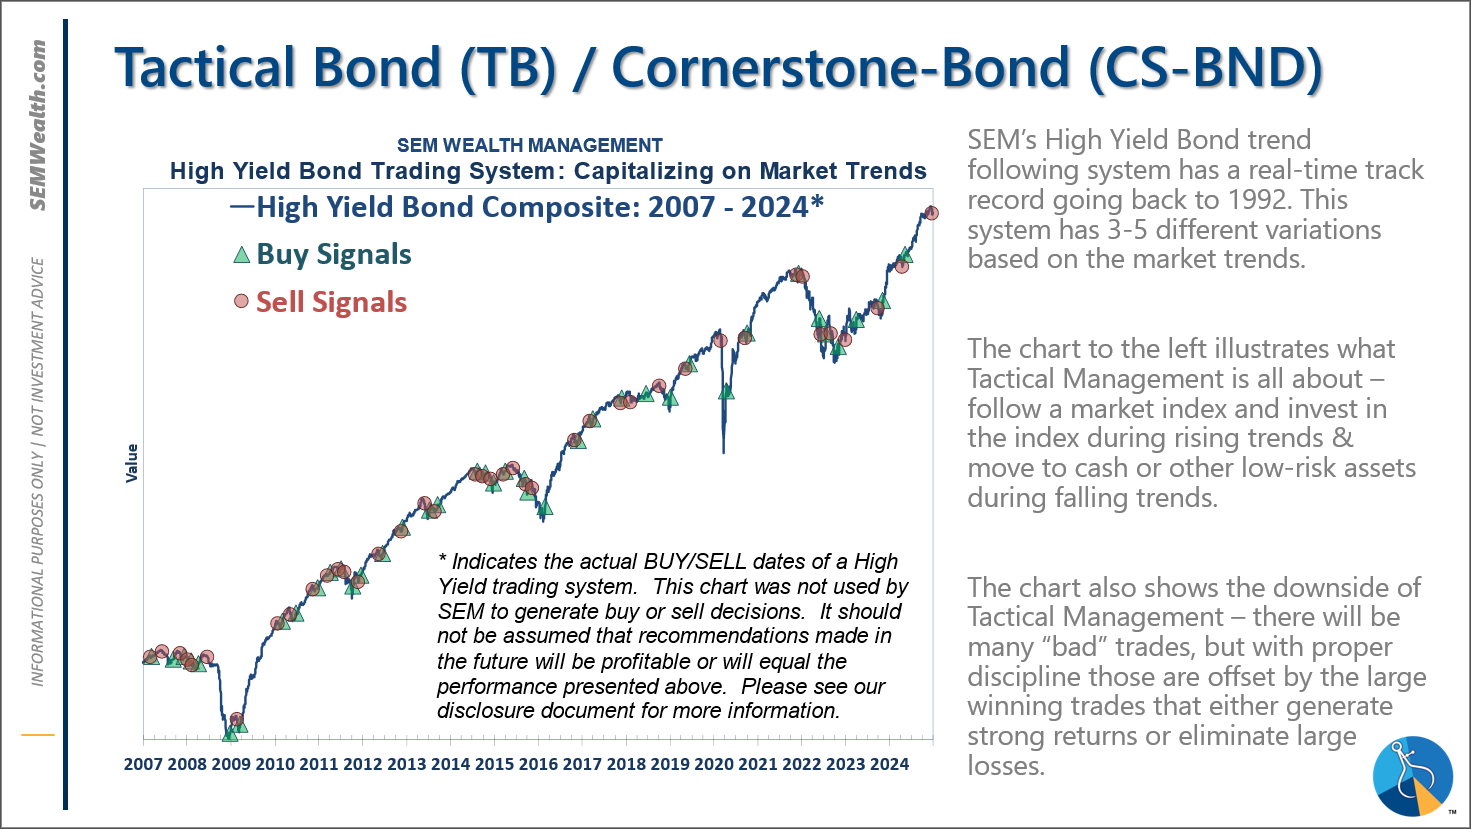
-Tactical High Yield reentered the high yield bond market on 1/27/25 after about 5 weeks on the sidelines. We had added a 30% position in floating rate bonds on 12/6/24, which currently have a 9% yield compared to a 6% yield in high yields and 4.6% in money markets.
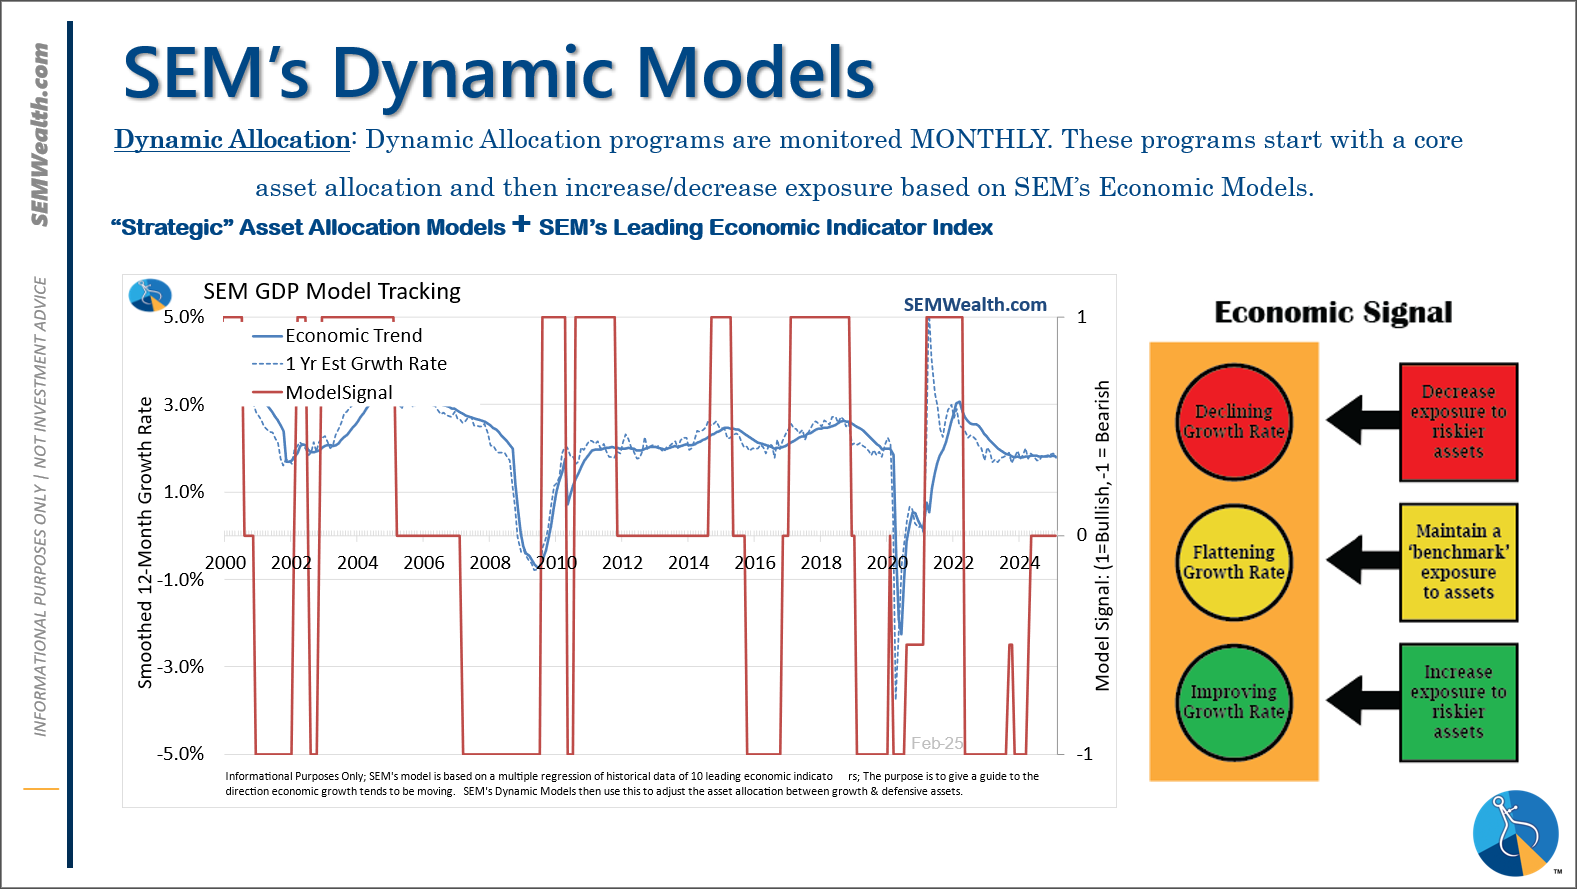
-Dynamic Models are 'neutral' as of 6/7/24, reversing the half 'bearish' signal from 5/3/2024. 7/8/24 - interest rate model flipped from partially bearish to partially bullish (lower long-term rates).
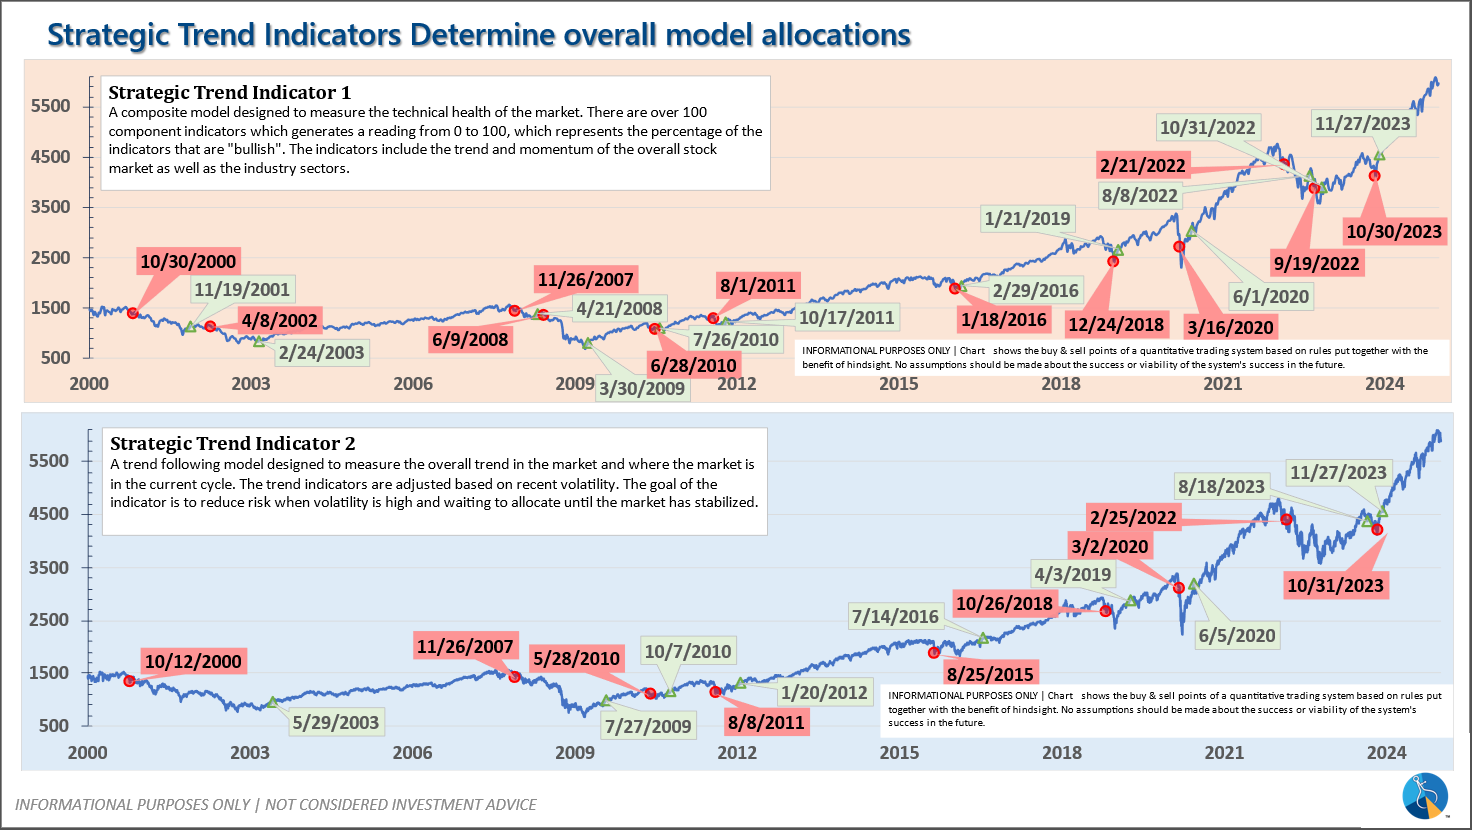
-Strategic Trend Models went on a buy 11/27/2023; 7/8/24 – small and mid-cap positions eliminated with latest Core Rotation System update – money shifted to Large Cap Value (Dividend Growth) & International Funds
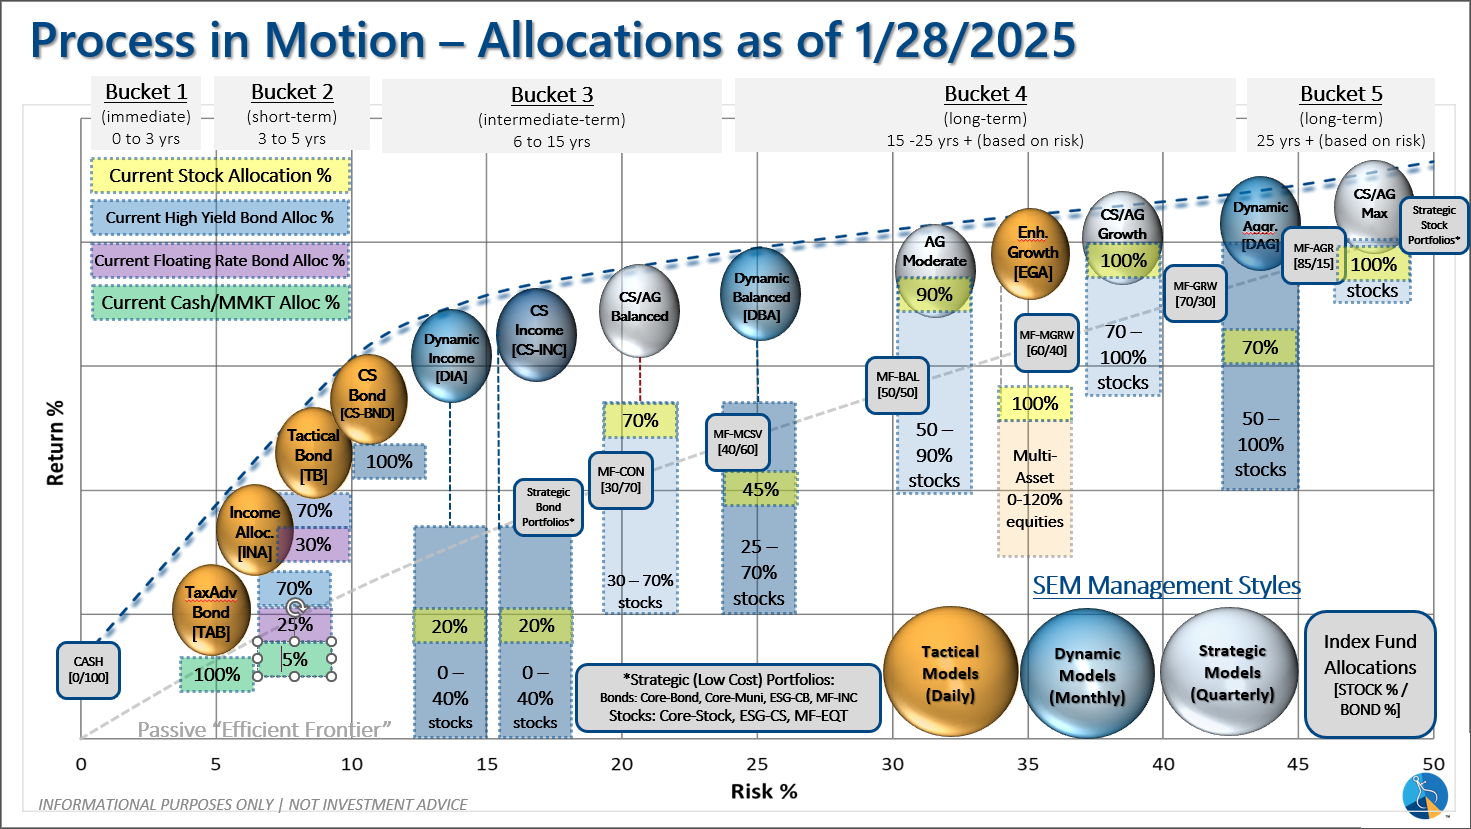
SEM deploys 3 distinct approaches – Tactical, Dynamic, and Strategic. These systems have been described as 'daily, monthly, quarterly' given how often they may make adjustments. Here is where they each stand.
Tactical (daily): On 12/20/2024 our tactical high yield model sold out of high yield bond (about 70% of our holdings) into money market. The other 30% is invested in shorter duration, higher yielding floating rate bonds. These instruments are not as sensitive to credit risk and are typically allocated to in the early and late stages of a high yield bond move in our model.
Dynamic (monthly): The economic model was 'neutral' since February. In early May the model moved slightly negative, but reversed back to 'neutral' in June. This means 'benchmark' positions – 20% dividend stocks in Dynamic Income and 20% small cap stocks in Dynamic Aggressive Growth. The interest rate model is slightly 'bullish'.
Strategic (quarterly)*: BOTH Trend Systems reversed back to a buy on 11/27/2023
The core rotation is adjusted quarterly. On August 17 it rotated out of mid-cap growth and into small cap value. It also sold some large cap value to buy some large cap blend and growth. The large cap purchases were in actively managed funds with more diversification than the S&P 500 (banking on the market broadening out beyond the top 5-10 stocks.) On January 8 it rotated completely out of small cap value and mid-cap growth to purchase another broad (more diversified) large cap blend fund along with a Dividend Growth fund.
The * in quarterly is for the trend models. These models are watched daily but they trade infrequently based on readings of where each believe we are in the cycle. The trend systems can be susceptible to "whipsaws" as we saw with the recent sell and buy signals at the end of October and November. The goal of the systems is to miss major downturns in the market. Risks are high when the market has been stampeding higher as it has for most of 2023. This means sometimes selling too soon. As we saw with the recent trade, the systems can quickly reverse if they are wrong.
Overall, this is how our various models stack up based on the last allocation change:
Questions or comments - drop us a note?
Curious if your current investment allocation aligns with your overall objectives and risk tolerance? Take our risk questionnaire


