
🌲🚐🔥 Road-Trip Reflections
Rolling the RV out of the misty Pacific Northwest felt like switching channels from a 4K Nature documentary to Old Western movies. One day we were gawking up at 300-foot redwoods in 58-degree fog; two days later we cracked open the door in Reno to 97-degree desert gusts. The market delivered a similar climatic whiplash last week: what started as a cautious grind higher morphed into an all-out risk-on sprint, ending with the S&P 500 at a fresh record 6,173 on Friday.
📈 What Drove the Surge?
1. Rate-Cut Hopes Re-ignited
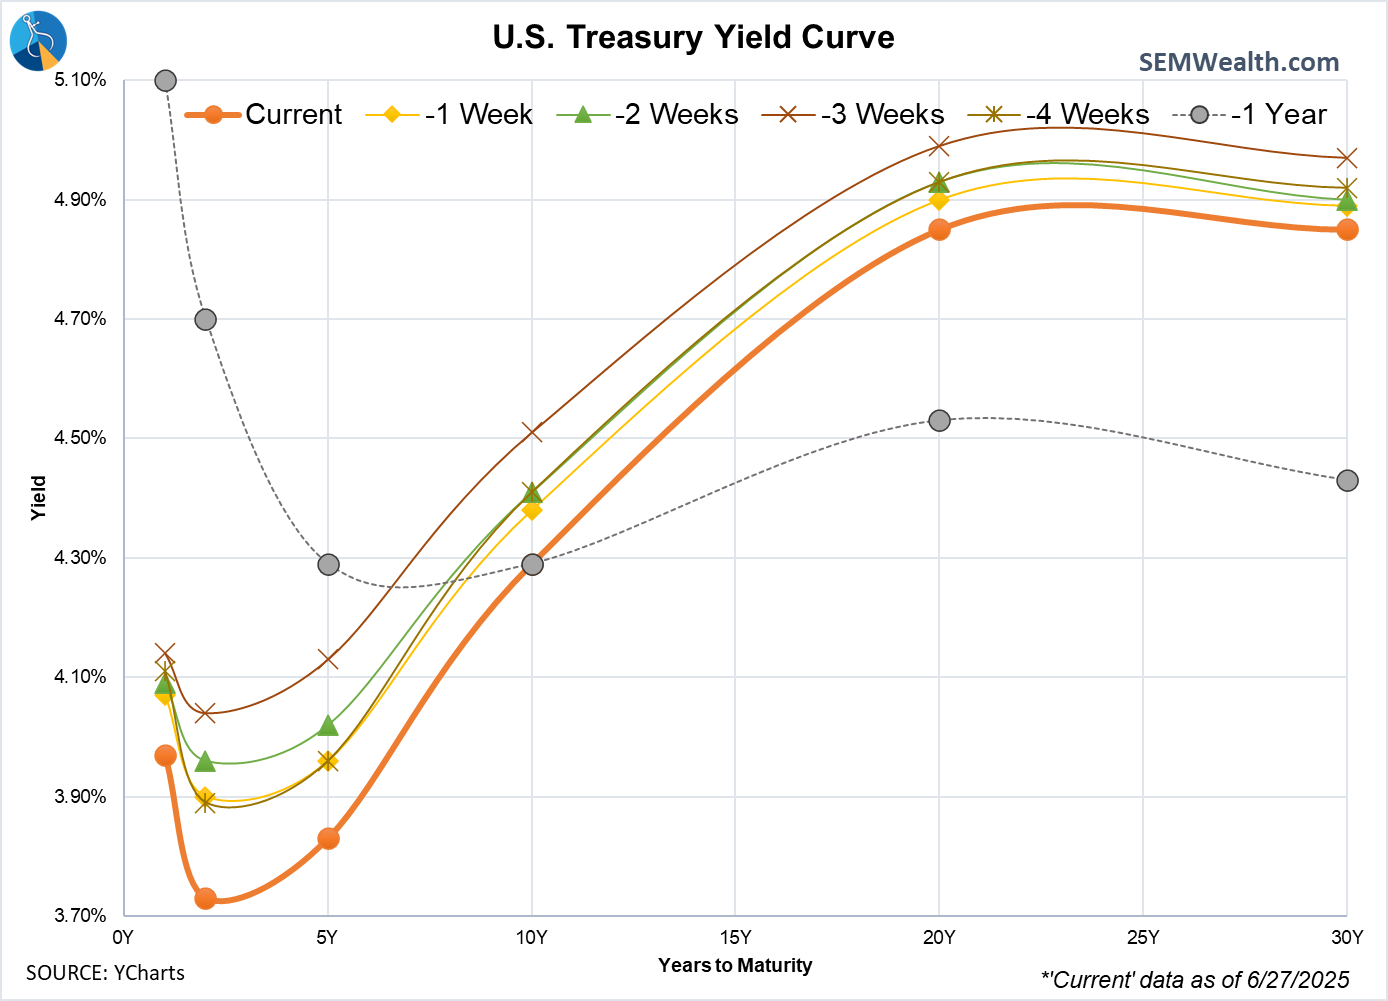
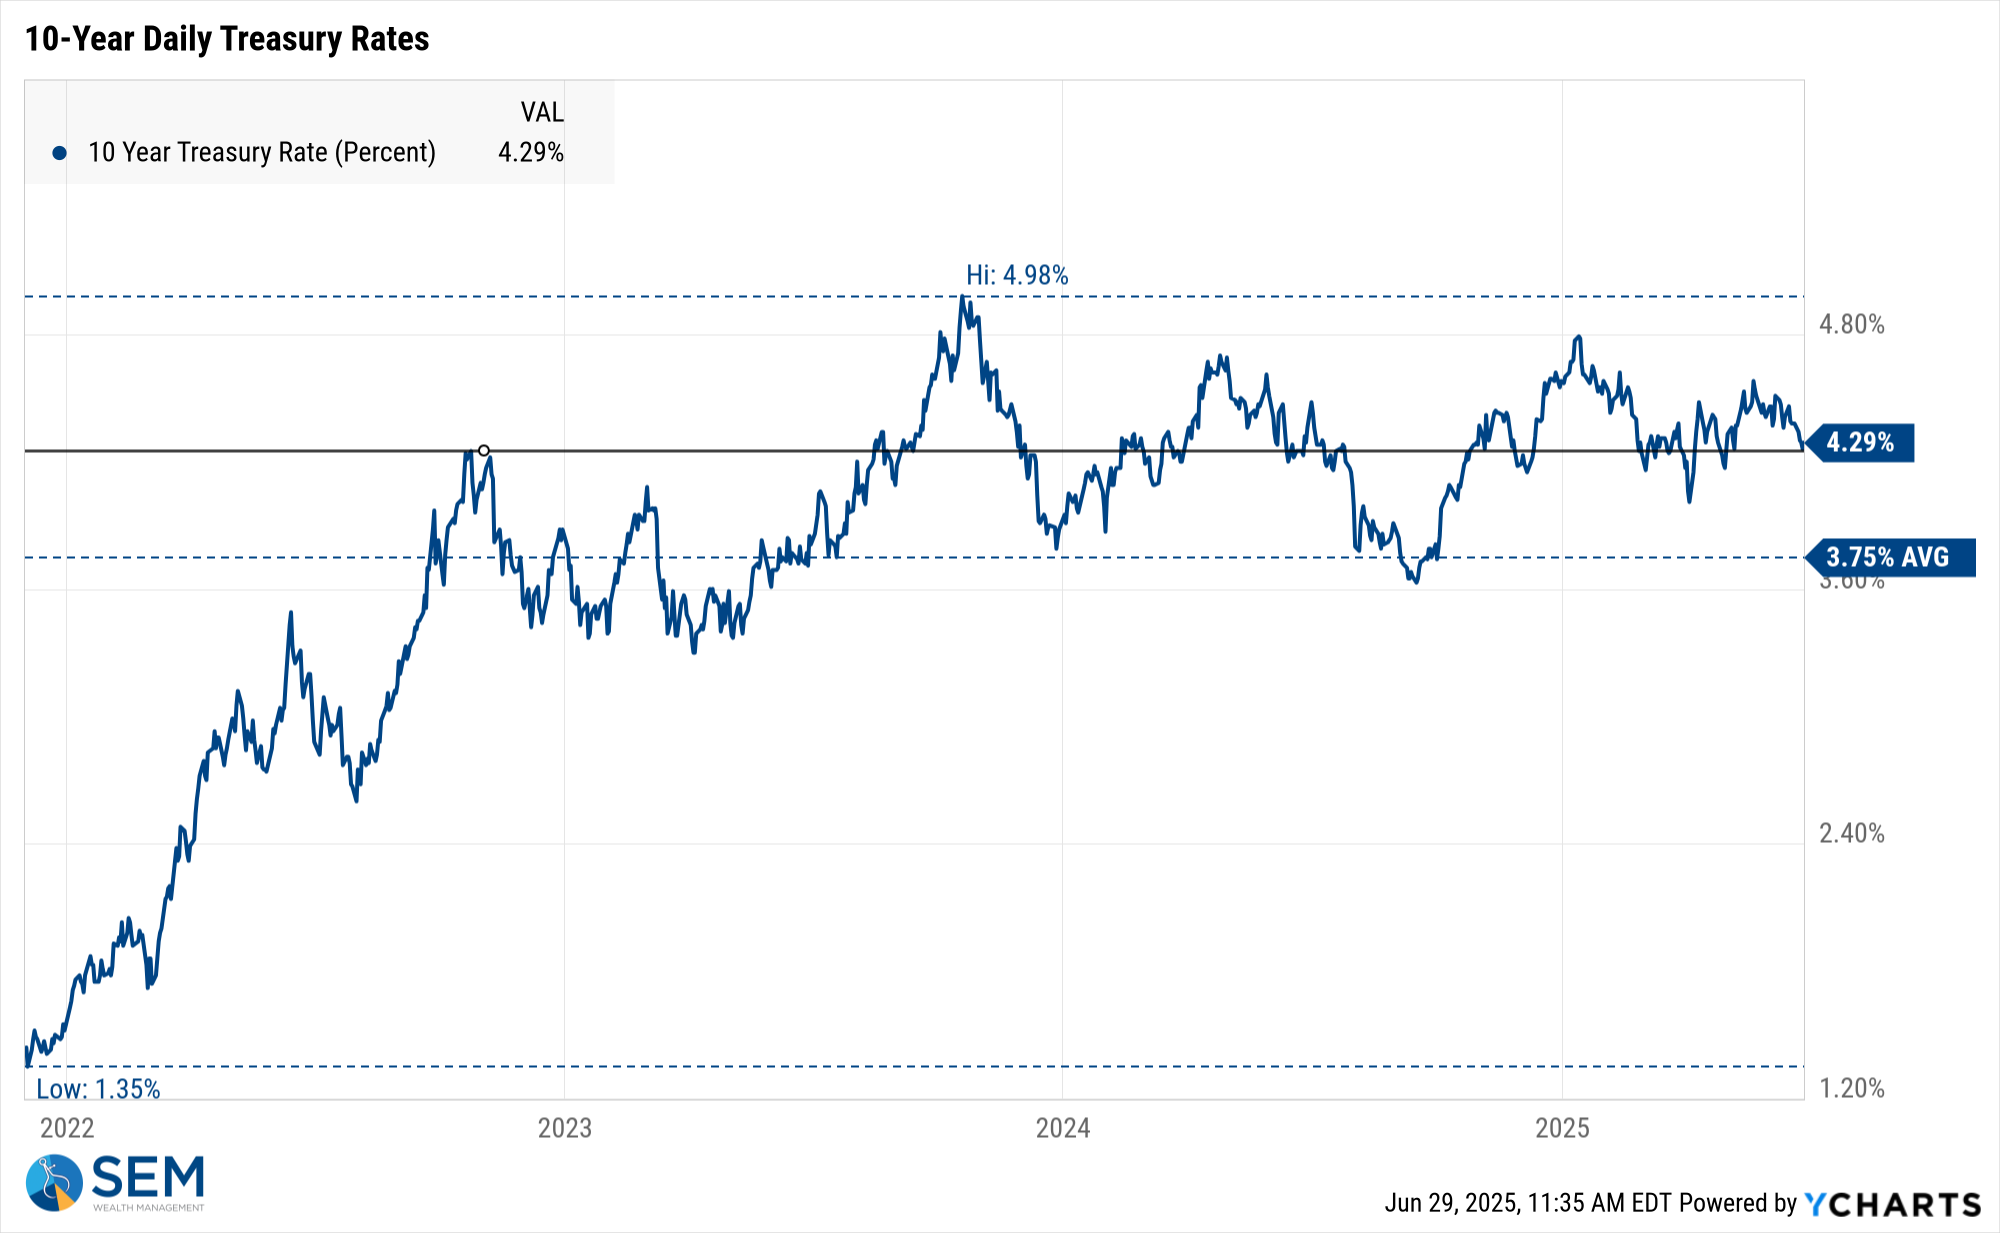
- Fed Chair Powell’s twin testimony (House Tuesday, Senate Wednesday) sounded hawkish in isolation, yet traders zeroed in on his comment that “meaningful labor-market weakening” would override tariff-related inflation fears. The result: 2-year yields dropped 17 bps; 10-years fell 9 bps—the biggest weekly rally since early-April. The chart below highlights the gradual drop in yields the past 4 weeks.
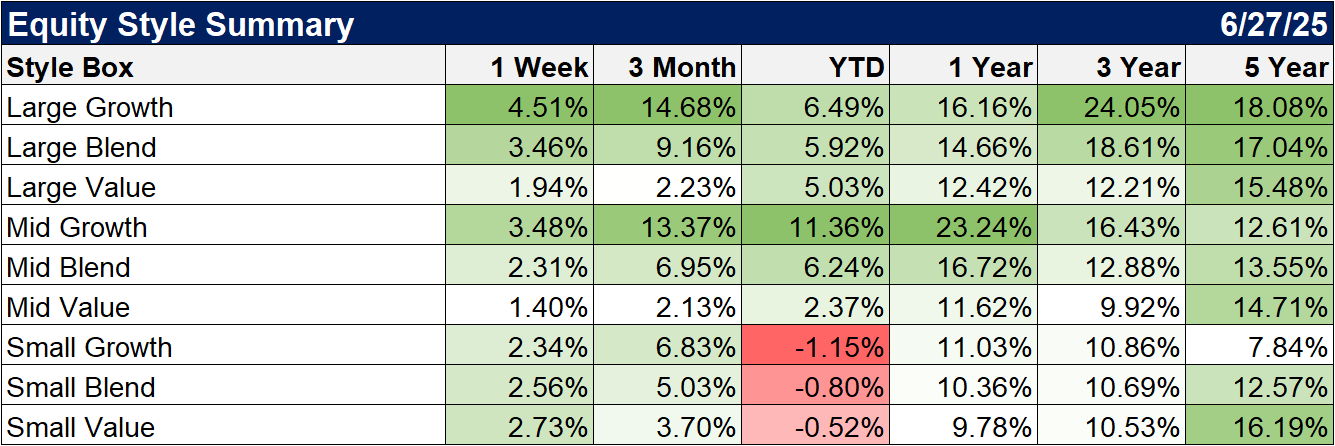
- Lower yields helped big-cap Tech reclaim leadership; Large Cap Growth gained 4.5% while Small Caps only gained 2.5%.
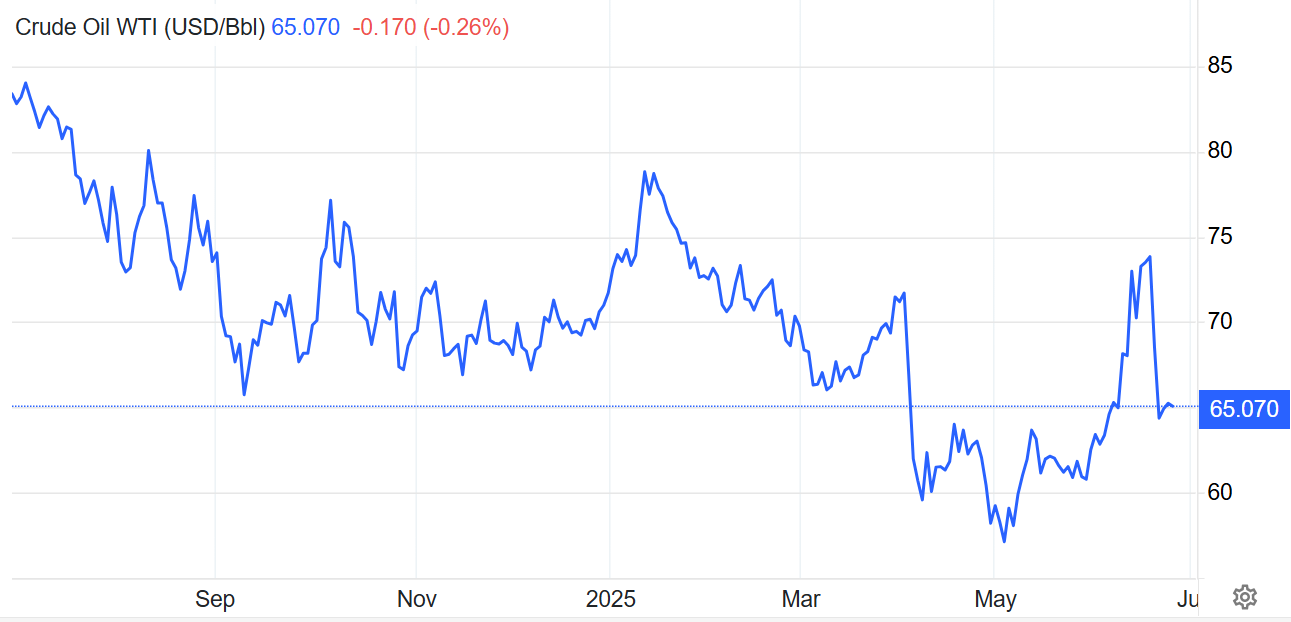
2. Middle East "Truce" = Commodity Slump
Crude oil prices dropped $10 to $63 before recovering a bit on Friday—an 14 % peak-to-trough drop since the Iran-Israel "cease-fire". Cheaper energy fed into the “no-inflation” narrative, but it only seemed to help large cap growth stocks as rate-sensitive real-estate and utilities both struggled last week.
3. Mega-Cap Earnings Whispers
Quiet pre-announcements from Meta and Broadcom hinted that AI-capex is still accelerating (which helped boost Nvidia 6%); the “Magnificent Seven” added over $350 billion in market cap this week alone
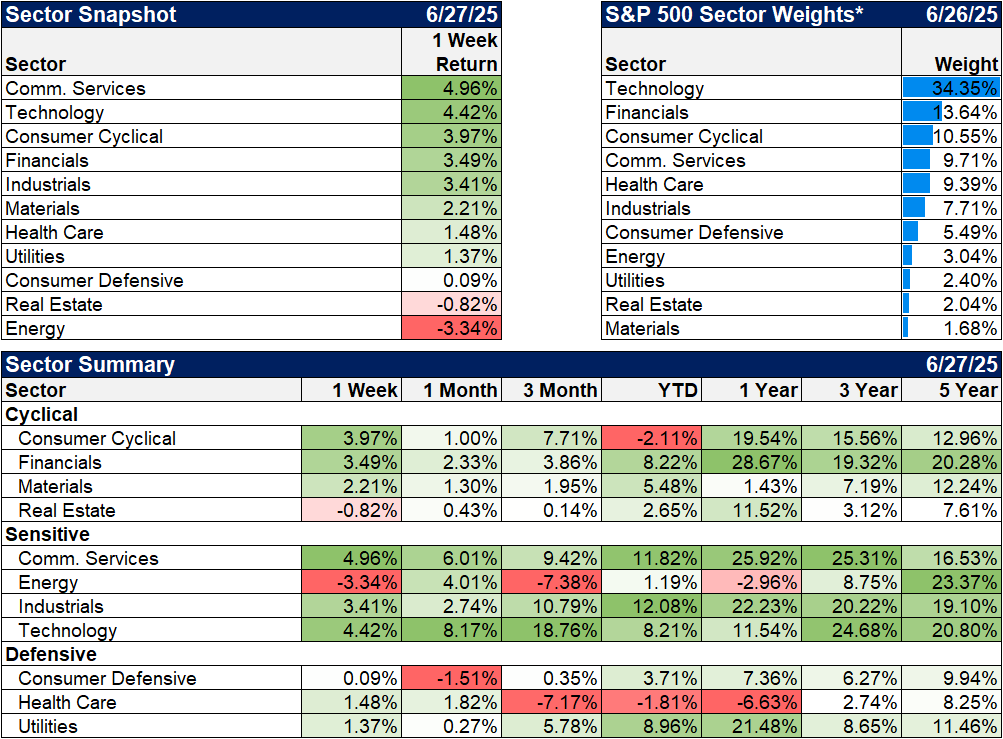
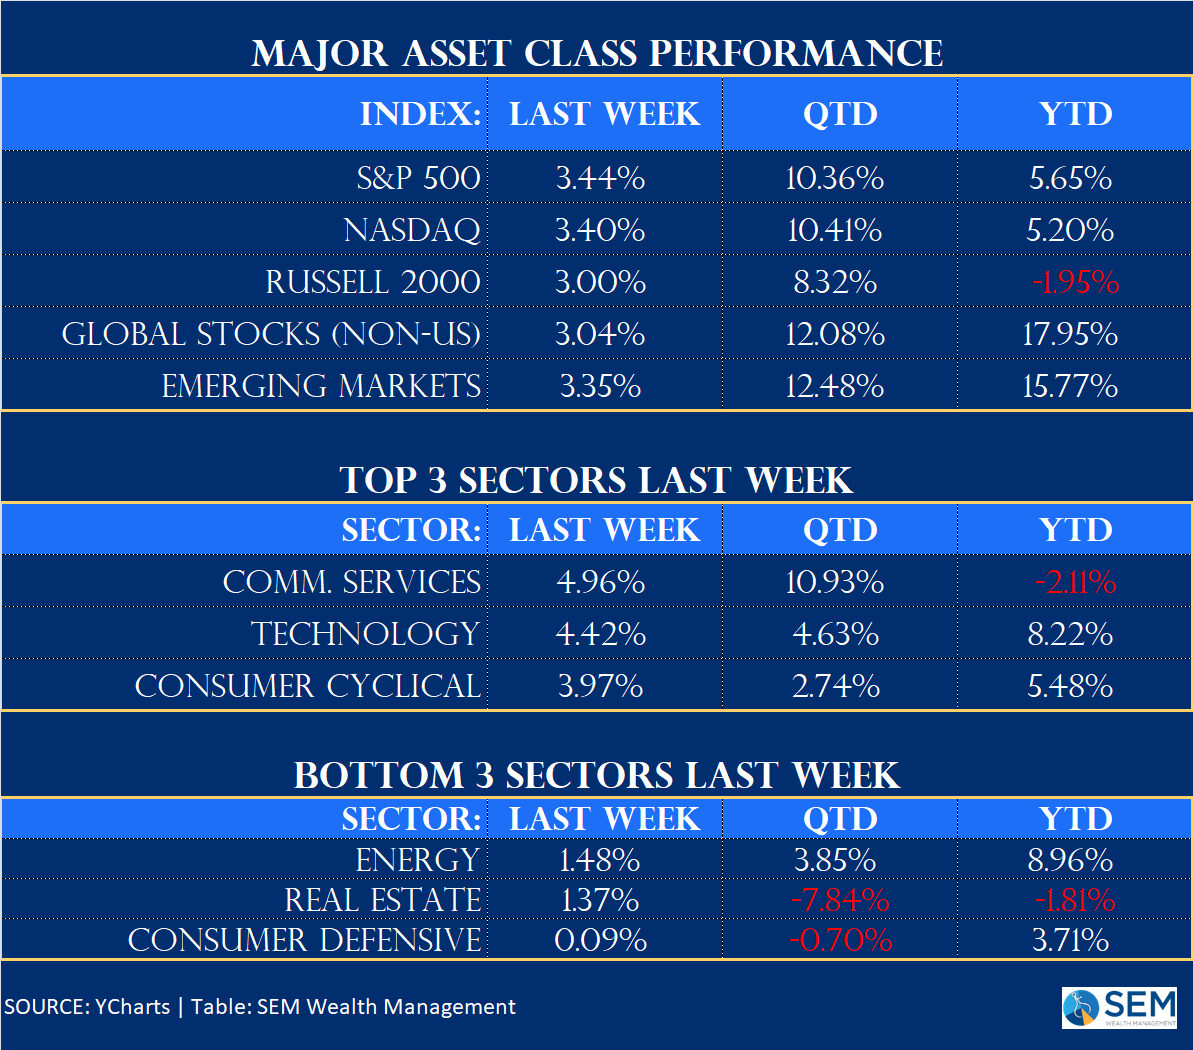
🌡️ Heat-Check
The graphic below shows where the action was—both year-to-date and this week—across major asset classes.
👀 What to Watch (Week of 6/30)
It's a short trading week, but a lot of data. SEM's Economic model went "bearish" in June. We will be watching closely this week's data releases.
| Day | Time (ET) | Event | Why it matters |
|---|---|---|---|
| Mon 6/30 | 10 a | ISM Manufacturing PMI (June) | New-orders index popped in May; a slide back below 50 would undercut the “soft-landing” view. |
| Tue 7/1 | 10 a | May JOLTS Job Openings | “The experts” expect openings to slip under 7 million for the first time since 2021. |
| Wed 7/2 | 8:30 a | Weekly Jobless Claims (moved up due to holiday) | Claims have stayed above 230 k for four straight weeks—signs of labor-market stress? |
| Thu 7/3 | 8:30 a | June Non-Farm Payrolls | Consensus: +95 k, jobless rate up to 4.3 %. A miss here could cement a September cut. |
| Thu 7/3 | Early close | Bond & Stock Markets close at 1 p m | Liquidity vacuum = headline-driven volatility. |
| Fri 7/4 | All day | US Markets (and SEM) closed | Independence Day holiday; no trading or SEM model updates. |
🛑 Risk Areas to Watch
- Over-owned Mega-Caps: concentration remains > 30 % of S&P; any guidance stumble = outsized drawdown.
- Complacent Bonds: Rates have been slipping lower; a large seller or weak auction could spark a bigger reversal.
- Complacent Stocks: The VIX Index, a measure of stock volatility is right back to where it was just before the sell-off began in February; fast sell-offs can cascade if a few sellers emerge on low VIX levels.
- Tariff Headlines: White House signals more “targeted” measures—supply chains aren’t ready.
- Middle-East Cease-Fire: A single drone strike could reprice oil by $10+ overnight.
See last week's blog for a deeper look at some of the headline risks:

🏕️ Bringing It Home
Just as our trip reminded us that a river bend or mountain pass can flip the climate from cool mist to scorching sun, market regimes can change abruptly. SEM’s data-driven approach—Tactical, Dynamic, and Strategic models working together—keeps our clients from guessing which forecast is right. We follow the numbers, not the headlines, so advisors can stay focused on planning rather than position-watching.
Stay cool out there—both on the highway and in the markets.
Market Charts
Stocks broke out nicely after President Trump announced a "cease fire" between Iran and Israel (details to be determined). This led to a nice breakout to all-time highs for the S&P 500. There is typically a retest of the breakout at which point the health of the market will be tested.
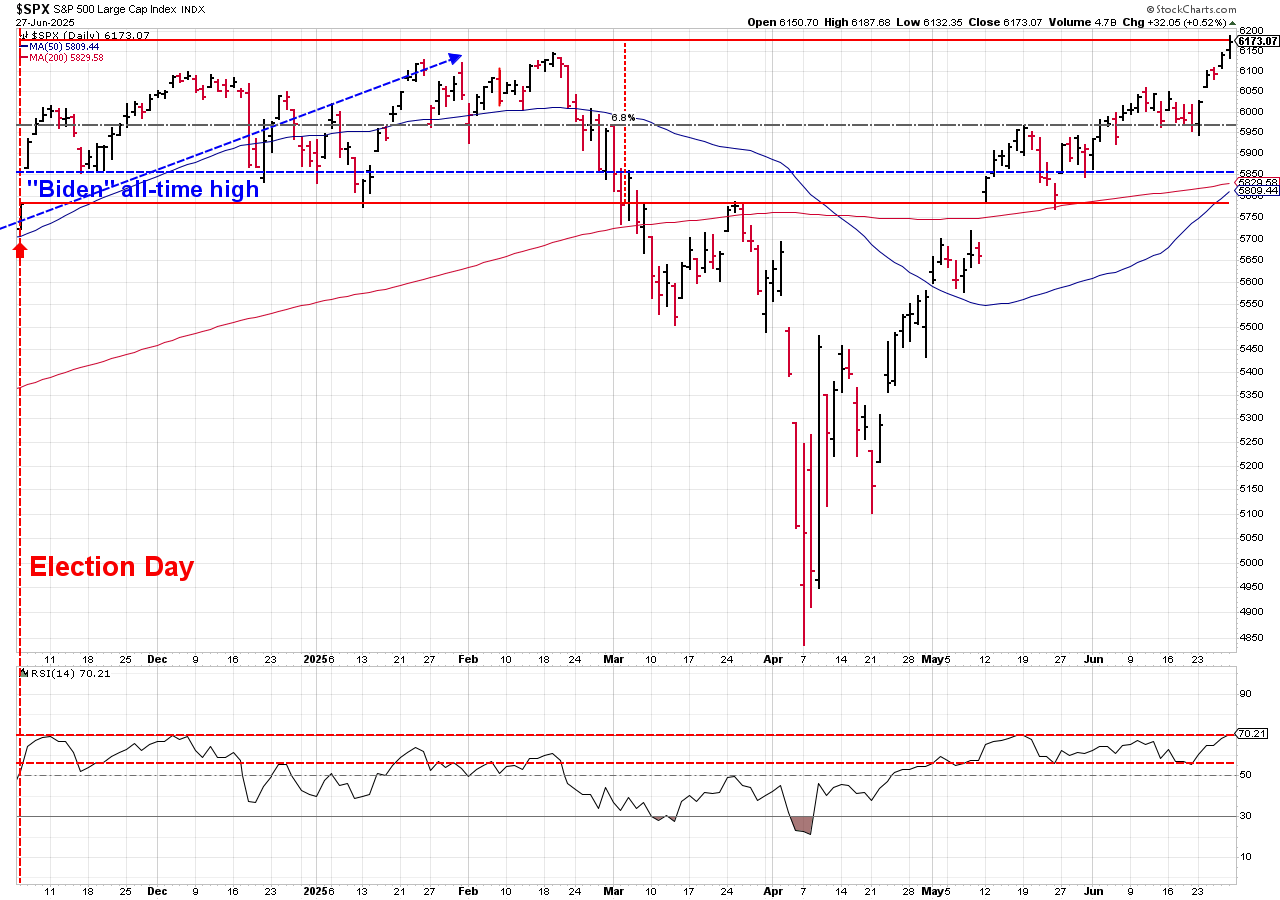
I've learned from experience to not question the logic of a nearly straight-up move in the market, but instead to both respect the trend but be cautious about chasing it higher.
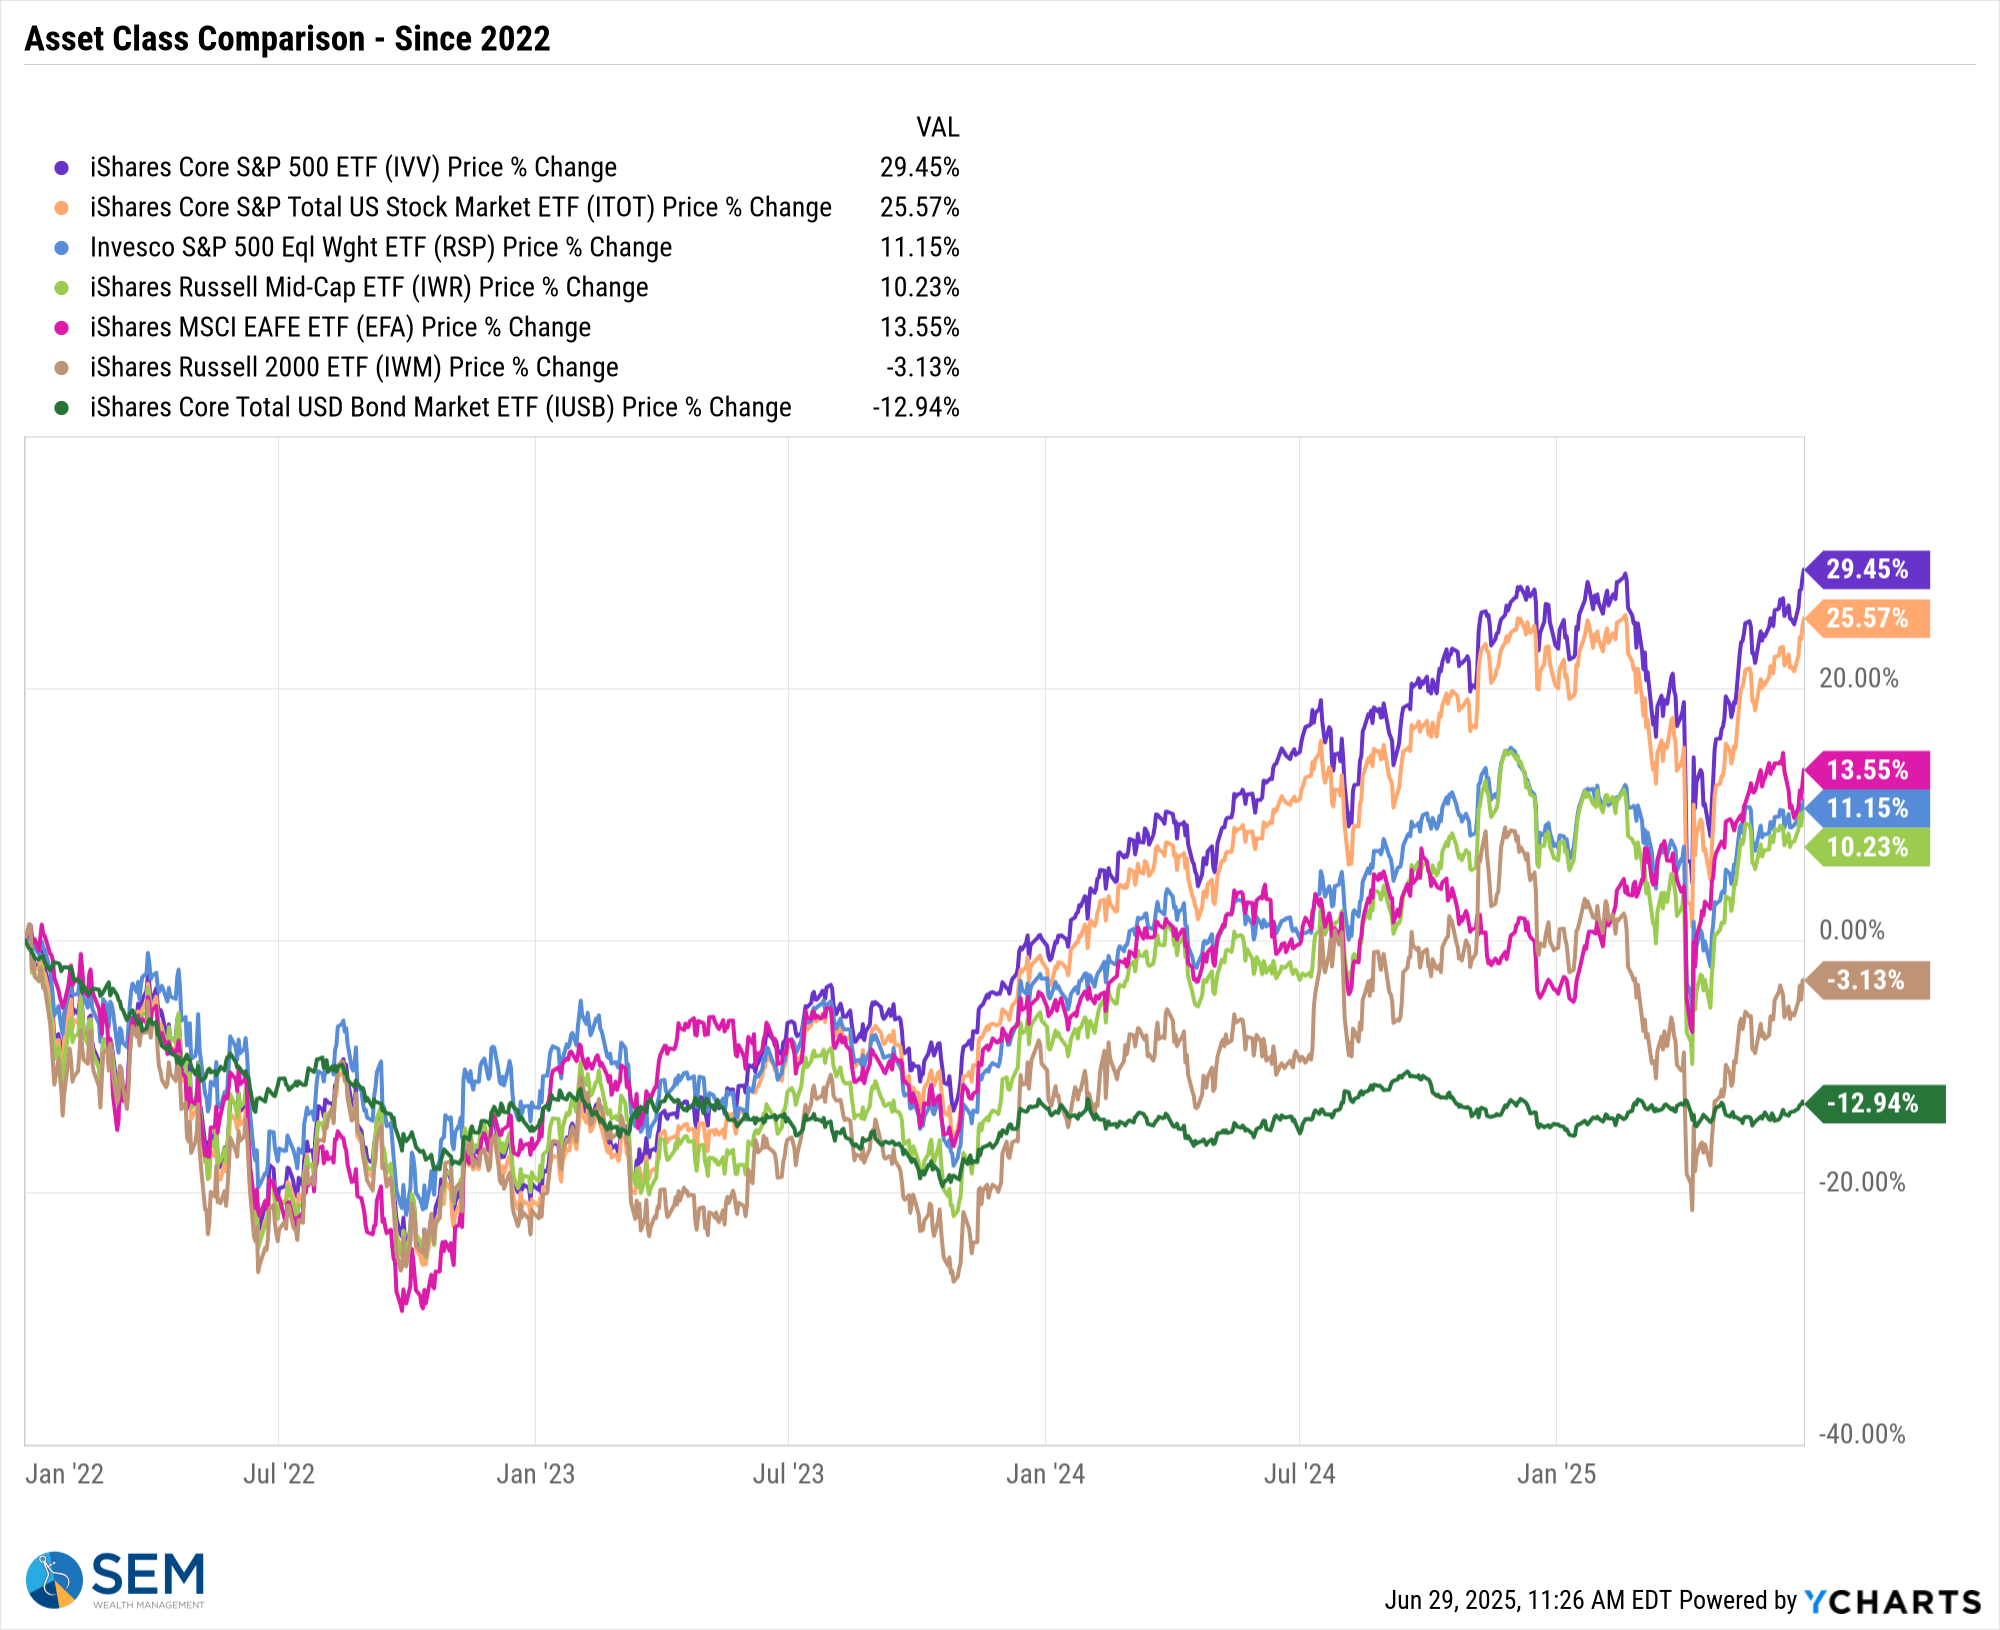
This is still a large cap tech driven market. Small caps are still down year-to-date and since the peak at the end of 2021. What does that tell us? At least so far, the mega cap techs risk driving small cap companies out of business. From an economic perspective that has always been a bad thing and led to prolonged recessions. We need small companies and their ability to innovate, not a handful of large corporations controlling everything. That is a long-term problem, but is something we should have in the back of our minds as we enjoy this mega cap rally.
Bond yields continue to slide lower as noted at the top of the page.
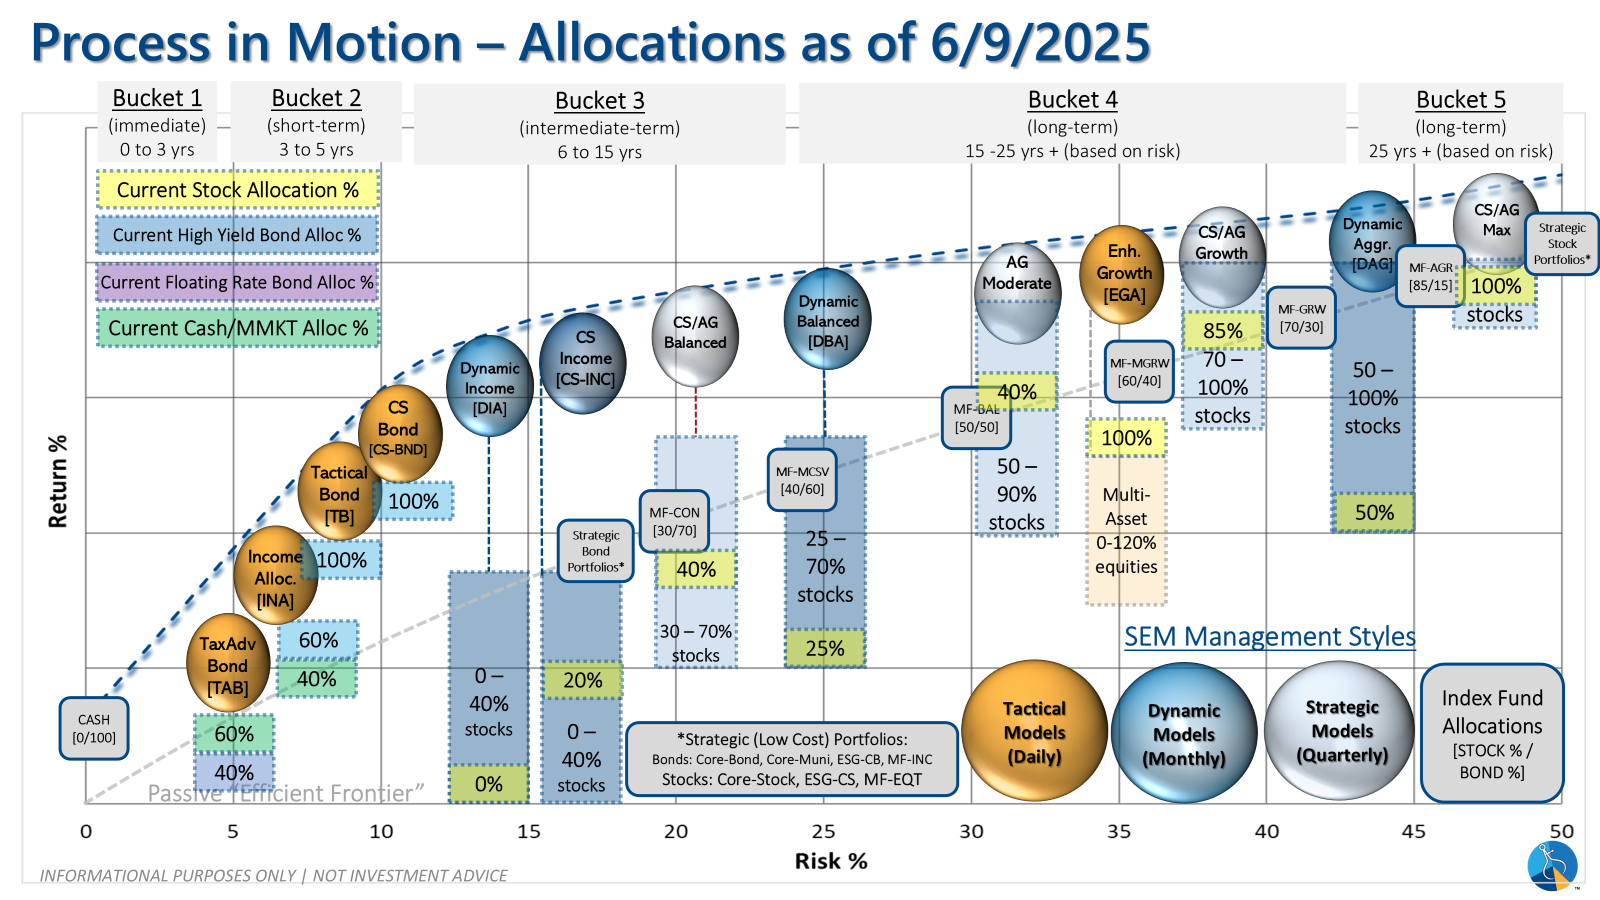
SEM Market Positioning
| Model Style | Current Stance | Notes |
|---|---|---|
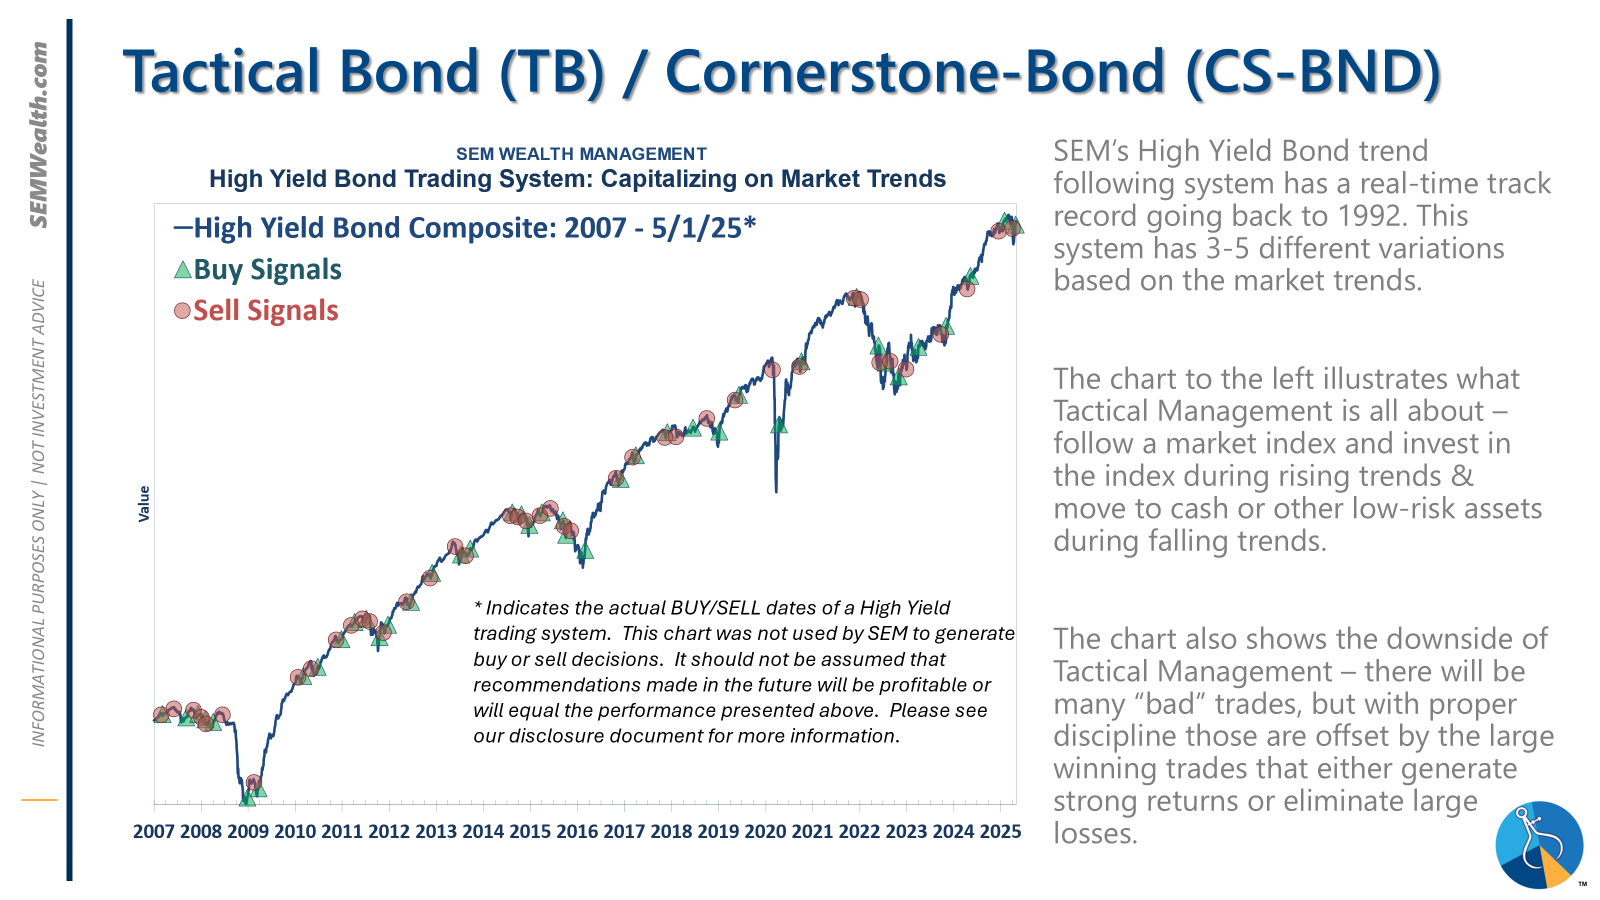
| Tactical | 100% high yield | High-yield spreads holding, but trend is slowing-watching closely |
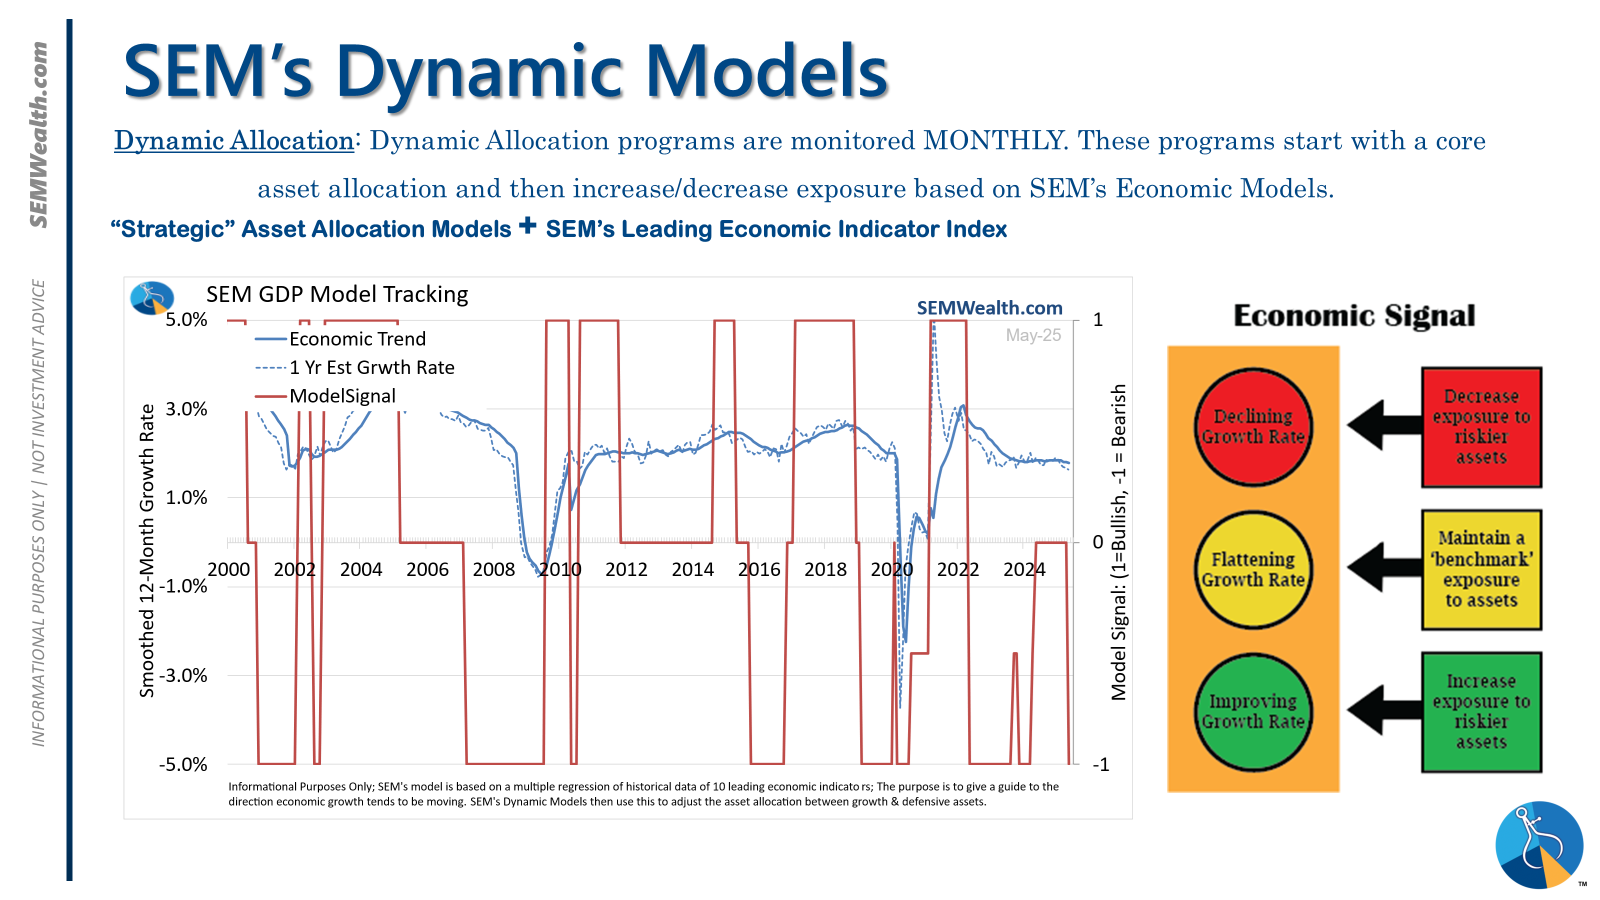
| Dynamic | Bearish | Economic model turned red – leaning defensive |
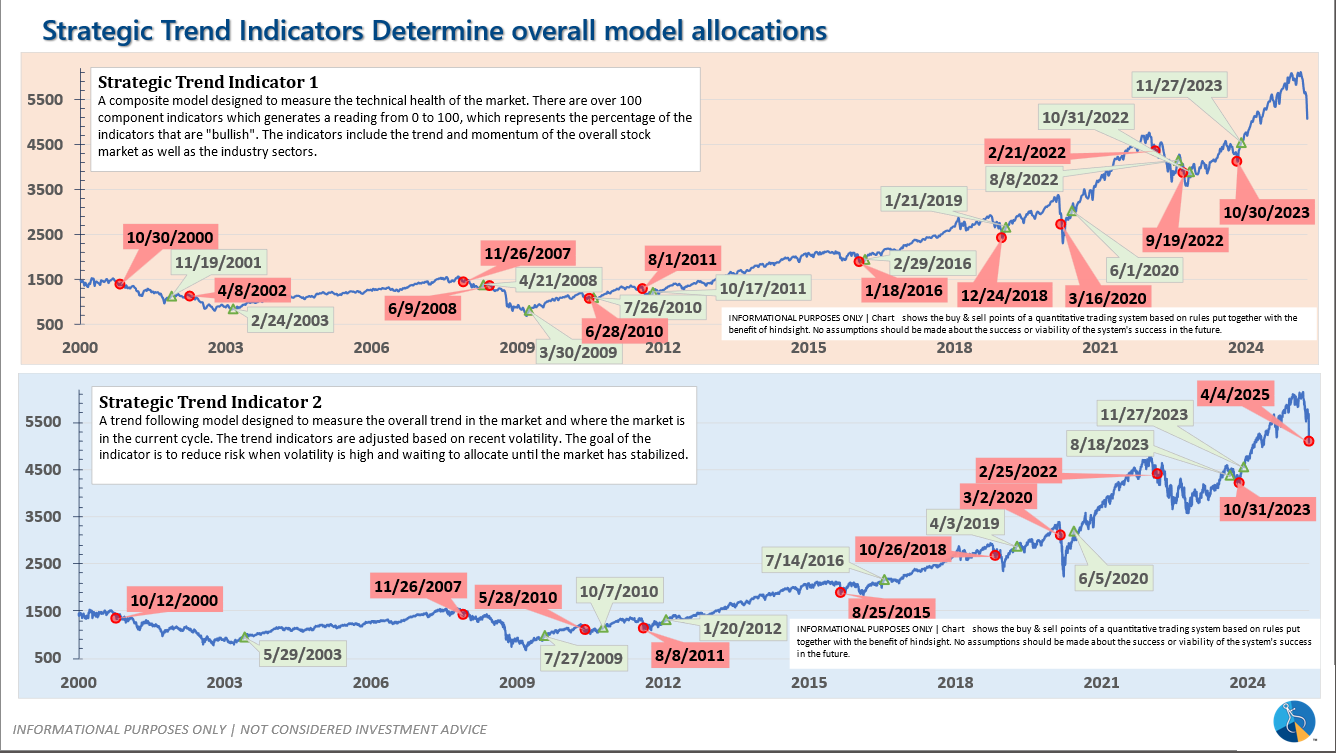
| Strategic | Slight under-weight | Trend overlay shaved 10 % equity in April -- waiting for signs of broadening before re-entry |
SEM deploys 3 distinct approaches – Tactical, Dynamic, and Strategic. These systems have been described as 'daily, monthly, quarterly' given how often they may make adjustments. Here is where they each stand.
Tactical (daily): On 4/3/2025 our tactical high yield model sold out of high yield bond into money market.
Dynamic (monthly): The economic model went 'bearish' in June 2025 after being 'neutral' for 11 months. This means eliminating risky assets – sell the 20% dividend stocks in Dynamic Income and the 20% small cap stocks in Dynamic Aggressive Growth. The interest rate model is 'neutral' meaning low duration/money market investments for the bulk of the bonds.
Strategic (quarterly)*: One Trend System sold on 4/4/2025
The core rotation is adjusted quarterly. On August 17 it rotated out of mid-cap growth and into small cap value. It also sold some large cap value to buy some large cap blend and growth. The large cap purchases were in actively managed funds with more diversification than the S&P 500 (banking on the market broadening out beyond the top 5-10 stocks.) On January 8 it rotated completely out of small cap value and mid-cap growth to purchase another broad (more diversified) large cap blend fund along with a Dividend Growth fund.
The * in quarterly is for the trend models. These models are watched daily but they trade infrequently based on readings of where each believe we are in the cycle. The trend systems can be susceptible to "whipsaws" as we saw with the recent sell and buy signals at the end of October and November. The goal of the systems is to miss major downturns in the market. Risks are high when the market has been stampeding higher as it has for most of 2023. This means sometimes selling too soon. As we saw with the recent trade, the systems can quickly reverse if they are wrong.
Overall, this is how our various models stack up based on the last allocation change:
Curious if your current investment allocation aligns with your overall objectives and risk tolerance? Take our risk questionnaire
We manage risk so advisors can focus on planning.
Questions or comments - drop us a note?
© 2025 SEM Wealth Management


