
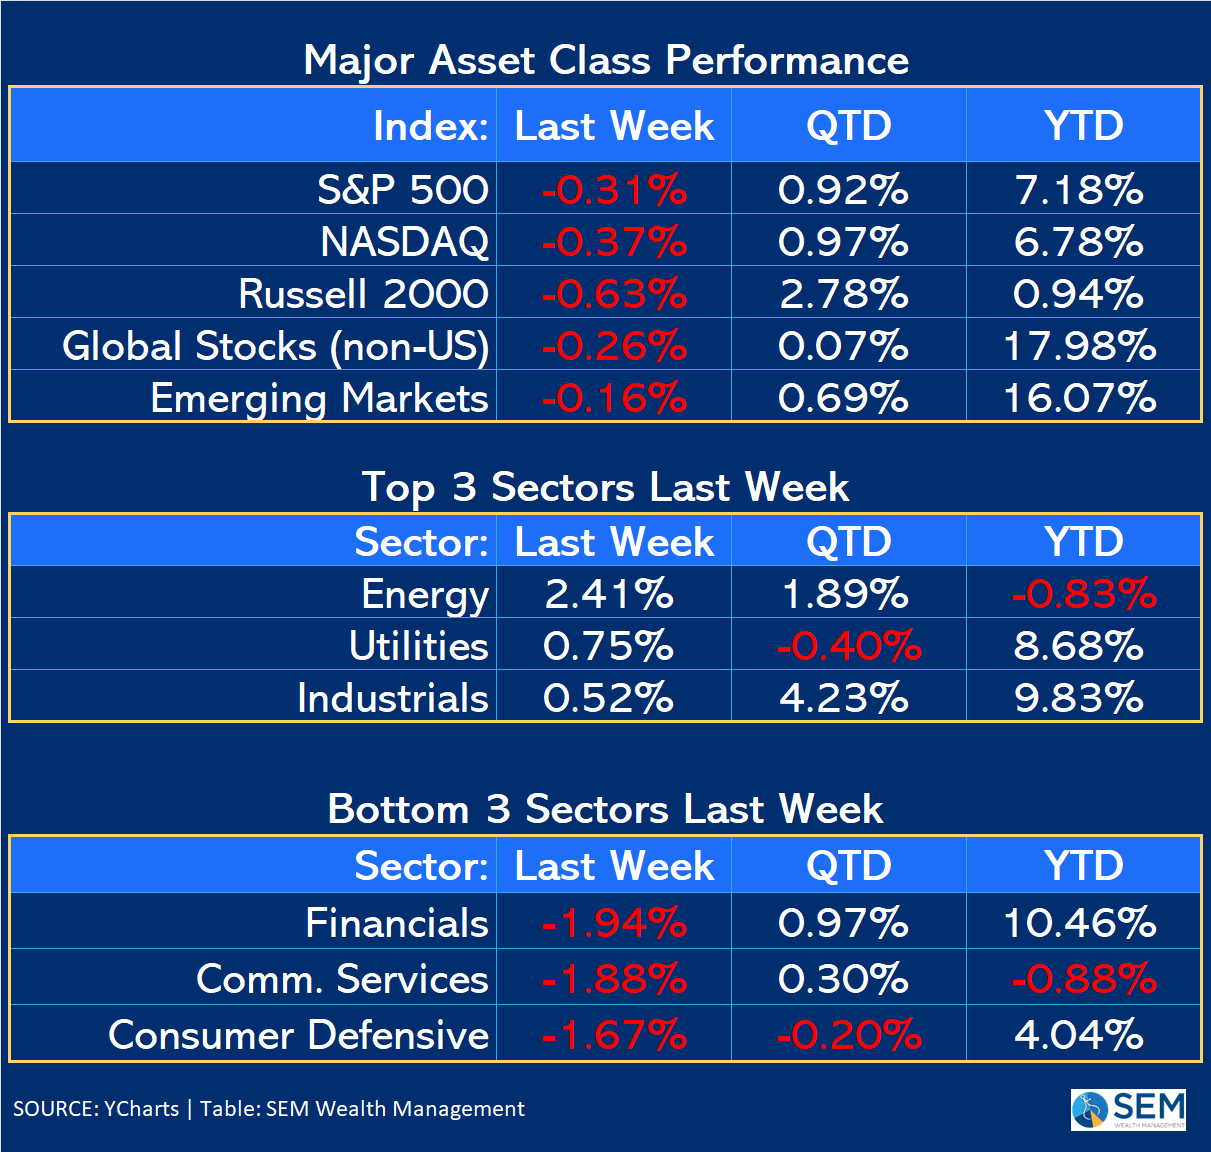
Will the TACO trade come back to haunt Wall Street?
No sooner had we published our Summer Newsletter highlighting the risks Wall Street is ignoring than one of those risks floated straight to the surface. In early April, President Trump spooked markets when he announced a very long list of "reciprocal" tariffs on "Liberation Day". Stocks went into a freefall, interest rates spiked, and the financial markets appeared to be seizing up until he announced a 90 day delay on April 9. That delay expired on July 9. The Trump administration spent most of last week announcing new deadlines, disclosing letters sent to our trading partners, and announcing new tariffs.
Some of those letters included Japan and South Korea where the president announced a 25% "base" tariff starting August 1 if a deal cannot be reached. The president also announced a 50% tariff on Copper (again starting August 1, citing national security reasons.) Canada again was in the crosshairs of the president with a 25% tariff threatened (again starting August 1). Over the weekend the President threatened 25% tariffs (again) on Mexico and Canada.
While the market did move lower for the week, it wasn't the freefall we experienced in early April. The term "TACO" was coined in April and has been the basis of the rally off the lows — Trump Always Chickens Out. The theory is the President closely watches the stock market and if he sees prices fall too much he will reverse coarse (or delay the threatened tariffs). The President and most members of his administration have denied this and said the President only cares about finding fair trade deals with our partners and that if they refuse, he will hold strong. Nobody knows whether or not this is true.
This is just one of the risks we need to be watching.
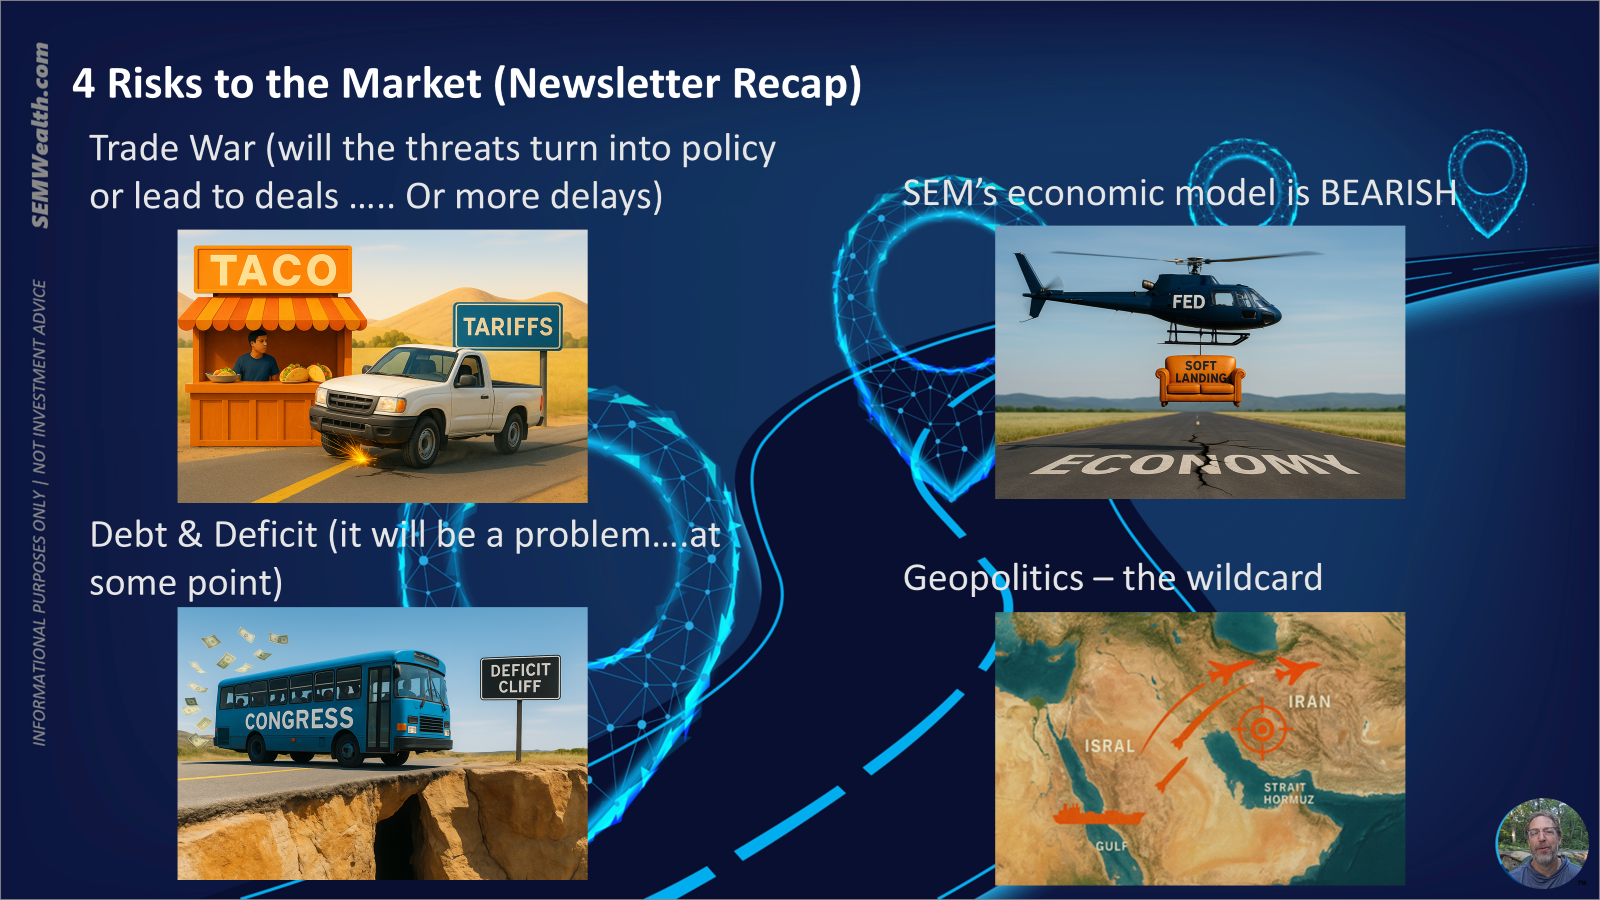
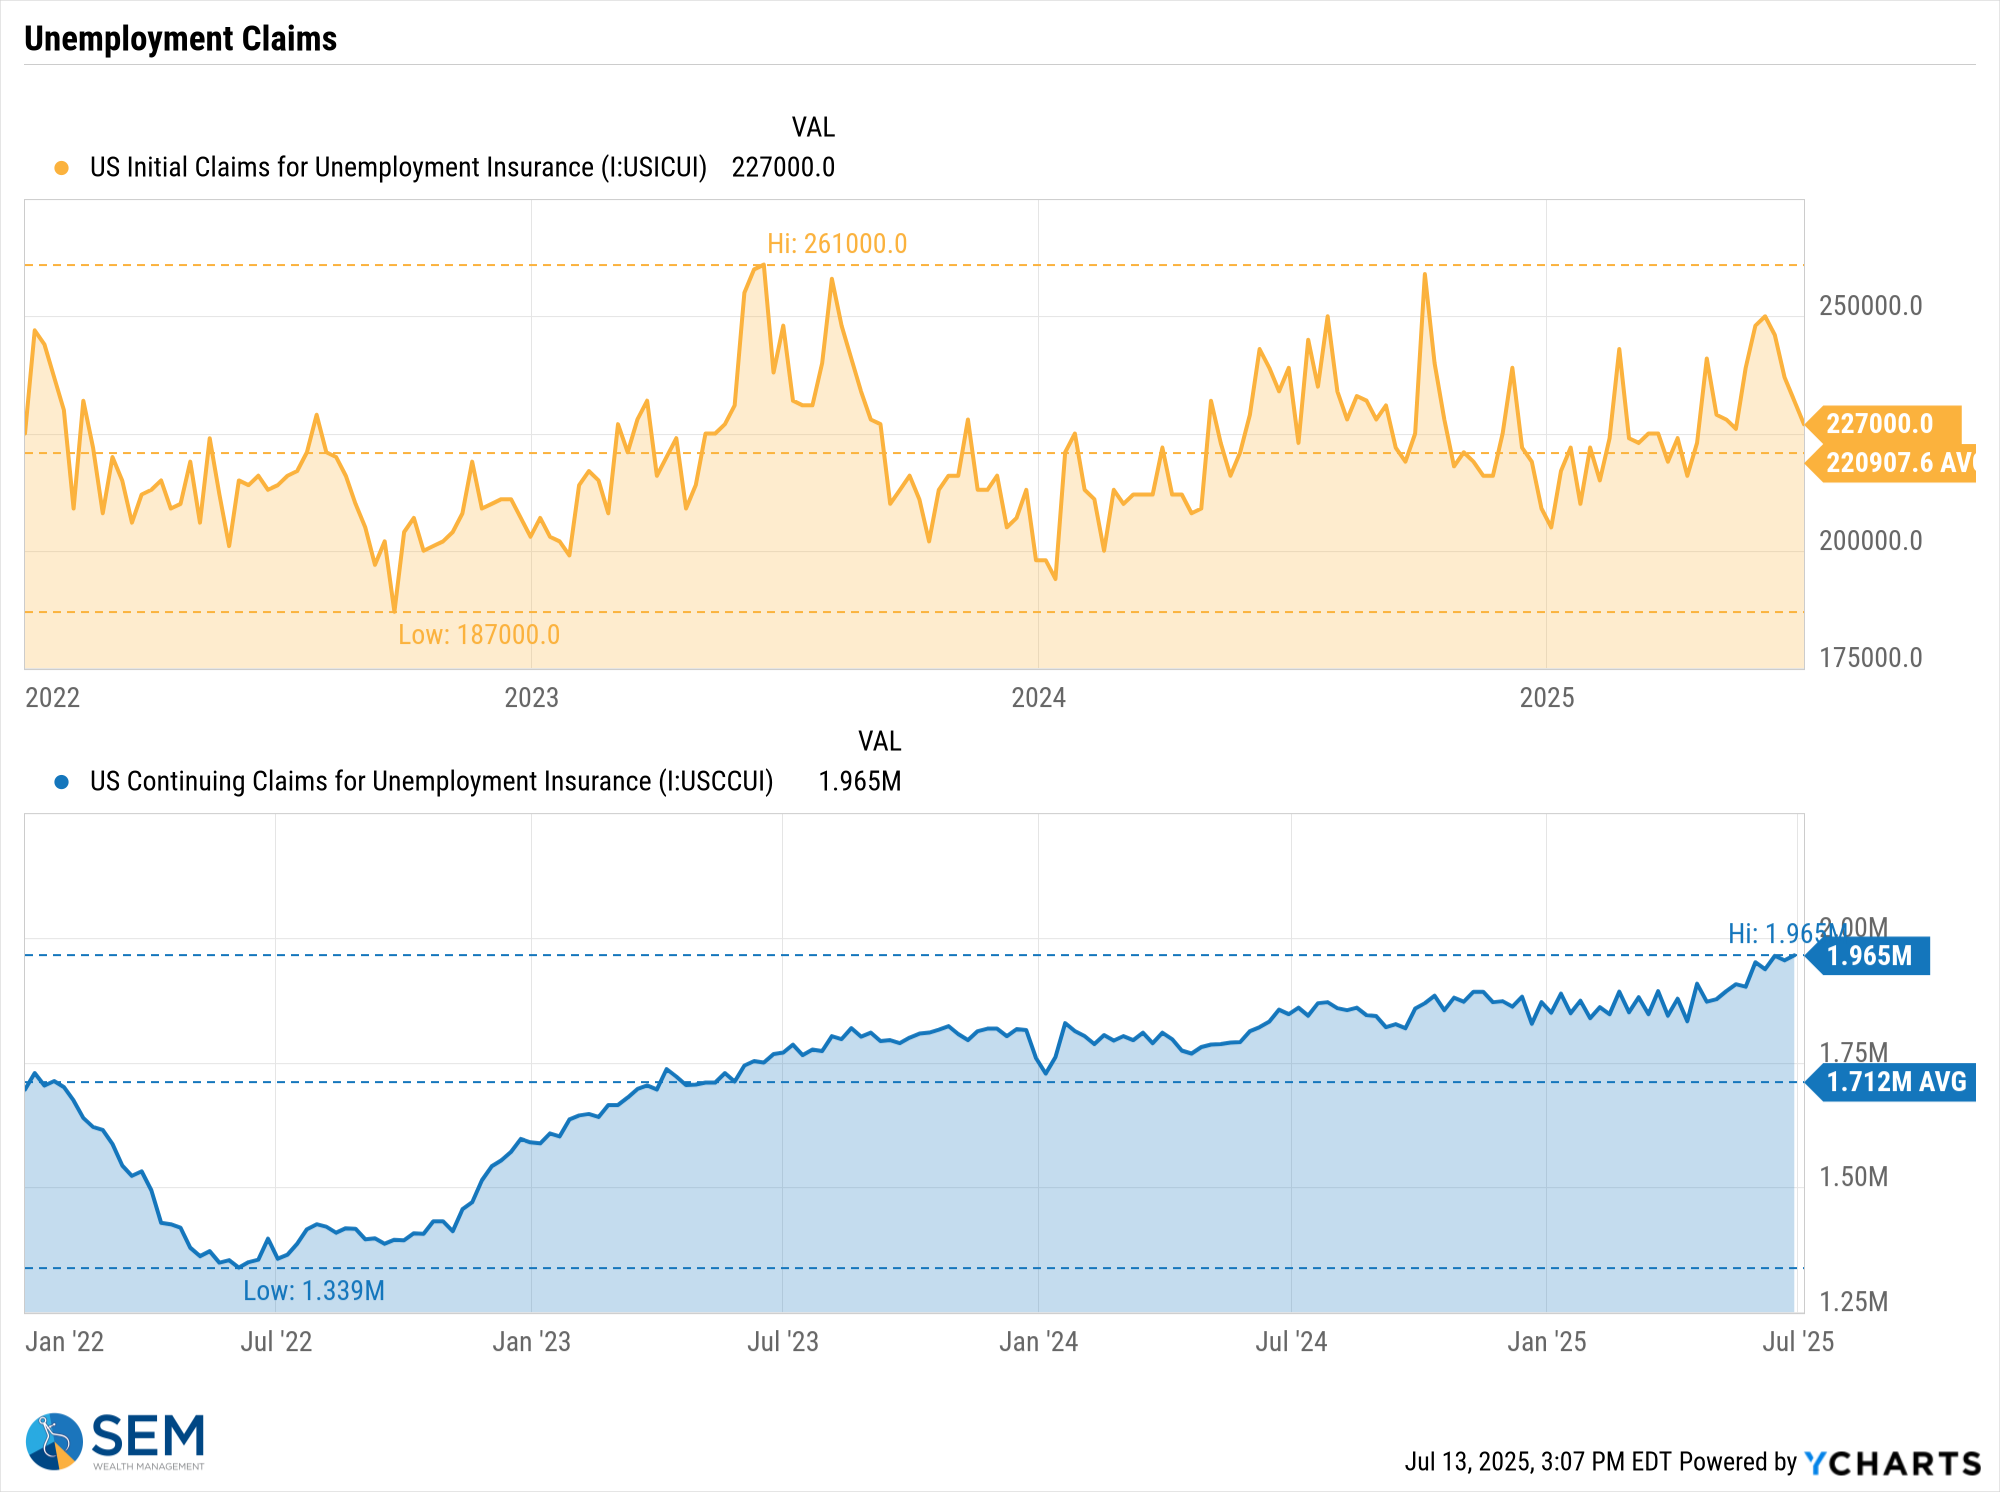
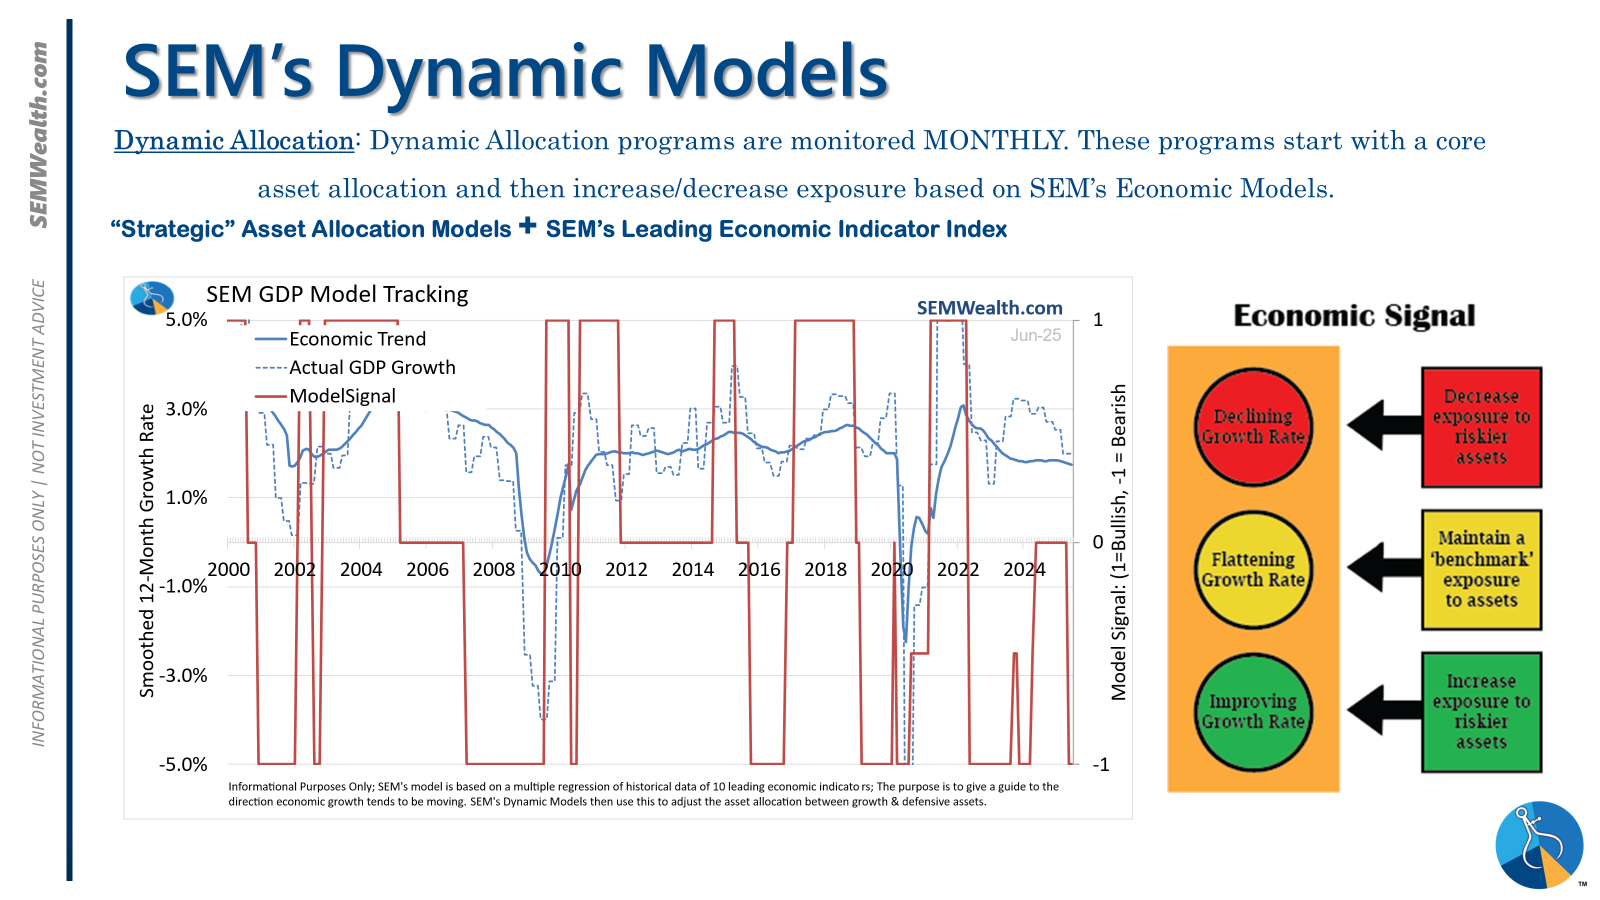
SEM's economic model remains bearish (it is only update once a month). Last week we did get some good news as initial unemployment claims fell for the second straight week. Continuing claims remain at 3 year highs, meaning it is still difficult to find a job once you lose it, but the improvement in new claims is encouraging.
The Fed minutes from their last meeting were released and showed continued uncertainty on when to cut rates again. Most members believe they will cut rates, but the uncertainty of the size and impact of tariffs remains a concern.
This also applies to another risk we identified in the newsletter — our debt and deficits. The President has said his tariffs will pay for all of the tax cuts. Most academic research and the independent Congressional Budget Office disagrees. If the President is wrong, we could see both inflation pressures, an economic slowdown, and an expansi0on of our national debt.
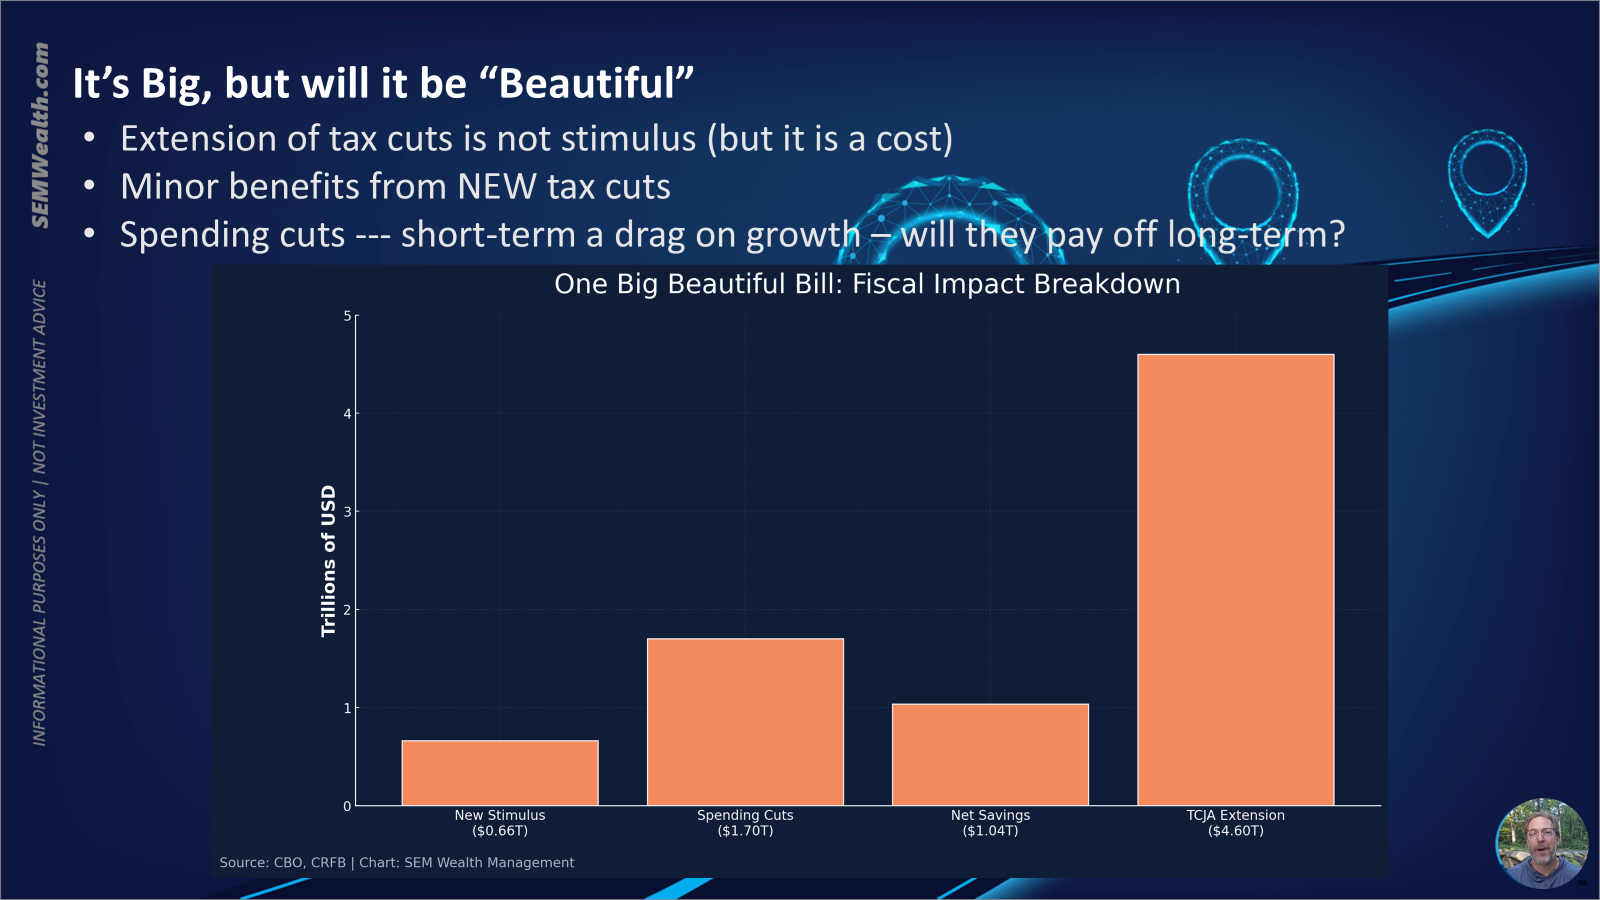
One thing I don't think people understand is while it is nice to not have our taxes increase with the expiration of the 2017 tax cuts, making them permanent will not provide "stimulus" to the economy. It also comes at a big cost. For perspective, I shared this chart in an advisor meeting last week breaking down the "BBB".
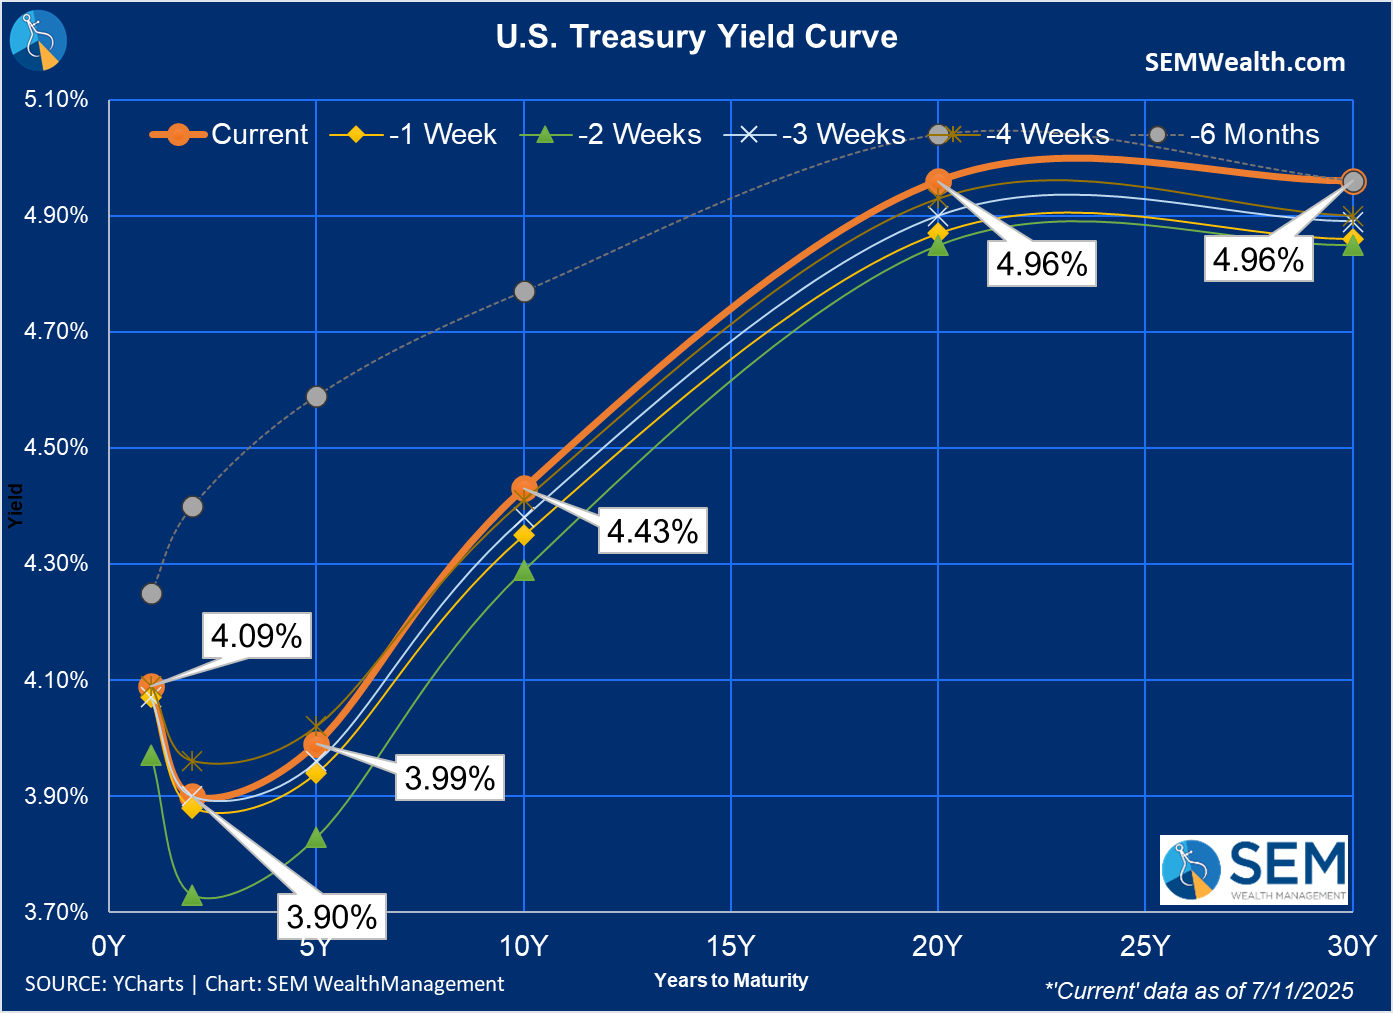
Interest rates moved slightly higher last week, but not in a meaningful way. We will continue to watch this chart closely for signs the bond market is revolting.
What to Watch July 14 – 18
Unlike last week it is a very busy week for economic and earnings news. Here are some of the areas to watch:
| Day | Key event | Why it matters (in one line) |
|---|---|---|
| Tue 7/15 @ 8:30 a.m. ET | June Consumer Price Index (CPI) | “We get the first hard look at whether June’s tariff headlines actually nudged everyday prices higher.” Lower-than-expected CPI would give the Fed cover to keep talking about late-2025 cuts; a miss in either direction could swing bond yields and rate-sensitive stocks. (Bureau of Labor Statistics) |
| Tue 7/15 pre-market | Q2 earnings kick-off – JPMorgan, Citigroup & Wells Fargo report | “Big banks set the tone for the whole earnings season.” Loan growth, credit costs and trading revenues tell us how Main Street and Wall Street are handling higher rates and trade frictions. (Yahoo Finance, Citi, wellsfargo.com) |
| Wed 7/16 @ 8:30 a.m. & 2 p.m. | June Producer Price Index (PPI) + Fed Beige Book | “Back-to-back inflation and a 12-district business check-up give the market a reality-check on the tariff impact.” Watch PPI for pipeline price pressure and Beige Book anecdotes on hiring, wages and supply chains. (Bureau of Labor Statistics, Federal Reserve) |
| Thu 7/17 | Two consumer gauges – June Retail Sales (8:30 a.m.) & Netflix earnings (after-hours) | “We’ll see if shoppers kept swiping cards and streaming shows.” Retail Sales reveal real-world demand; Netflix’s results spotlight discretionary spending and ad trends. (Census.gov, Yahoo Finance) |
| Fri 7/18 @ 8:30 a.m. | June Housing Starts & Building Permits | “Fresh data on starts tell us if higher mortgage rates and lumber tariffs are cooling construction.” Housing is an early-cycle sector and a key input in the Fed’s inflation outlook. (Census.gov) |
Market Charts
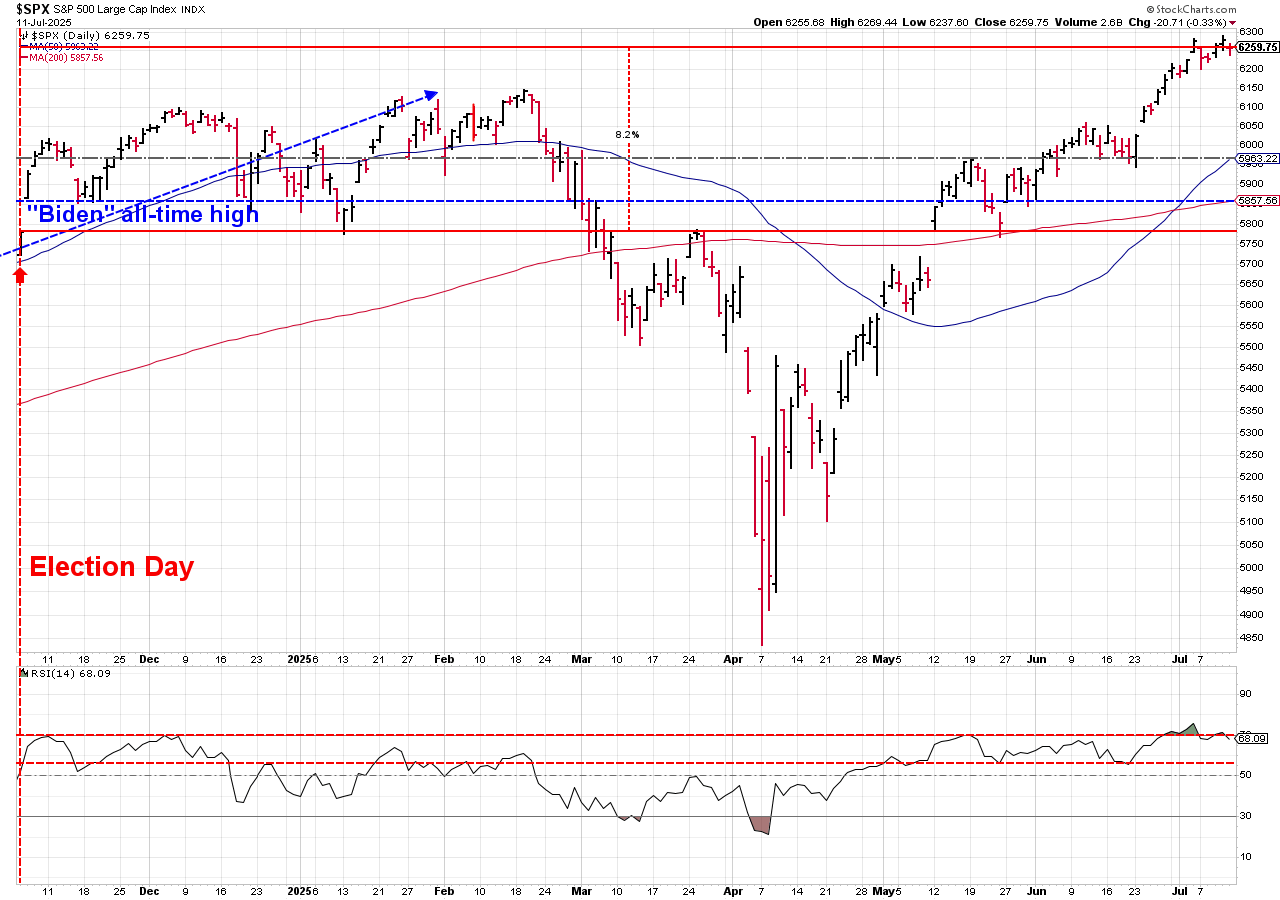
The shorter-term chart shows the wild ride for the S&P 500 since the election.
On the longer-term chart, you can barely see the losses for the week against the steep uptrend line.
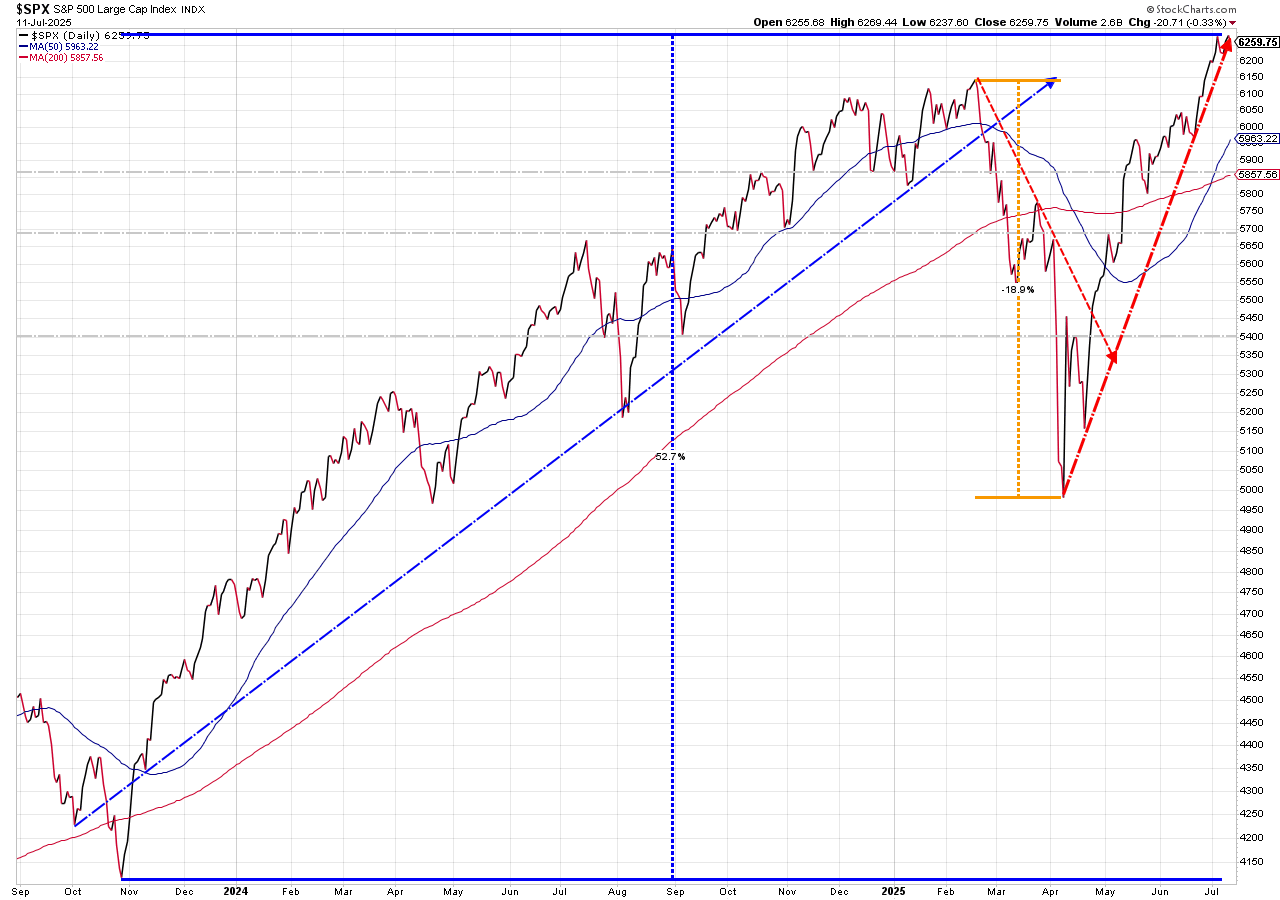
We continue with this dilemma ....... the trend is higher and has been confirmed by underlying technical indicators, but stocks are very overvalued, the run has been nearly straight-up and the fundamentals underneath the economy seem to be weakening. Add some political uncertainty and it is difficult to get excited about the upcoming weeks (or months) until we have some sort of a pullback.
SEM Market Positioning
| Model Style | Current Stance | Notes |
|---|---|---|
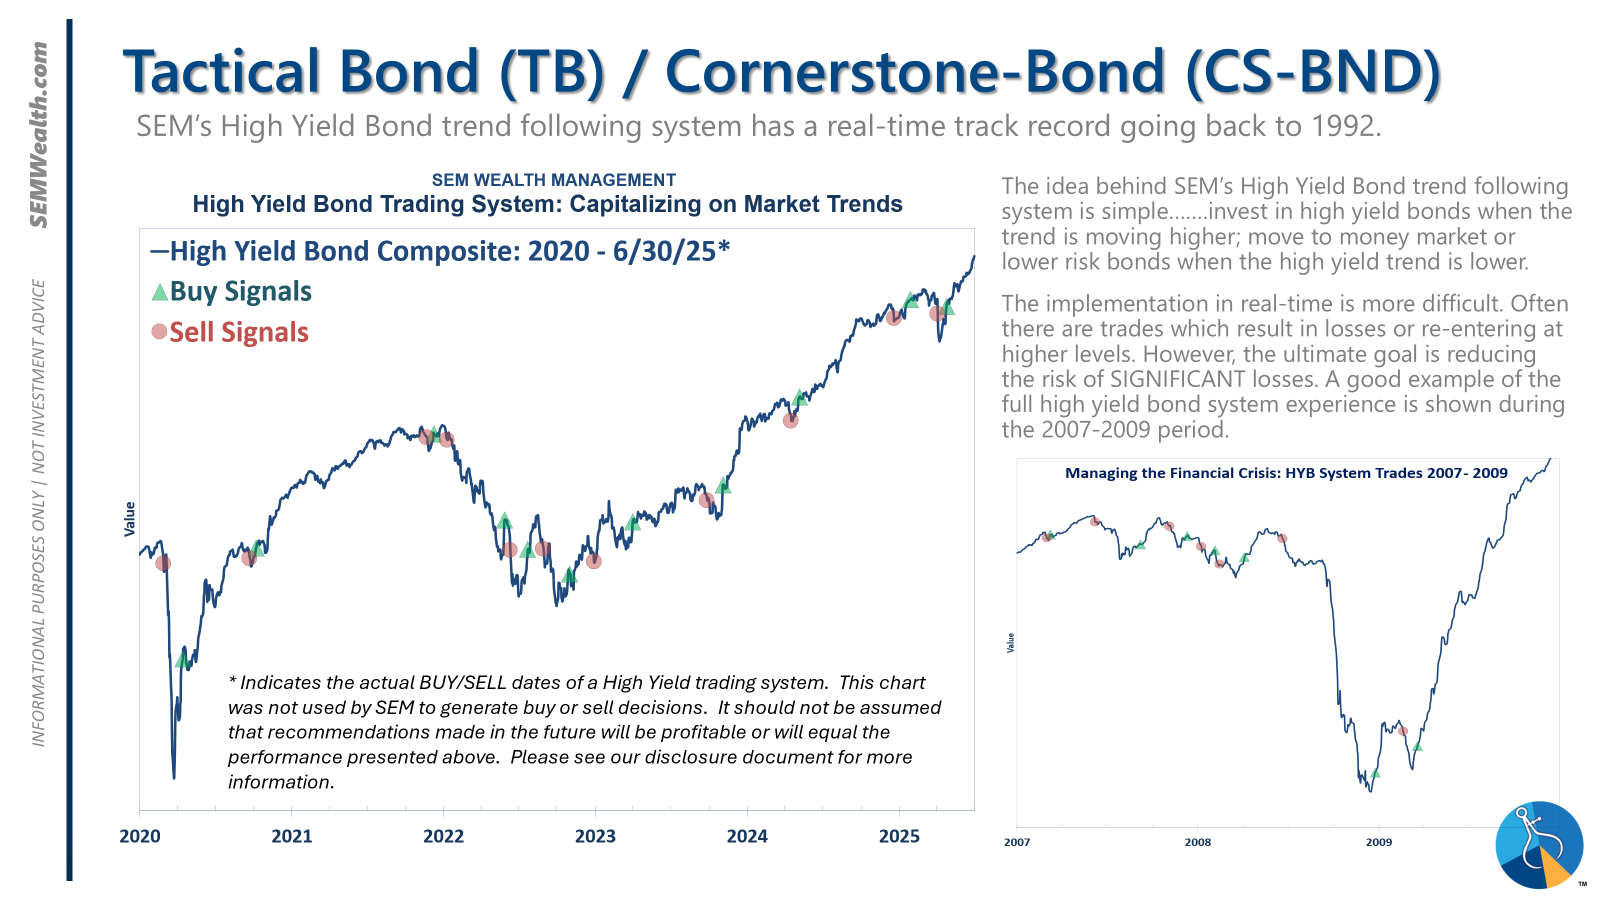
| Tactical | 100% high yield | High-yield spreads holding, but trend is slowing-watching closely |
| Dynamic | Bearish | Economic model turned red – leaning defensive |
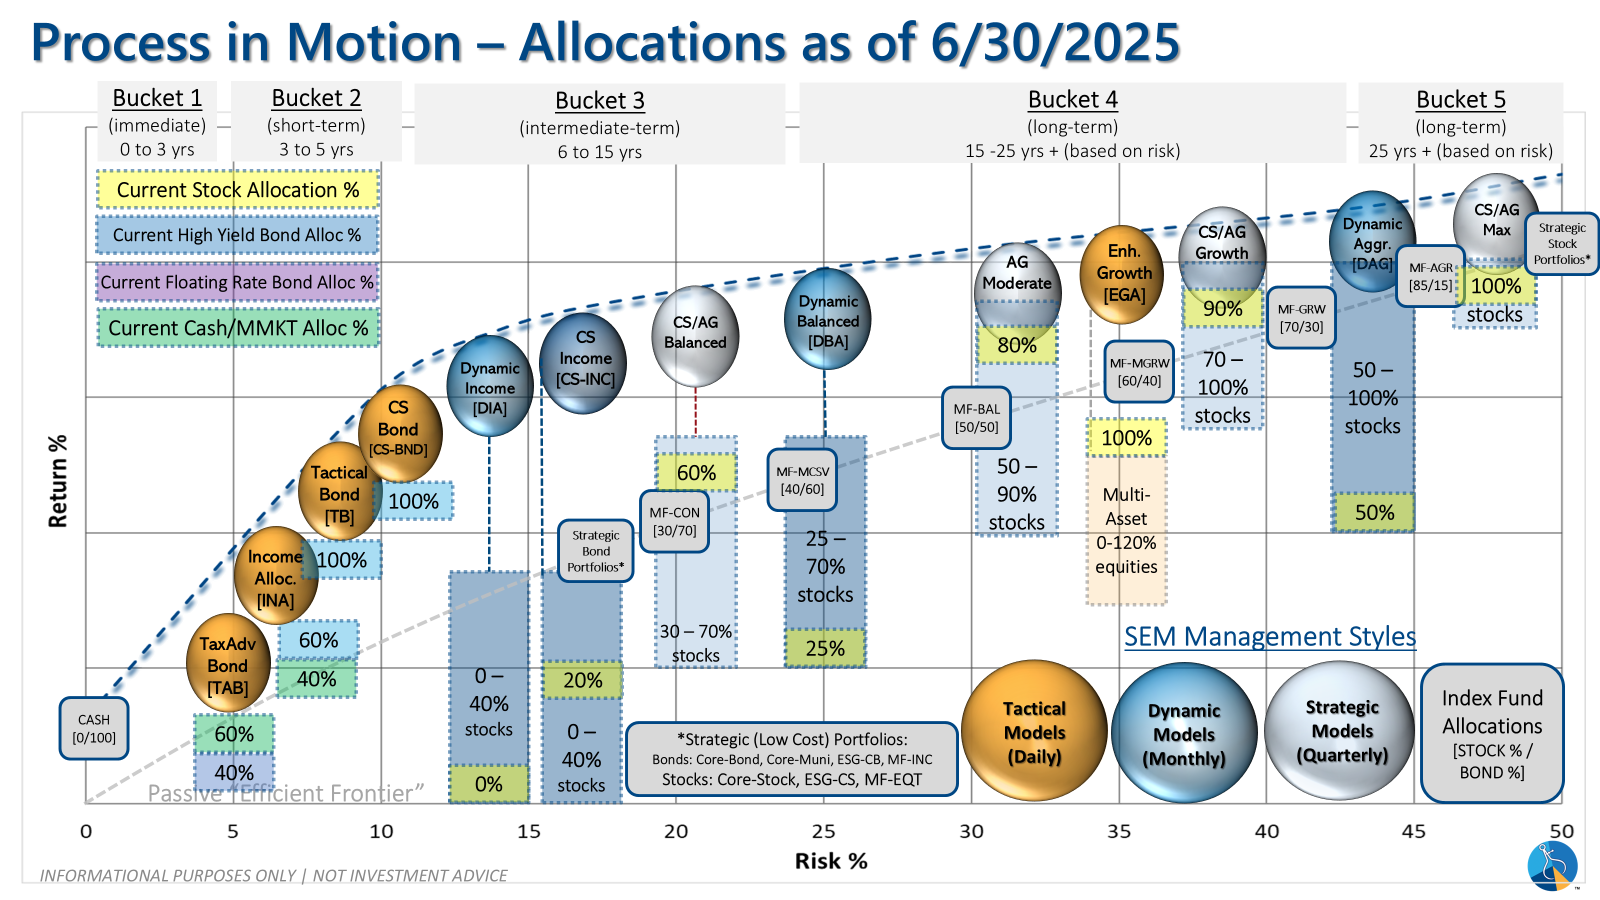
| Strategic | Slight under-weight | Trend overlay shaved 10 % equity in April -- added 5% back early July |
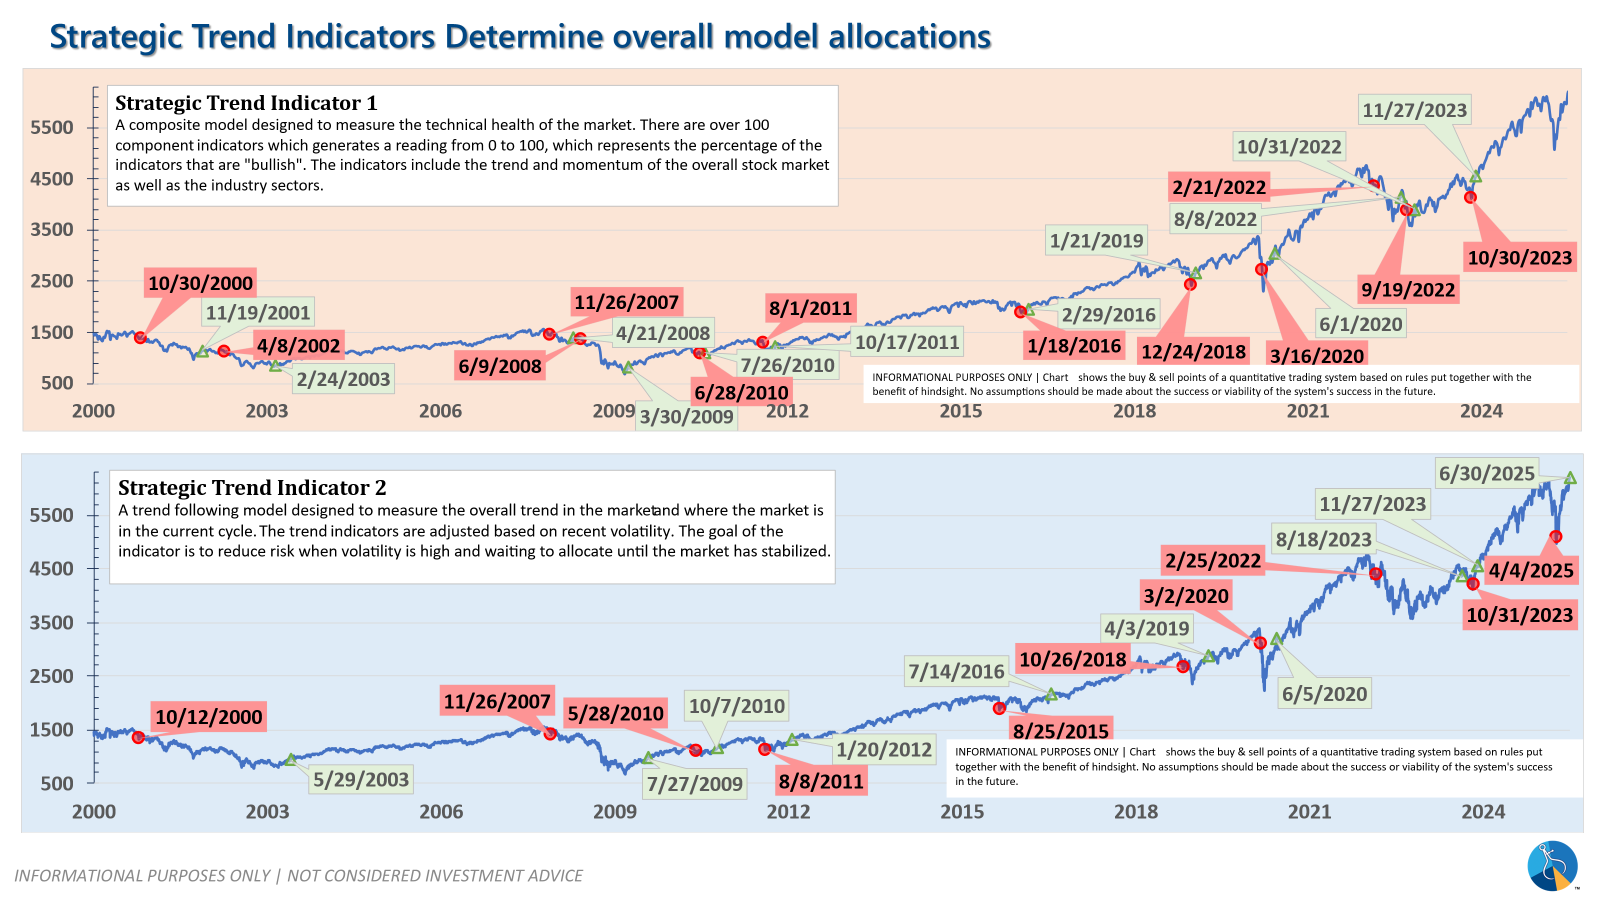
SEM deploys 3 distinct approaches – Tactical, Dynamic, and Strategic. These systems have been described as 'daily, monthly, quarterly' given how often they may make adjustments. Here is where they each stand.
Tactical (daily): On 4/3/2025 our tactical high yield model sold out of high yield bond into money market. The system re-entered on 4/24/2025.
Dynamic (monthly): The economic model went 'bearish' in June 2025 after being 'neutral' for 11 months. This means eliminating risky assets – sell the 20% dividend stocks in Dynamic Income and the 20% small cap stocks in Dynamic Aggressive Growth. The interest rate model is 'neutral' meaning low duration/money market investments for the bulk of the bonds.
Strategic (quarterly)*: One Trend System sold on 4/4/2025; Re-entered on 6/30/2025
The core rotation is adjusted quarterly. On August 17 it rotated out of mid-cap growth and into small cap value. It also sold some large cap value to buy some large cap blend and growth. The large cap purchases were in actively managed funds with more diversification than the S&P 500 (banking on the market broadening out beyond the top 5-10 stocks.) On January 8 it rotated completely out of small cap value and mid-cap growth to purchase another broad (more diversified) large cap blend fund along with a Dividend Growth fund.
The * in quarterly is for the trend models. These models are watched daily but they trade infrequently based on readings of where each believe we are in the cycle. The trend systems can be susceptible to "whipsaws" as we saw with the recent sell and buy signals at the end of October and November. The goal of the systems is to miss major downturns in the market. Risks are high when the market has been stampeding higher as it has for most of 2023. This means sometimes selling too soon. As we saw with the recent trade, the systems can quickly reverse if they are wrong.
Overall, this is how our various models stack up based on the last allocation change:
Curious if your current investment allocation aligns with your overall objectives and risk tolerance? Take our risk questionnaire
We manage risk so advisors can focus on planning.
Questions or comments - drop us a note?
© 2025 SEM Wealth Management


