Whether you're ready or not, we are about to see a 100 day (or longer) period filled with a flurry of new policies out of Washington DC. There have already been many predictions of these policies leading to robust economic (and thus stock market) growth. If we learned anything from the first round of the Trump Administration it was we should be ready for anything. We also learned the ultimate outcome of these ideas is sometimes nowhere near what the original predictions were.
Yes, the first Trump years were strong. The market shot off like a rocket in 2017, but even before COVID the predictions of robust economic growth were misaligned with reality.

Many people forget that the boost from the tax cuts was temporary. We nearly entered into a bear market at the end of 2018. Things were slowing so quickly in fact that the Fed actually CUT rates in July 2019 to try to avert a recession.
I think that should be the reminder to anybody who believes nothing can go wrong the next four years. I hope things are as fantastic as so many people believe. I'm all for lower regulations, lower taxes, and more business support, but I'm also all for finding ways to reign in our runaway budget deficit, helping the middle class, and not providing short-term solutions that do not help us over the long-term.
First round of executive orders

As of this post (6:30 pm on Inauguration Day) no orders have yet to be signed, although based on the speeches so far today they may very well hit their goal of 100. Stay tuned!
An ambitious agenda
Axios summarized all of the promises President Trump made on the campaign trail and post-election. The size of the boxes is based on how many times he mentioned these policies publicly.

We talked about what to expect in the year ahead in our latest SEM University. You can check out the replay here:

At the end of the webinar I discussed our game plan for 2025. Stay tuned each week (or more often as needed) for updates on where we stand and what our models are saying about the latest action.

Market Charts
Last Monday stocks opened below the closing level of election day. This followed a jobs report that was "too good" to support further Fed rate cuts. Monday afternoon a few Fed officials hinted the Fed could still cut rates. Later in the week, milder than expected inflation readings reinvigorated the belief the Fed would still be able to cut rates while the economy enjoys strong growth.

While the President would like to take credit for the rally, this chart shows we were already in a nice uptrend since the Fed hinted they were done hiking rates and the market began anticipating they would cut rates.

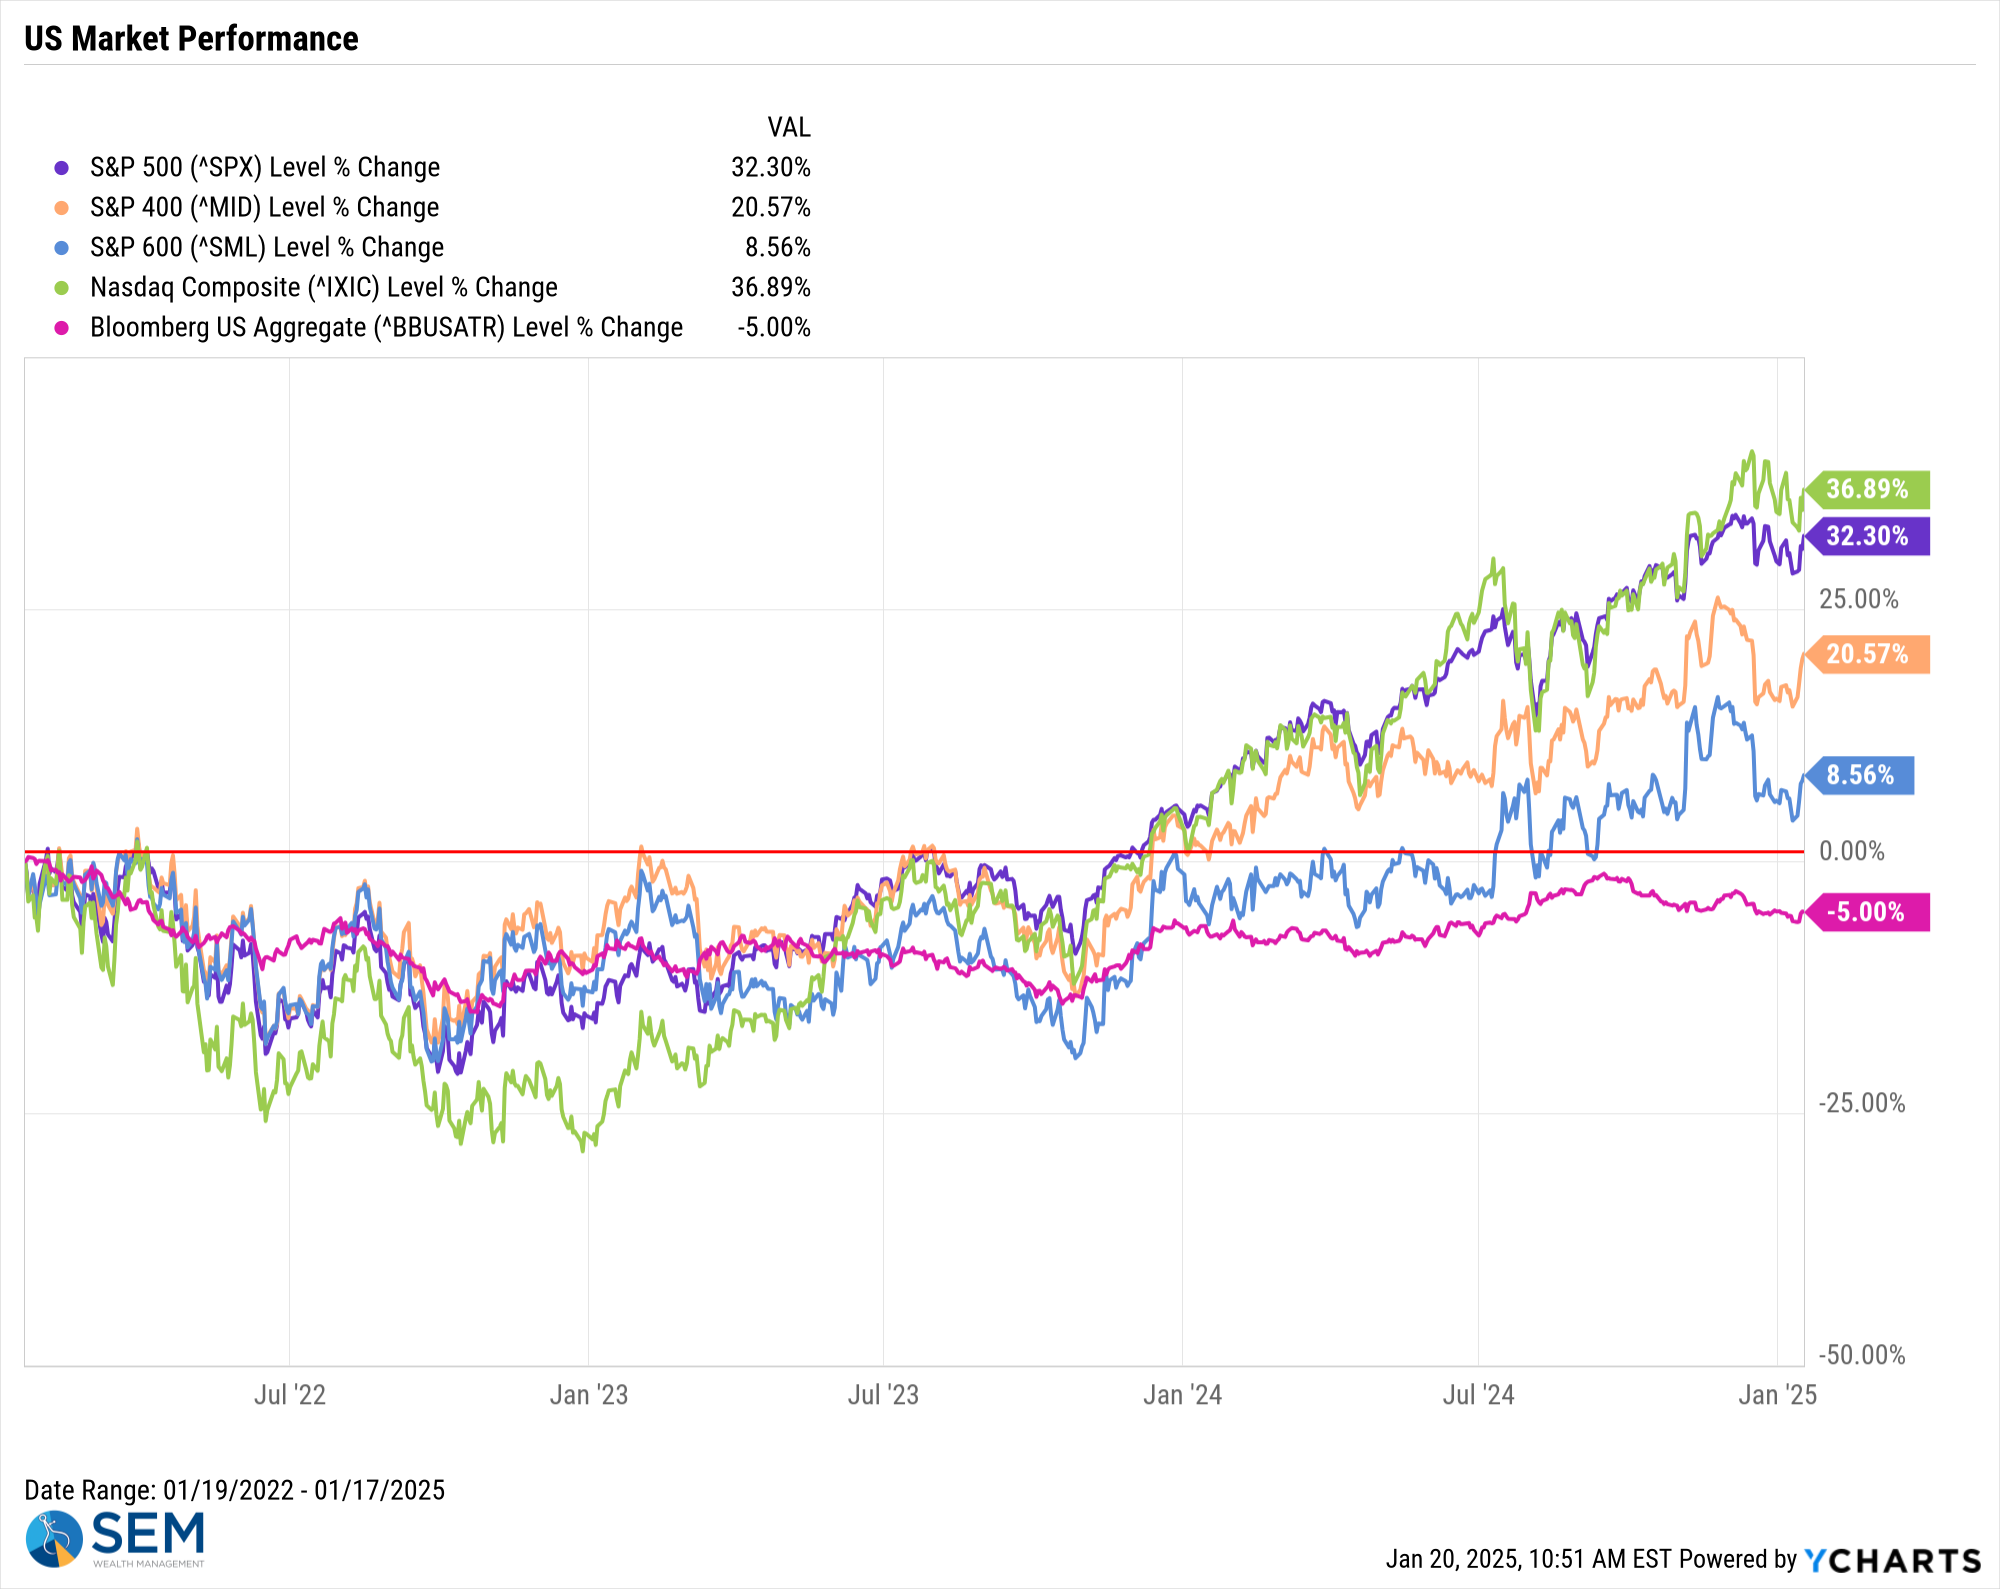
Zooming out, comparing Large-Mid-Small Cap stocks to bonds, we can see how different the experience has been the past 3 years.

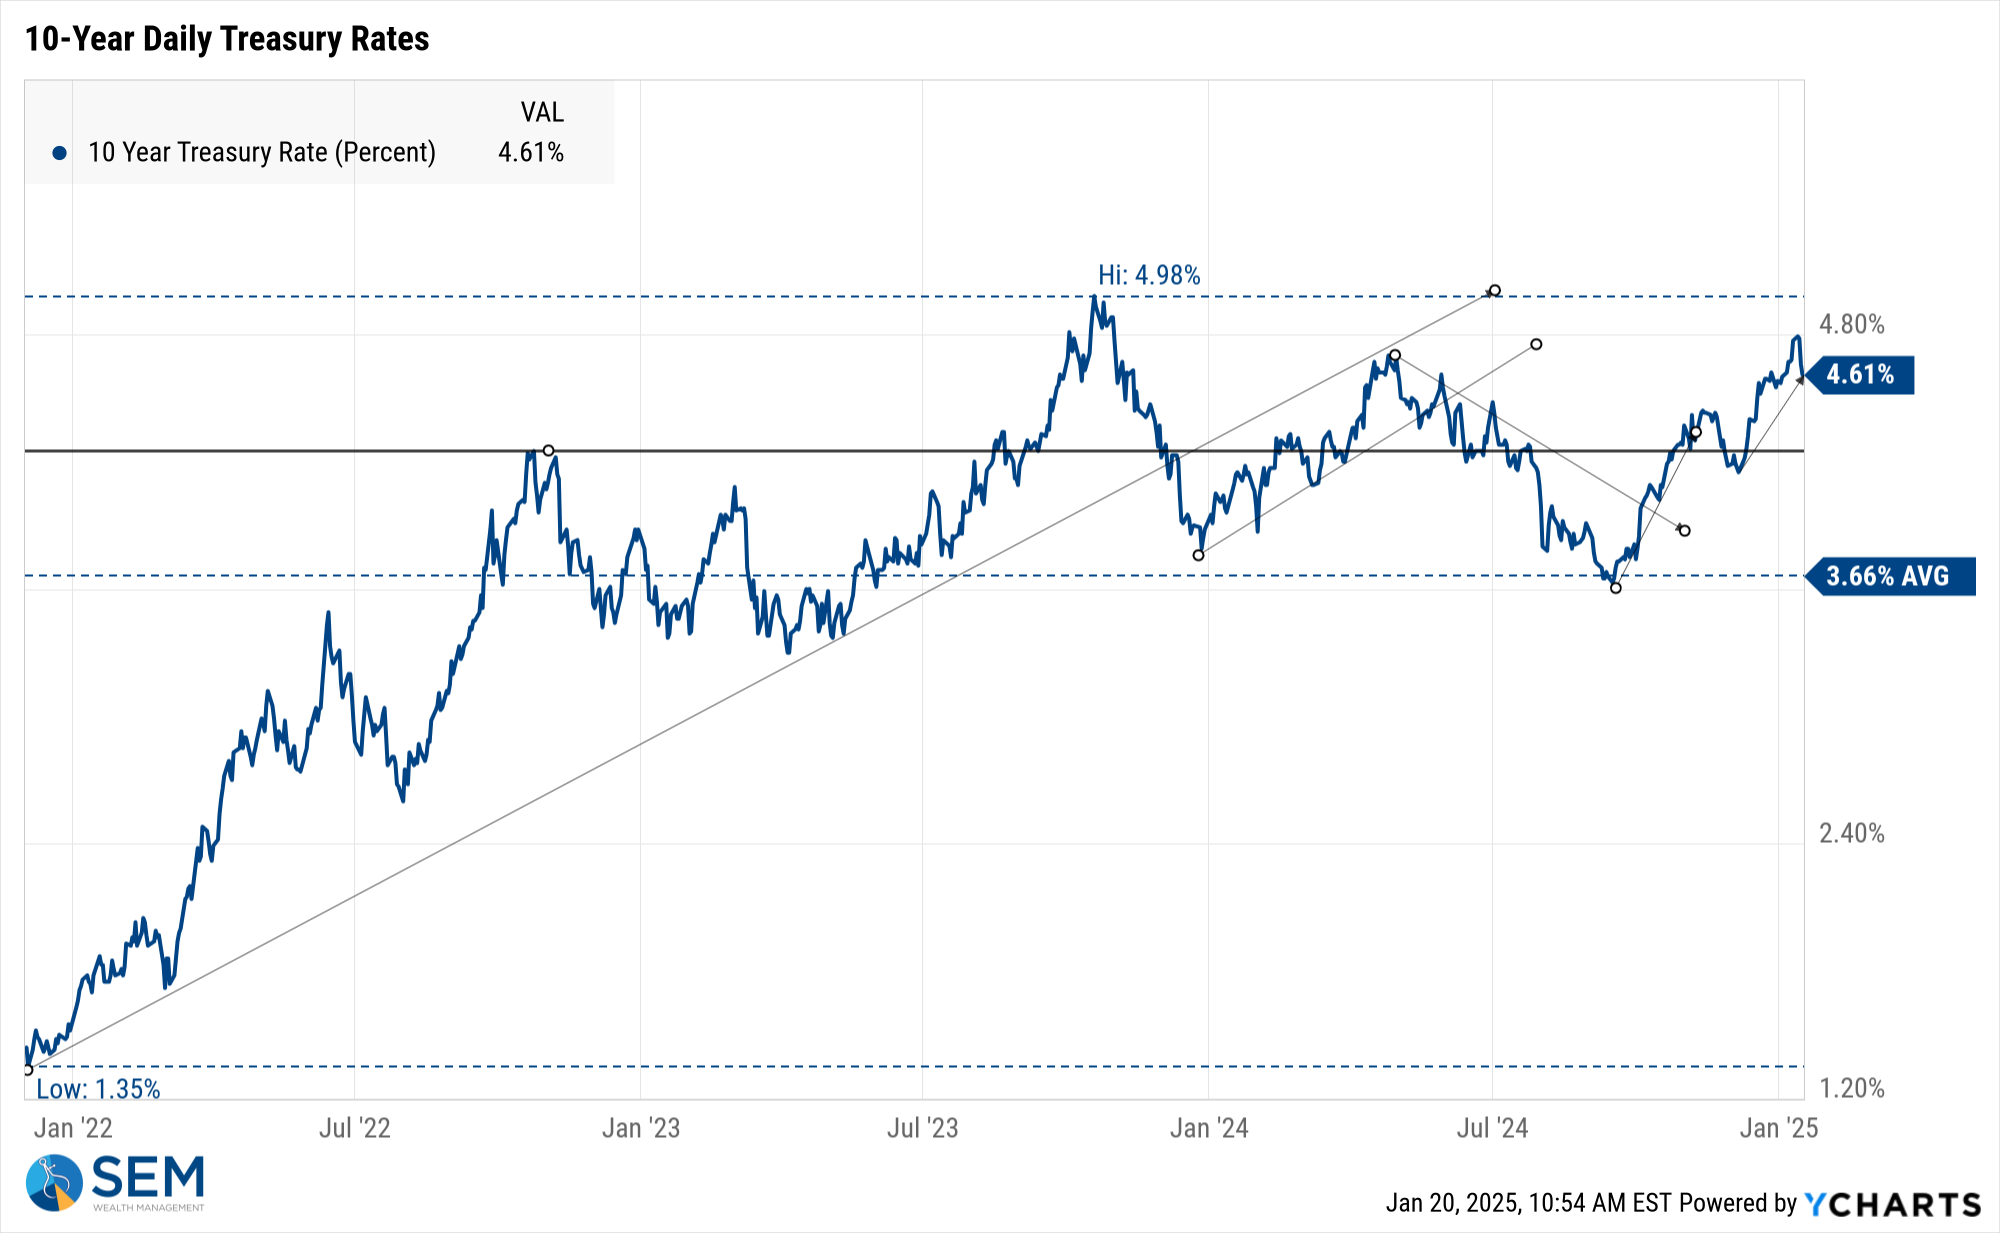
The more important chart for the market and President Trump will be the 10-year Treasury yield. If the bond market believes the President's policies will spark inflation, long-term rates will go up, making it very difficult to fully implement his economic policies.

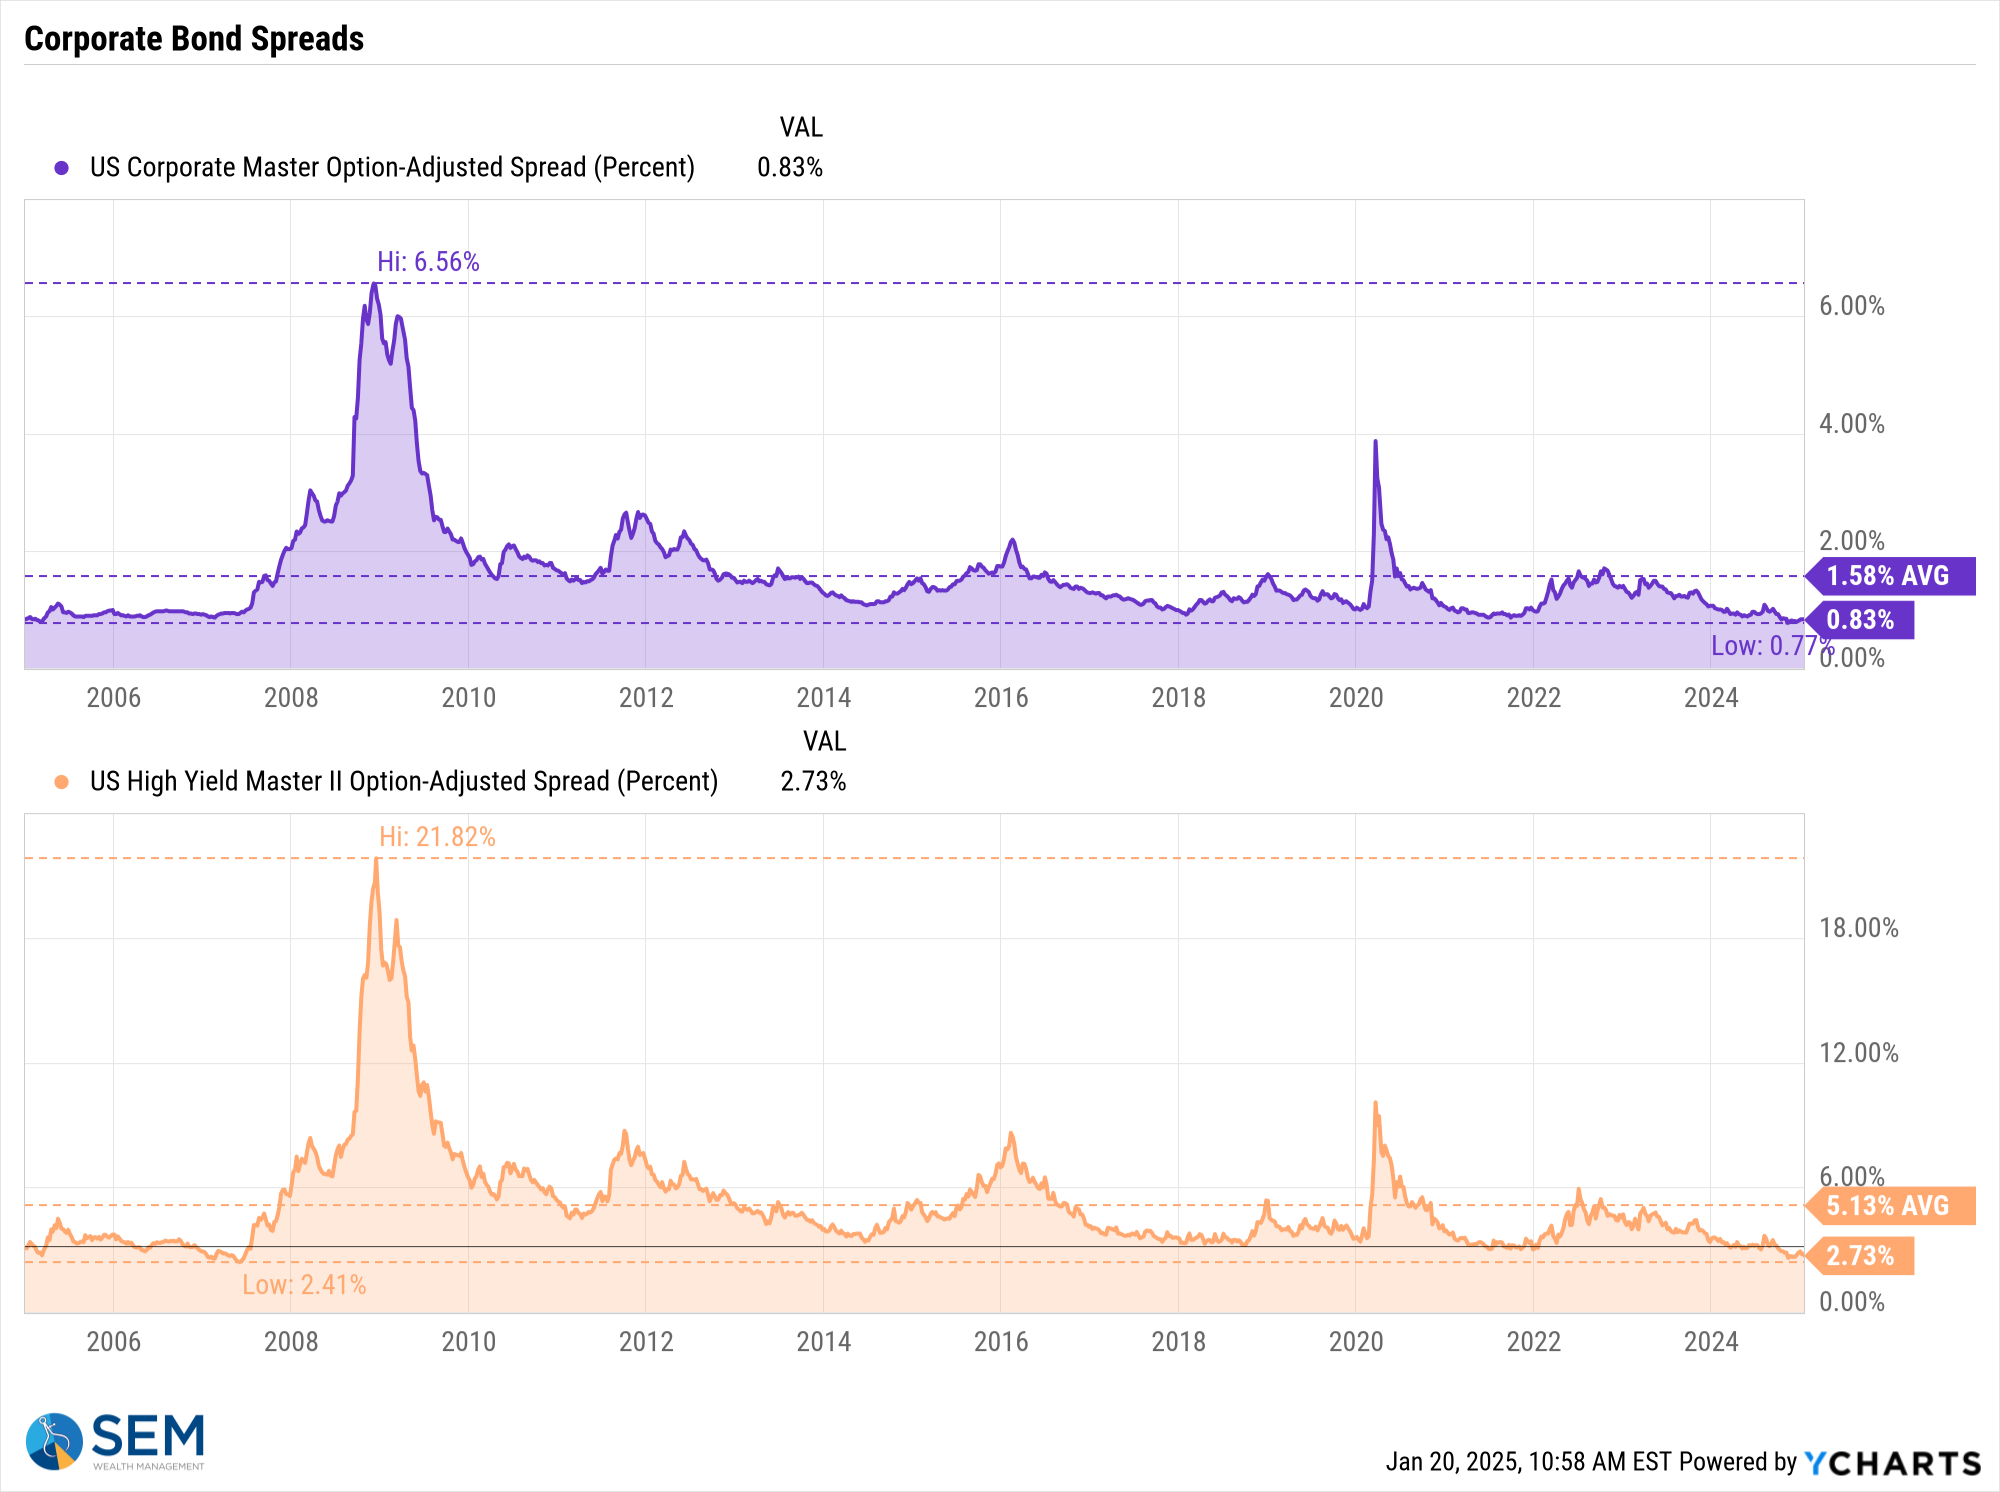
What's fascinating (so far) is the big run-up in Treasury Yields has not been based on fear the economy was struggling. If it were we would see the spread between Treasuries and Corporate Bonds rising. Instead they are at or near all-time lows.

SEM Model Positioning
-Tactical High Yield sold our high yield bond positions purchased last spring on 12/20/24. We had added a 30% position in floating rate bonds on 12/6/24, which currently have a 9% yield compared to a 6% yield in high yields and 4.6% in money markets. This follows the partial (about 67%) buy signal on 5/6/24.
-Dynamic Models are 'neutral' as of 6/7/24, reversing the half 'bearish' signal from 5/3/2024. 7/8/24 - interest rate model flipped from partially bearish to partially bullish (lower long-term rates).
-Strategic Trend Models went on a buy 11/27/2023; 7/8/24 – small and mid-cap positions eliminated with latest Core Rotation System update – money shifted to Large Cap Value (Dividend Growth) & International Funds
SEM deploys 3 distinct approaches – Tactical, Dynamic, and Strategic. These systems have been described as 'daily, monthly, quarterly' given how often they may make adjustments. Here is where they each stand.
Tactical (daily): On 12/20/2024 our tactical high yield model sold out of high yield bond (about 70% of our holdings) into money market. The other 30% is invested in shorter duration, higher yielding floating rate bonds. These instruments are not as sensitive to credit risk and are typically allocated to in the early and late stages of a high yield bond move in our model.

Dynamic (monthly): The economic model was 'neutral' since February. In early May the model moved slightly negative, but reversed back to 'neutral' in June. This means 'benchmark' positions – 20% dividend stocks in Dynamic Income and 20% small cap stocks in Dynamic Aggressive Growth. The interest rate model is slightly 'bullish'.

Strategic (quarterly)*: BOTH Trend Systems reversed back to a buy on 11/27/2023
The core rotation is adjusted quarterly. On August 17 it rotated out of mid-cap growth and into small cap value. It also sold some large cap value to buy some large cap blend and growth. The large cap purchases were in actively managed funds with more diversification than the S&P 500 (banking on the market broadening out beyond the top 5-10 stocks.) On January 8 it rotated completely out of small cap value and mid-cap growth to purchase another broad (more diversified) large cap blend fund along with a Dividend Growth fund.
The * in quarterly is for the trend models. These models are watched daily but they trade infrequently based on readings of where each believe we are in the cycle. The trend systems can be susceptible to "whipsaws" as we saw with the recent sell and buy signals at the end of October and November. The goal of the systems is to miss major downturns in the market. Risks are high when the market has been stampeding higher as it has for most of 2023. This means sometimes selling too soon. As we saw with the recent trade, the systems can quickly reverse if they are wrong.

Overall, this is how our various models stack up based on the last allocation change:

Questions or comments - drop us a note?
Curious if your current investment allocation aligns with your overall objectives and risk tolerance? Take our risk questionnaire


