
Since February economists have been predicting the declining trend in inflation the past several years to reverse higher due to the on-going trade war. That has not been the case. There are several reasons for this, starting with companies "front-loading" their inventory starting in December of last year to get the goods and materials they needed before any threatened tariffs took effect. We've seen this skew all kinds of economic statistics from the trade deficit to GDP in addition to the inflation numbers. Most tariffs did not take effect when announced thanks to the 90 + 30 day delays from the White House on the "retaliatory" tariffs announced on "Liberation Day".
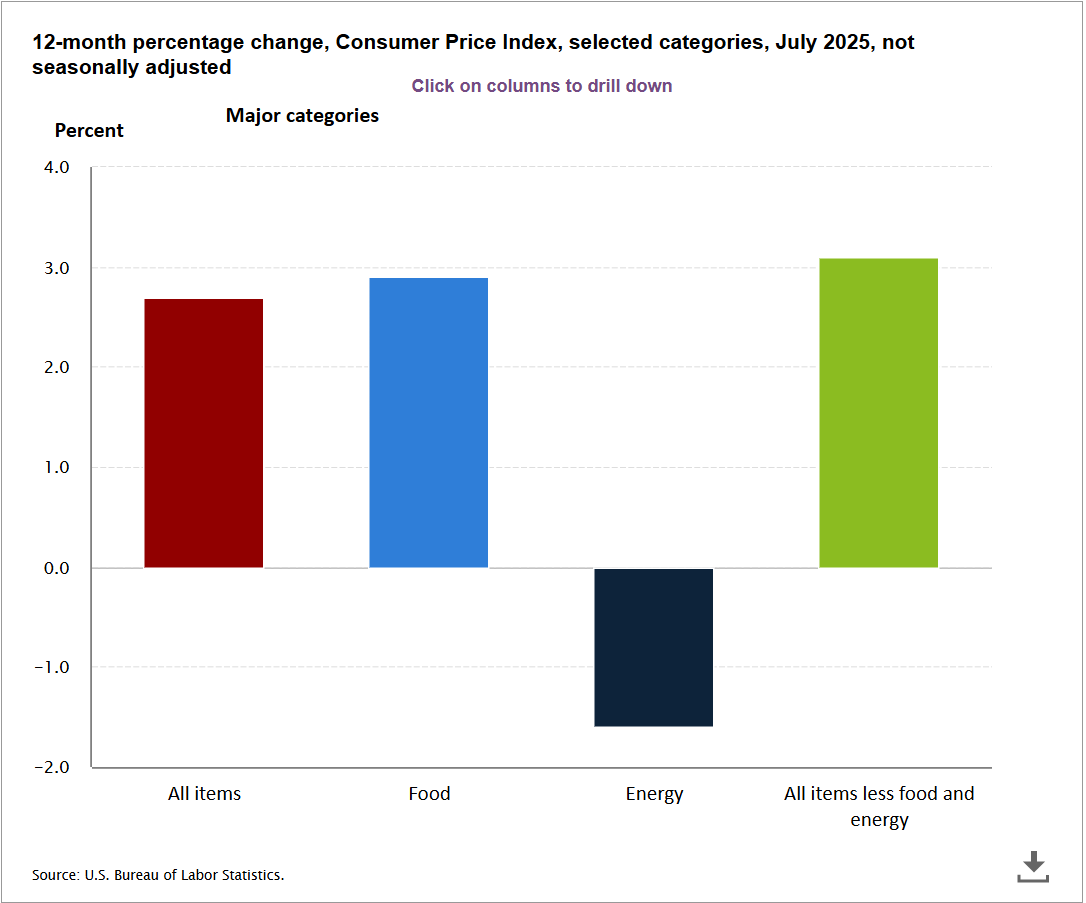
Now that we have some clarity (and inventories have been burned off) we are see the impact of tariffs on inflation begin to hit. In July Consumer Prices again moved higher, crossing the 3% level again over the past 12 months. The only positive this summer has been a drop in energy prices. Everything else is rising much faster than the Fed's 2% target level.
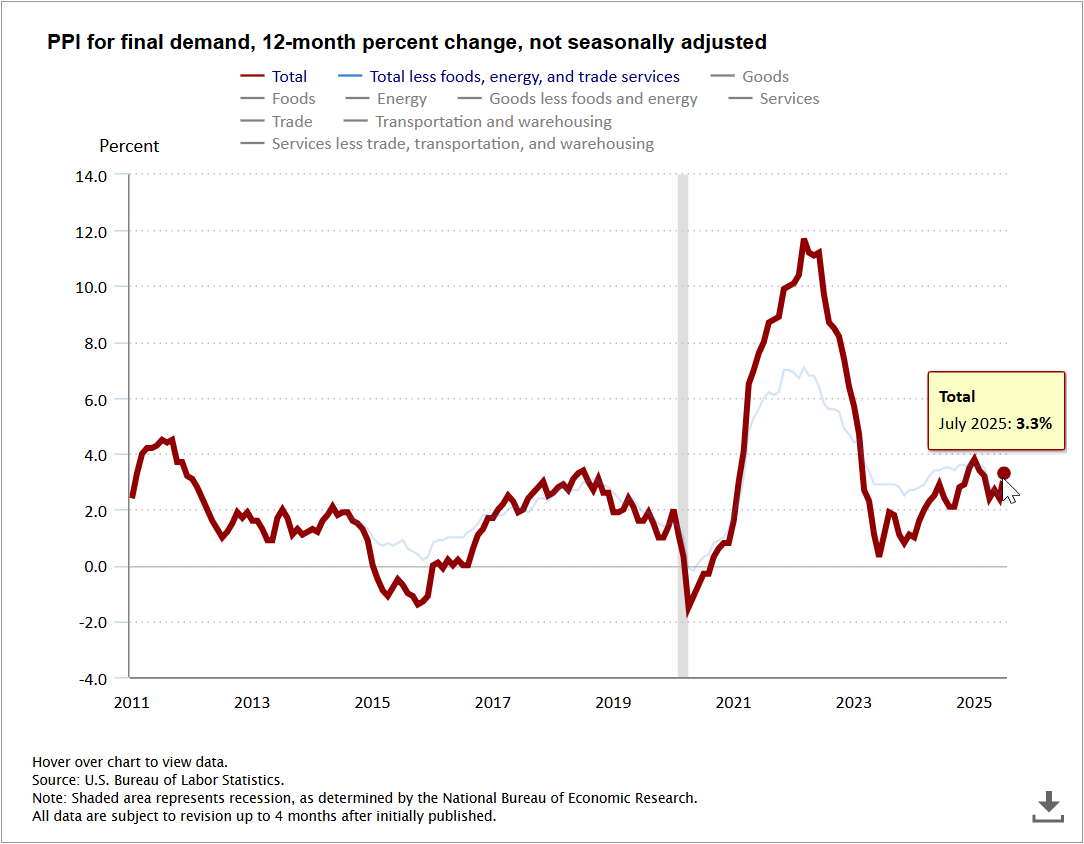
The bigger jump came from Producer Prices, which rose much faster than expected. The concern of course is that this will begin to either filter down to consumers, spiking inflation and likely slowing spending or will hit profit margins if companies cannot pass this price increase onto their consumers.
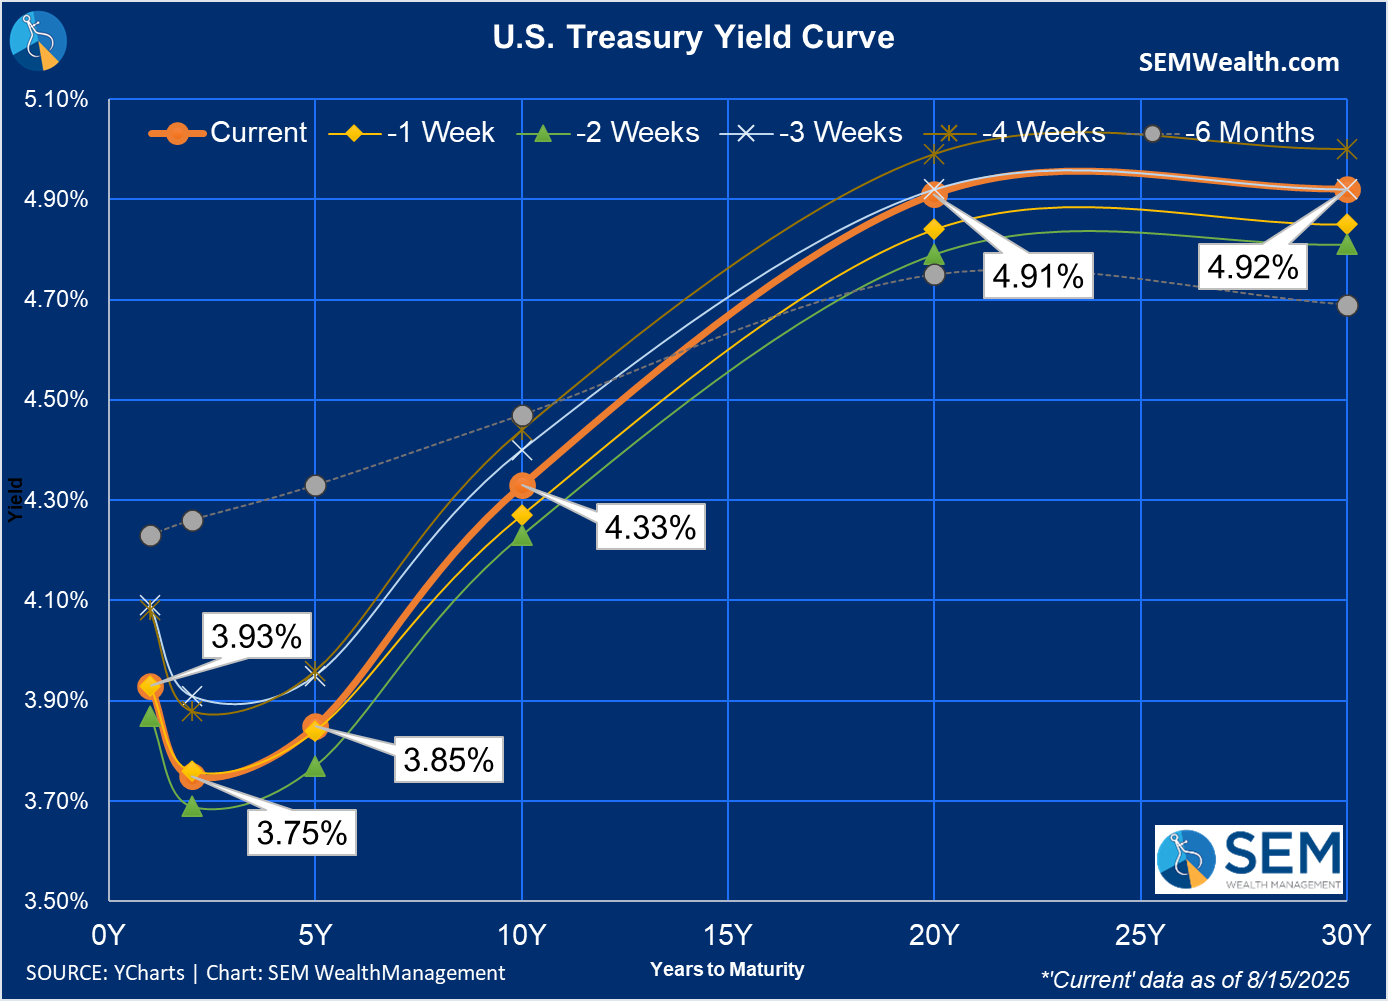
This led to interest rates picking up a bit, but not as much as you would have predicted if I told you how much Producer Prices jumped last month. The yield curve is still implying problems ahead for the economy, but the stock market believes these "problems" will be reason to celebrate because it will lead to the Fed easing interest rates. The market appears to have shifted from pricing in a 50bp rate cut, but most Fed Watch indicators are predicting a 90%+ chance of a 25 basis point cut in September.
The Fed's annual symposium kicks off this week, so we will see a lot of focus on the speeches given and how often the word "tariffs" are mentioned.
Pillars of the rally under attack
I read the Sevens Report every day. It is put together by a former floor trader at the NYSE and is designed for busy advisors to get a read on the what matters most to traders. The report is good at explaining the current tone of the markets. Several weeks ago the report laid out the 3 "Pillars" of the current rally that started when the President delayed his Liberation Day tariffs. Over the past 2 weeks, the pillars have all been called into question. These pillars were:
1.) Inflation returns to 2% Fed target
2.) Fed resumes rate cuts in September
3.) Strong corporate earnings growth extends into 2026
All of these are directly related to the CPI and PPI reports this week. Inflation is not trending towards 2%, which could lead the Fed to not resume rate cuts as well as eroding both profit margins and consumer spending. If you missed last week's blog or need a reminder of the risks in the market, I'd encourage you to check it out here:

We had a steady stream of clients (again) last week ask for ways to increase the returns in their accounts by moving into the hottest areas of the market (AI and crypto) or selling their income models to put more into our growth models. There's no clear indicator of when this type of euphoria marks the top, but I never see enthusiasm for investments at the bottom.
Market Charts
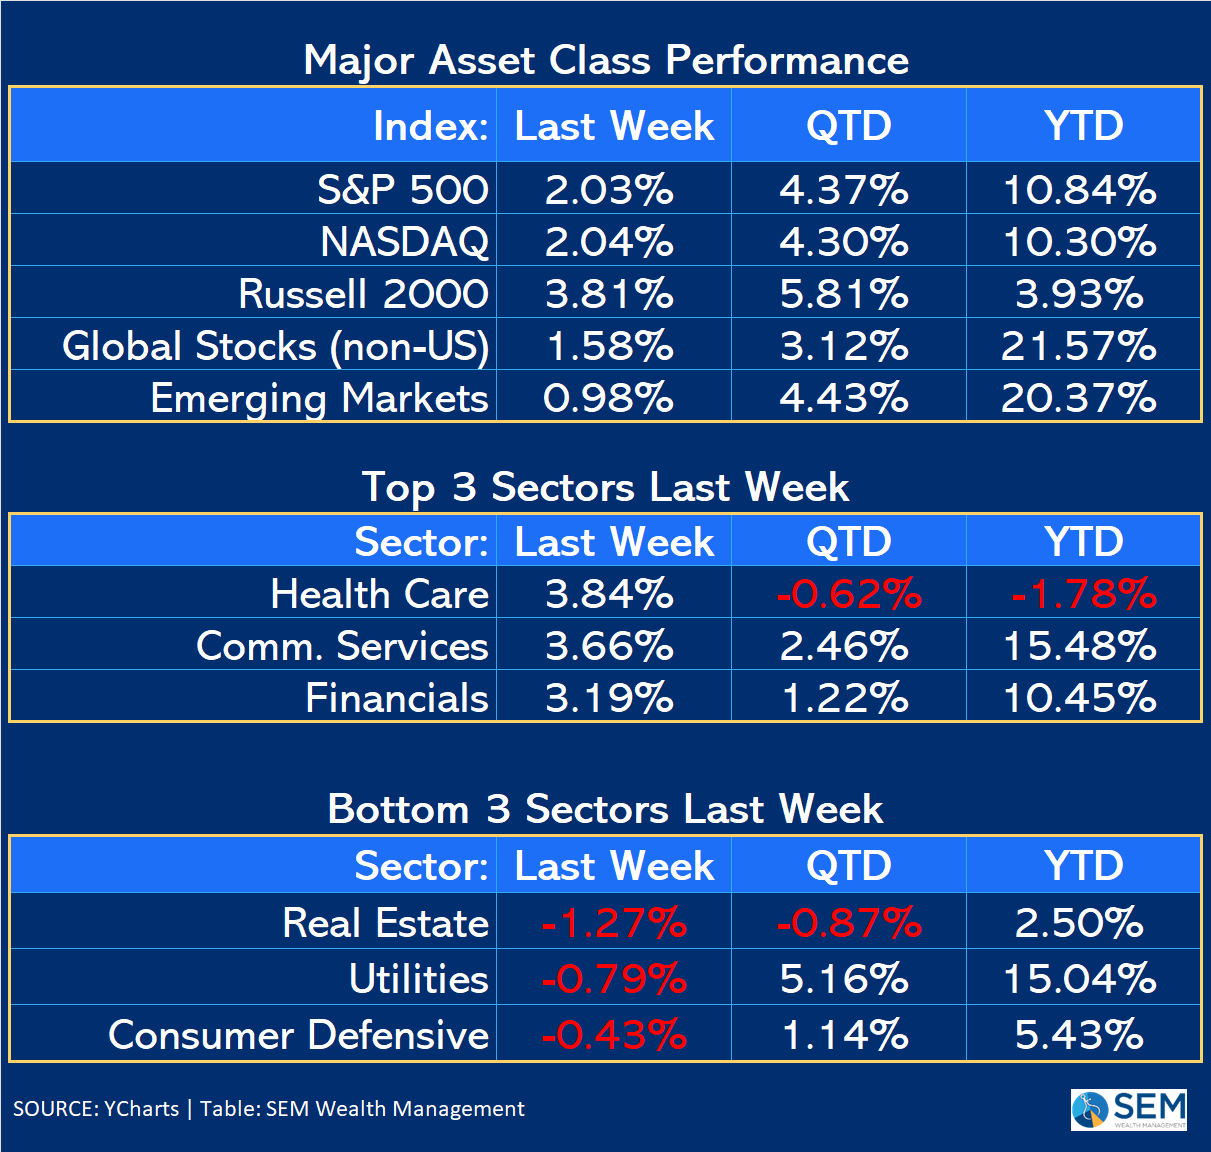
After the brief "growth" scare, the market shift to celebrating bad data (because it could lead to rate cuts) has stocks again marching forward at a steep rate.
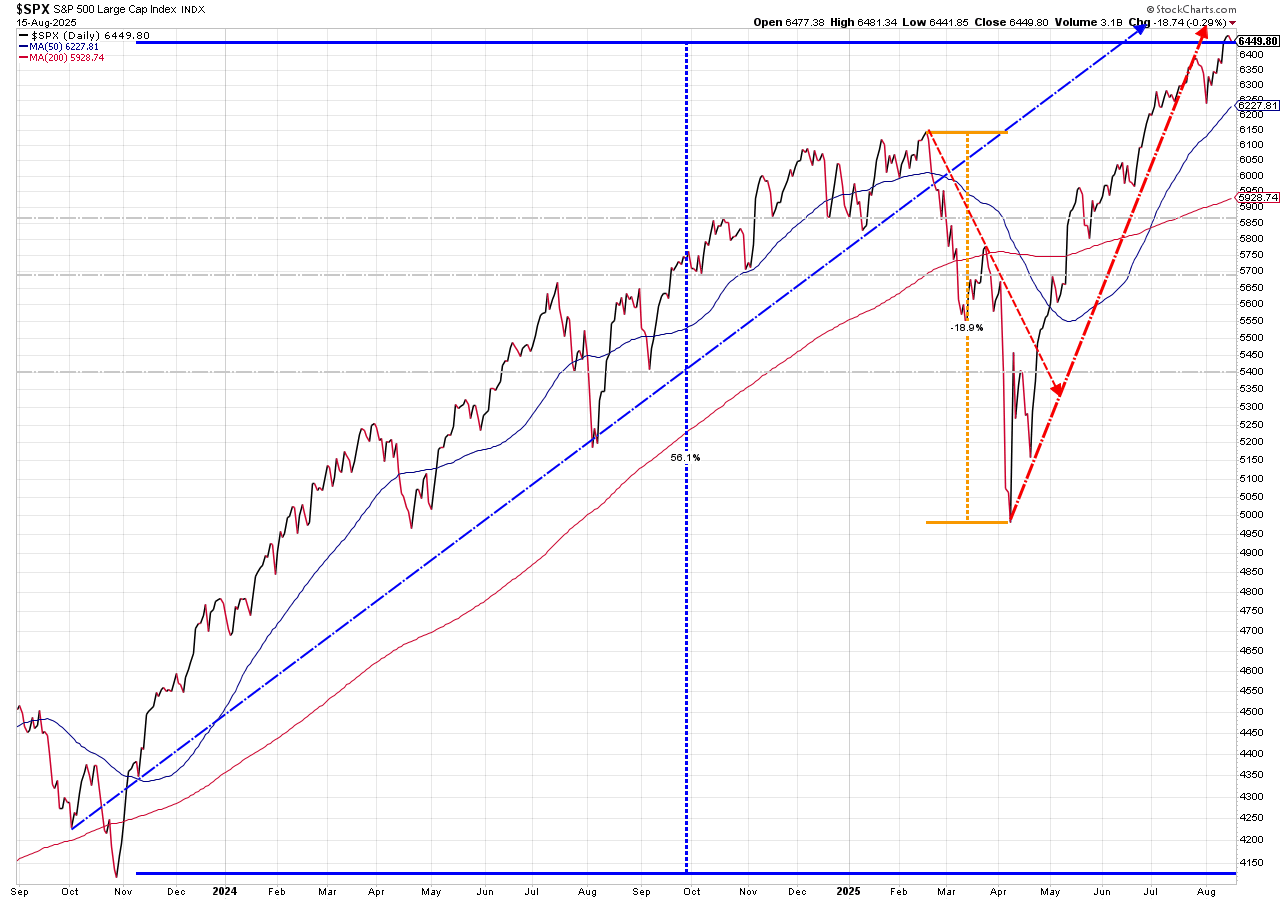
Momentum is a double-edged sword. When it's strong you don't want to fight it. When it ends, it can end swiftly and give back a big chunk of the recent losses before anyone even notices. When that happens is anyone's guess. For now, our tactical models (which rely on momentum indicators) remain cautiously optimistic (read: invested, but with a fairly quick trigger if things reverse).
SEM Market Positioning
| Model Style | Current Stance | Notes |
|---|---|---|
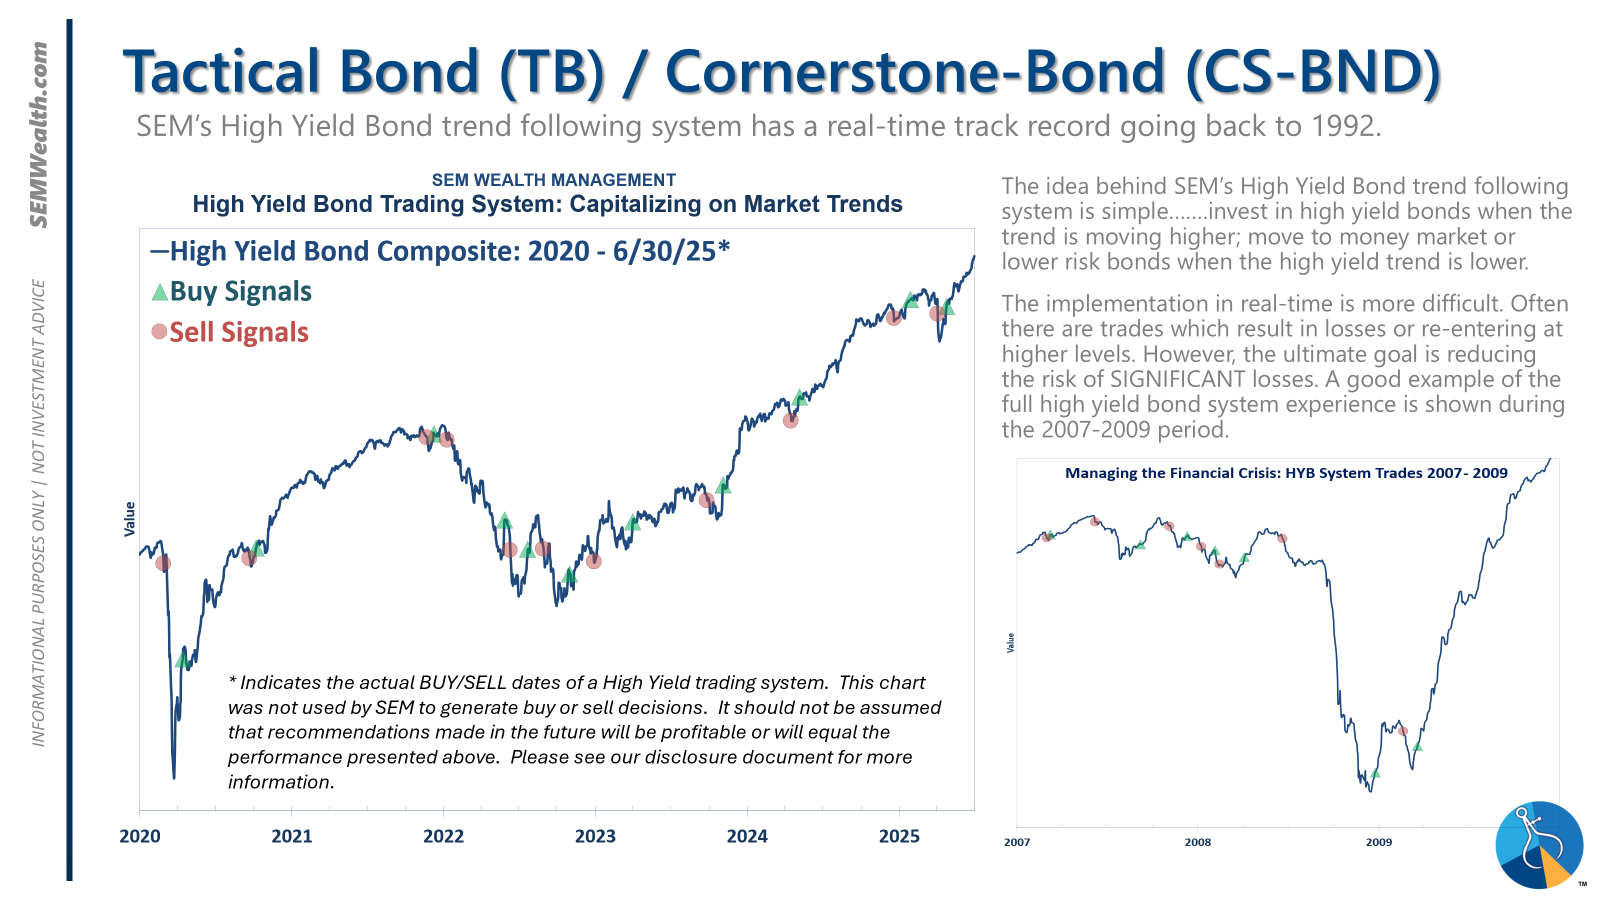
| Tactical | 100% high yield | High-yield spreads holding, but trend is slowing-watching closely |
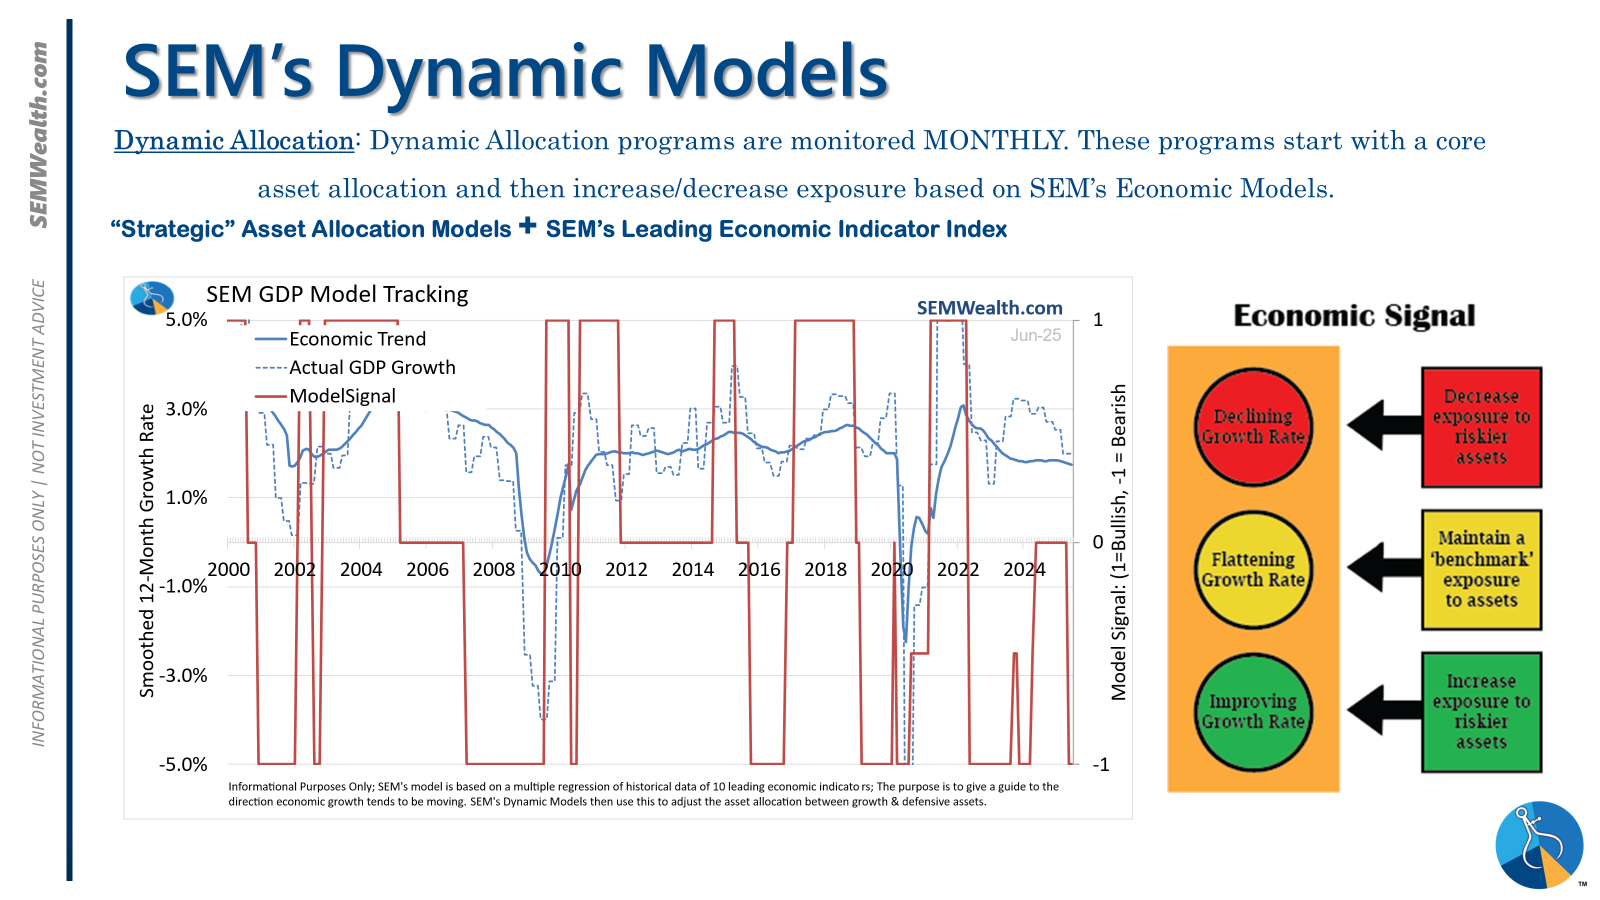
| Dynamic | Bearish | Economic model turned red – leaning defensive |
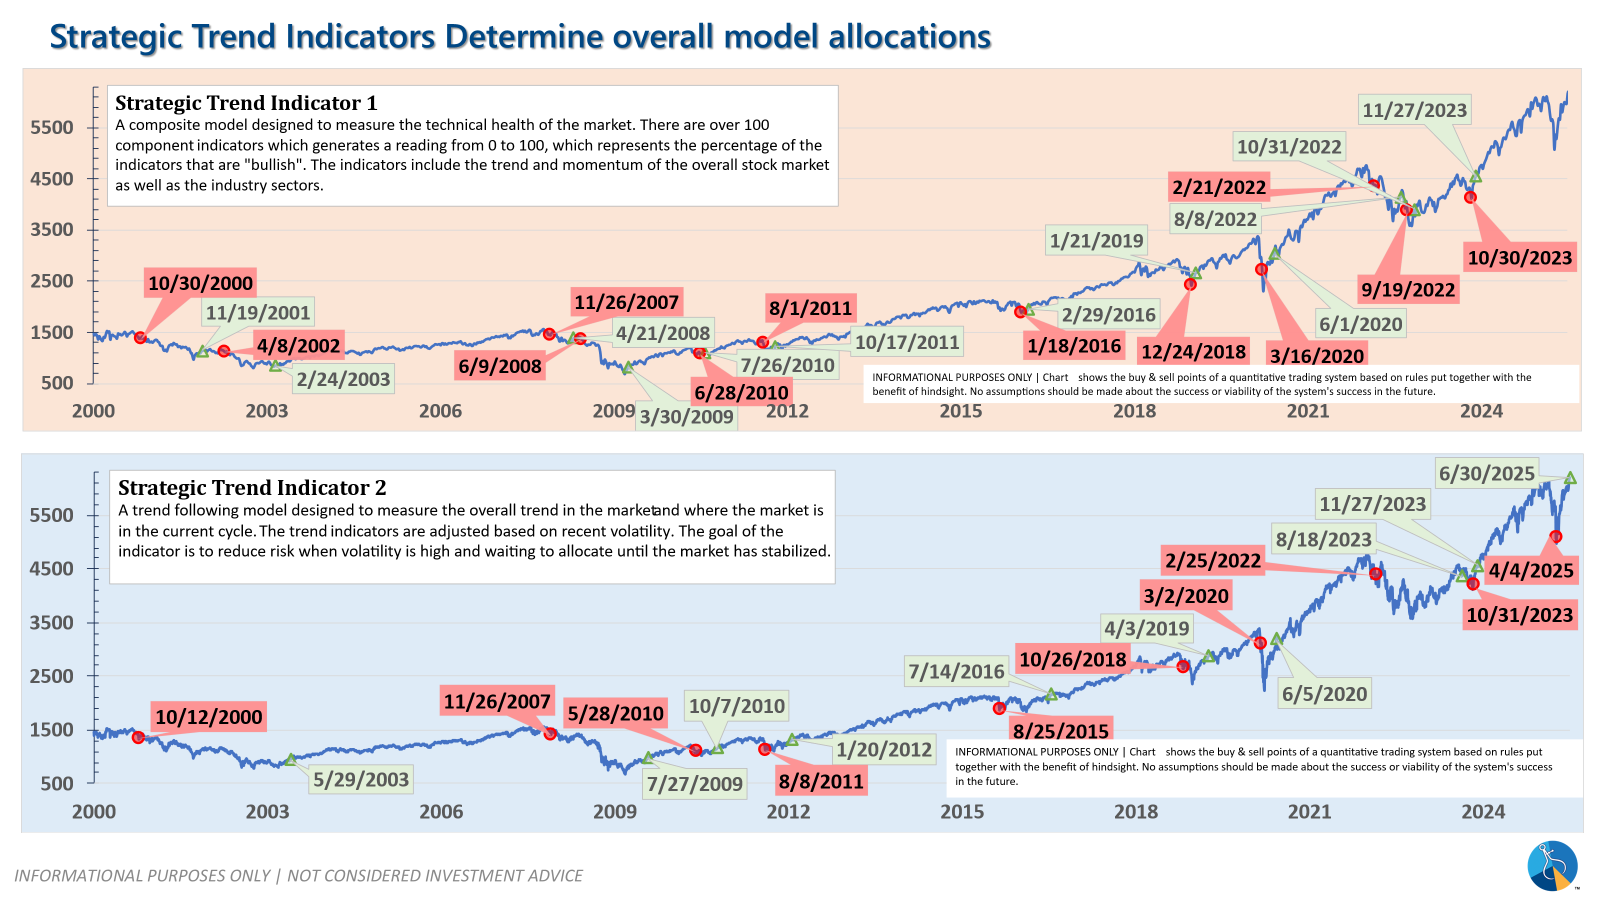
| Strategic | Slight under-weight | Trend overlay shaved 10 % equity in April -- added 5% back early July |
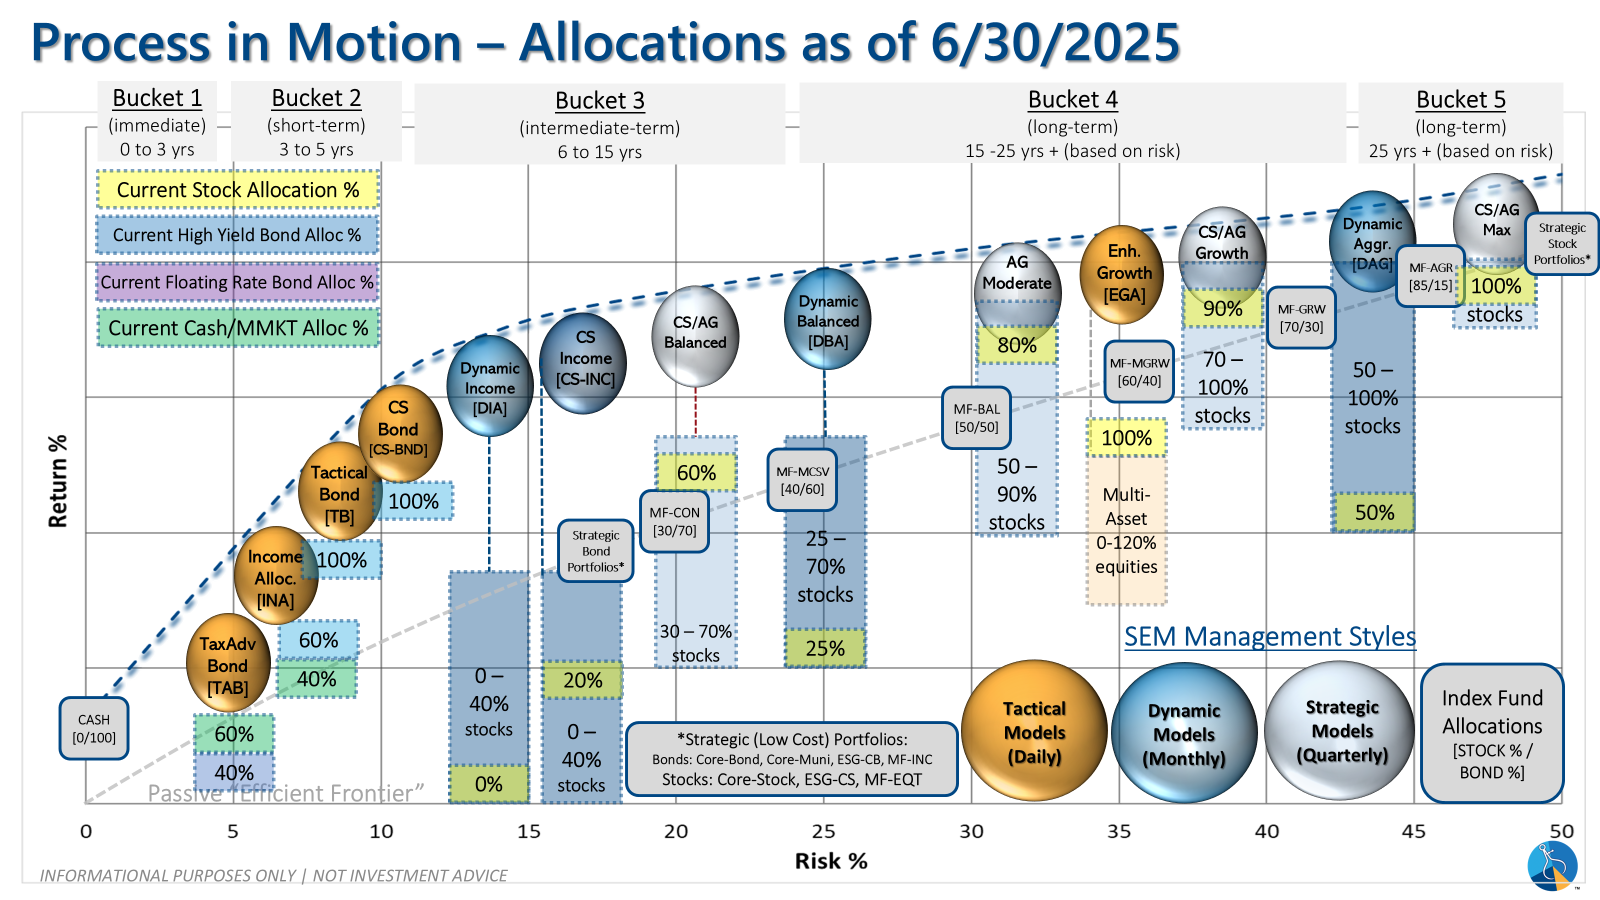
SEM deploys 3 distinct approaches – Tactical, Dynamic, and Strategic. These systems have been described as 'daily, monthly, quarterly' given how often they may make adjustments. Here is where they each stand.
Tactical (daily): The high yield system has been invested since 4/23/25 after a short time out of the market following the sell signal on 4/3/25.
Dynamic (monthly): The economic model went 'bearish' in June 2025 after being 'neutral' for 11 months. This means eliminating risky assets – sell the 20% dividend stocks in Dynamic Income and the 20% small cap stocks in Dynamic Aggressive Growth. The interest rate model is 'neutral' meaning low duration/money market investments for the bulk of the bonds.
Strategic (quarterly)*: One Trend System sold on 4/4/2025; Re-entered on 6/30/2025
The core rotation is adjusted quarterly. On August 17 it rotated out of mid-cap growth and into small cap value. It also sold some large cap value to buy some large cap blend and growth. The large cap purchases were in actively managed funds with more diversification than the S&P 500 (banking on the market broadening out beyond the top 5-10 stocks.) On January 8 it rotated completely out of small cap value and mid-cap growth to purchase another broad (more diversified) large cap blend fund along with a Dividend Growth fund.
The * in quarterly is for the trend models. These models are watched daily but they trade infrequently based on readings of where each believe we are in the cycle. The trend systems can be susceptible to "whipsaws" as we saw with the recent sell and buy signals at the end of October and November. The goal of the systems is to miss major downturns in the market. Risks are high when the market has been stampeding higher as it has for most of 2023. This means sometimes selling too soon. As we saw with the recent trade, the systems can quickly reverse if they are wrong.
Overall, this is how our various models stack up based on the last allocation change:
Curious if your current investment allocation aligns with your overall objectives and risk tolerance? Take our risk questionnaire


