
Last week was a reminder of just how interconnected our social, economic, and market cycles have become. From tragic headlines and the somber anniversary of 9/11 to major shifts in the labor market and jaw-dropping news out of the tech sector, investors were left to sort through a flood of data and emotion. As we move deeper into the “crisis” phase of the social cycle, it’s more important than ever to stay focused on risk management, tune out the noise, and keep an eye on the signals that matter. This week, we break down what happened, what it means for your portfolio, and what to watch as the Fed and Wall Street gear up for another pivotal stretch.
The Tragedy of the Social Cycle
Last week was a tough week with multiple shootings occurring the week of the 24th anniversary of 9/11. I try to keep this blog focused on just economics and investments, but it is not always easy. I've discussed our social cycle numerous times over the past 15 years. We are in the midst of the "crisis" phase where things get ugly and it looks like we are tearing ourselves apart from the inside. This is a sad, but necessary thing that happens about every 80-90 years. It doesn't mean we need to just accept senseless murders, but in the bigger picture the inner driven period of the 80s & 90s led to some disconnects in the 2000s that are now unraveling in the 2010s and 2020s.
I discuss some of that in our annual 9/11 post, which you can read here.

It won't always be a "one-time event" that marks the beginning of the end (and historically the messiest and most costly part of the "Crisis" phase, but rather a series of events that when we look back on them seemed inevitable, but in the heat of the moment just seemed like another one-time event. This is one reason we are so focused on the data and risk-management models which when combined with the overall financial plan, cash flow strategy, and personality of the client allows us to help manage the unknown, no matter how bad it gets.
"Sticky Inflation" / Weakening Labor Market
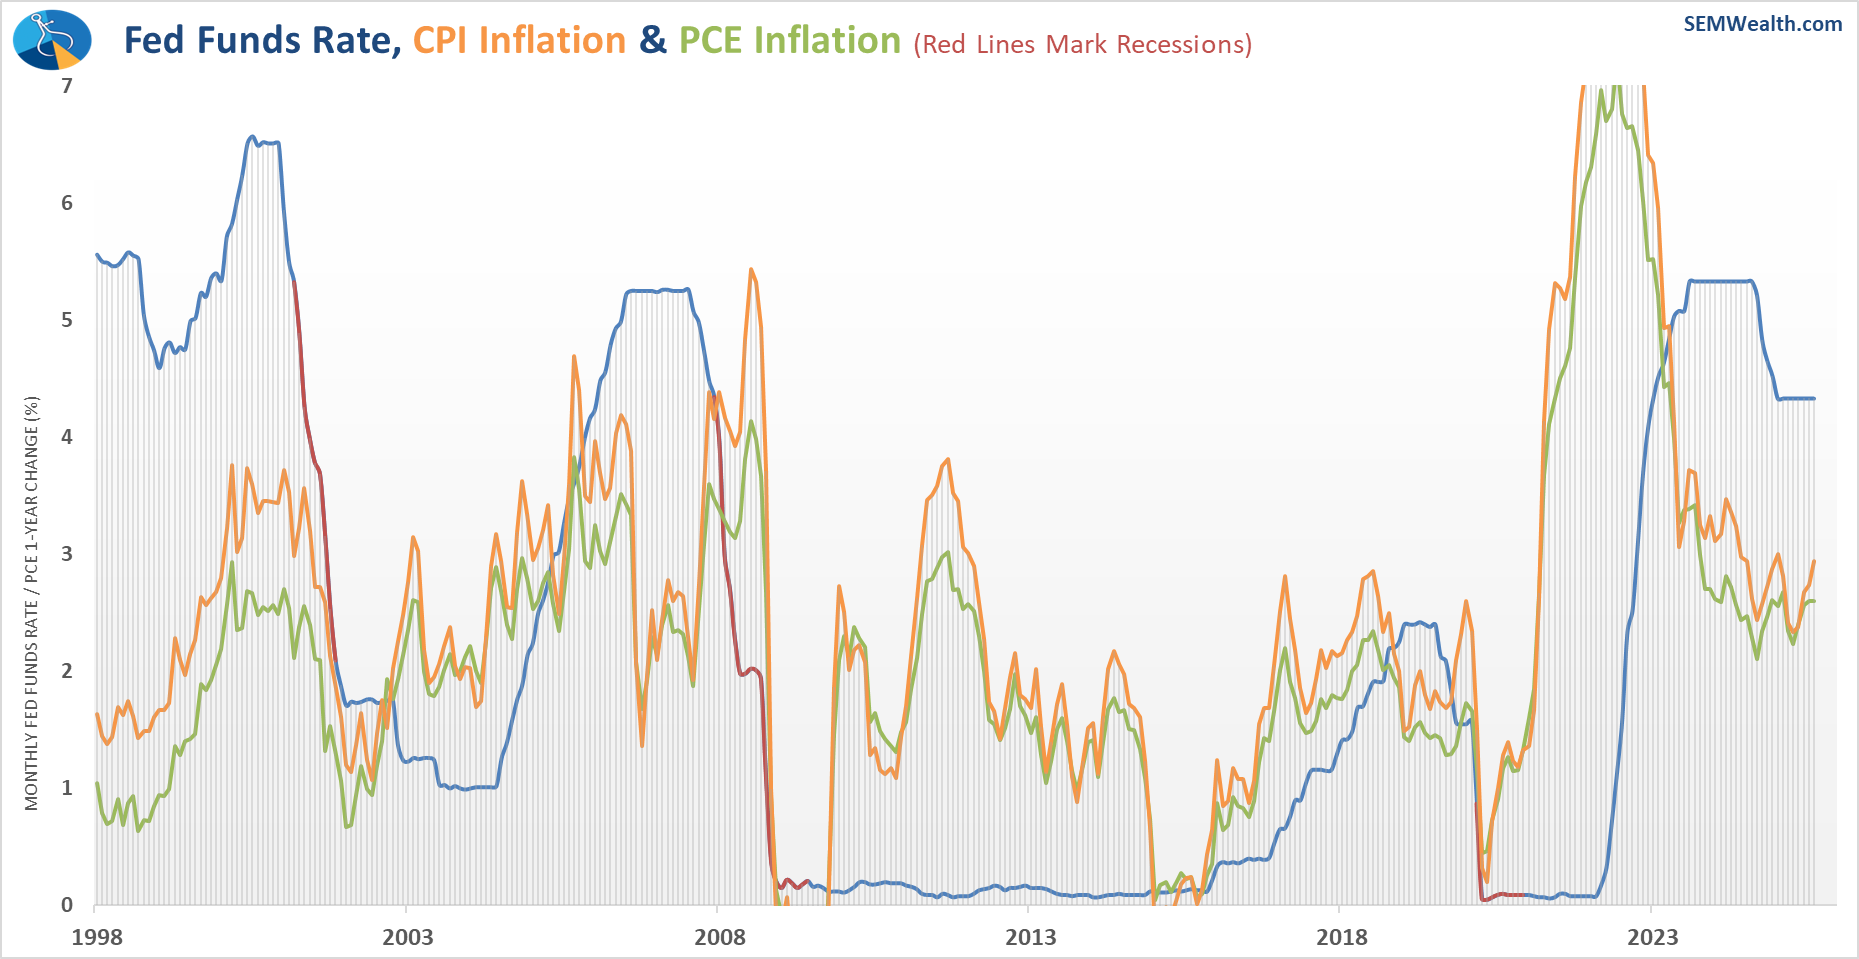
The market has pretty much decided (thanks to some Fed messaging at Jackson Hole) that the bump in inflation is "temporary" or a "one-time" tariff related event and the Fed will accept higher inflation. They better hope they are right or we could again be dealing with an inflationary driven recession.
The Fed's bigger concern comes from the labor market. I've been saying since late spring, "if you lose your job, you're having a hard time finding a new one". Not a lot of layoffs were occurring, but that changed last week as Initial Jobless Claims jumped to the highest level since 2021.
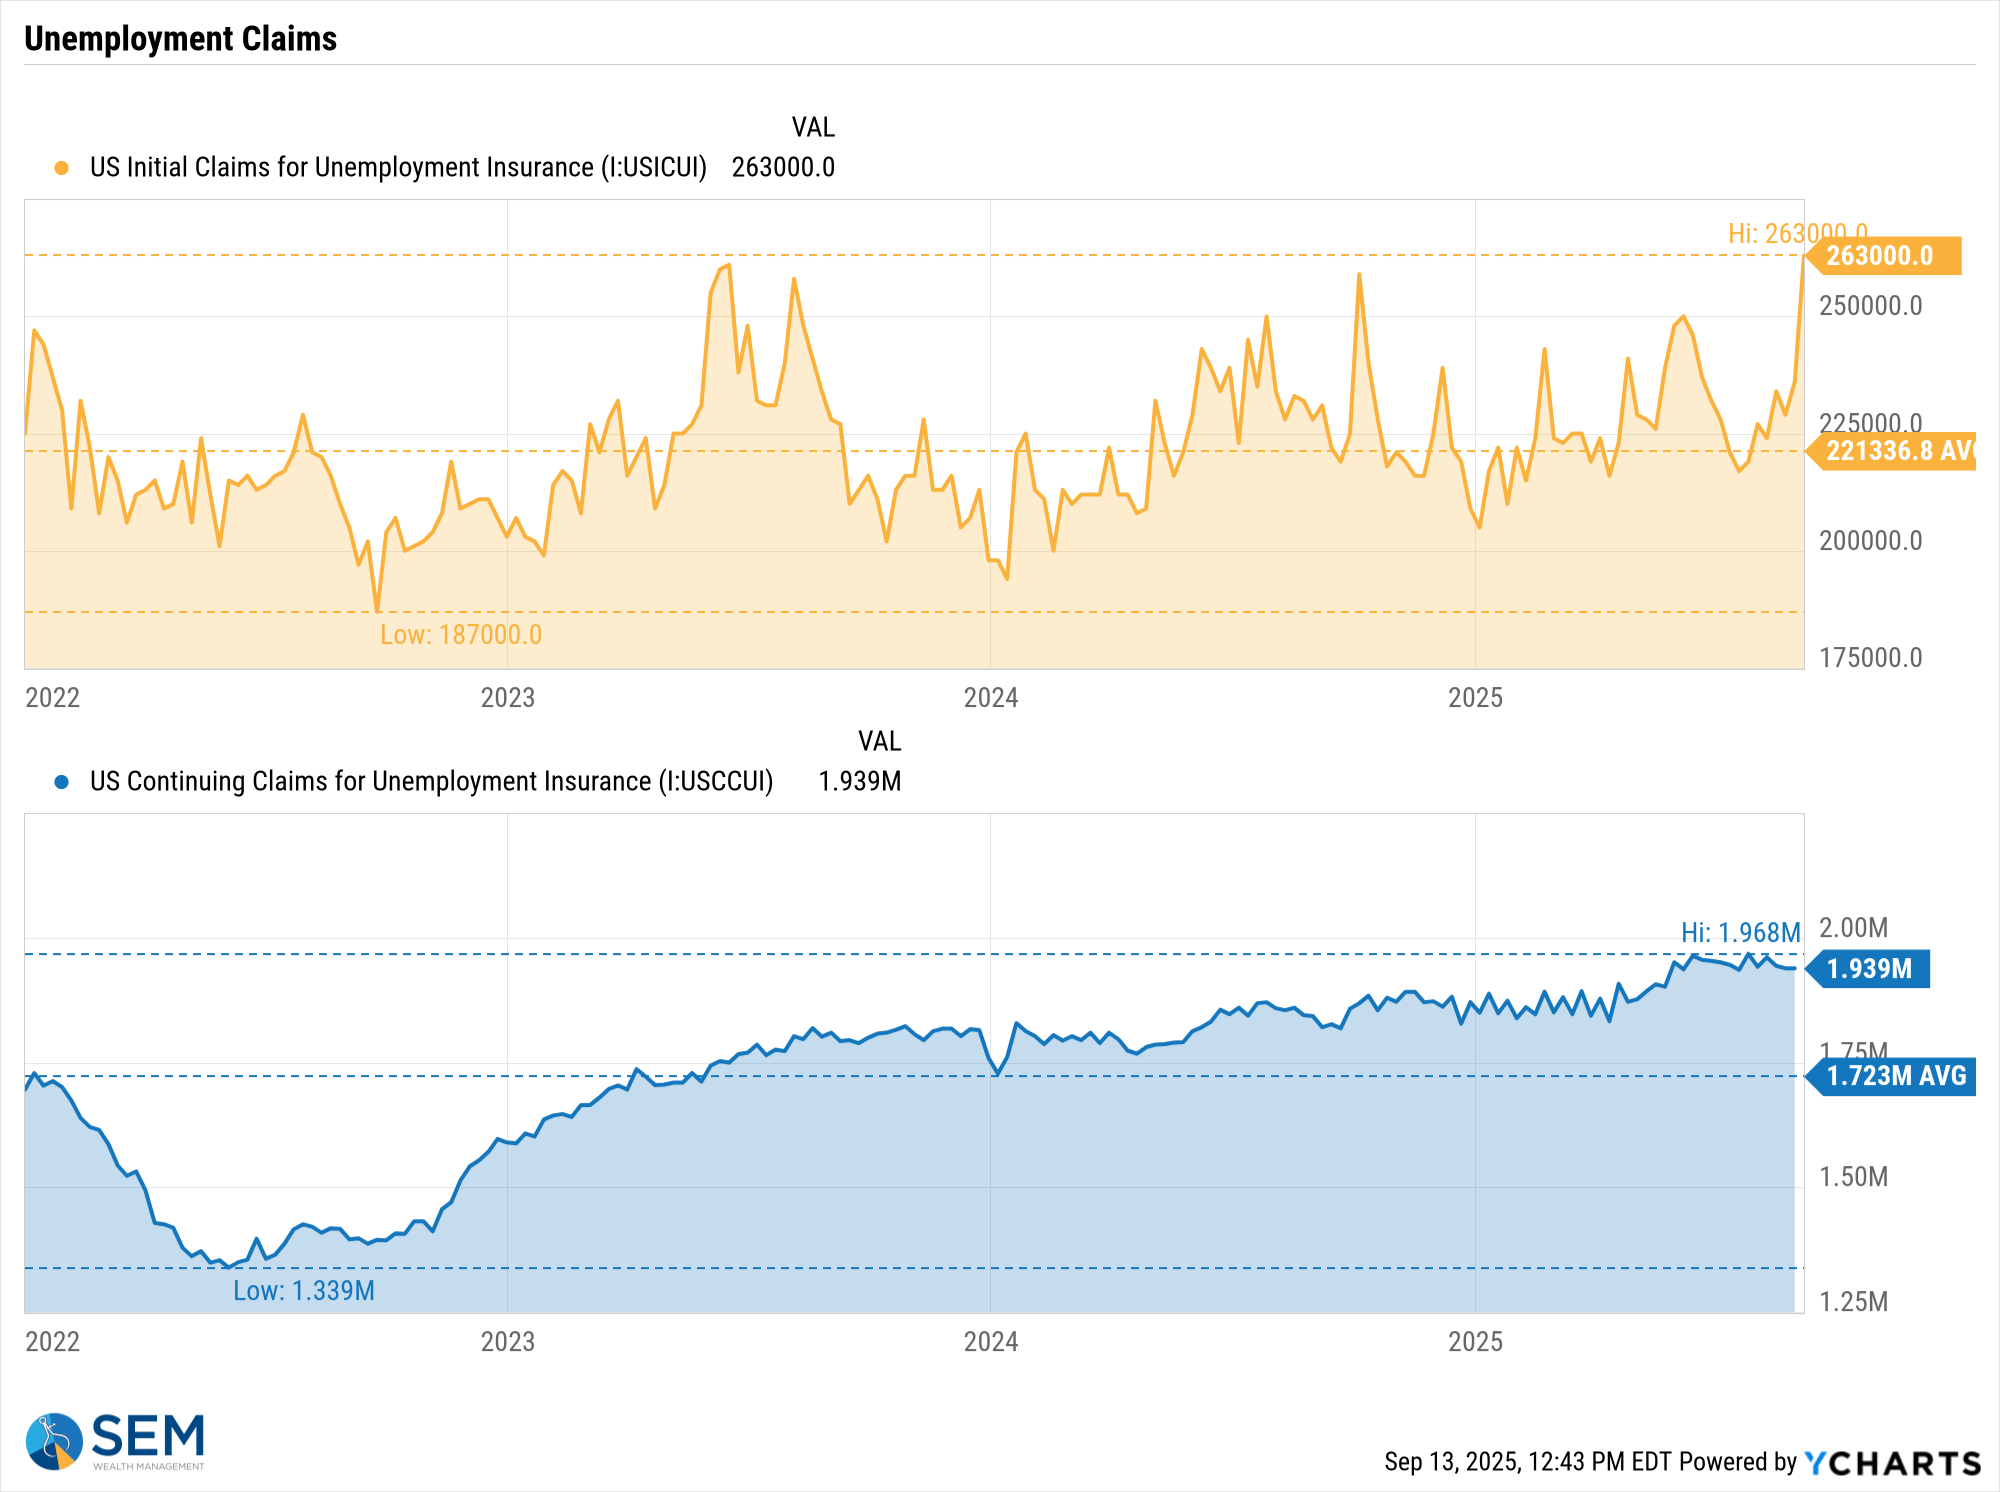
A lot was made about the BLS annual revision where nearly a million jobs were removed from the data reported over the past year. One reason we like the unemployment claims data is it is both more timely (received each week) and the result of all 50 states sending in their actual unemployment data to be compiled into the national number.
The downward revision was largely due to flaws in the BLS birth-death model (talking about birth & death of new businesses, not people in the labor force), which struggles to account for the surge in new business formations that may not survive or hire as expected. Many small businesses don’t report payrolls immediately, especially if they fall below IRS thresholds for quarterly Form 941 filings. This delay can skew employment data. Notably, employers with fewer than 100 employees account for over 32% of private-sector jobs, with a significant portion held by firms with fewer than 50 employees—making accurate tracking even more challenging. With this, the BLS's statistical models utilize past data to guestimate how many jobs were added or removed from the small business sector. Those models could be skewed by shocks such as the financial crisis and pandemic, which makes them susceptible to being off by large numbers.
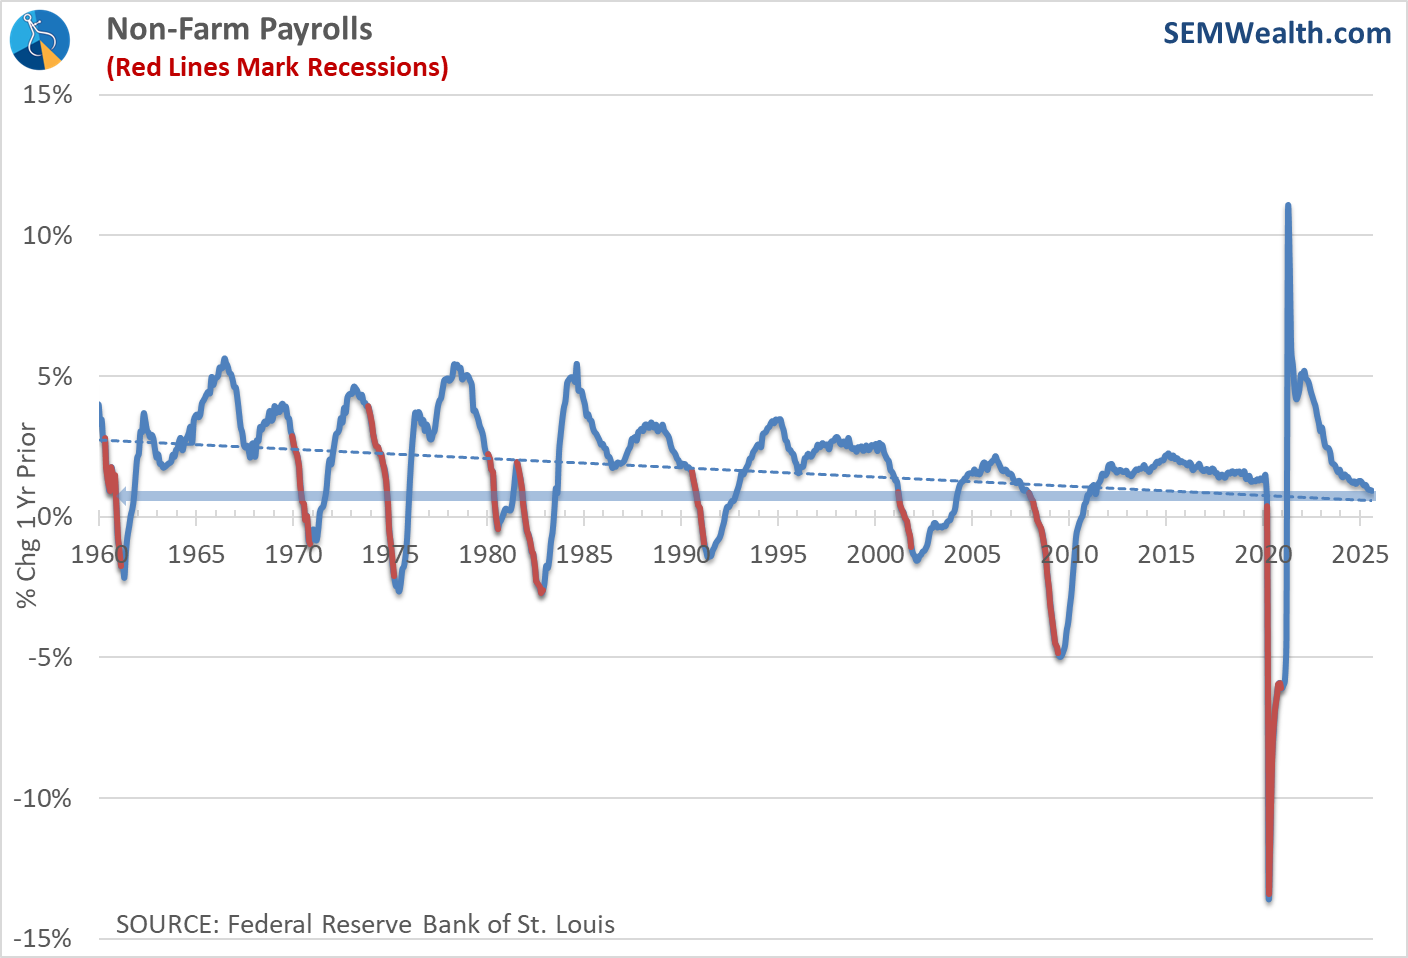
Regardless, the messaging from the data has not changed. The labor market is at stall speed. One thing I love about the FRED (Federal Reserve Economic Database) Excel plugin is whenever data is revised, it will automatically update the data in our economic model. Prior to 2001 I used to have to rekey in the data. Here is the updated payrolls chart. Note that historically whenever we'd been below a 1% annual increase in jobs we were either already in a recession, or heading that way.
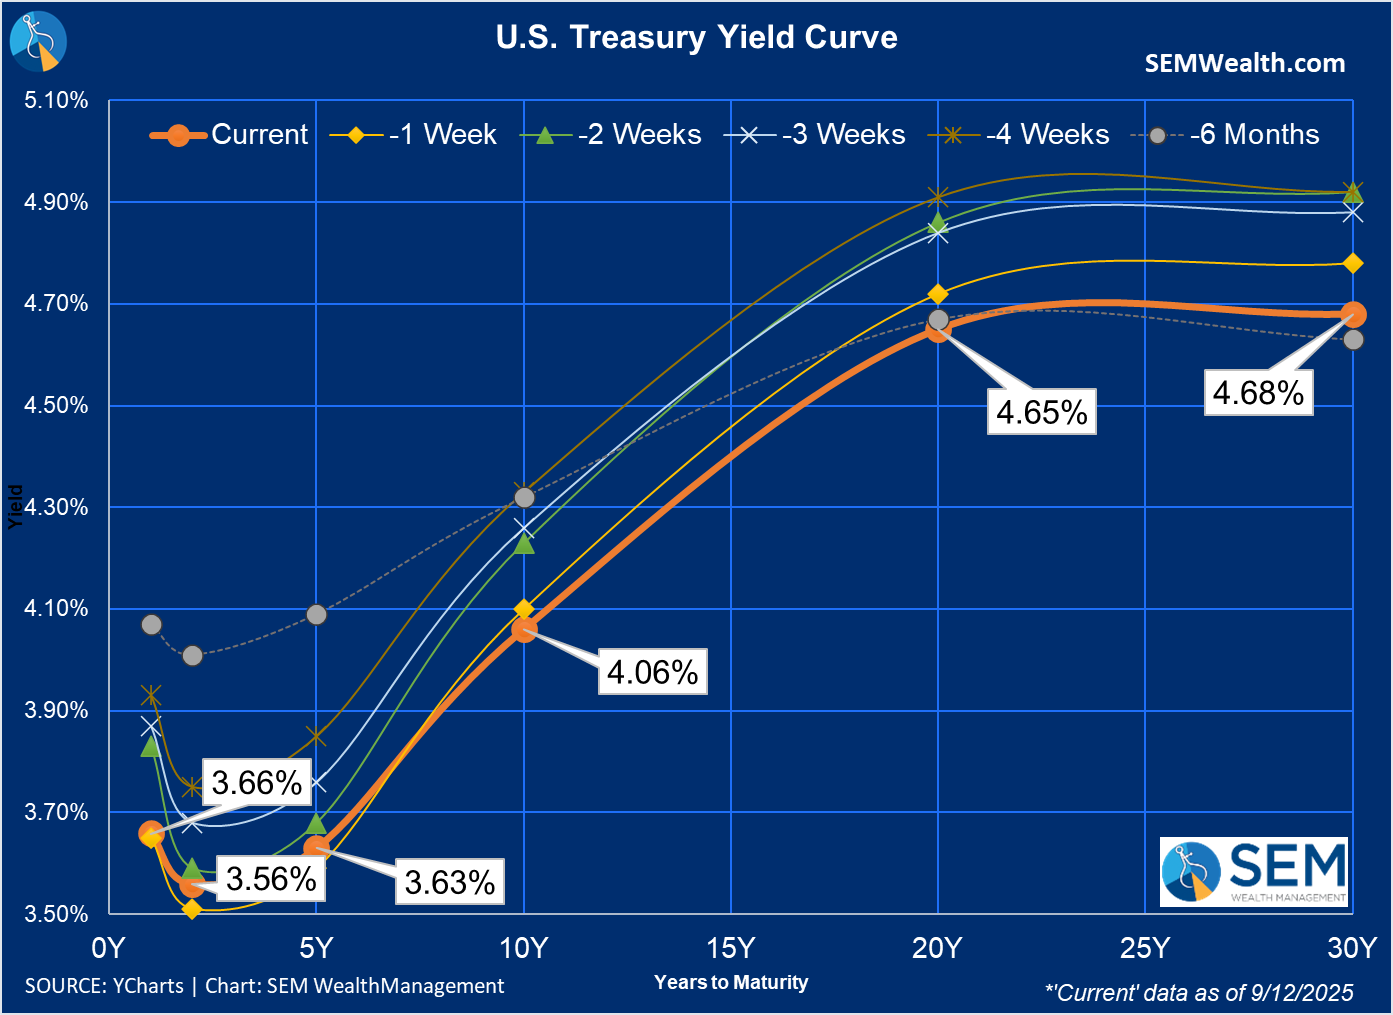
The biggest move on the updated jobs data came from longer-term bonds with the 10-year flirting with a 3 handle on Thursday before rising a bit on Friday. In the eyes of the bond market – a weaker labor market means less inflationary pressure, which allows yields to decline. The question of course is whether a drop in rates is enough to spark jobs growth.
Oracle's Staggering Backlog
Probably the biggest news (in my opinion) came from Momentum Stock Model holding Oracle. Oracle’s earnings weren’t impressive on the surface—revenue and profits came in light—but the real story was buried in the backlog. Their cloud services backlog jumped by $455 billion year-over-year, a 359% increase that stunned Wall Street. That kind of growth doesn’t happen unless the biggest players in tech are spending aggressively, and it’s clear they are.
The most staggering detail? OpenAI signed a $300 billion, five-year cloud infrastructure deal with Oracle, committing to spend $60 billion per year. That’s six times OpenAI’s estimated $10 billion in annual revenue—a math problem that raises eyebrows. Oracle also landed multi-billion-dollar contracts with Microsoft, Nvidia, and Google, all racing to scale AI workloads.
Oracle’s multi-cloud revenue surged over 1,500%, and the company now projects cloud infrastructure revenue to grow from $18 billion this year to $144 billion by 2030. This kind of capex is lifting everything from semiconductors to data centers, copper, and electricity demand. In short, AI spending is acting like a stimulus package for the tech sector.
Oracle’s stock jumped 35% for the week, following its best single-day performance since 1992. That rally helped Larry Ellison leapfrog Elon Musk to become the richest person on earth, with a net worth of $393 billion.
While everyone was picking their jaws off the floor to celebrate, there is certainly risk here. The market is pricing in rapid adoption and real-world utility from AI. If that doesn’t materialize quickly, the unwind could be brutal—especially for the Mag 7 and the S&P 500, which are heavily exposed.
Bottom line: Oracle’s report is a reminder that AI is driving the narrative, but it’s also raising the stakes. The real question is: how will companies like OpenAI, Microsoft, Google, & Amazon turn this massive investment into actual revenue and earnings? If consumers and small businesses continue to struggle, the disconnect between spending and returns could roil the market.
Impressive Growth is Expected
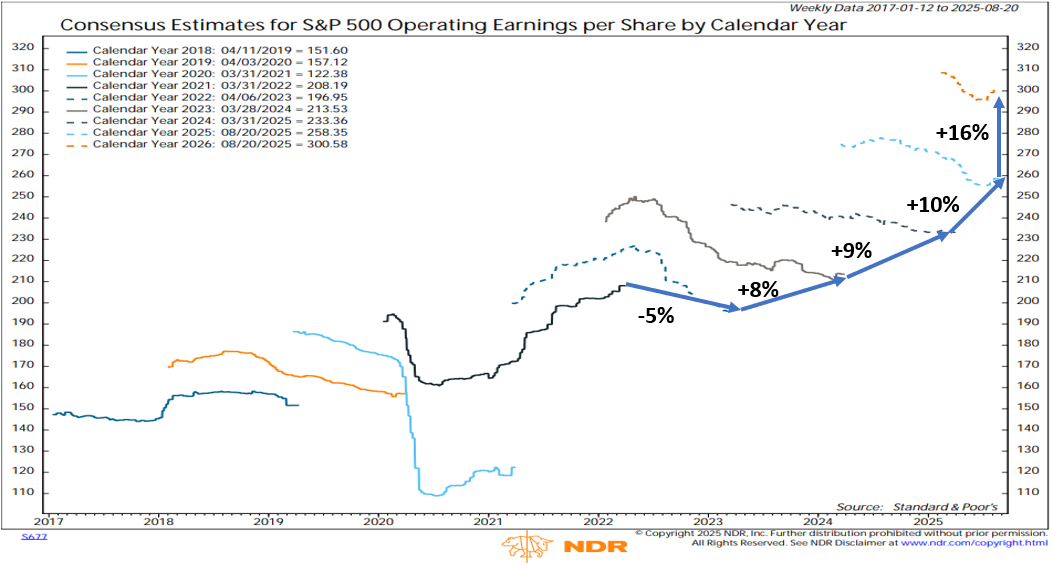
While Oracle "shocked" everyone with their backlog numbers, the market is already pricing in S&P 500 earnings growth that will be nothing short of spectacular in 2026. I included this chart in last week's discussion on valuations, but I think it's important to note the very high risk-reward game investors are playing right now. Given what we are seeing in the overall economy, will a cut in rates allow US companies to post 16% earnings growth (the long-term average is around 10%)? If so, it will be a great 12 months for stocks. If not, the correction could be sharp and go much further than 2022's relatively mild decline.
Read the full post here:
The mix of social unrest, economic uncertainty, and rapid technological change means investors can’t afford to get complacent. The headlines may be unsettling, but our focus remains on the data, disciplined risk management, and adapting to whatever comes next. With the Fed’s policy meeting and a full slate of economic releases on deck, this week could set the tone for the rest of the quarter. Stay tuned, stay flexible, and remember: in times like these, preparation and perspective are your best assets.
🗓️ Weekly Economic Calendar: September 15–19, 2025
Markets are bracing for a pivotal week as the Federal Reserve convenes for its September policy meeting. With expectations of a rate cut looming, investors will be closely watching both the Fed’s decision and a series of high-impact data releases that could shape the economic outlook heading into Q4. Here's a day-by-day breakdown of what to watch:
📅 Monday, September 15
- Empire State Manufacturing Index (Sep) – 8:30 AM ET
- SCE Household Spending Survey – 11:00 AM ET
📅 Tuesday, September 16
- ICSC Weekly Retail Sales – 7:45 AM ET
- Retail Sales (Aug) – 8:30 AM ET
- Import/Export Prices (Aug) – 8:30 AM ET
- Industrial Production & Capacity Utilization (Aug) – 9:15 AM ET
- Business Inventories (Jul) – 10:00 AM ET
- NAHB Housing Market Index (Sep) – 10:00 AM ET
- FOMC Meeting Begins
📅 Wednesday, September 17
- MBA Mortgage Applications – 7:00 AM ET
- Housing Starts & Building Permits (Aug) – 8:30 AM ET
- DOE Weekly Inventory Data – 10:30 AM ET
- FOMC Policy Decision – 2:00 PM ET
- Fed Press Conference – Following the statement
📅 Thursday, September 18
- Weekly Jobless Claims – 8:30 AM ET
- Philadelphia Fed Manufacturing Index (Sep) – 8:30 AM ET
- Leading Economic Index (Aug) – 10:00 AM ET
- EIA Natural Gas Inventory – 10:30 AM ET
- Net Long-term TIC Flows (Jul) – 4:00 PM ET
📅 Friday, September 19
- NY Fed DSGE Model Release – 9:00 AM ET
- Reserve Demand Elasticity Report – 10:00 AM ET
- NY Fed Staff Nowcast – 11:45 AM ET
- Baker Hughes Rig Count – 1:00 PM ET
💼 Key Earnings Releases: September 15–19, 2025
As markets digest macroeconomic signals and await the Fed’s rate decision, corporate earnings will offer another layer of insight into sector performance and consumer trends. I don't see any market moving earnings on the calendar. Here's a summary by industry.
🔍 Industries Reporting Earnings:
- Consumer Staples – e.g., General Mills
- Restaurants & Hospitality – e.g., Darden Restaurants, Cracker Barrel
- Transportation & Logistics – e.g., FedEx
- Homebuilding & Real Estate – e.g., Lennar Corp
- Financial & Market Data Services – e.g., FactSet Research
- Retail & Entertainment – e.g., Dave & Buster’s
- Healthcare & Biotech – e.g., Nutex Health, Nanobiotix
- Energy & Utilities – e.g., Evolution Petroleum
- Technology & Industrial Services – e.g., Flux Power, ADS-TEC Energy
- Logistics & Supply Chain – e.g., Radiant Logistics
Toby's Take
(a weekly summary of WSJ articles our intern Toby found interesting)
9/8/2025: Oil Tycoons Bet Big on Trump. It’s Paying Off. - WSJ
Oil company heads are getting their benefits for supporting President Trump's campaign. The Trump administration is opening lots of wilderness land and federal waters to drilling for these different companies to take advantage of. Because of this we need to watch two spectrums of stocks: The benefiting oil/energy companies and the environmental companies. The oil companies may no longer fall under our biblically responsible models depending on their other corporate activities.
9/9/2025: Exclusive | OpenAI Executives Rattled by Campaigns to Derail For-Profit Restructuring - WSJ
OpenAI is still making efforts to turn their Non-Profit into a For-Profit and are hitting big walls of different campaigns against them. Their backup plan is to just move the company out of California, which would prove difficult because their AI researchers are mostly in the San Francisco area. If OpenAI can work their way to become a For-Profit company, they are likely to also become publicly traded giving us an opportunity to get into the rapidly growing company, diversifying accounts even more and reaching more potential growth for those wanting high risk investments.
9/10/2025: Meta’s Elite AI Unit Sparks Tension With Old Guard - WSJ
Meta and other companies competing to grow AI are facing a great struggle of finding talent and keeping them. AI researchers are such a sought after job right now that some companies are offering bonuses that have reached millions of dollars. Hiring an AI researcher is a huge expense even for Meta which is valued at $2 trillion. The opposite side of this all is also difficult because long time employees and higher ups are seeing these newcomers get amazing benefits and bonuses causing uproar within the company making it difficult for Meta to keep everybody happy, but also continue to grow with the trend. This could all prove to cause a drop in Meta stock meaning we really need to keep an eye on the tech holdings.
9/11/2025: Israel Is Straining Its Hard-Won Ties in the Gulf - WSJ
Israel sent a strike on a building believed to have Hamas members in it. The building was located in Qatar, a country protected by the United States. President Trump said that he is very regretful that it happened in Qatar, but said that killing Hamas members is a worthy goal. This continues to be interesting for the Patriot Portfolio or any models with defense contractors in them.
Market Charts
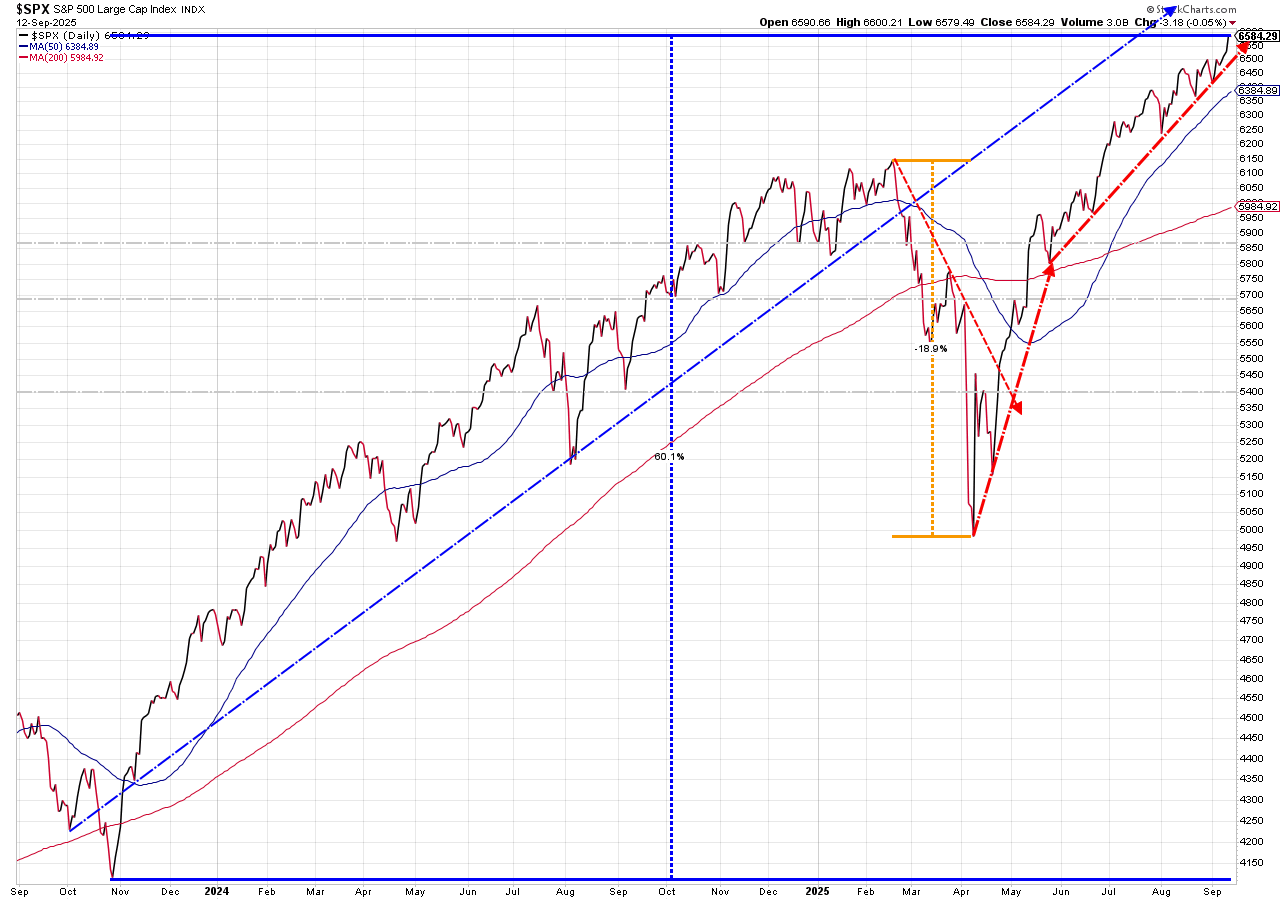
It was another "4 out of 5" week for the S&P 500 where it rose all but one day.
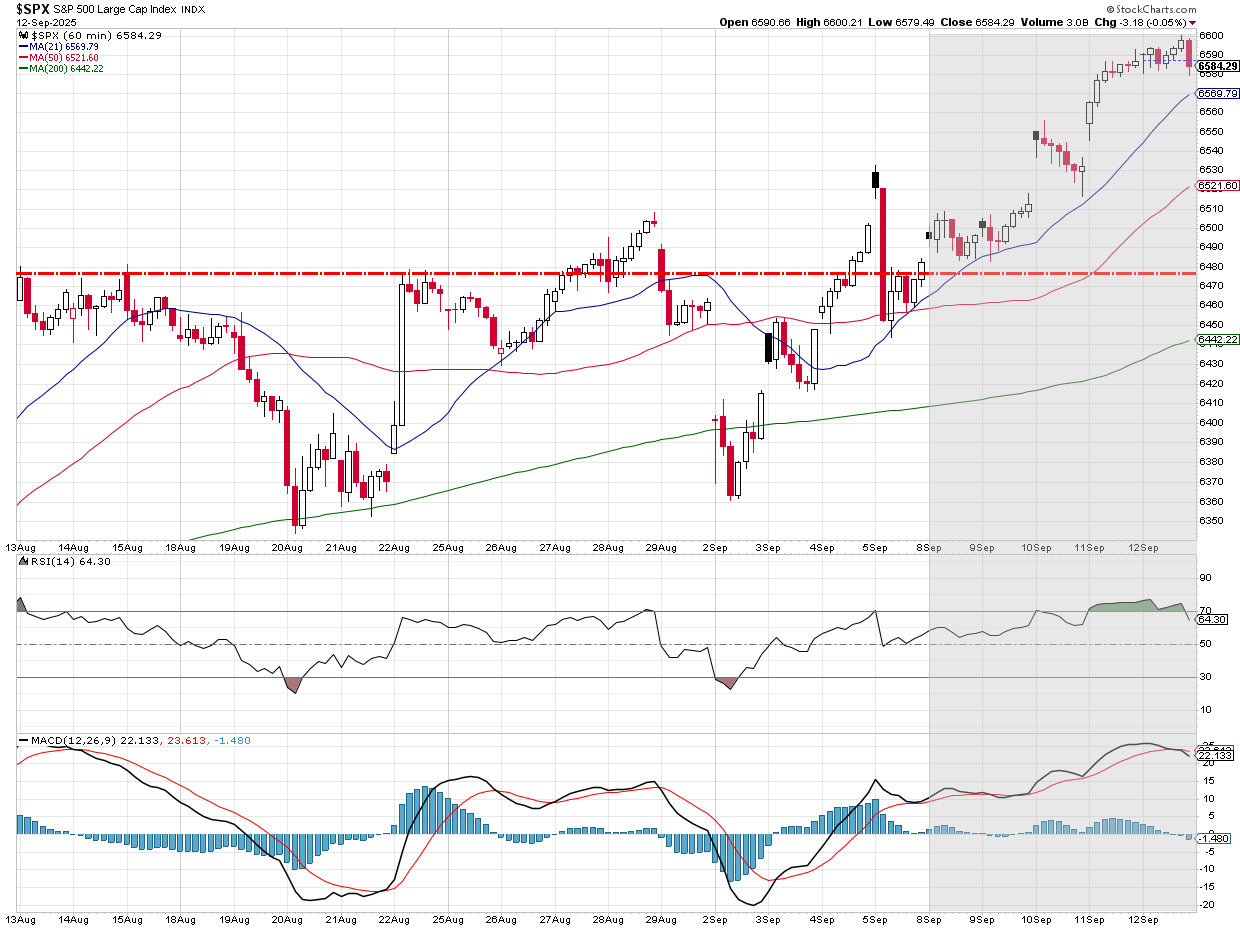
The trend remains up for the S&P 500, which could lull everyone to a false sense of security. Like anything in life – the longer things are going well, the less focused we become, which makes the inevitable reversal that much more "surprising" and often leads to emotional (over) reactions.
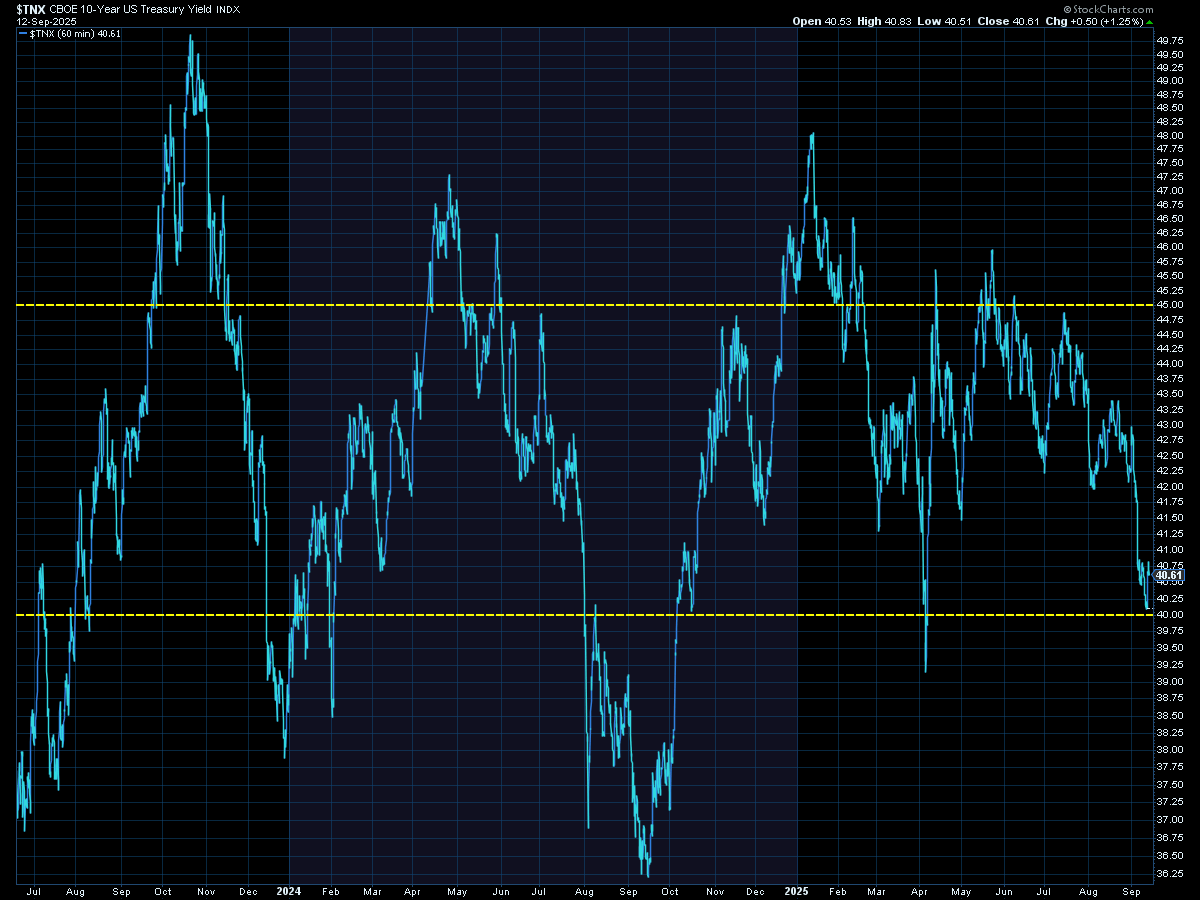
Bonds will tell the more interesting story this week. I've been showing the 20 year chart of bond yields. Here's a shorter look. A move below 4% could see long-term yields moving down to the 3.6% range we hit a year ago.
SEM Market Positioning
| Model Style | Current Stance | Notes |
|---|---|---|
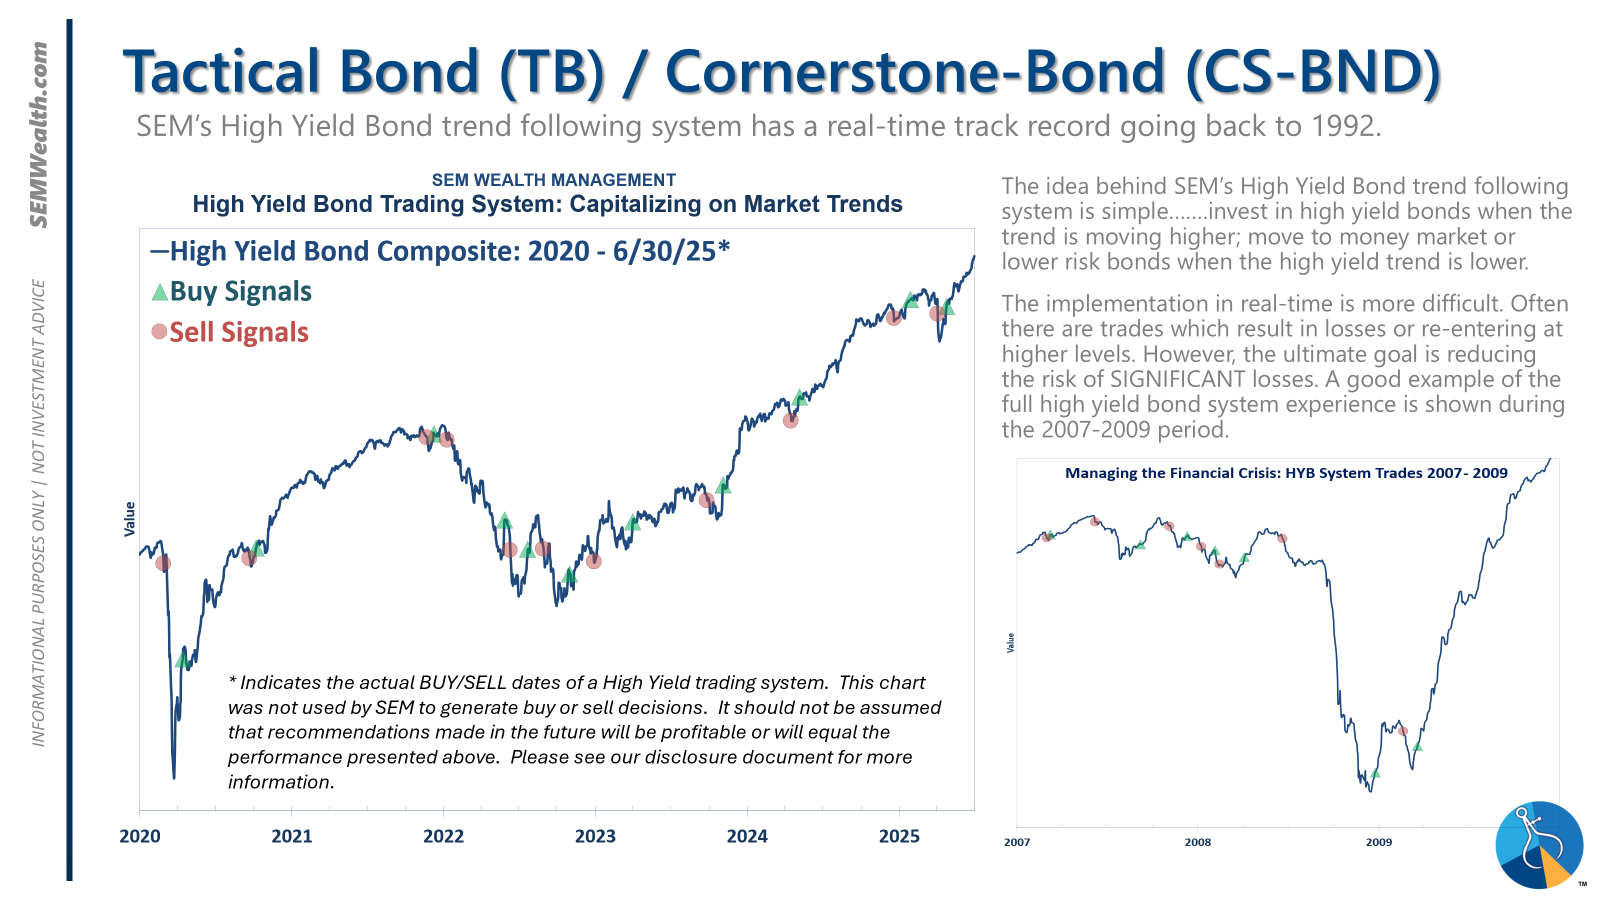
| Tactical | 100% high yield | High-yield spreads holding, but trend is slowing-watching closely |
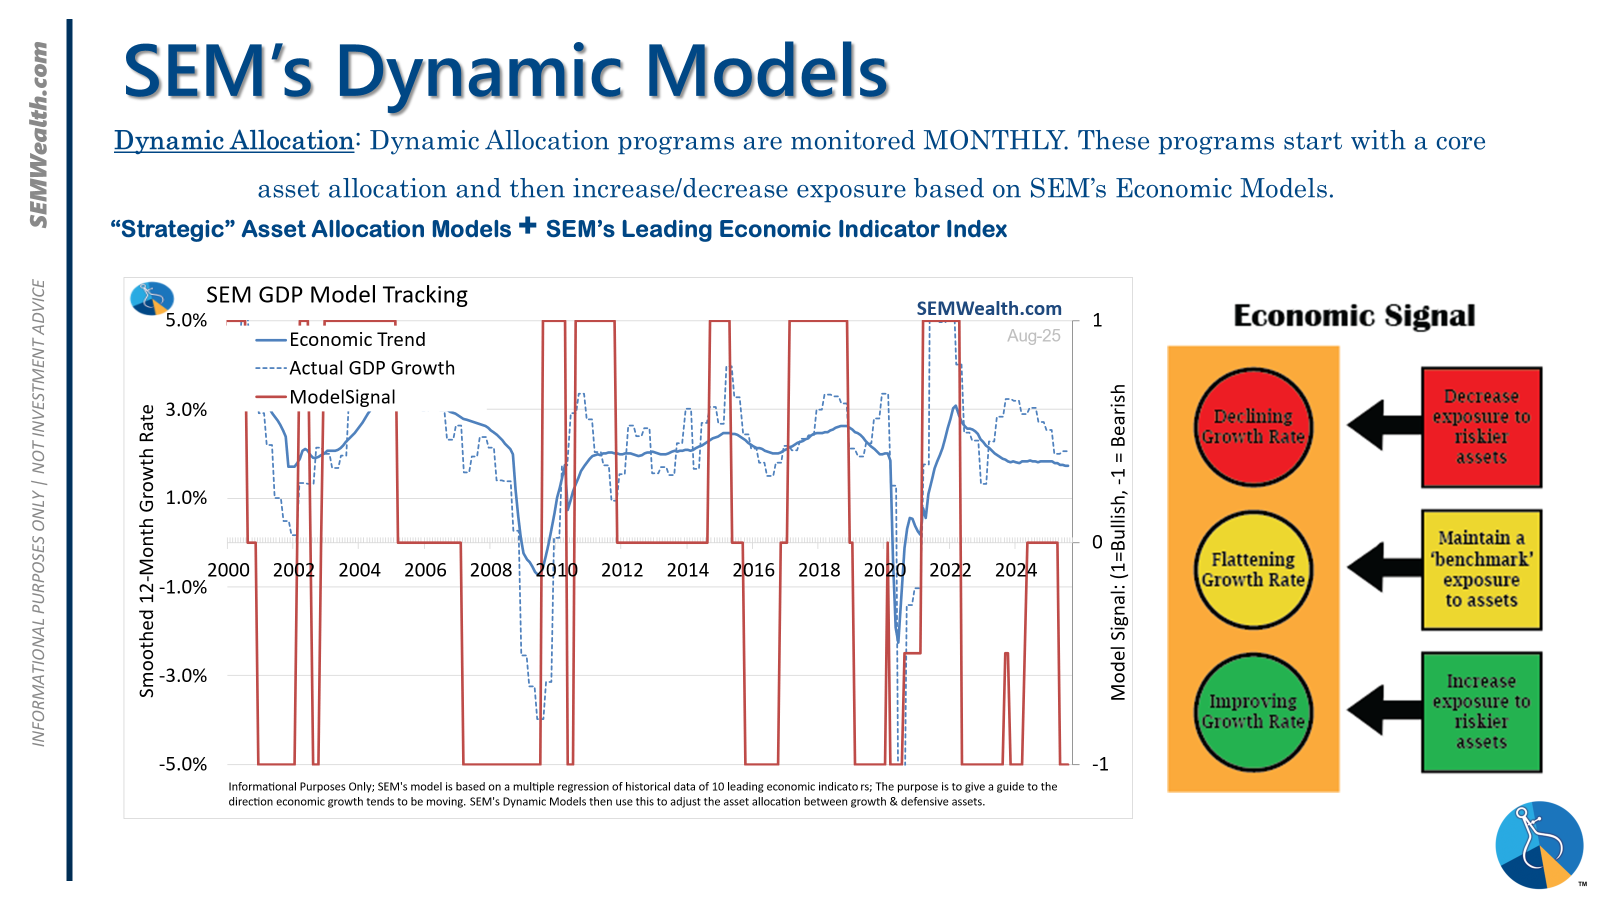
| Dynamic | Bearish | Economic model turned red – leaning defensive |
| Strategic | Slight under-weight | Trend overlay shaved 10 % equity in April -- added 5% back early July |
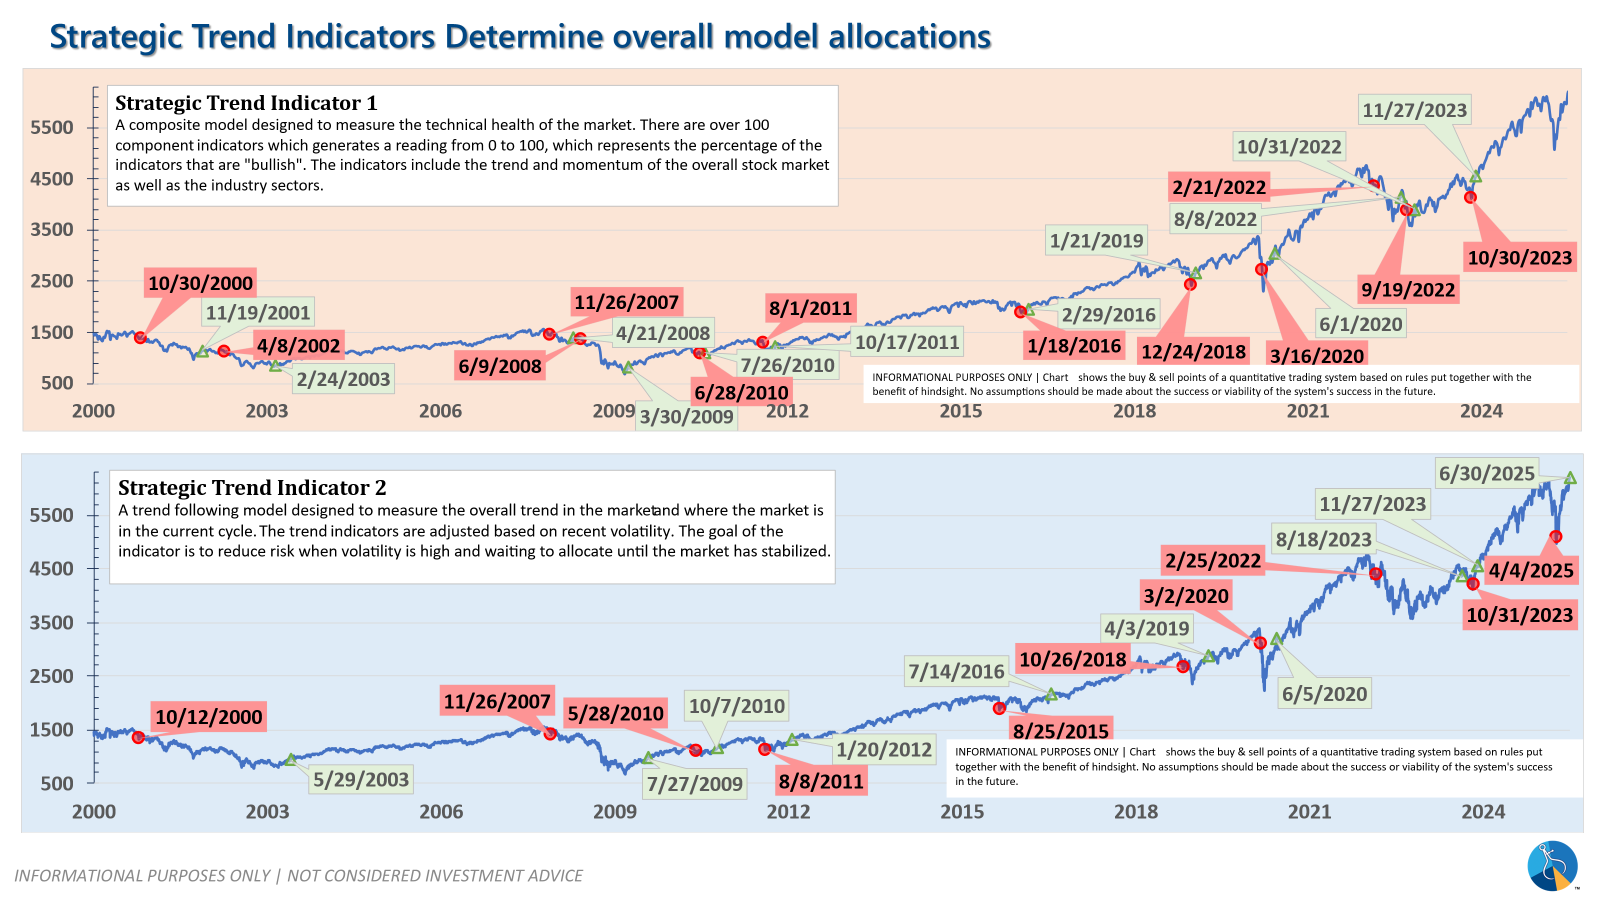
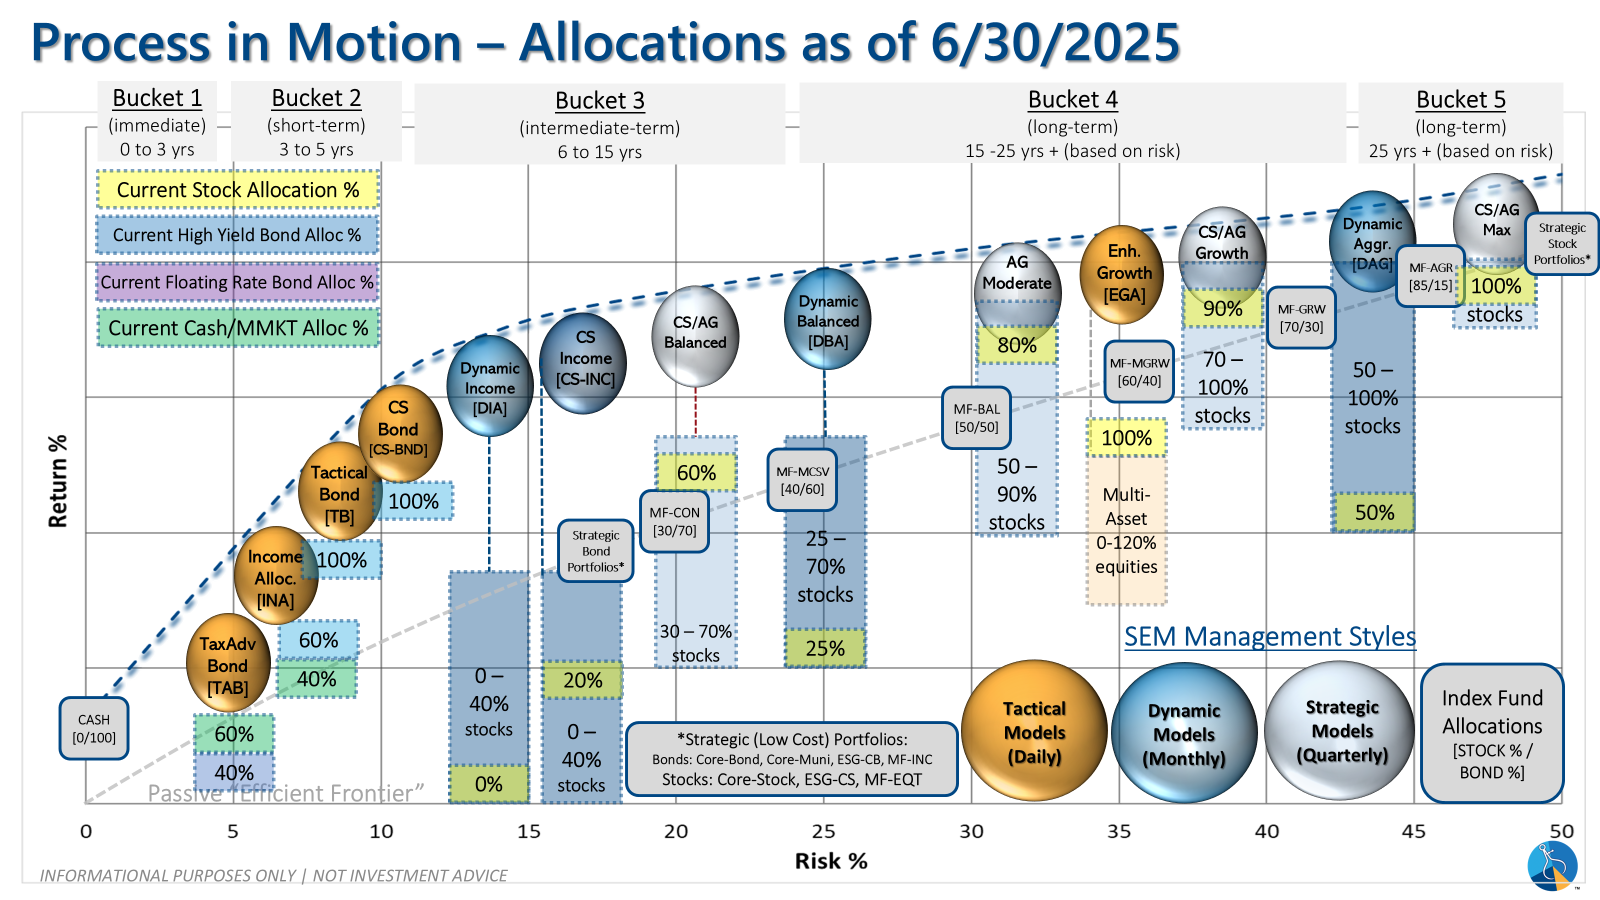
SEM deploys 3 distinct approaches – Tactical, Dynamic, and Strategic. These systems have been described as 'daily, monthly, quarterly' given how often they may make adjustments. Here is where they each stand.
Tactical (daily): The high yield system has been invested since 4/23/25 after a short time out of the market following the sell signal on 4/3/25.
Dynamic (monthly): The economic model went 'bearish' in June 2025 after being 'neutral' for 11 months. This means eliminating risky assets – sell the 20% dividend stocks in Dynamic Income and the 20% small cap stocks in Dynamic Aggressive Growth. The interest rate model is 'bullish' meaning higher duration (Treasury Bond) investments for the bulk of the bonds.
Strategic (quarterly)*: One Trend System sold on 4/4/2025; Re-entered on 6/30/2025
The core rotation is adjusted quarterly. On August 17 it rotated out of mid-cap growth and into small cap value. It also sold some large cap value to buy some large cap blend and growth. The large cap purchases were in actively managed funds with more diversification than the S&P 500 (banking on the market broadening out beyond the top 5-10 stocks.) On January 8 it rotated completely out of small cap value and mid-cap growth to purchase another broad (more diversified) large cap blend fund along with a Dividend Growth fund.
The * in quarterly is for the trend models. These models are watched daily but they trade infrequently based on readings of where each believe we are in the cycle. The trend systems can be susceptible to "whipsaws" as we saw with the recent sell and buy signals at the end of October and November. The goal of the systems is to miss major downturns in the market. Risks are high when the market has been stampeding higher as it has for most of 2023. This means sometimes selling too soon. As we saw with the recent trade, the systems can quickly reverse if they are wrong.
Overall, this is how our various models stack up based on the last allocation change:
Curious if your current investment allocation aligns with your overall objectives and risk tolerance? Take our risk questionnaire


