
"Boom, Bubble, or Both" was the lead article in our quarterly newsletter. With the market staging the strongest rally following a 15% sell-off since 2001 (prior to that it was 1998) and remaining on pace for another 15%+ year, we've been seeing more and more people wanting to chase the market higher. We've also been hearing from quite a few clients and advisors who are nervous about the stock market given the impressive rally off the "liberation week" lows.
I think every call/meeting the past month I've been asked what the rest of the year will look like. My answer has been the same: If we can get through the 15-20 of October, the calendar is typically very favorable to the stock market, especially in the first year of the Presidential cycle. So long as nothing happens between now and late October, it could be clear sailing. Well that "something" happened on Thursday night into Friday.
Trade War (again) threatens rally
All had been quiet on the Trade War front which has allowed the market to ramp higher throughout most of the summer and fall. That came to an end on Thursday evening when China announced expanded export controls on rare earth materials and any Chinese processing technologies. They included five additional elements and created additional controls on already restricted elements. They also specifically banned any exports that could be for military use. This was in response to the latest export controls President Trump placed on American chips being sold to China.
In response on Friday, the President announced an ADDITONAL 100% tariff on ALL imports from China. Currently Chinese tariffs average 30%. These tariffs are set to take effect on November 1 (the same day as the Chinese export controls). The president also implemented more export controls for "any and all critical software".
This is most likely a negotiation strategy, as the president did emphasize that "the timeline could move up depending on how China reacts." Based on the stock market reaction, we will see if the so-called "TACO" trade (Trump Always Chickens Out) is back in play next week. (The premise of this is the President backs down from his "threats" if the stock market reaction is too severe.")
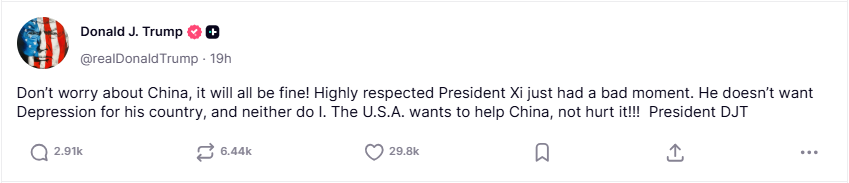
On Sunday, we saw "cooler heads" again prevail. This post caused stock futures to jump along with Bitcoin and Ethereum.
We interrupt this blog post so we can highlight the market charts since the stock market lost nearly 3% on Friday following the dual announcements. Following this we will have (more) discussion of the AI boom/bubble as we discuss news that happened prior to Friday last week.
Market Charts
Given Friday's sell-off I thought I'd start with the most important thing — the charts. This helps bring perspective to the very short-term "panic" we saw on Friday.
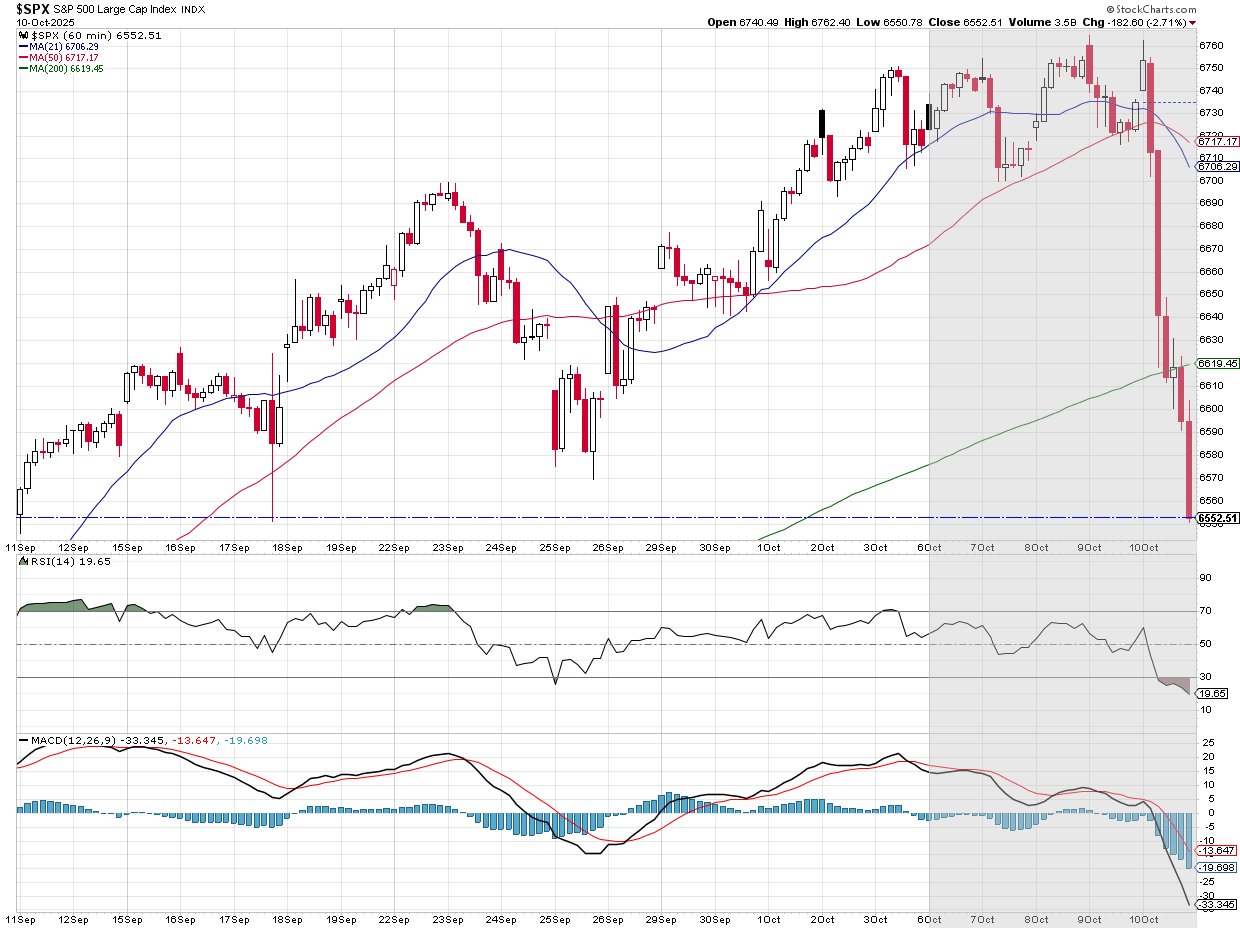
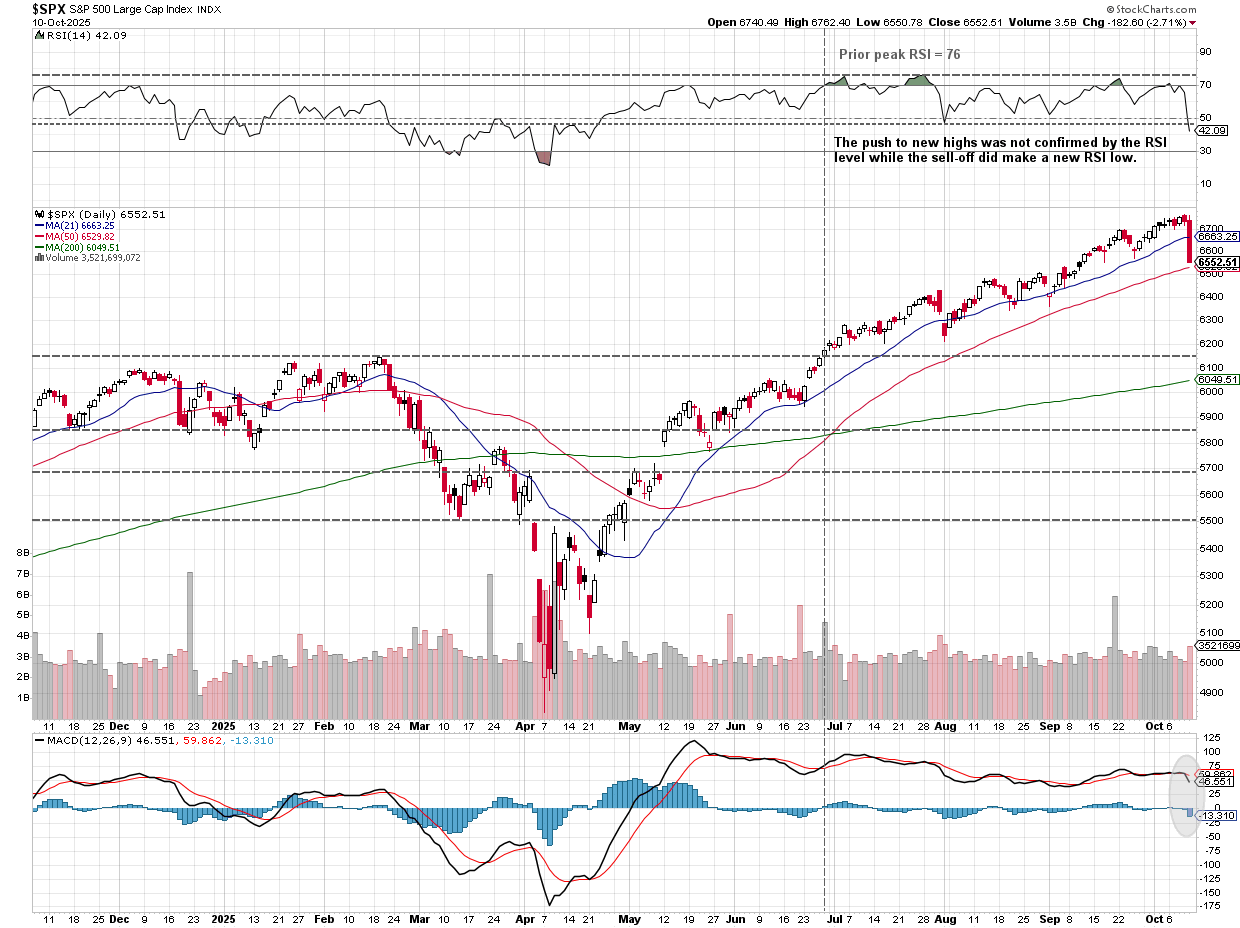
On the short-term chart the "damage" does look severe — 1 month of gains were evaporated with a simple statement from the President.
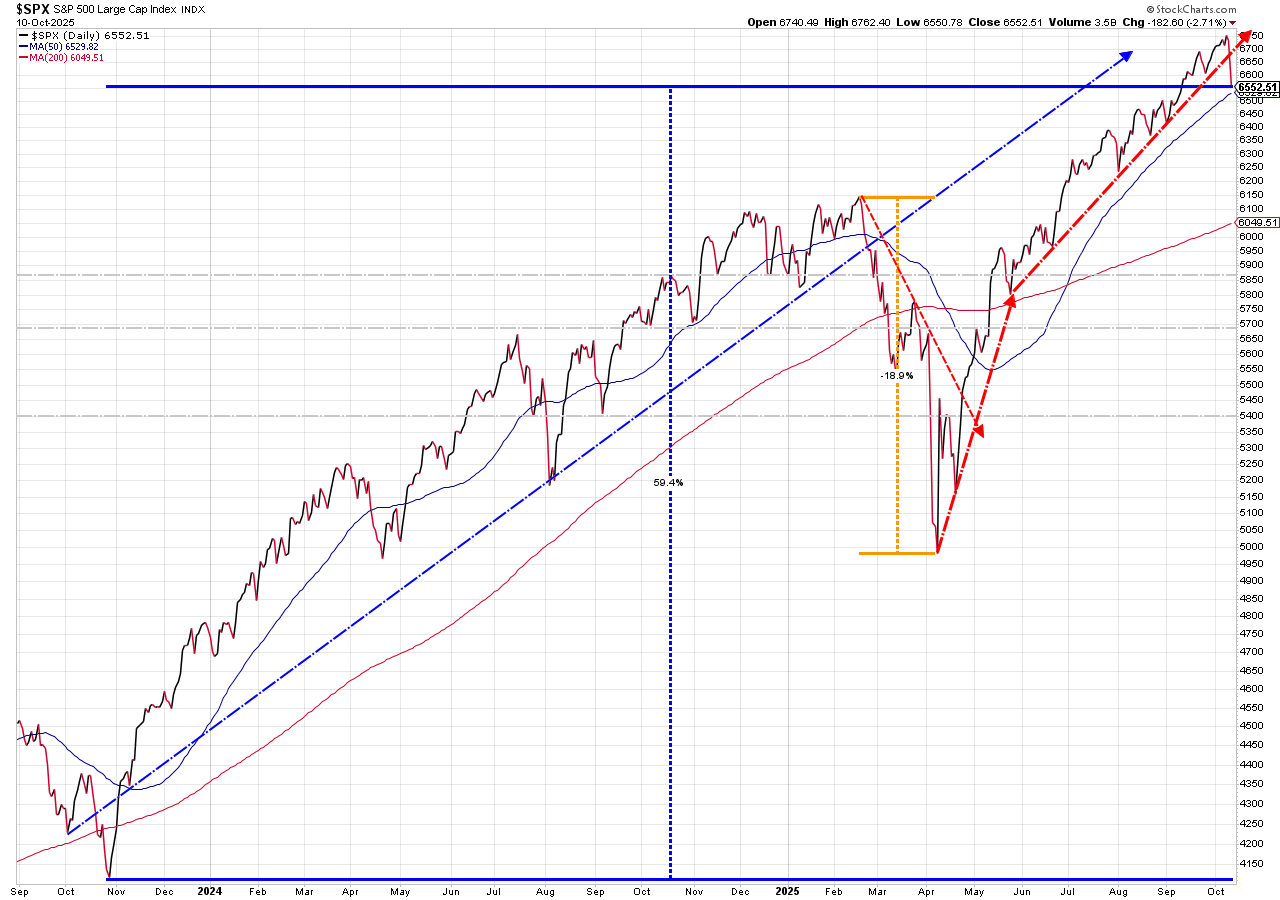
The S&P 500 is still up 59% since the Fed ended their rate hiking cycle in November 2023.
On a technical basis, however, the S&P did take some damage last week. We've been highlighting the past several weeks about the "non-confirmation" of the RSI Indicator (failing to confirm the push to new highs). On Friday as the S&P hit 1-month lows, the RSI broke to a new rally low. (This is a measure of momentum, "participation", and helps identify overbought or oversold conditions.) The 50-day moving average held, but the melt-up since July was so steady there isn't any real "support" levels where you had a bunch of buyers or sellers now waiting to regain those levels. Round numbers at 6500 and 6400 could come into play as people who felt like they "missed out" try to jump in.
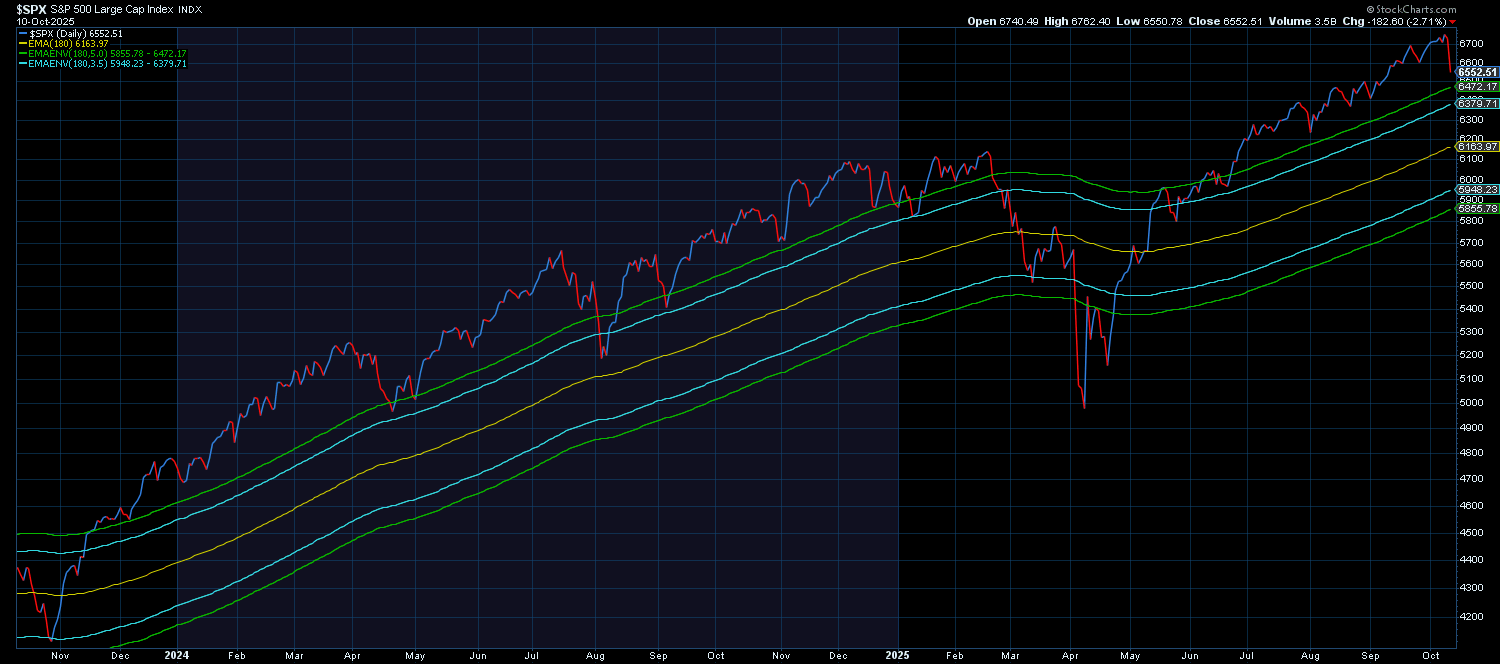
I've been mentioning on our advisor calls the past several weeks that the nearly unstoppable rally means our intermediate-term trend following systems have a long way to go before they reach a sell point. While this isn't exactly how our systems are designed, the following chart is a general representation. We use "bands" around various moving averages to determine the trend. Note how far above the upper band the S&P 500 has been. In a normally functioning market, you'd expect the market to move in between the upper and lower bands. When it spends long periods of time above the band it is a sign of a momentum driven market that you just have to buckle in for a volatile ride. It's fun on the way up, but can smack you a bit on the way down, if you're not prepared.
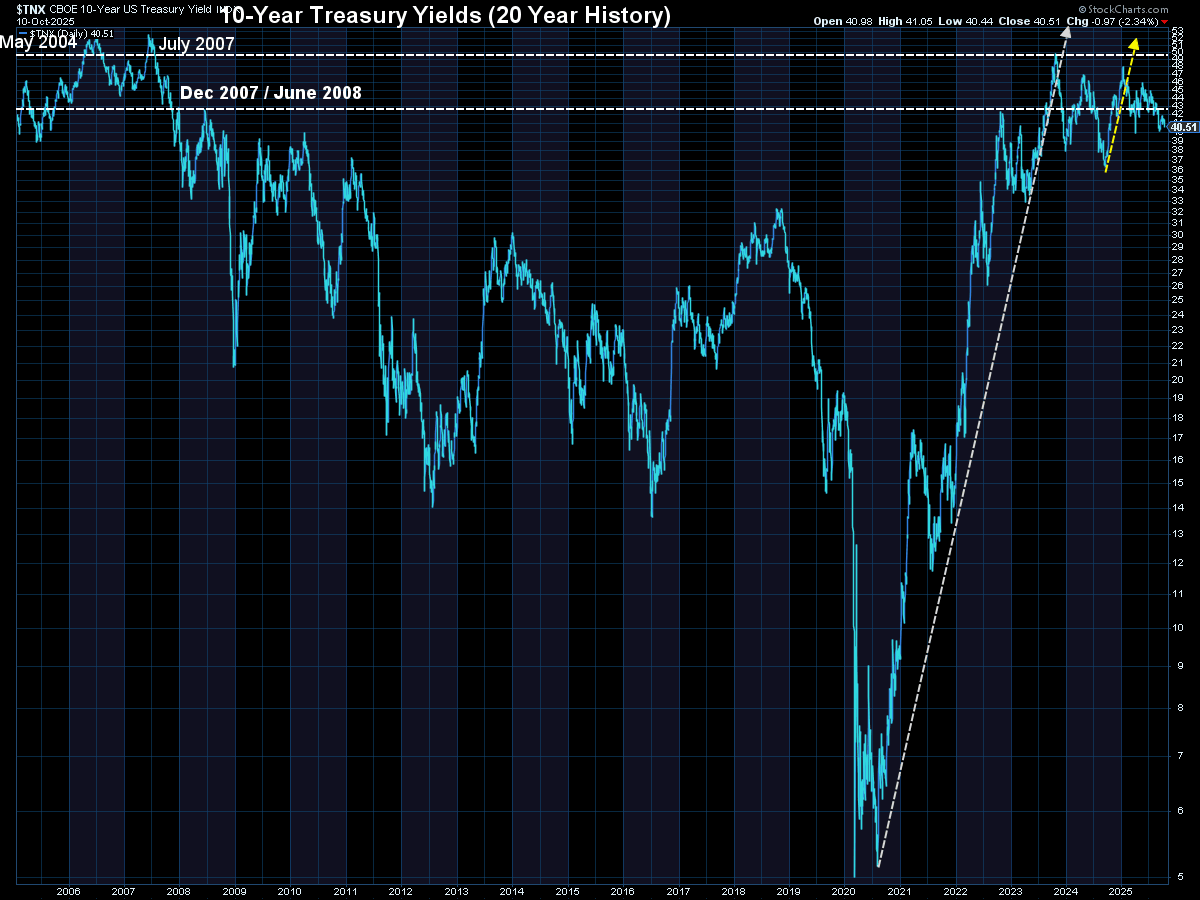
Turning to bonds, Treasury Yields slipped a bit, but remain near the same levels we saw just before the financial system imploded in 2007/2008.
The yield curve from 6 months to 20 years remains "normal" with the whole curve shifting lower last week.
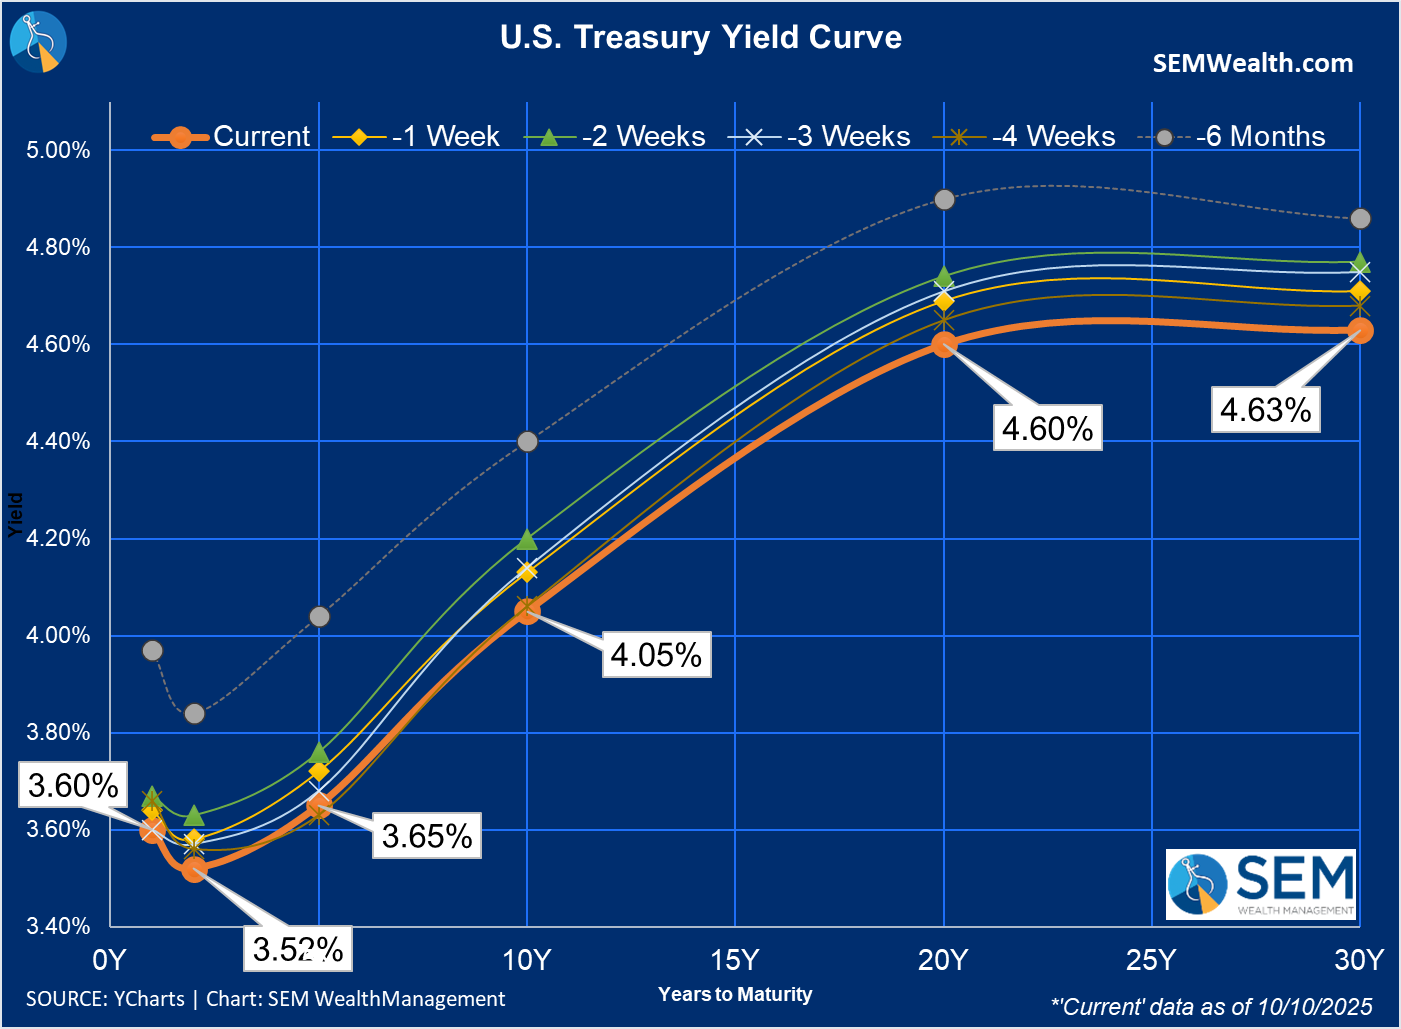
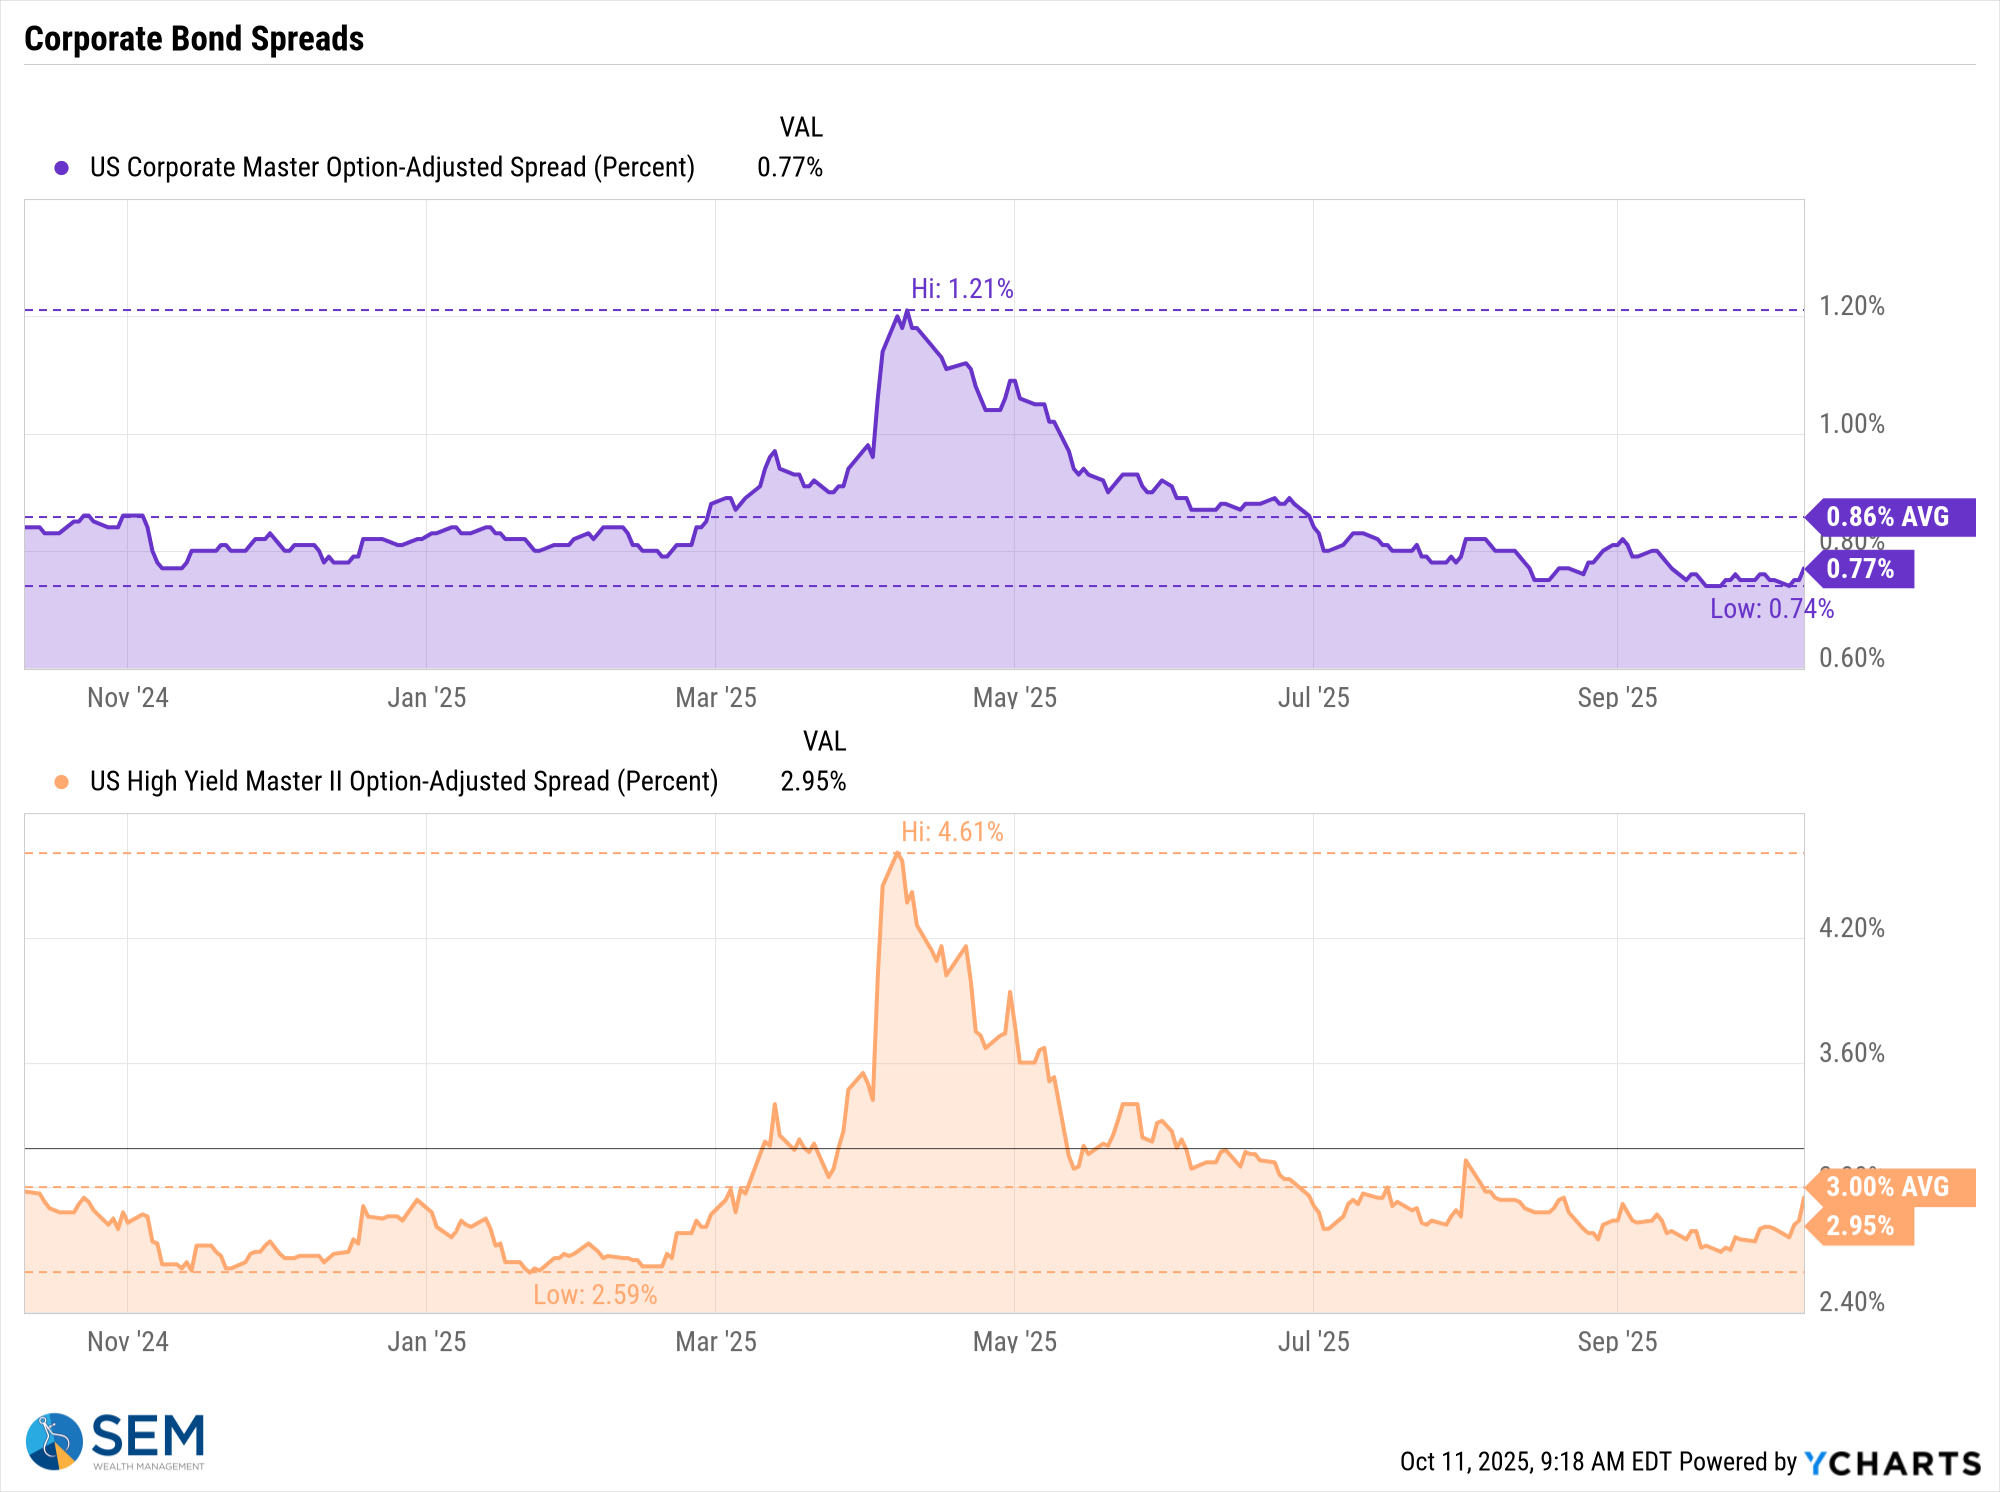
The lower 6 month yields indicate the market is still predicting more Fed rate cuts. Turning to the more important issue (for us), Corporate Bonds did not panic on Friday. Spreads remain just above the all-time lows of 2006 and 1999. I zoomed in this week to a 1 year chart so we can see the slight move off the lows, showing a bit of concern, but nothing (yet) to rush to judgement that Friday's news was a gamechanger.
Finally, Digital Assets, especially Ethereum and Bitcoin were hammered on Friday (not sure how it relates to Trump's resumption of the Trade War with China, but this will happen often in this space.) Interestingly enough, even with the big drop in prices, only Ethereum is down over the past month.
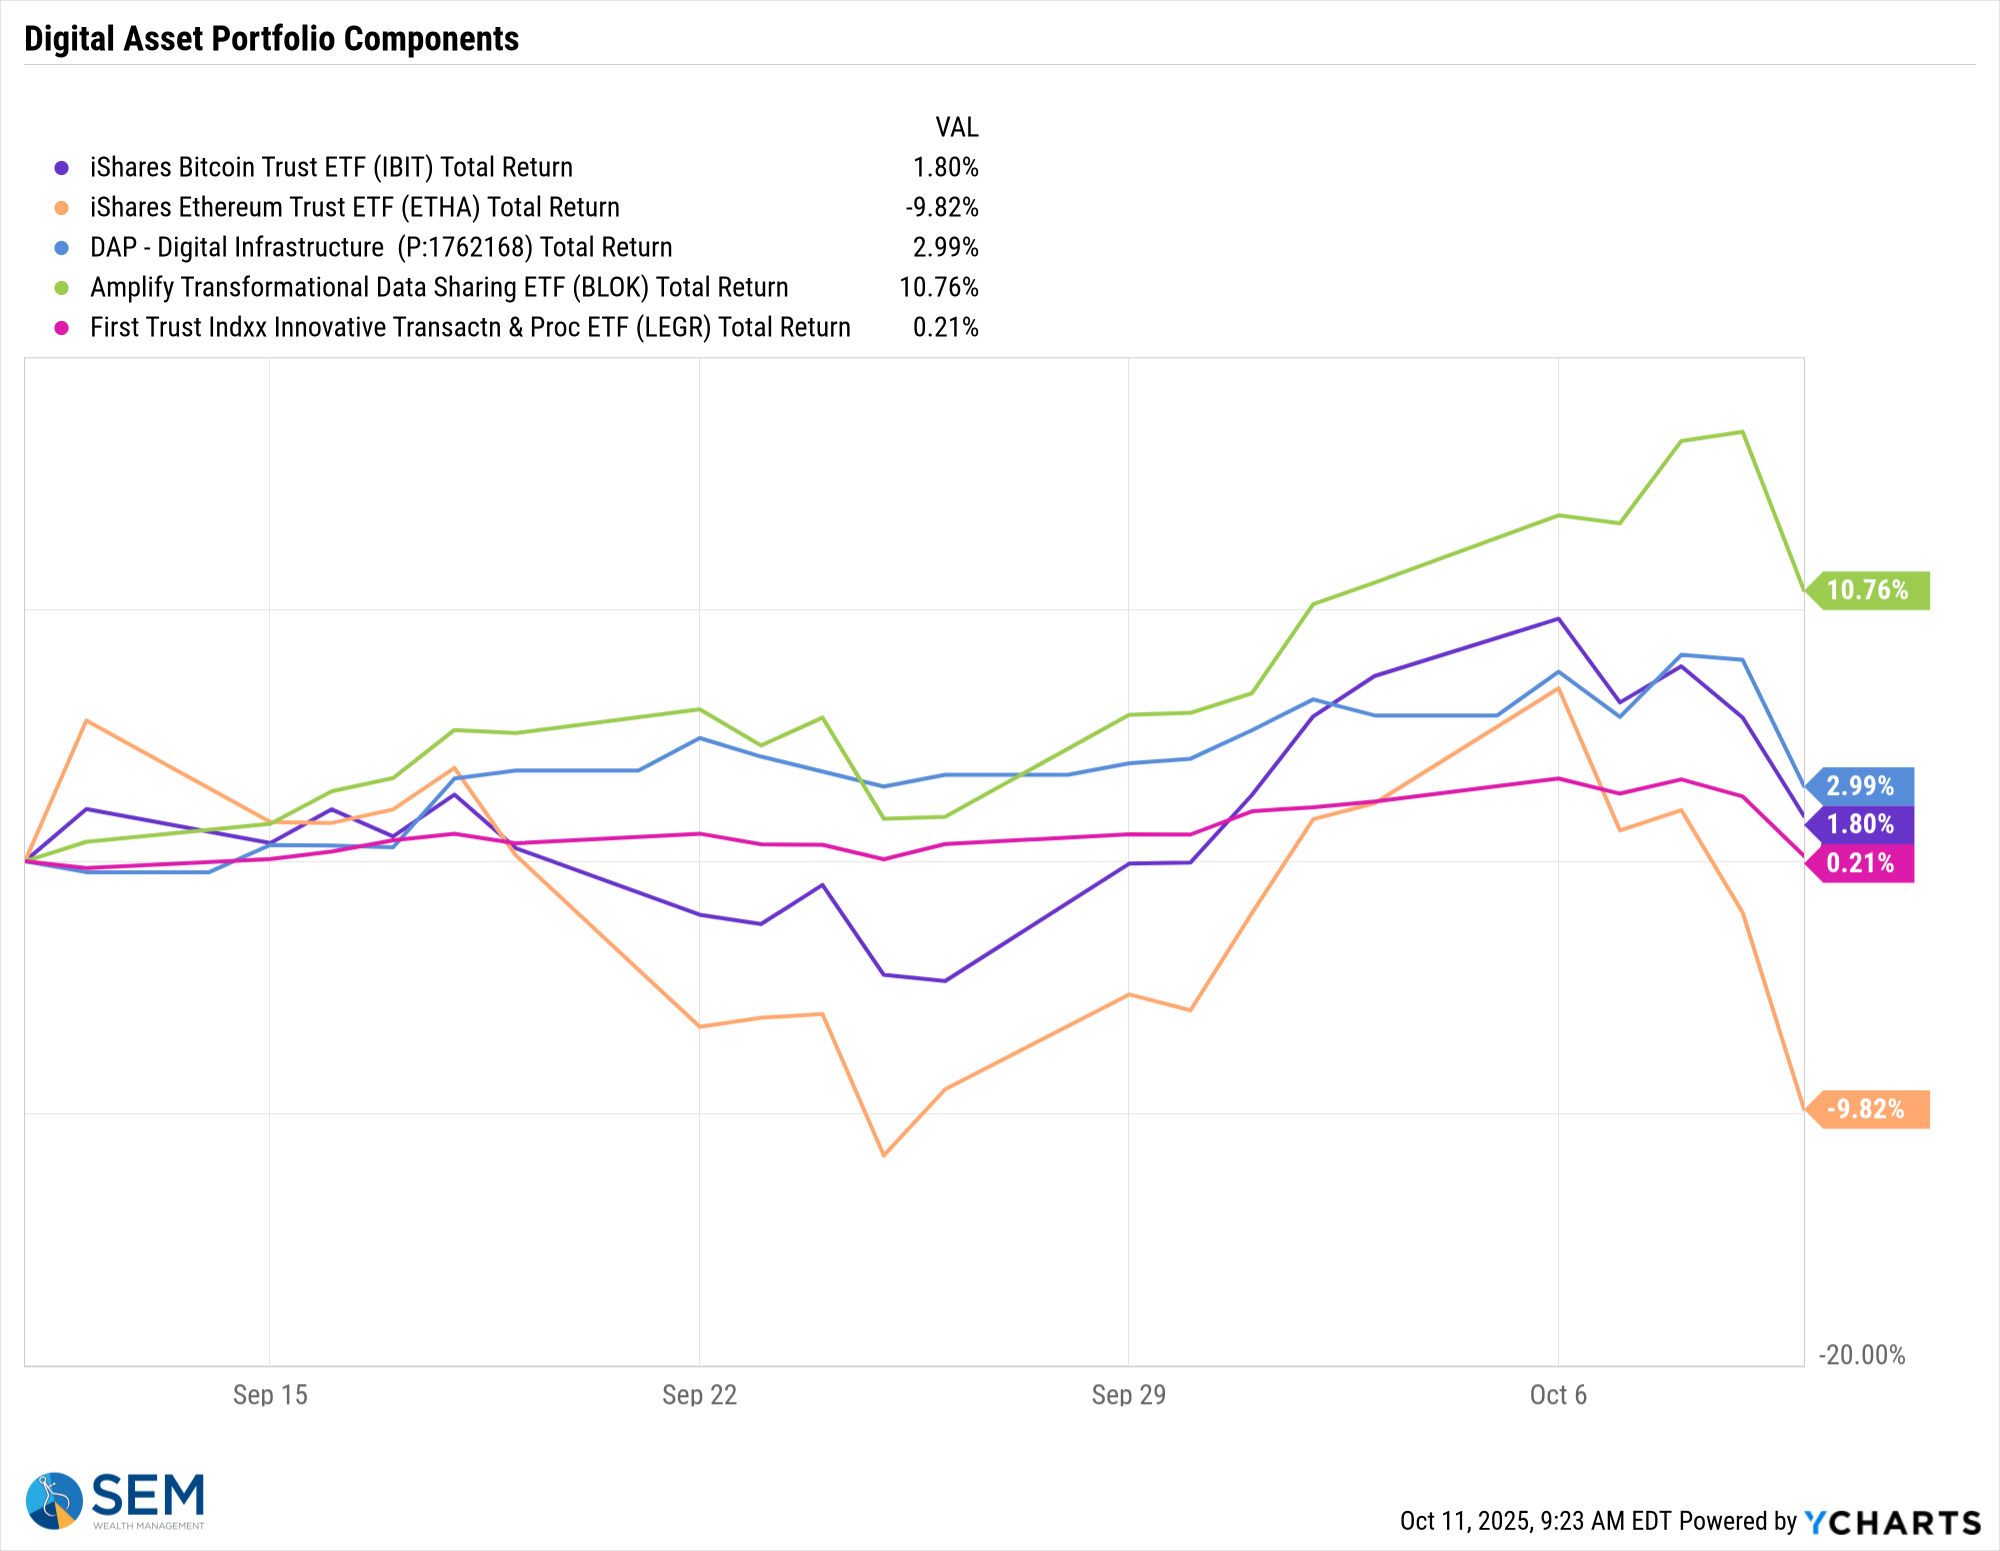
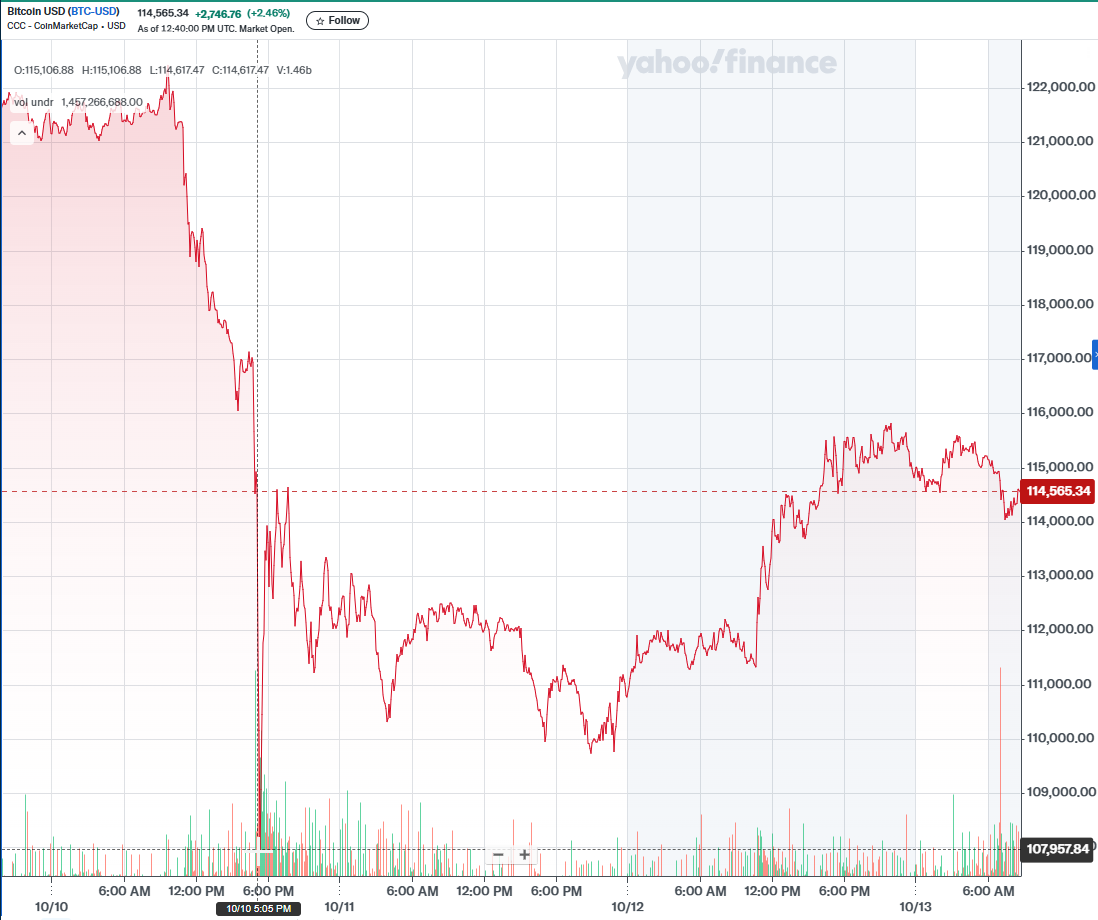
Cryptocurrencies continue to be more of a measure of risk appetite rather than something that is a hedge against inflation or devaluation of currencies. The trade war rhetoric on Friday should have caused a flight into these 'hedges'. Notice the volatility of Bitcoin the last 5 days – falling from 122,000 on Thursday to 107,000 (13%) by Friday evening. It has since recovered about half that loss.
Now back to our regularly scheduled blog post.......................
Does the market have a 'recycling' problem?
Over the past month I've been trying to think of a way to explain my growing concern about the AI-driven market. I'm trying not to be the "old man" who is unable to adapt to something new. In fact, I'm a very heavy user of AI and am trying to find ways our company can efficiently implement it to make us more competitive.......similar to what I was helping us do back in the late 90s during the tech boom. History tells us that the developments of the 90s most certainly changed our entire economy and those businesses who adapted and implemented those new tools thrived. The problem is the investment enthusiasm got way too far ahead of the actual business profits.
Like the 90s, we're seeing the same companies buying and selling from each other (recycling). We've even seen these same companies investing in their customers (especially Nvidia.) Leases and rental deals tied to investments and promises of future contracts smells a bit to similar to the shenanigans we saw in the late 90s and early 2000s. Don't get me wrong. The technology is a game-changer. The speed that this pays off though is a huge unknown and given the historic valuation levels we are witnessing, it is dangerous to assume everyone will make money.
In case you missed it, I discussed this in several articles in our most recent newsletter:

Last Tuesday we saw another reminder about the 'recycling' risk in the market. Oracle quietly revealed a $100 million operating loss tied to its leasing of Nvidia’s Blackwell chips, which is part of its aggressive push into AI cloud infrastructure. The chips are central to Oracle’s AI ambitions and analysts expected this to be a profit engine. Instead, they exposed razor-thin margins for that segment raising broader concerns about the sustainability and prospects for growth in the tech sector.
According to internal documents obtained by The Information, Oracle generated $900 million in revenue from Nvidia-powered rentals but only $125 million in gross profit, resulting in a 14% gross margin—a far cry from the 70% margins typical of Oracle’s traditional software business. Putting this in perspective, Costco's gross margins are 13%. Walmart and Target have gross margins of 25 & 29% respectively. Margins this low are not a positive for this "hot" segment.
This loss comes just months after Oracle committed $40 billion to Nvidia chips for OpenAI’s Stargate data center in Texas, which further has deepened its reliance on Nvidia’s pricing and supply chain.
Here's the problem. Nivida still owns these rented chips and they are on their balance sheet and is booking the rent as profit on their income statement. How are they currently valued and if one of their biggest customers is struggling to profit from renting them, are the chips in danger of being de-valued (written down) on their balance sheet? The write down would carry over to the income statement. Worse, would that lower the potential revenue in the future from renting chips?
I don't think this is a "now" problem, but it could be something when we have the benefit of hindsight where everyone says, "oh, it was obviously a problem."
Margin Trends Tell the Story
To put this in perspective, here’s a look at Oracle’s margin trends compared to the other top AI related companies (ranked from top to bottom – Oracle is the dark orange line):
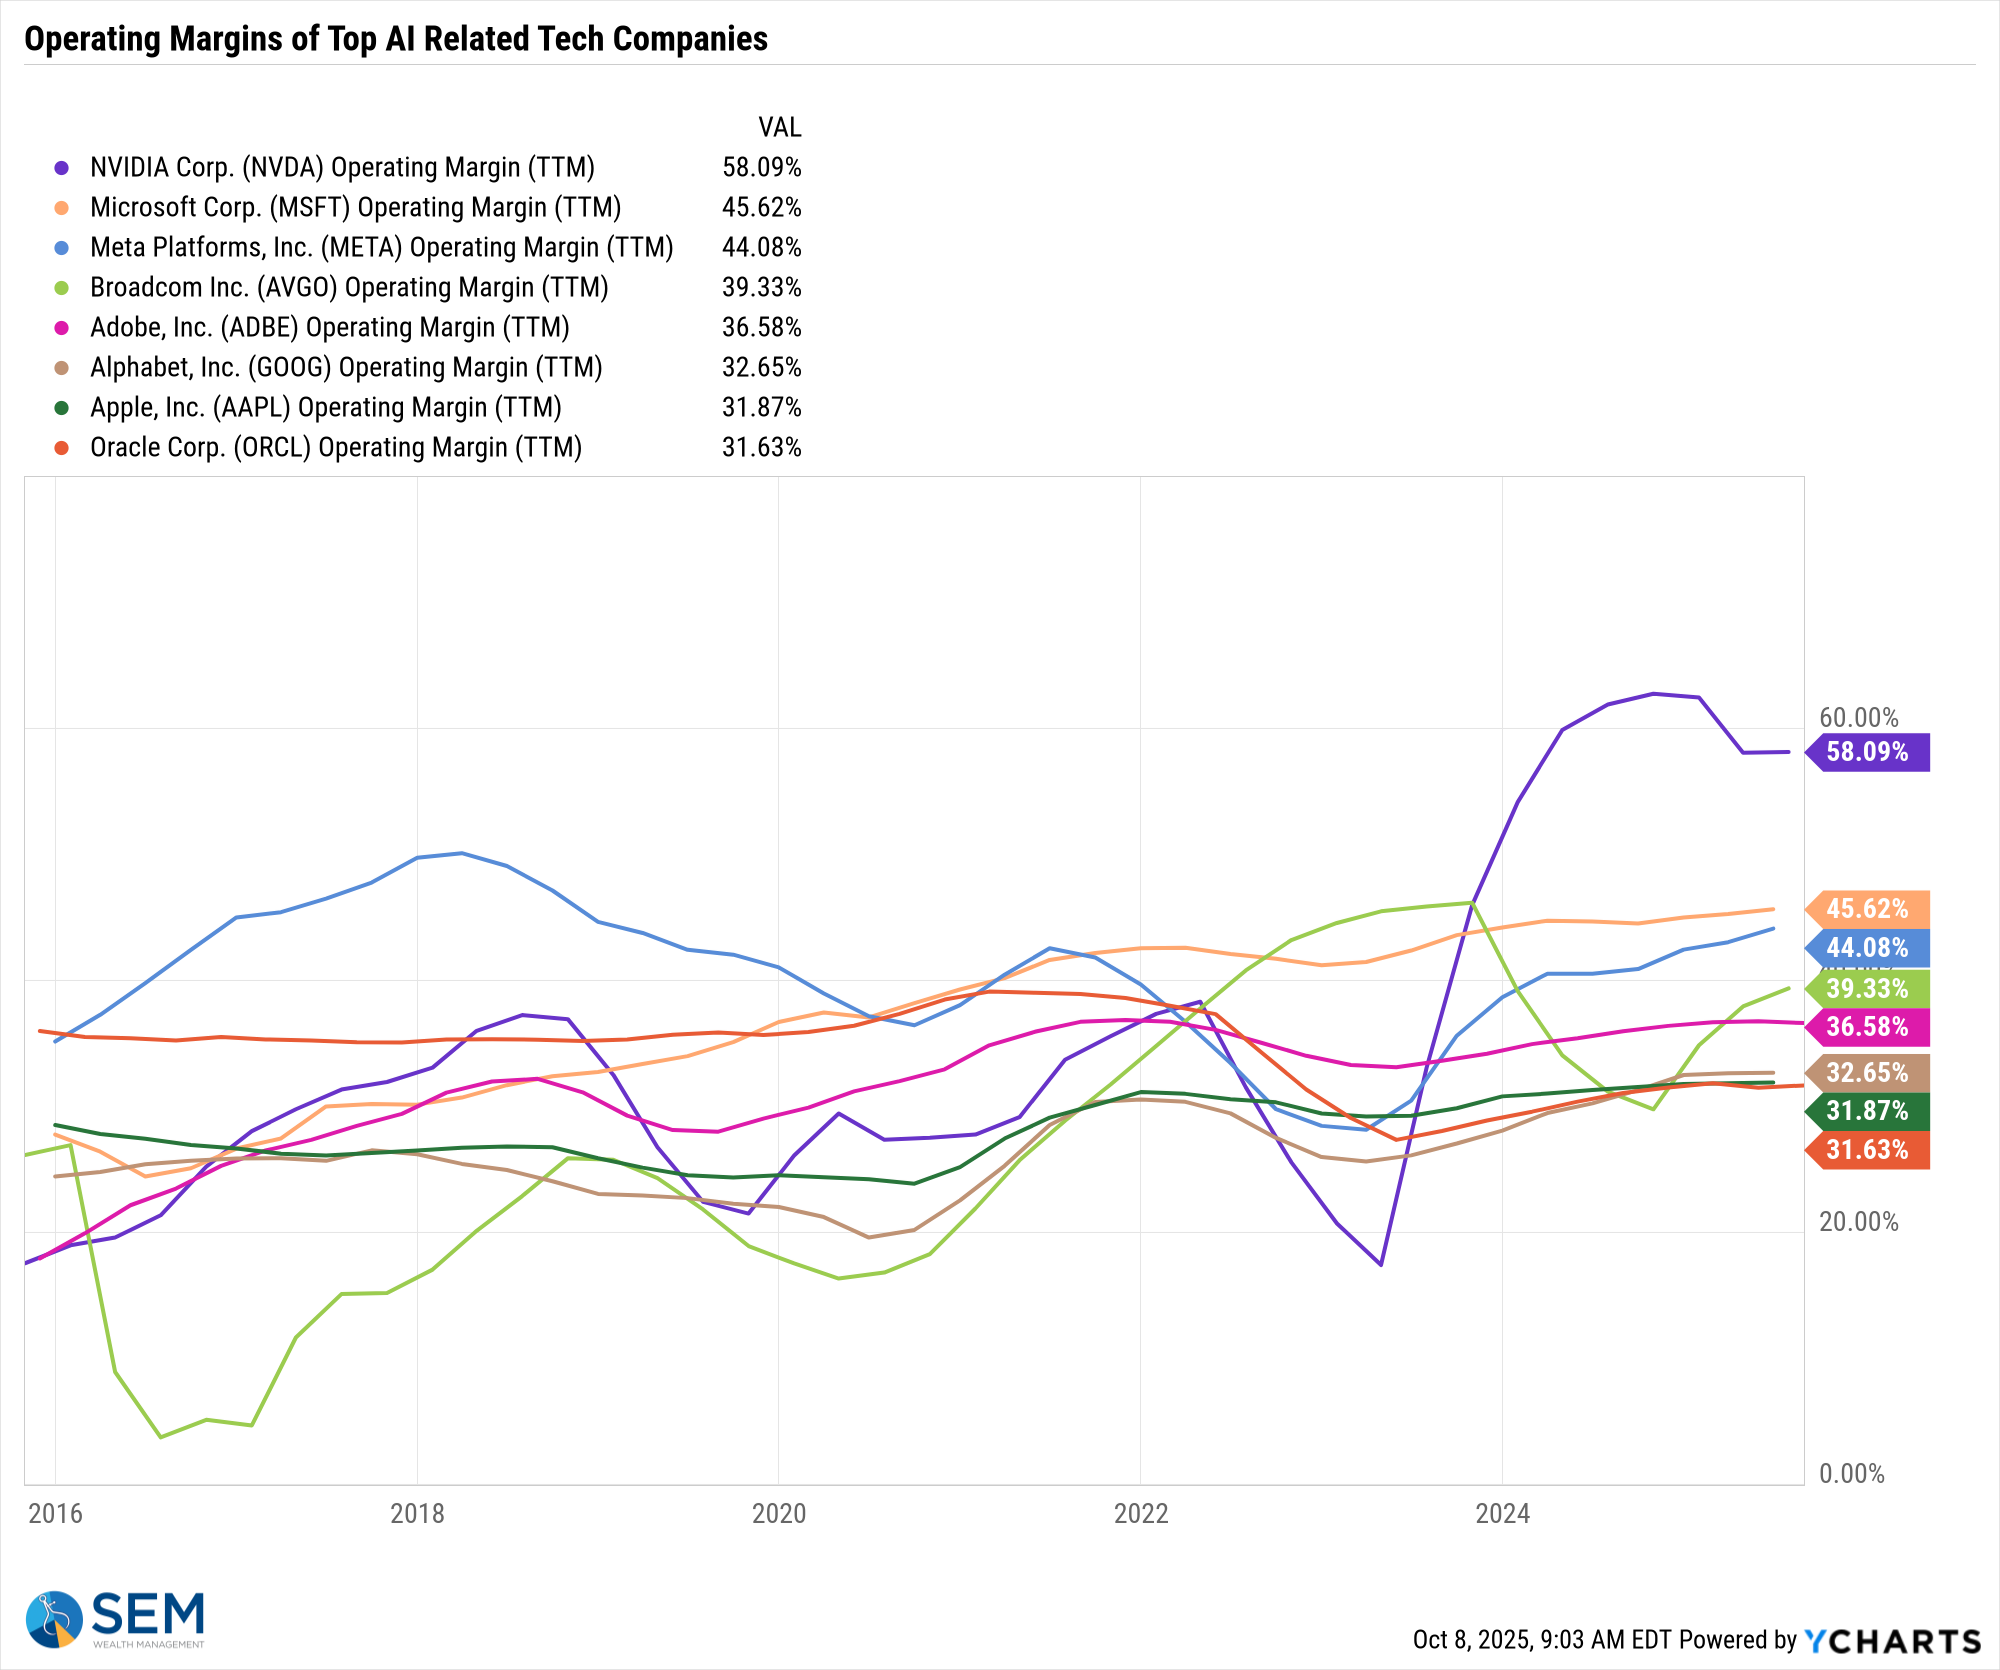
While Oracle has been gaining a lot of attention, we can see competitively they have the lowest operating margin relative to the companies, many of whom are also their customers and suppliers. The bigger question mark, though comes from Nvidia's sky-high margins and whether that can continue when at least one of their customers is reporting issues in profiting from their spending on Nvidia's chips. This (at least to me) begs the question, what other Nvidia customers are struggling to make enough money to justify their investment in their chips?
Investing in your customers.......is this a problem?
Again, I can't say this enough. I'm a huge believer in the prospects of AI, but my accounting brain and experience in the late 90s is making me increasingly uncomfortable with the AI buildout. Each week it is starting to rhyme more and more with the "high speed internet" (fiberoptic) buildout that was driving the stock market in 1999. Most people point to the idiocy of stock valuations like Pets.com, but the true driver and hype was around the internet buildout and all the companies that were going to be a part of it.
OpenAI is obviously the biggest name in the AI space. They are currently a private company so nobody knows what they are worth. In the past month both Nvidia and AMD have struck deals with OpenAI. Nvidia is "leasing" chips to Nvidia, but rather than paying cash for the lease, OpenAI is giving Nivida a stake in the company. What is that stake worth? Right now, it's whatever the accountants say it is worth. How do you value the lease on the books of Nvidia? However the accountants say they want to value it.
(To be clear, there are accounting rules that dictate this, but there are a lot of grey areas, especially with a private company that is not priced by the free market every day.)
AMD is even more strange. They are selling their chips to OpenAI, but to entice OpenAI to be their customer, AMD is giving OpenAI warrants to purchase AMD stock in the future. I won't even try to write out those accounting entries, but I know the stock jumped when they announced the "deal".
Is this a problem? I guess time will tell. AMD stock jumped so much on this news that OpenAI is buying AMD's chips with the money earned on the warrants. This is great as long as a.) it continues in the future and b.) OpenAI eventually is able to make money off these chips.
Imagine these two conversations:
Conversation 1:
Chip Maker A: Would you like to buy my chips?
Customer: I would, but I don't have any cash.
Chip Maker A: Well what if you give me a piece of your business.
Customer: Sure, here you go! Now give me your chips
Chip Maker A Press Release: We just sold a bunch of chips!!!!
Market: Way to go! We're so excited!
Conversation 2:
Chip Maker B: Would you like to buy my chips?
Customer: We would, but we also like Chip Maker A and Chip Maker Cs chips and think they we might buy them.
Chip Maker B: Well what if we also threw in a future stake in our company.
Customer: Sure, let's do it.
Chip Maker B Press Release: We just sold a bunch of chips!!!!!
Market: Way to go! We're so excited!
Obviously it's more nuanced, but this is the gist of what is happening. Based on experience and my study of history, the deals will likely get even crazier to keep the momentum going with the hope that at some point the actual end customers (businesses and consumers) will spend money on their product.
Another warning sign?
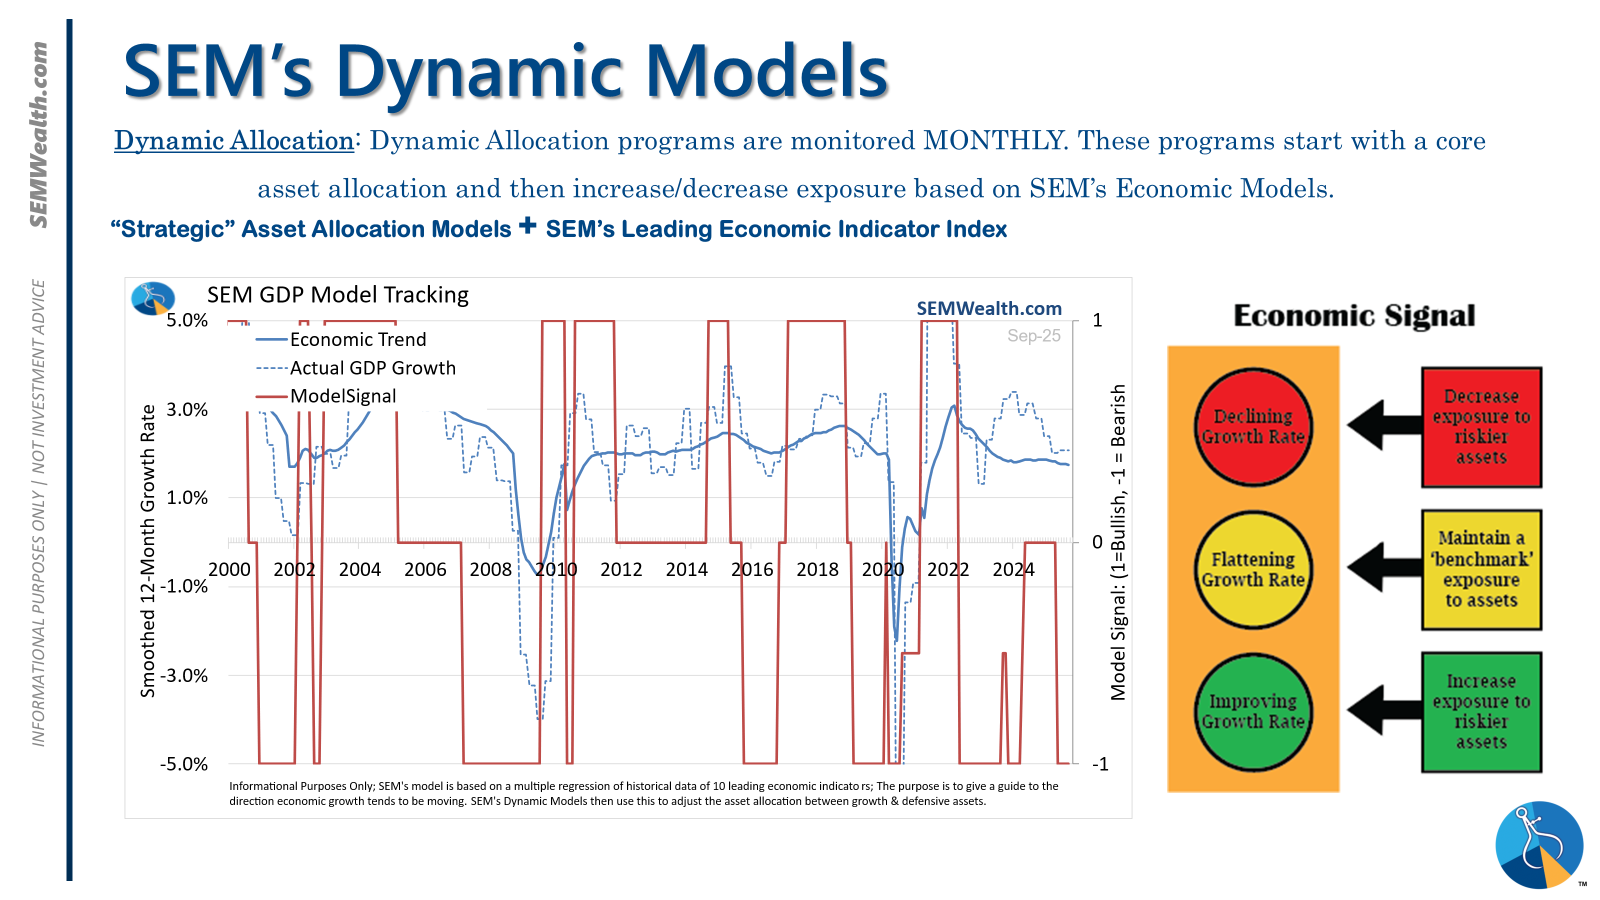
SEM's Economic Model has been "bearish" since June. This is based on our own version of the leading economic indicators. There are other indicators which tend to be what I call "leading, leading indicators." These indicators have a tendency to be very early warning signs of strains in certain parts of the economy. They don't always bring an economic slowdown, but it is a sign of stress.
Last Friday the Wall Street Journal reported on the growing delinquency in "sub-prime" auto loans. The default rate on these loans is at the highest level since 1994. (Sub-prime loans are typically used by borrowers with credit scores below 620. They typically are given to young adults who are just starting out or to lower income households.
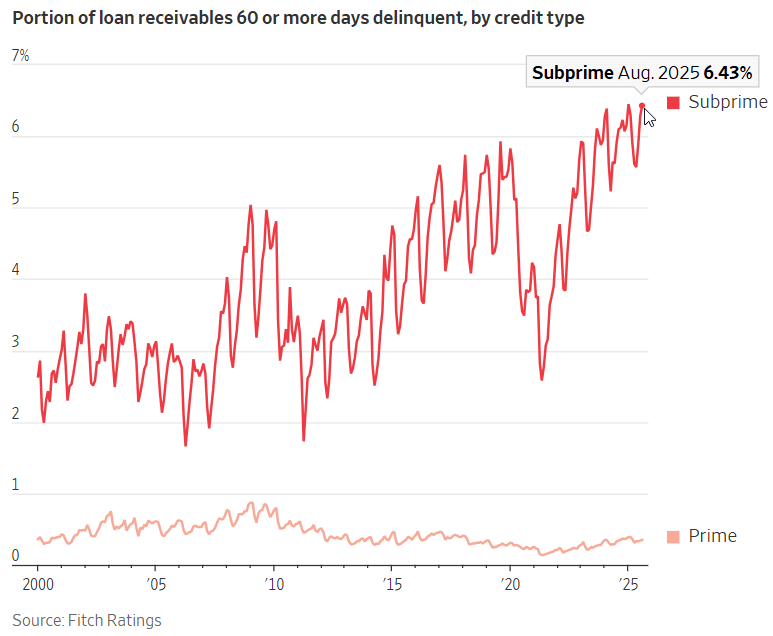
The surge in late payments is being driven by a combination of high vehicle prices, elevated interest rates, and broader inflationary pressures that have stretched household budgets. Many borrowers who took out loans during the pandemic-era stimulus boom are now facing monthly payments that exceed what they can afford.
This trend is raising concerns for lenders and investors in asset-backed securities tied to auto loans. Some lenders have already tightened credit standards or exited the subprime market altogether. The concern is if delinquencies continue to rise, it could ripple through the broader economy. The situation highlights the "K-shaped" economy I've been discussing since the pandemic. While Americans with above average income continue to thrive, the bottom half of our economy is continuing to struggle. Eventually that always becomes an issue for our economy. A decline in the auto market could be the beginning.
Toby's Take
Our intern's summary of his top WSJ articles last week.
10/06/2025 - How a Missile Strike Unlocked a Deal for Peace in Gaza - WSJ
President Trump is pushing for peace in Gaza after the latest missile strike. After the September 9 strike the United States had more leverage to push a peace deal between the two countries. It is seeming more likely that the deal is agreed to even though both sides are having trouble fully accepting it. If the deal goes through it may not exactly be good for the Patriot Portfolio but oil coming out of these countries may be easier to get after the fact, which could raise stock prices overall!
10/07/2025 - Trump Open to Healthcare Talks With Democrats to End Government Shutdown - WSJ
Talks to extend Healthcare subsidies between Democrats and President Trump. President Trump said that he is open to negotiations, but they need to vote to fund the government first. If the government is voted to be funded and these Healthcare subsidies actually go through, it could be good for stocks or funds that have a part in any healthcare as well as the overall economy. We can't make any assumptions for now about this.
10/08/2025 - The Government Shutdown Is Starting to Shut Down Business as Usual - WSJ
The Government shutdown is affecting more than just Federal Companies. Many private sector businesses are being hit by the shutdown whether it be a stop-work order, stalled government contracts, or delayed workplace-safety inspections. These big and small things are all big deals because if the shutdown goes on for too much longer, revenue is going to drop causing stock prices to go down. In the case that the shutdown goes on for a longer period of time we can expect clients feeling the pressure to come in asking for help or clients making quick/dangerous decisions to just pull out of the market.
10/09/2025 - Trump Says Israel and Hamas Agree to Hostage Release in Step Toward Ending Gaza War - WSJ
After months of talks and two years of war, Israel and Hamas are finally taking steps to peace. President Trump has gotten Hamas agree to let the surviving hostages go back to Israel showing that they are ready for peace. This is a great moment for everybody because another conflict is hopefully coming to an end. Due to this we can expect changes in stock prices for companies that the United States imports from these countries.
10/10/2025 - China’s Rare-Earth Escalation Threatens Trade Talks—and the Global Economy - WSJ
China is putting new restrictions on rare-earth materials that are needed by all of the other countries of the world. China produces about 90% of the worlds rare-earth materials. These materials are used in practically all things technology like phones, computers, and data centers. Without the materials we wouldn't be able to grow our AI models. This gives China a huge upper hand on the United States-China trade fight causing this whole thing to potentially bite back at the US. Because of this we are likely going to see massive price increases of chips and the tech that chips work into go up making less people buy them and driving stock prices down. We may want to get ahead of this and watch out tech portfolios and our exposure there.
SEM Market Positioning
| Model Style | Current Stance | Notes |
|---|---|---|
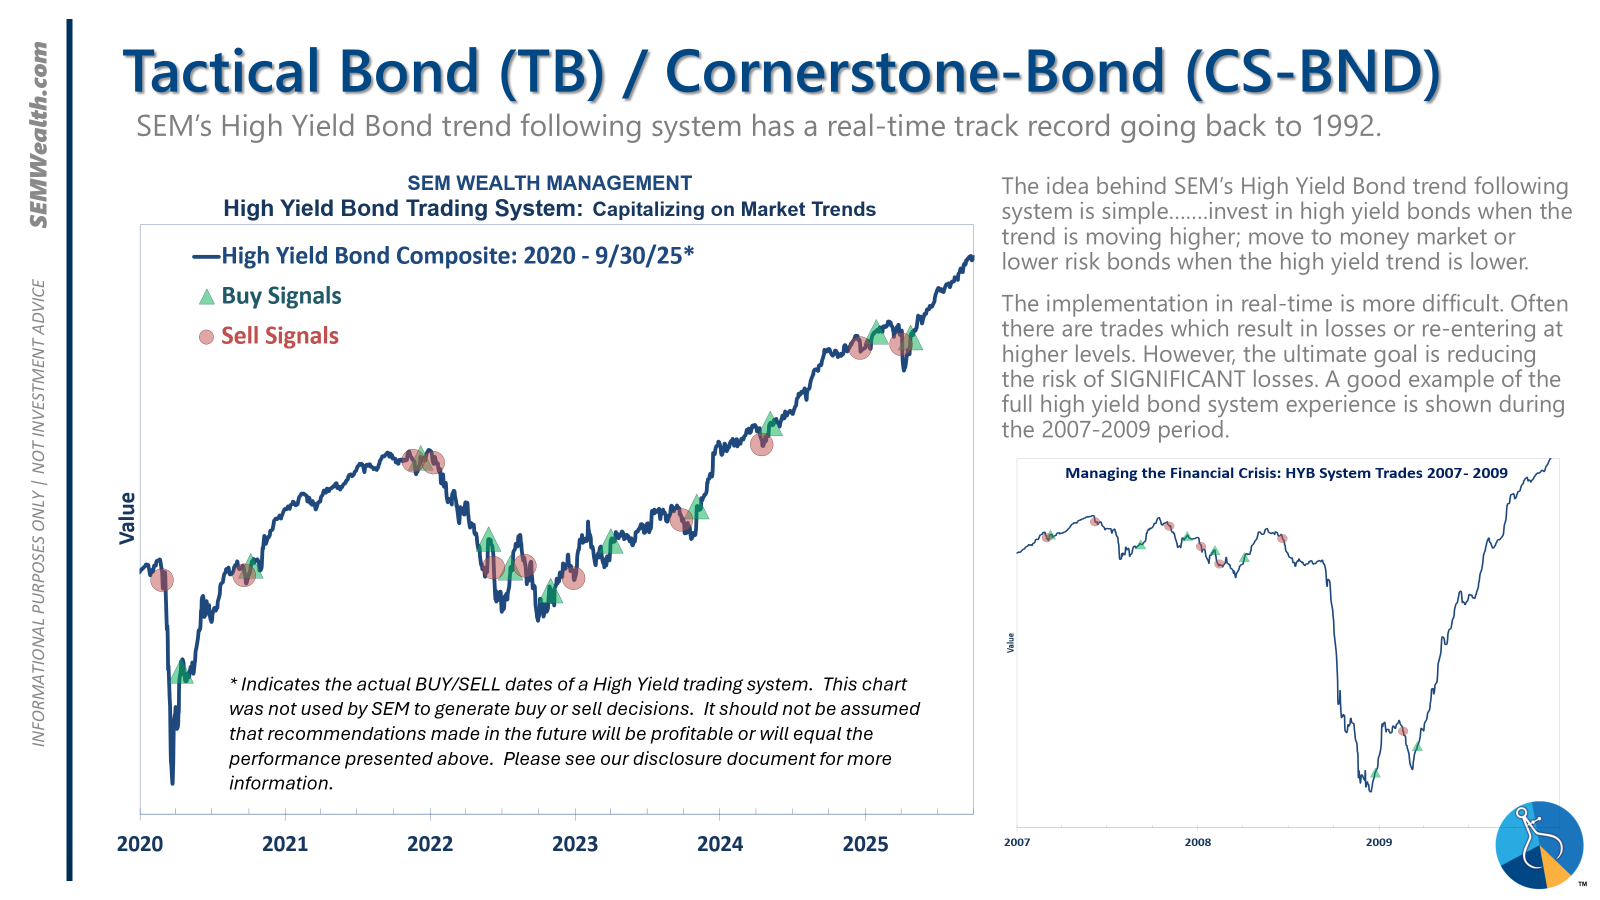
| Tactical | 100% high yield | High-yield spreads holding, but trend is slowing-watching closely |
| Dynamic | Bearish | Economic model turned red – leaning defensive |
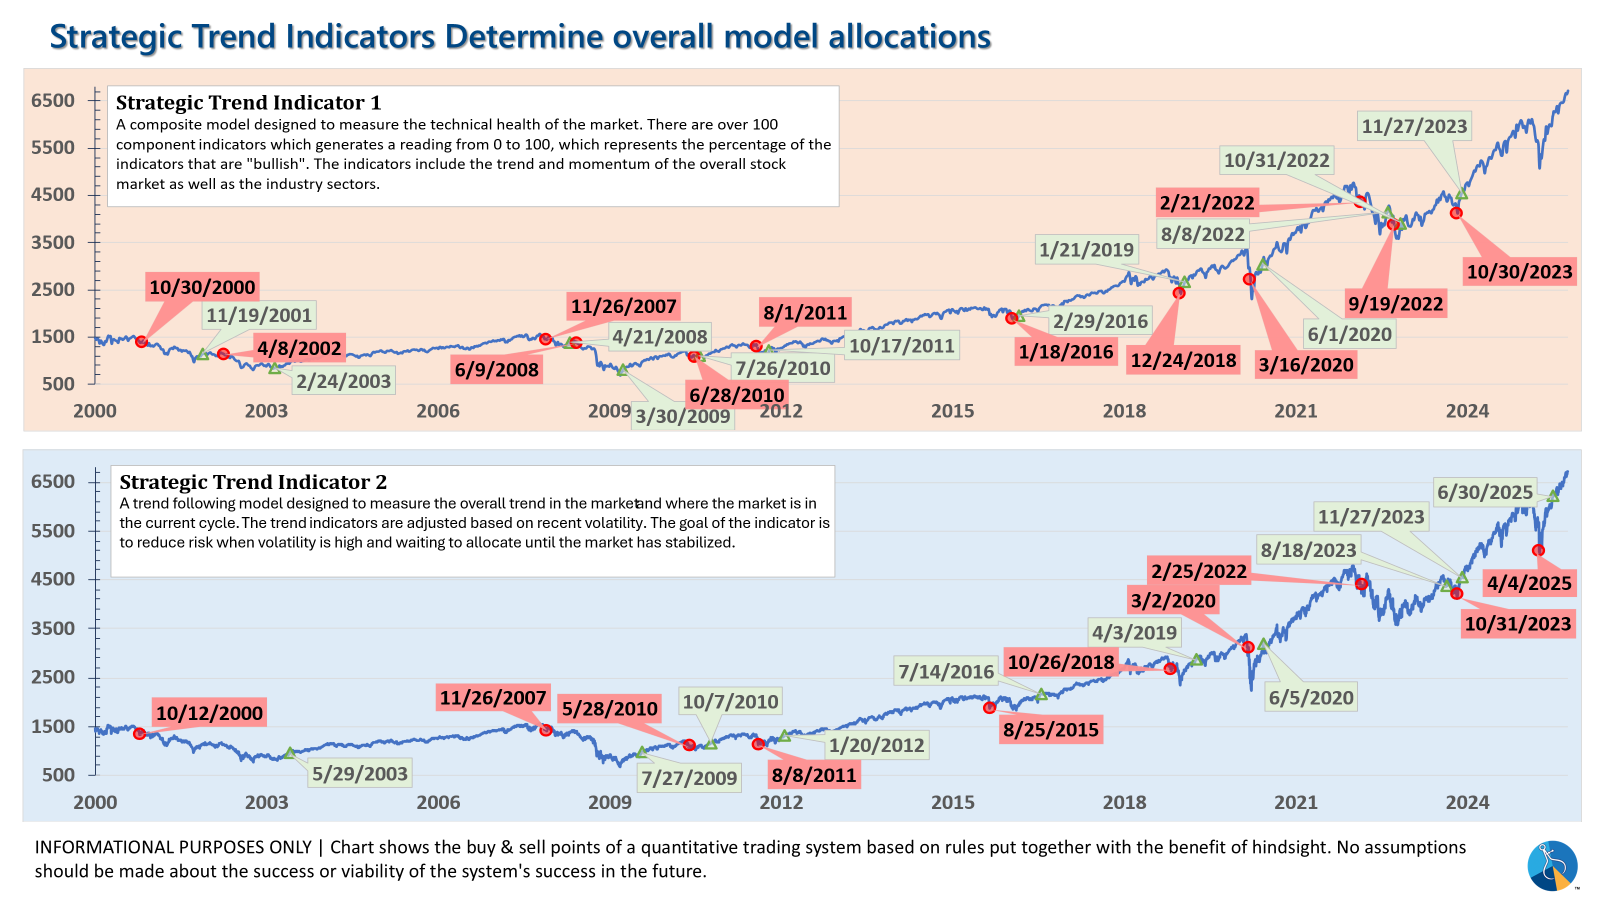
| Strategic | Slight under-weight | Trend overlay shaved 10 % equity in April -- added 5% back early July |
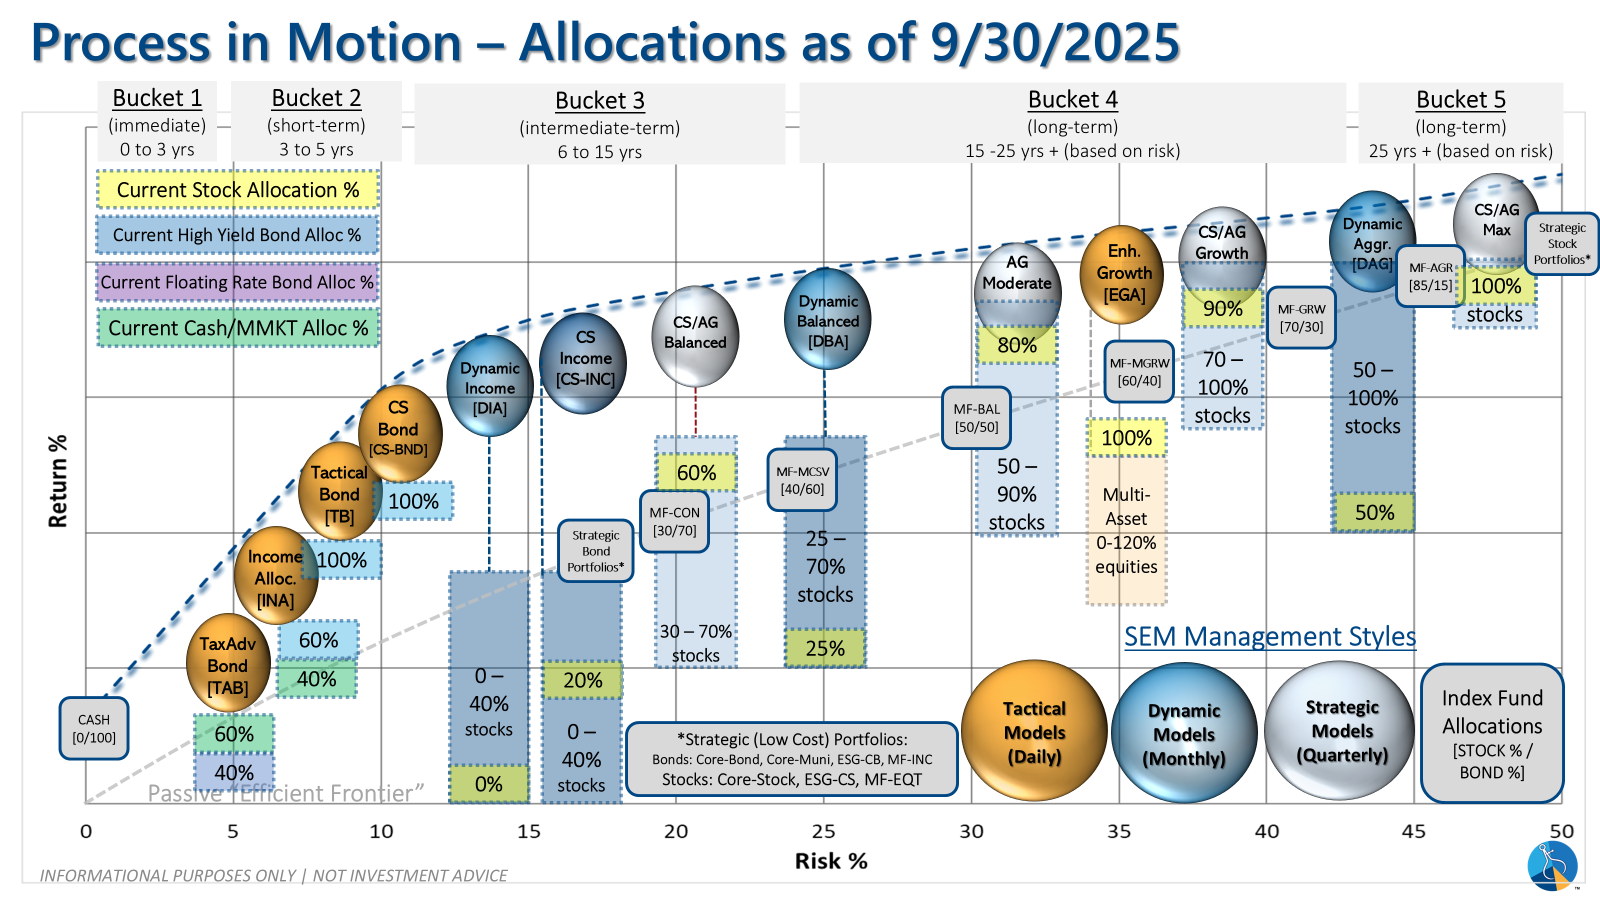
SEM deploys 3 distinct approaches – Tactical, Dynamic, and Strategic. These systems have been described as 'daily, monthly, quarterly' given how often they may make adjustments. Here is where they each stand.
Tactical (daily): The high yield system has been invested since 4/23/25 after a short time out of the market following the sell signal on 4/3/25.
Dynamic (monthly): The economic model went 'bearish' in June 2025 after being 'neutral' for 11 months. This means eliminating risky assets – sell the 20% dividend stocks in Dynamic Income and the 20% small cap stocks in Dynamic Aggressive Growth. The interest rate model is 'bullish' meaning higher duration (Treasury Bond) investments for the bulk of the bonds.
Strategic (quarterly)*: One Trend System sold on 4/4/2025; Re-entered on 6/30/2025
The core rotation is adjusted quarterly. On August 17 it rotated out of mid-cap growth and into small cap value. It also sold some large cap value to buy some large cap blend and growth. The large cap purchases were in actively managed funds with more diversification than the S&P 500 (banking on the market broadening out beyond the top 5-10 stocks.) On January 8 it rotated completely out of small cap value and mid-cap growth to purchase another broad (more diversified) large cap blend fund along with a Dividend Growth fund.
The * in quarterly is for the trend models. These models are watched daily but they trade infrequently based on readings of where each believe we are in the cycle. The trend systems can be susceptible to "whipsaws" as we saw with the recent sell and buy signals at the end of October and November. The goal of the systems is to miss major downturns in the market. Risks are high when the market has been stampeding higher as it has for most of 2023. This means sometimes selling too soon. As we saw with the recent trade, the systems can quickly reverse if they are wrong.
Overall, this is how our various models stack up based on the last allocation change:
Curious if your current investment allocation aligns with your overall objectives and risk tolerance? Take our risk questionnaire


