
I'm traveling this week and over the next several weeks will be speaking at some conferences to give our assessment of the economy, markets, and our "outlook" for the year ahead. Long-time readers know that we do not make forecasts (since we follow the data and the data will change), but we will help frame the current situation by looking at similar points in time to help attendees prepare for what could be a very interesting 12-15 months.
Government Spending: Facts vs. Fiction
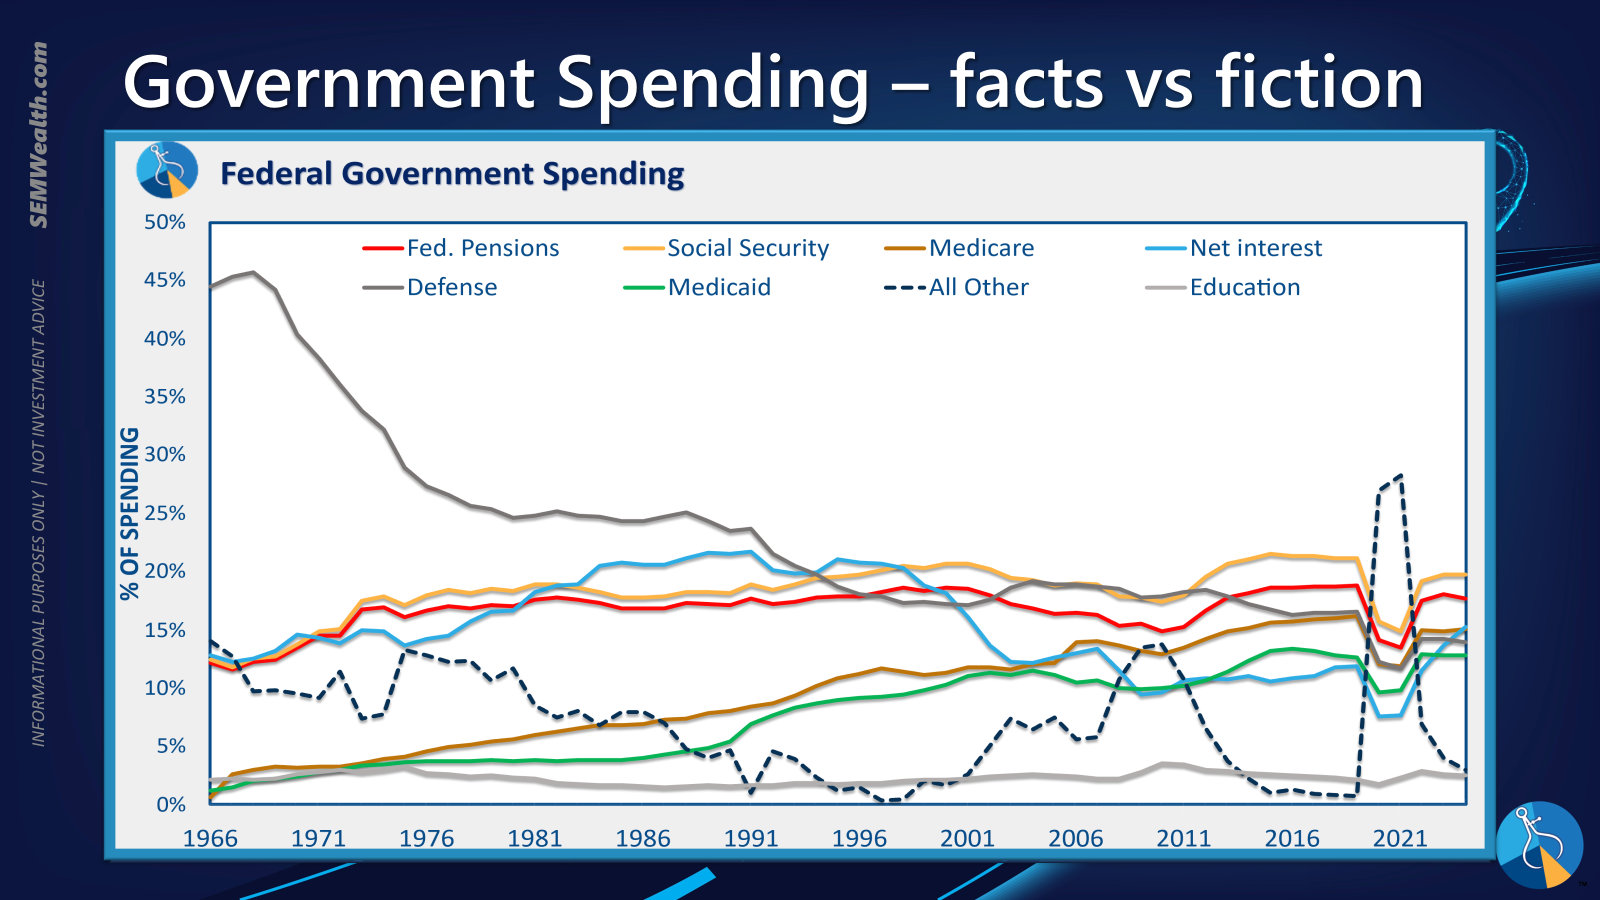
Obviously the key topic is the on-going government shutdown. I realize I won't be able to put the spending cat back int the bag since both sides have approved massive legislation over the past 10+ years that makes it difficult to balance the budget. What I do want to (again) point out is the silliness of both sides fighting over relatively minor issues while real Americans suffer. Here's a series of charts showing the percentage of our budget spent in various categories.
The first is the top 5 budget items (plus net interest) plus "all other" spending.
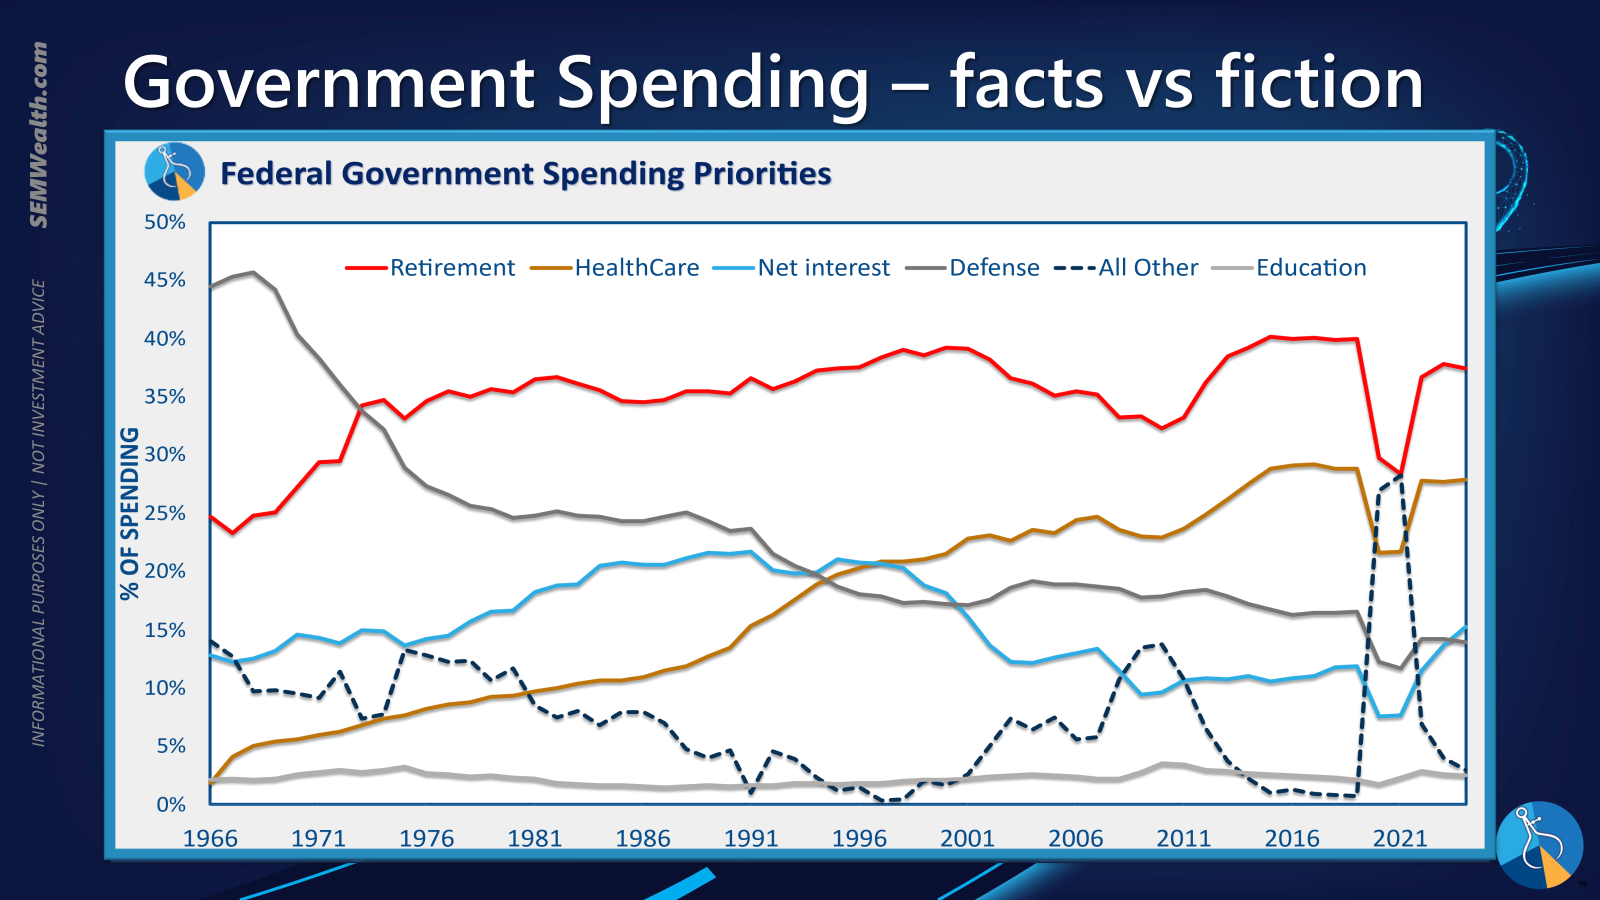
Next, I rearranged the details into some easier to understand categories.
Finally, to make it easy to understand where most of our money is going (and where it isn't), I broke it down this way.
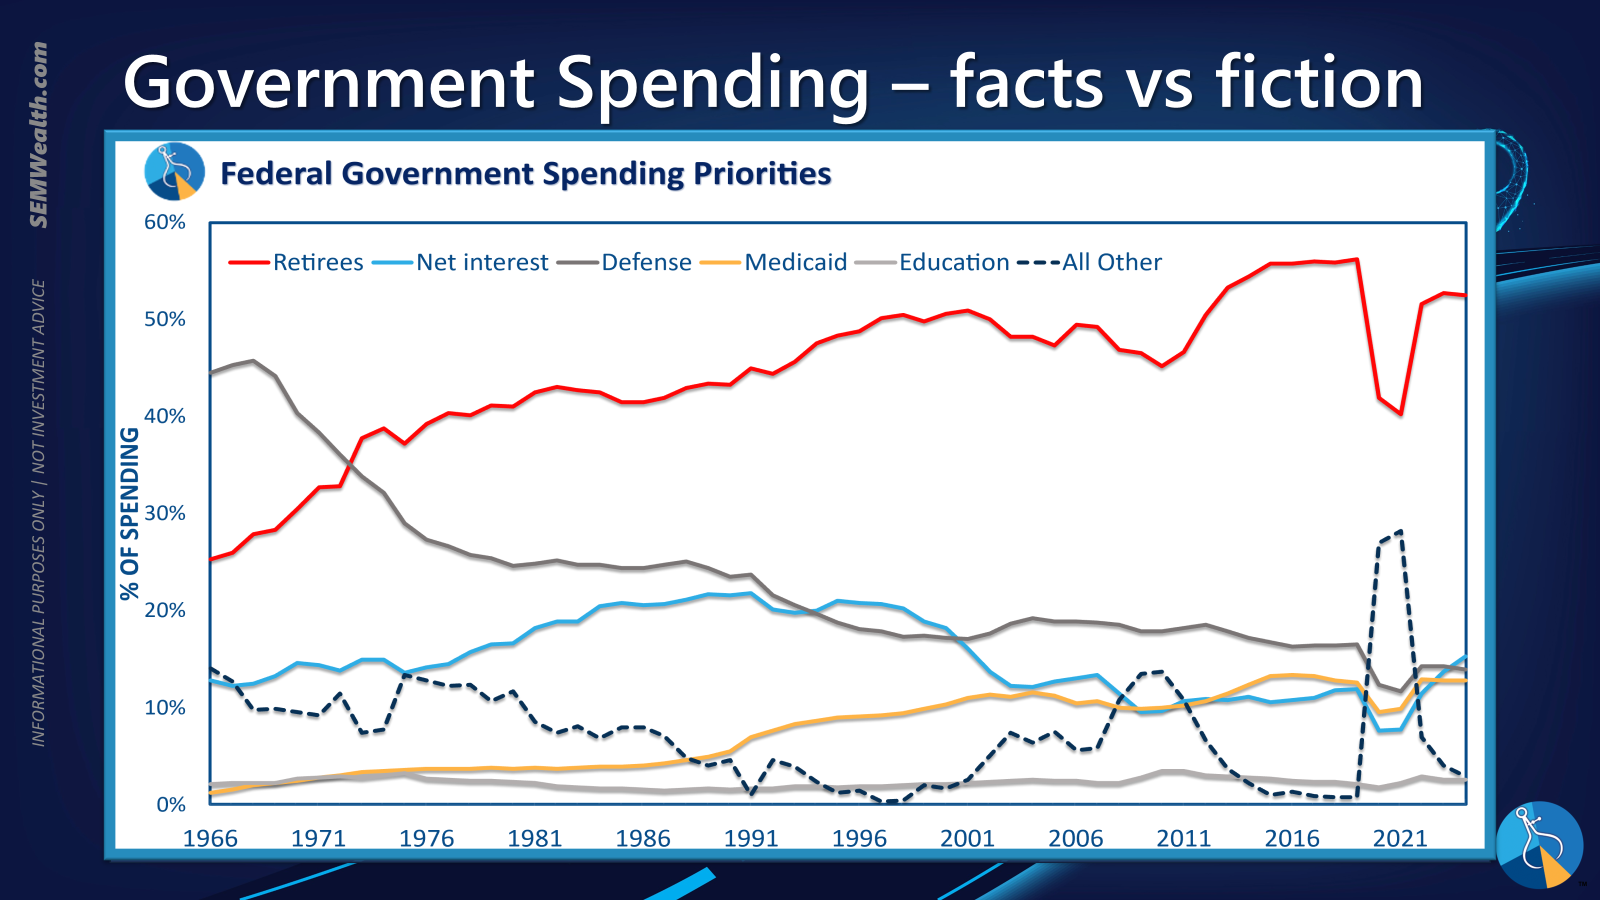
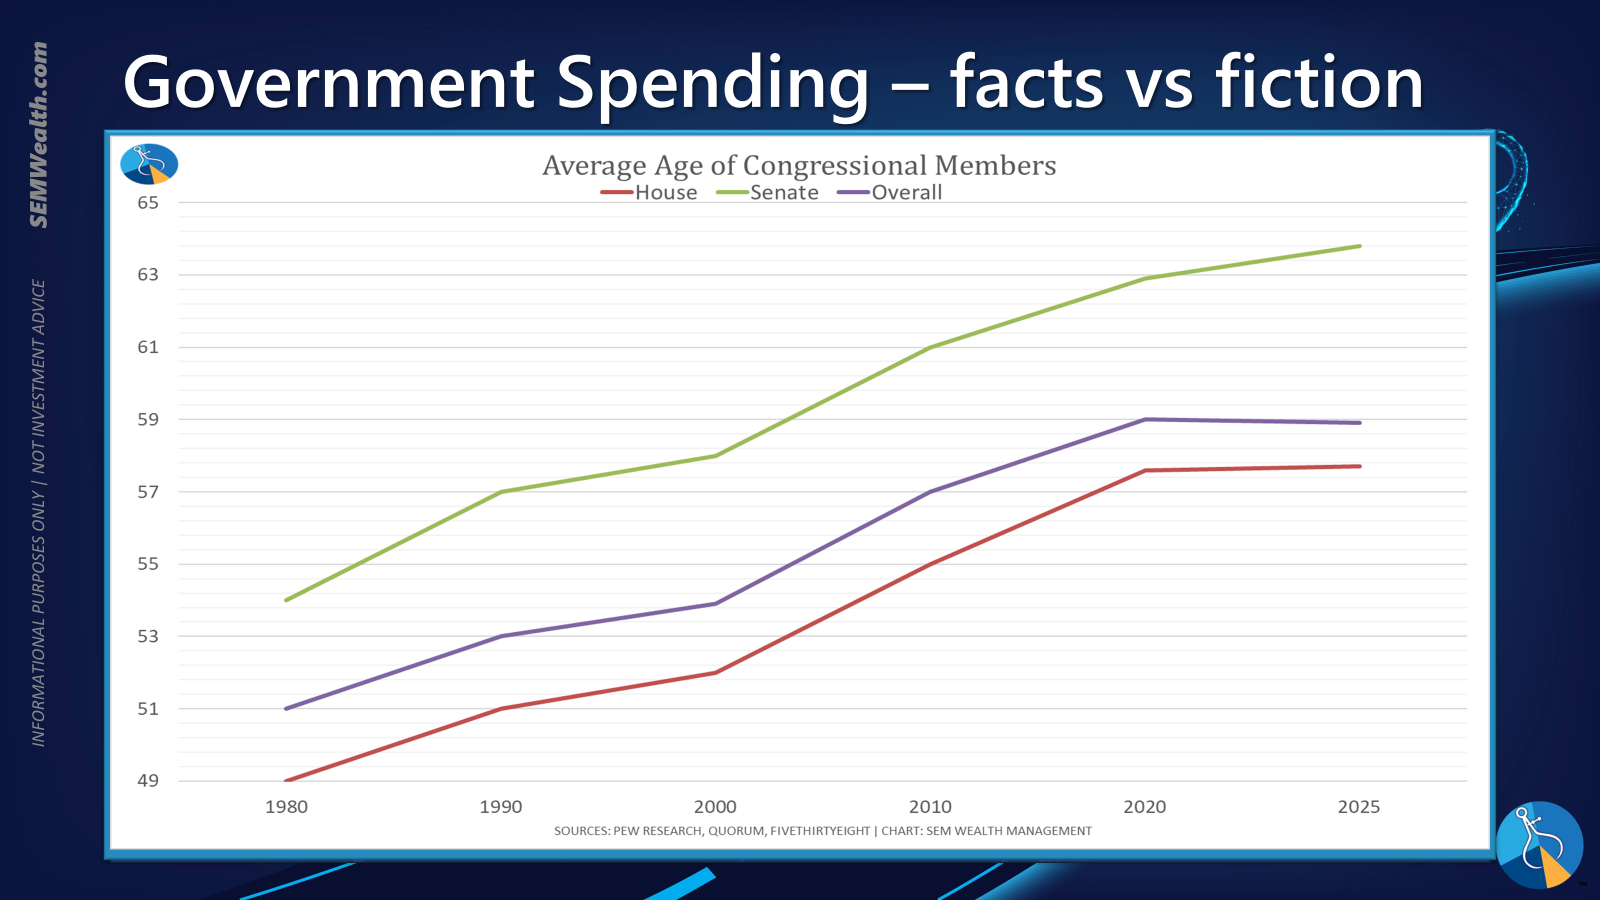
Over half of our spending is going to retirees. I don't know if there is a correlation, but here is another chart I added after seeing this data. While Congress fights over relatively minor items (as a percentage of overall spending), they continue to ignore the real reason we have such a gigantic deficit (which will only get worse).
Trade War & Tariffs
Another key topic this week was the on-again, off-again trade war. The President is confident he'll be able to reach an agreement with China, which was enough to spark another tech-fueled rally. At the same time, added sanctions on Russian oil and cancellation of trade talks with China led to a spike in energy prices.
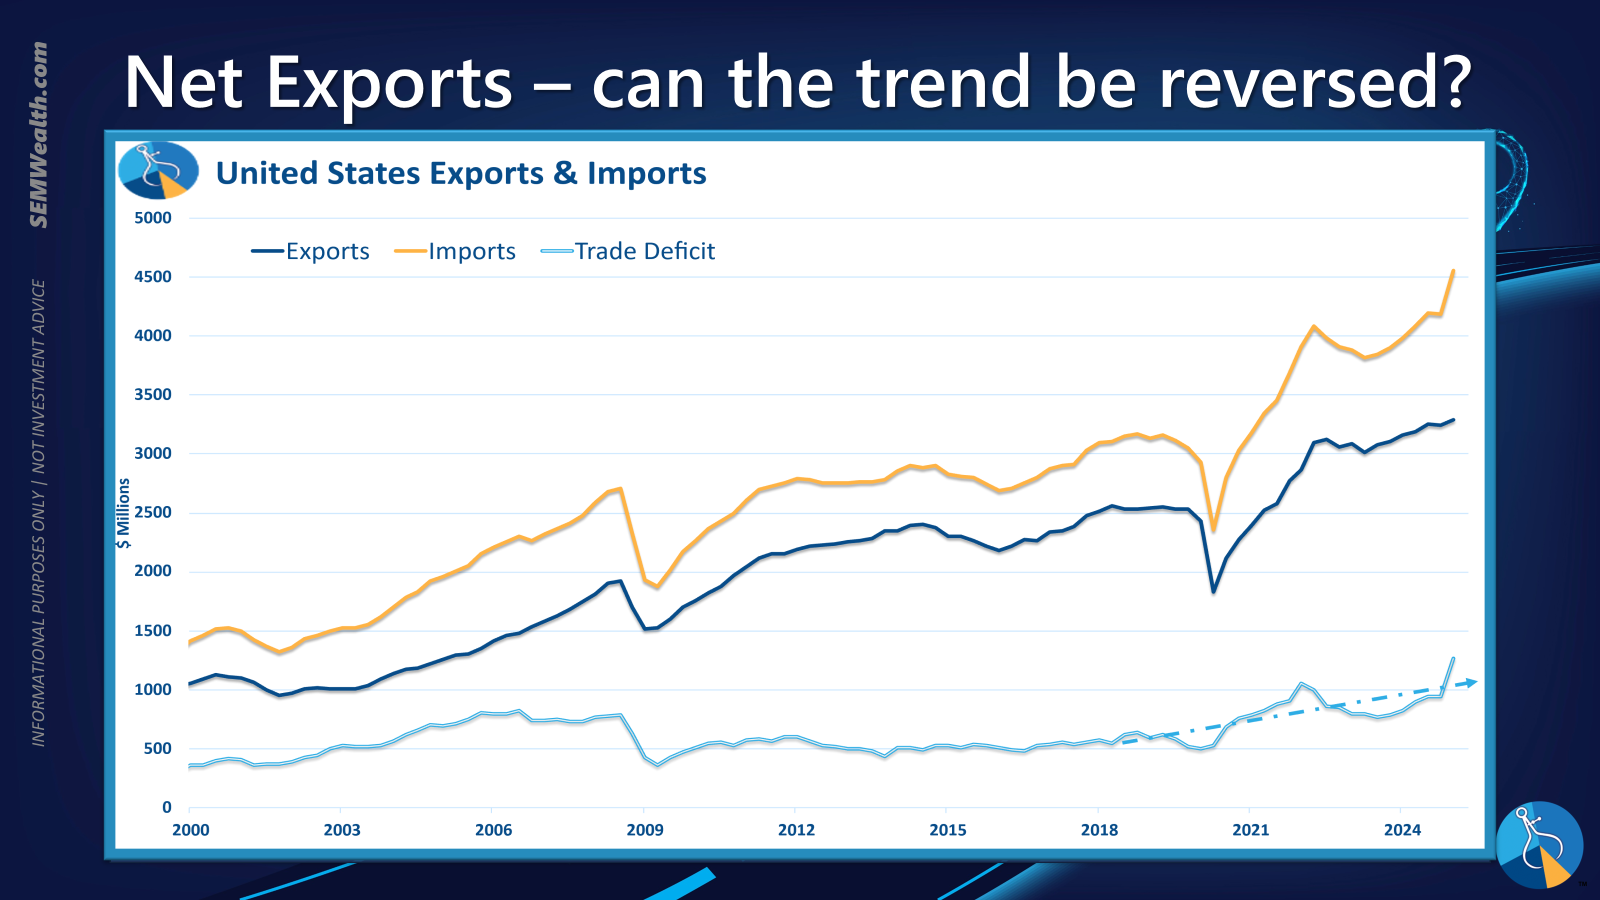
It is far too early to know if these actions will pay off. What we do know is through June our trade deficit increased, mostly due to a flood of imports at the start of the year to get ahead of tariffs.
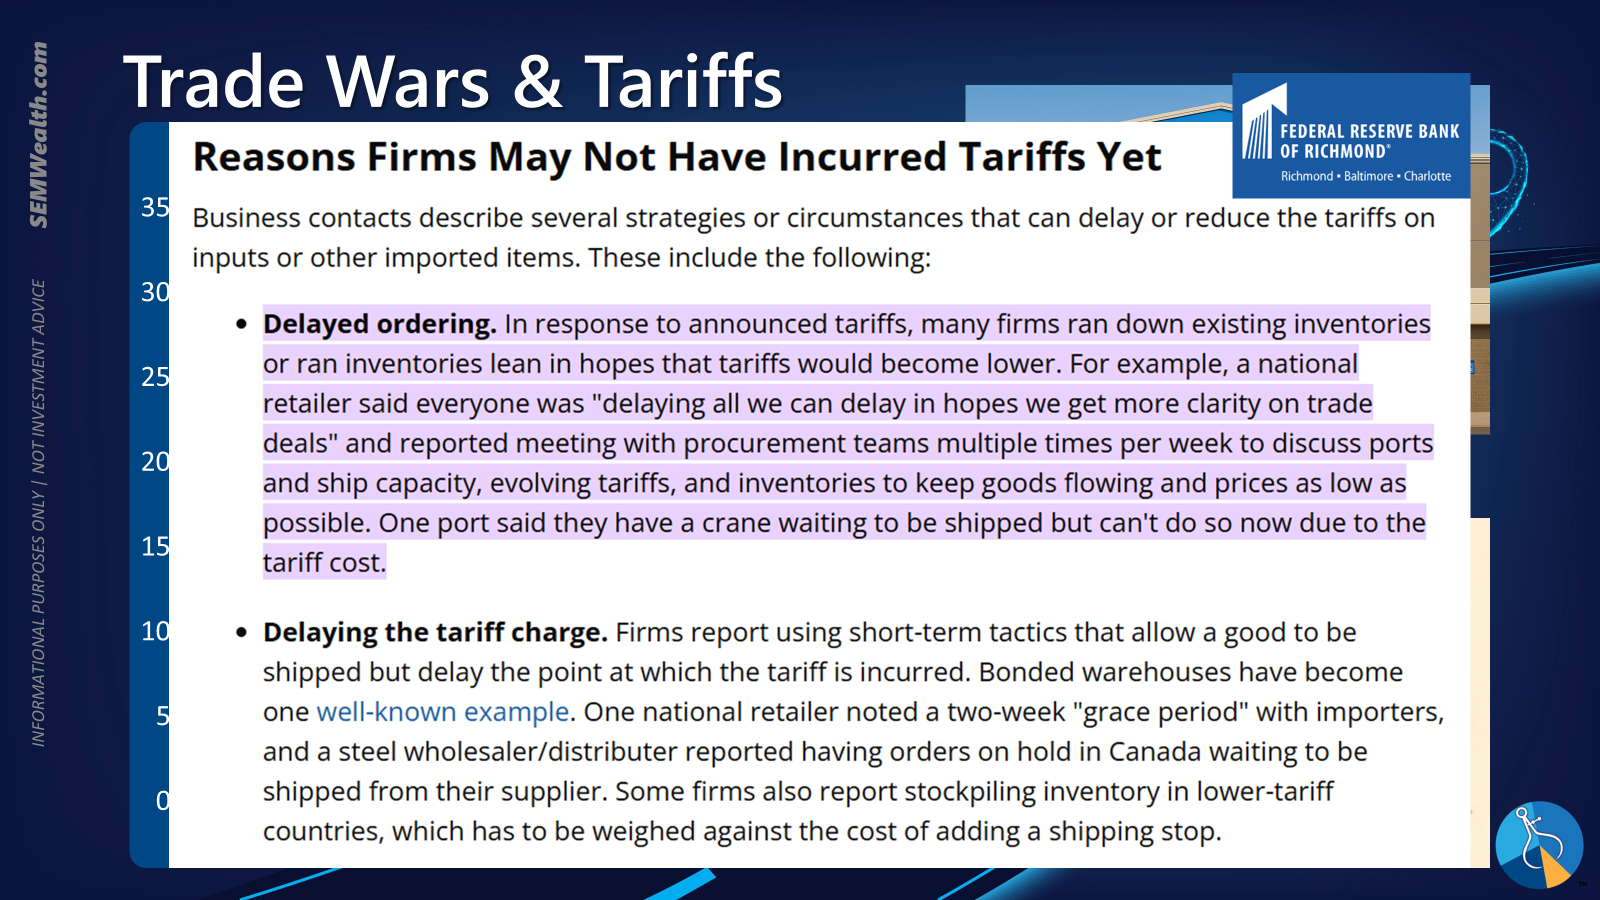
I included this section of the Richmond Fed's latest economic summary posted last week that reminds us we have yet to see the real impact of the tariffs.
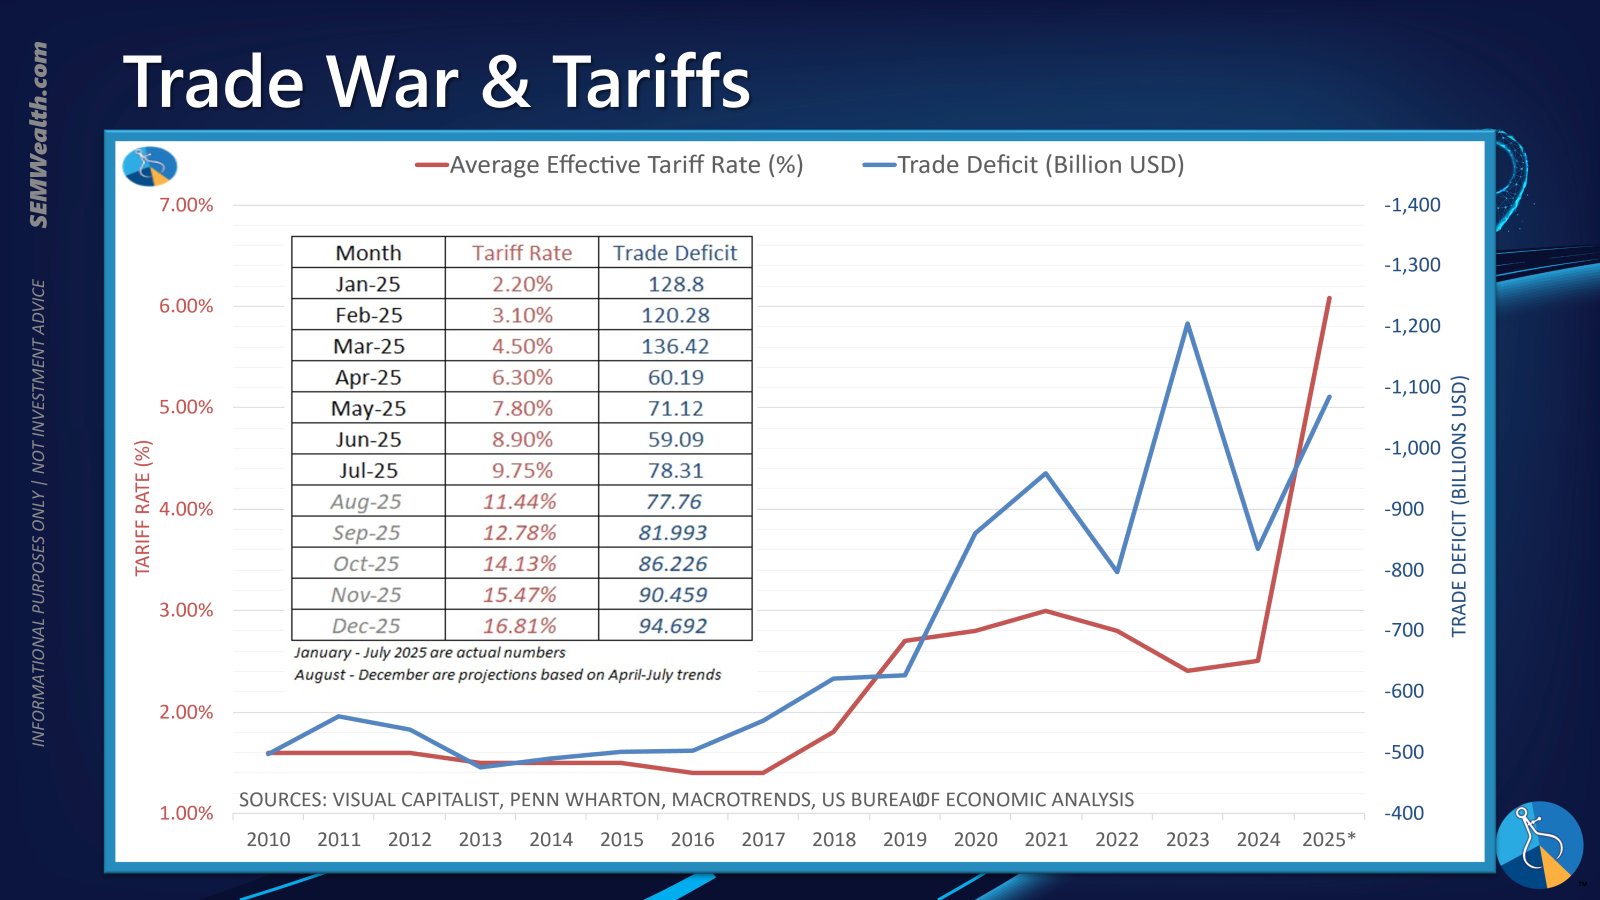
I also took a look at what we've seen happen since 2010 (really 2018 which was when we saw the first meaningful rise in tariffs since the Regan administration.)
AI & Productivity Growth
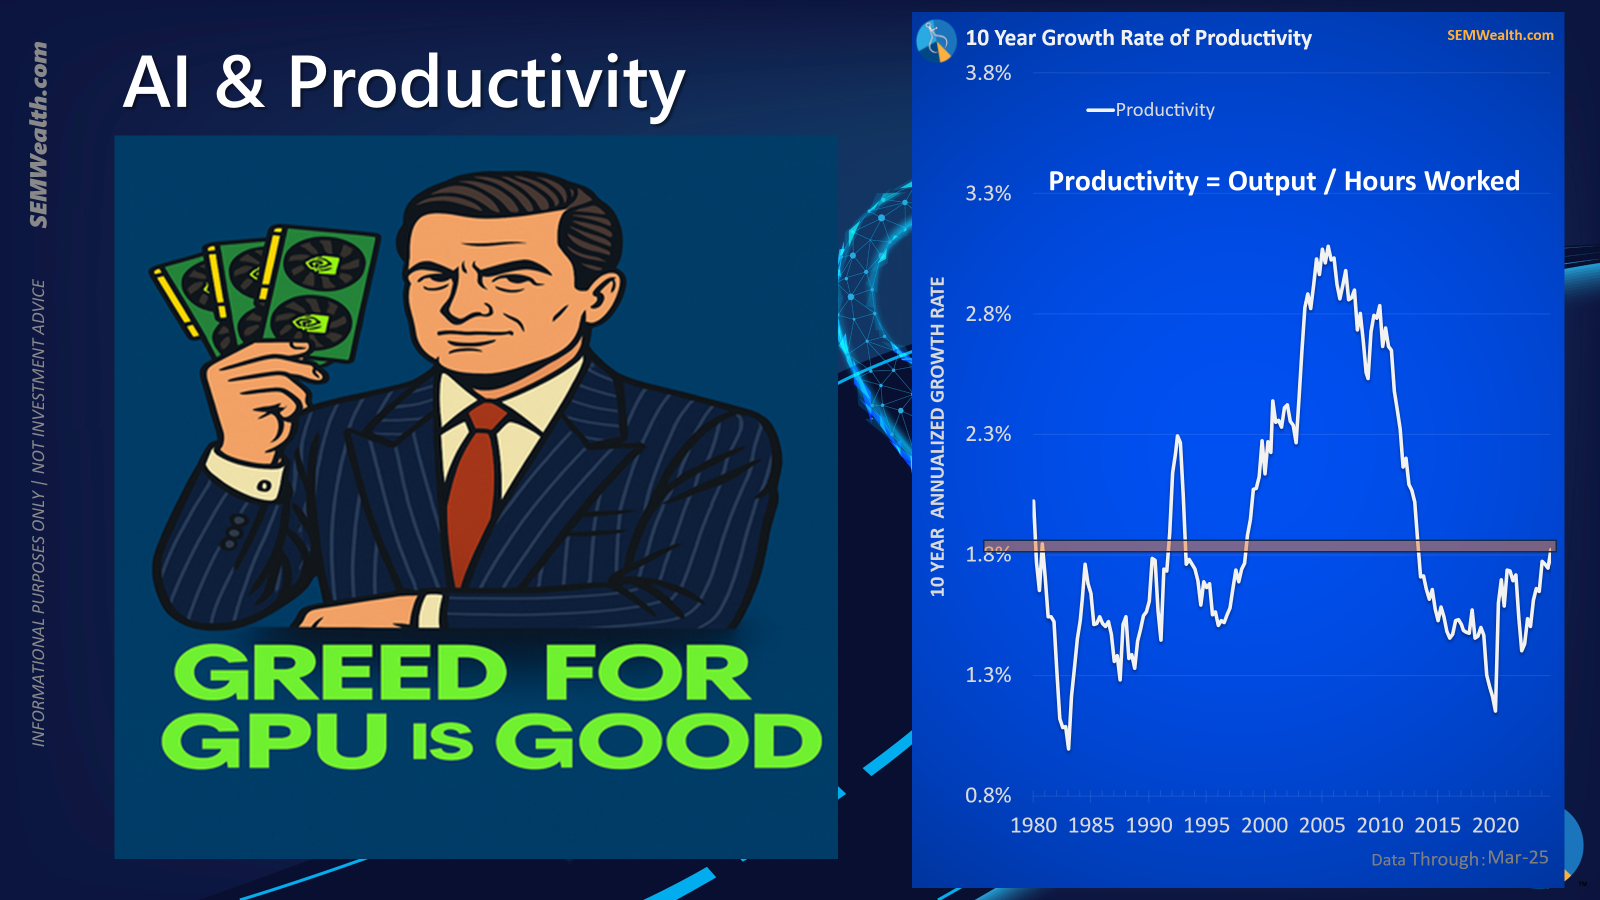
Seemingly every day now we get some sort of AI related news. One thing I will be discussing as we look ahead is whether or not we will see a big enough boost in productivity to justify the spending we have seen thus far.
We most certainly are seeing a tremendous amount of money going towards AI. Various Wall Street estimates peg the amount just this year between 4-5% of GDP, adding an astounding 1-1.5% to annual growth this year. Considering we are growing barely above a 2% rate, it is safe to say AI is keeping the economy afloat.
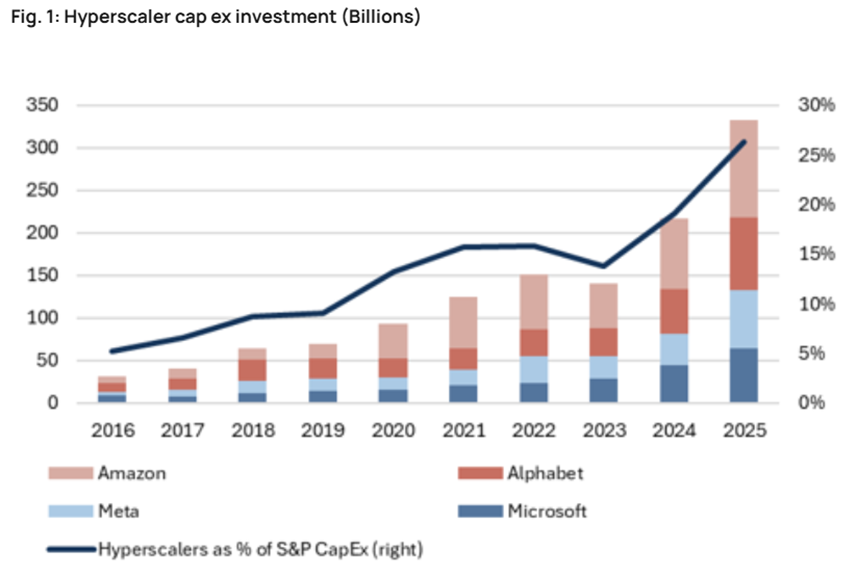
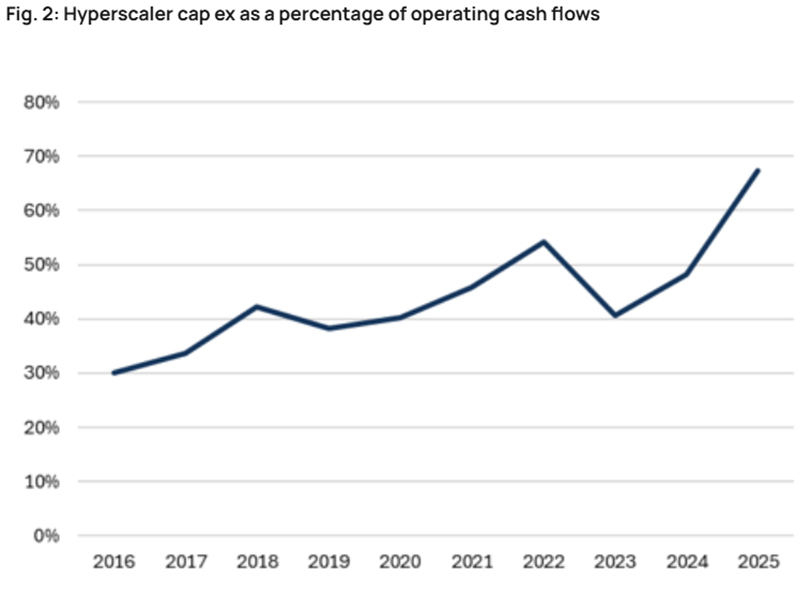
Most of that spending is coming from companies identified as "hyperscalers" – those pouring most of their operating cash flow into capital expenditures.
One thing I will discuss is my "old man" story about the technology bubble. Most people believe it was the "dot-com" stocks which caused the bubble, but it was the entire buildout of the internet infrastructure, starting with affordable PCs in the early 90s and moving on to high speed internet by the end of the decade. The "worldwide fiber optic" buildout was supposed to fuel a "new era" making the valuations and growth rates sustainable. The last few years of the 90s we saw the advent of "vendor financing" and "leasing" deals to assist with the buildout. As we know now when companies were not able to convert their massive capital expenditure spending into revenue and profits, the entire system crumbled.
Did we see a productivity boom? Absolutely! Look at the chart on the right. Did it prevent the collapse of most of the stocks creating the boom? Unfortunately not. Was it sustainable? Again, unfortunately not.
Spectacular Growth Ahead?
When asked about what I think 2026 will look like I'm brought back to the 90s. Given the enthusiasm we are seeing, we most certainly could be in the early(ish) stages of a multi-year run in stocks. This could be like 1997, 1998, or even 1999. Valuations were stretched and expectations were high going into 1999 but that didn't prevent the NASDAQ 100 from doubling and the S&P from gaining nearly 40%. Oh by the way, the Fed was also easing in 1999 (to help with Y2K stress). With a Fed that will likely be VERY EASY next year when Chair Powell's term ends and he's replaced with a Trump Administration friendly member, I can see a phenomenal year ahead.
However, we could also see a collapse as the expectations are far too high, the economy is teetering towards recession (as noted earlier most of our growth is AI capital expenditures), and valuations are at or near all-time highs, even exceeding the 1999 peak. People forget 2000 had high expectations and earnings actually held up relatively well.
Here's a chart of earnings growth that helps put things in perspective.
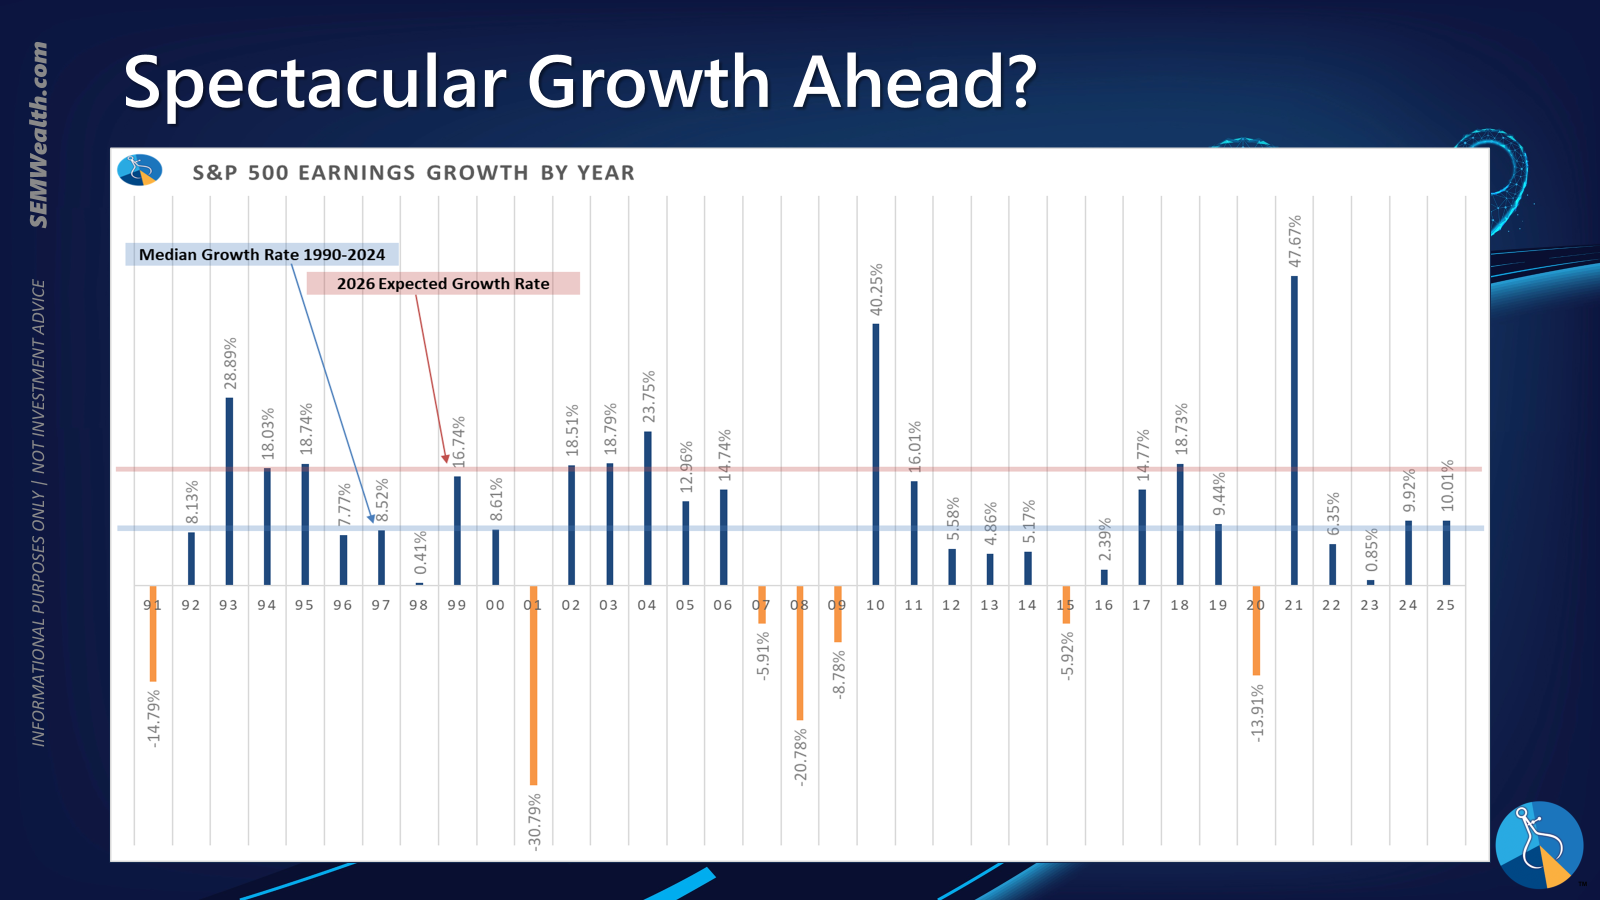
Analysts are expecting growth DOUBLE the long-term average and to hit rare territory only experienced a few times in the past 35 years. Can it happen, sure! What if it doesn't? That's something everyone needs to be prepared to answer.
Don't forget about the Fed
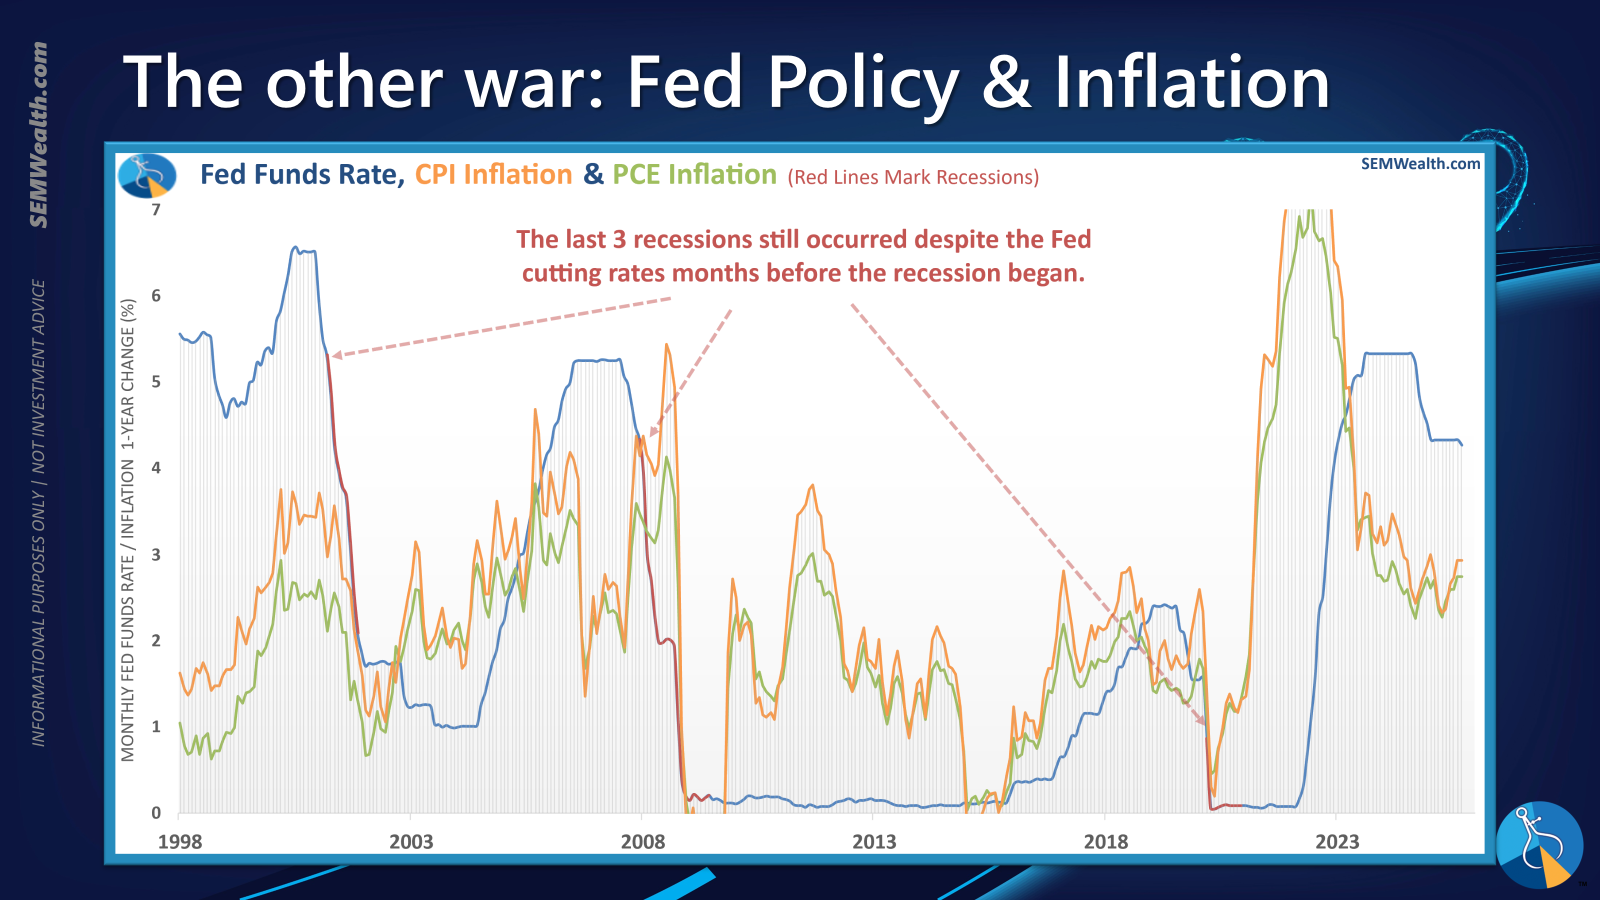
Finally, two weeks ago a skeleton staff at the BLS was called back into service to give us the September CPI number last Friday. (This was needed so the Social Security Administration could finalize the cost of living adjustment (COLA) for 2026.) Unsurprisingly CPI came in lighter than expected. This should allow the Fed to cut rates again on Wednesday of this week.
Don't forget, though, just because the Fed cuts rates it does not mean we won't still go into a recession as the data reminds us again and again.
Toby's Take
A look at the top stories from the Wall Street Journal as compiled by our intern, Toby.
10/20/2025 - Amazon Web Services Outage Hits Dozens of Major Websites, Including Facebook, Snapchat - WSJ
Amazon Web Services had a massive internet outage that had all sorts of businesses shut down for a long enough period of time to possibly cause billions lost in sales. Things like social media apps, day trading, payment apps, video games, and even airline apps were down. We can certainly expect Amazon to lose value because of this, but also companies that lost sales or had customers experiencing the shutdown could be hurt. With Amazon getting it fixed things should bounce back, so we shouldn't jump at this too quickly or emotionally.
10/21/2025 - How Sam Altman Tied Tech’s Biggest Players to OpenAI - WSJ
Open AI has gotten very good at making sure it is getting the best of deals. Through many talks with Sam Altman, many Silicon Valley giants have either made deals with Open AI or are in the works of making a deal. Everybody there seems to just want to be an investor in Open AI even though they aren't even close to turning a profit. Regardless, there is a trend of these companies trying to "one-up" each other to get their hand in Open AI. The WSJ is saying that Open AI is "too big to fail" so we need to be ready for Open AI to hopefully become publicly traded so that we could possibly jump in ASAP. In the meantime we can focus on these trends of certain companies stocks jumping after making deals with Open AI like Oracle, Nvidia, AMD, and Broadcom.
10/22/2025 - Cable Giant Charter Lays Off 1,200 Workers - WSJ
Charter, a cable and broadband company, is laying off 1% of its 95,000 employees. This is happening because of a major drop in subscribers. Drops like this have been happening with other companies like NBCUniversal and can be expected to happen with most pay-TV companies. We should keep this in mind when looking at models to maybe start slowly pulling out of these types of companies before they expect a major drop in stock price.
10/23/2025 - Exclusive | U.S. Lifts Key Restriction on Ukraine’s Use of European Long-Range Missiles - WSJ
A new update on the Russian/Ukrainian war has come out. The Trump administration lifted a restriction that blocked Ukraine from using some long-range missiles. This now allows Kyiv to increase attacks inside of Russia. This is another step the President is taking to put pressure on Moscow to end the war. Because of this we should expect the Patriot portfolio to go up in value, but more importantly we are getting closer to the light at the end of the tunnel with this war hopefully coming to an end soon!
10/24/2025 - China’s New Strategy for Trump: Punch Hard, Concede Little - WSJ
Chinese leader, President Xi, seems to have written a new "political playbook" on how to deal with President Trump. Xi is using Trump's own tactic, putting maximum pressure, against him. The most recent example of that is China's new restriction on rare-earths limiting the United States tech economy. They are set to meet next Thursday in South Korea. This meeting should hopefully bring a calm to the unpredictable trade war.
Market Charts
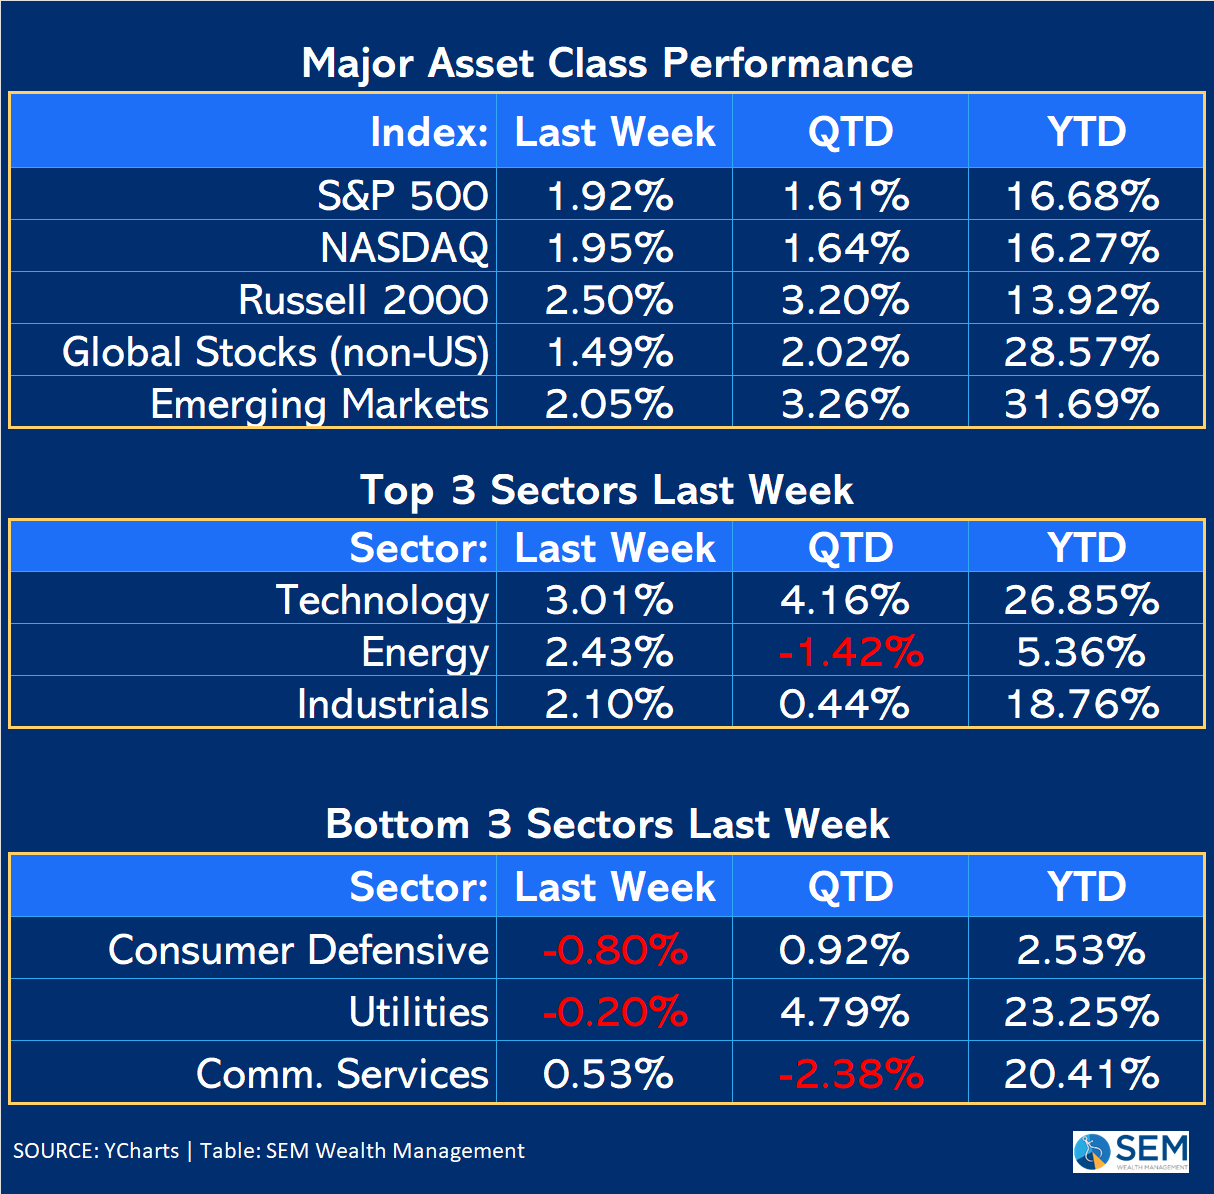
It was another fun week for investors, especially those with tech-heavy portfolios. Despite a mid-week, one-day sell-off, the S&P 500 gained nearly 2% for the week.
The bottom sectors highlight the tone last week — "we see no signs of a recession and even if we did, the Fed will save us." Is that true? For many people chasing stocks, it better be.
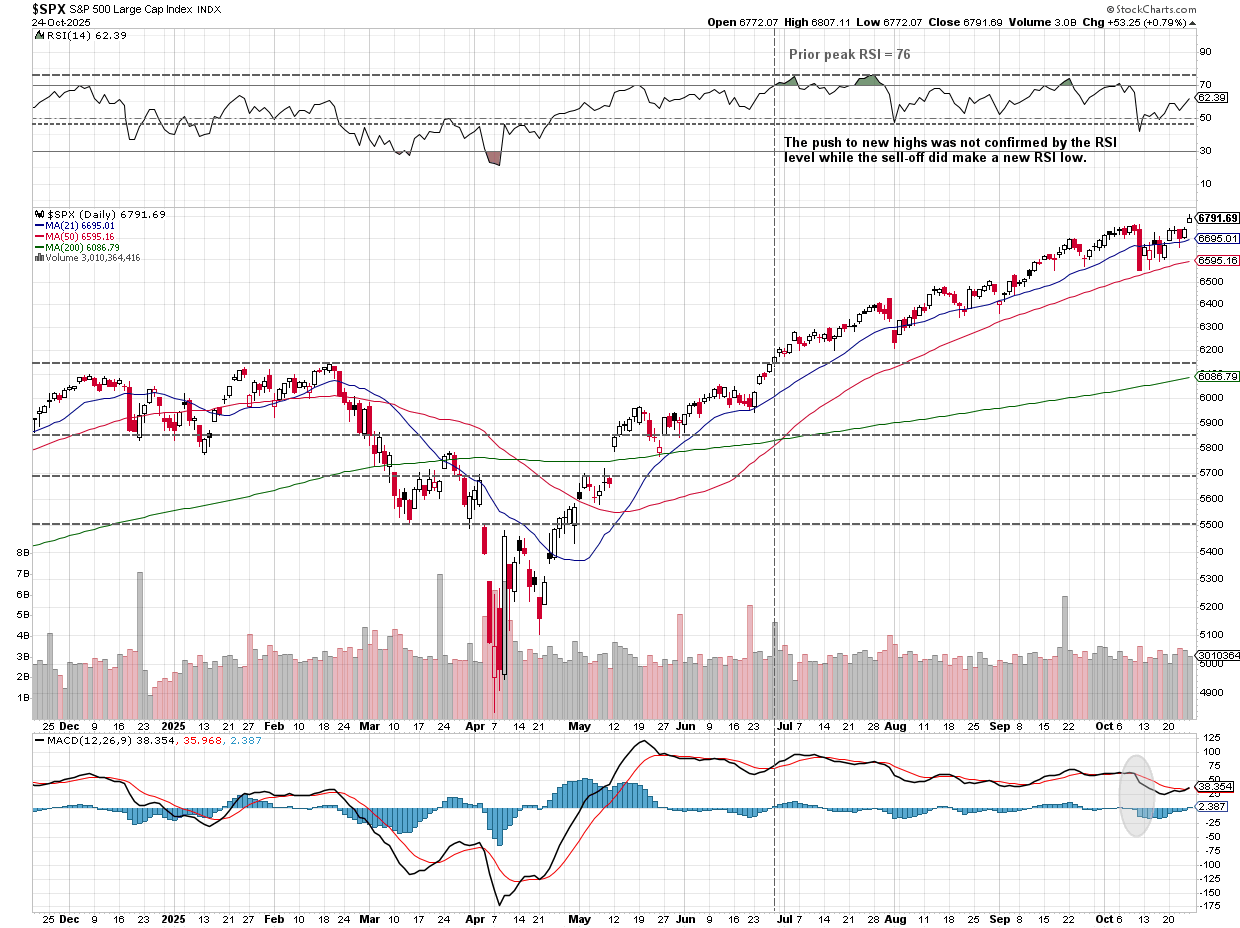
From a longer-term perspective, the uptrend remains in place, but we still have the lingering "non-confirmation" of the RSI index hanging over the market.
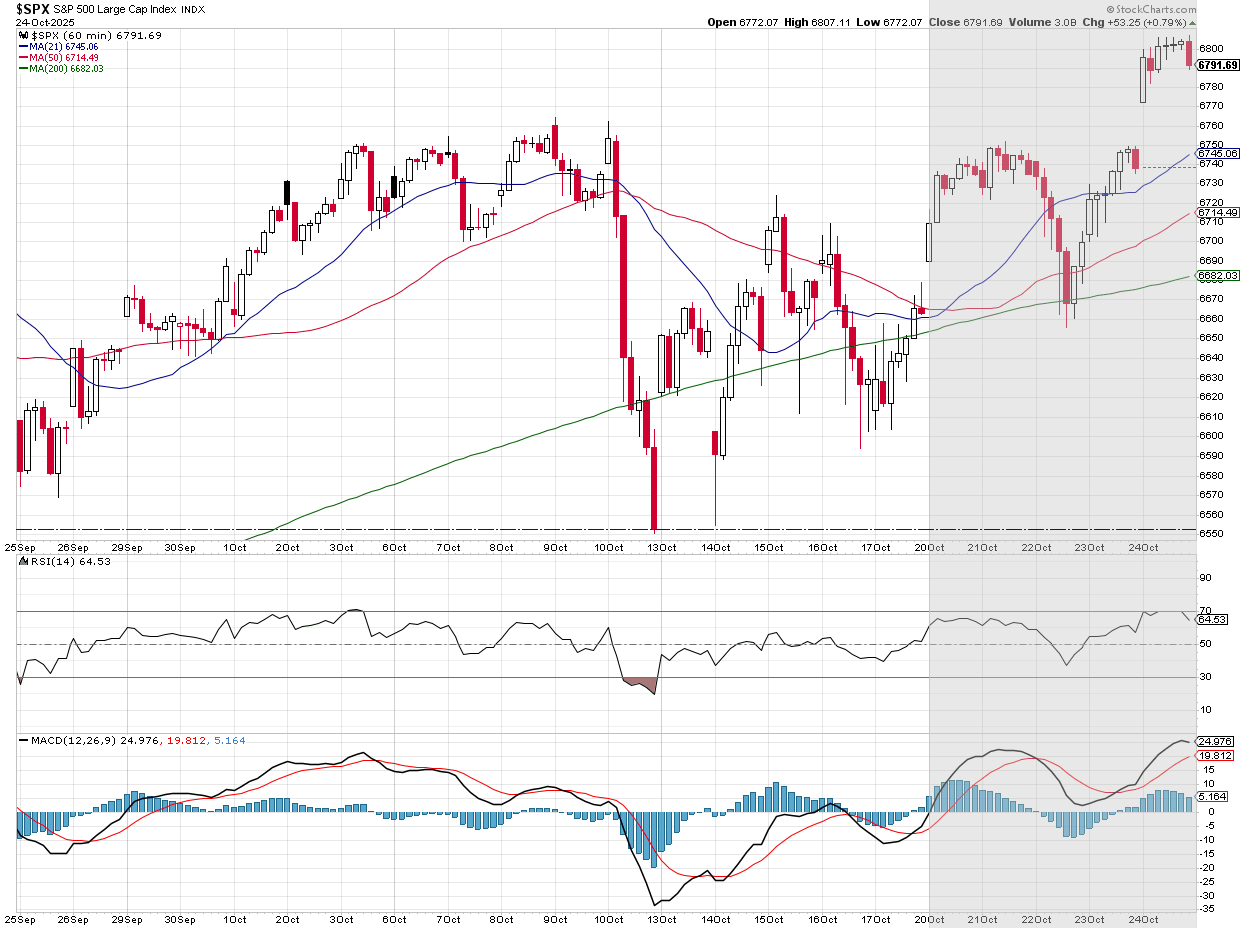
Regardless, the trend is still up and as we get set to turn the calendar out of October, we have what is historically two of the best months of stocks ahead.
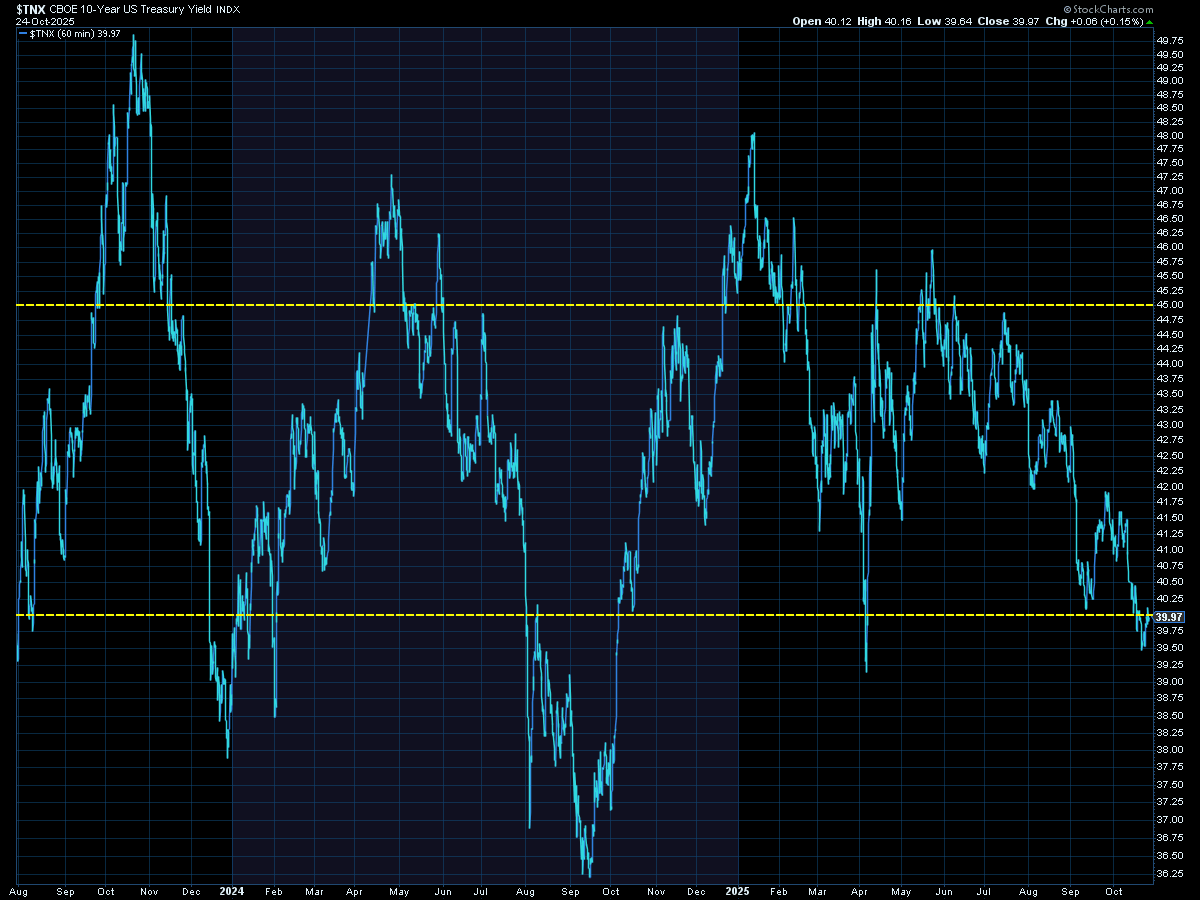
Turning to bonds, it was a quiet week as the yield curve ended about where it started across all maturities.
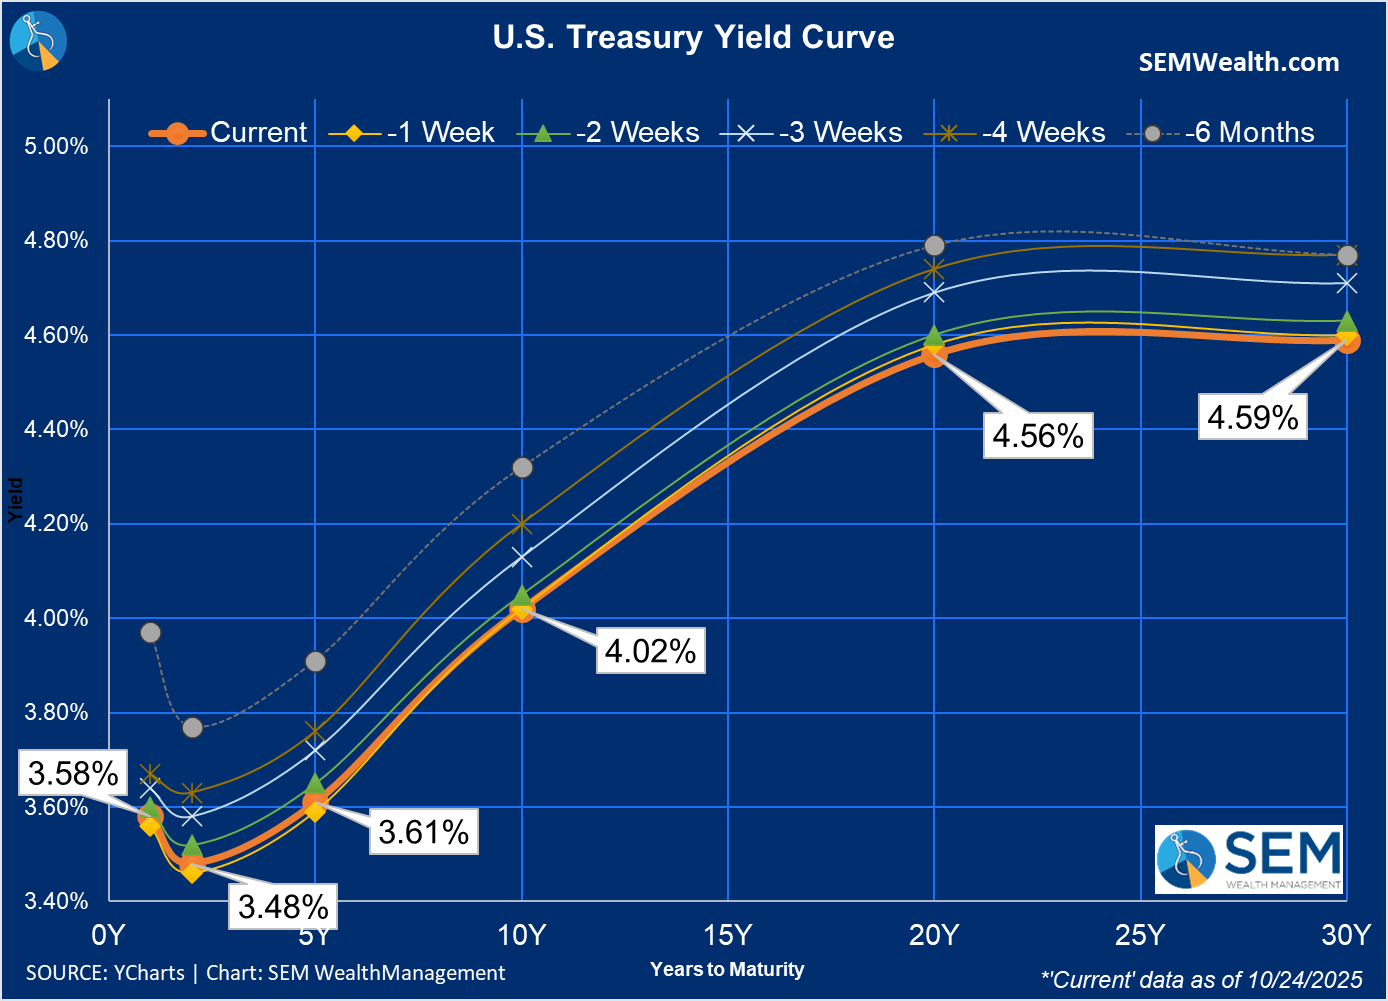
With bonds back to the bottom of the 4% band, it will be telling to see how the long-term bond market reacts to the Fed's decision this week.
SEM Market Positioning
| Model Style | Current Stance | Notes |
|---|---|---|
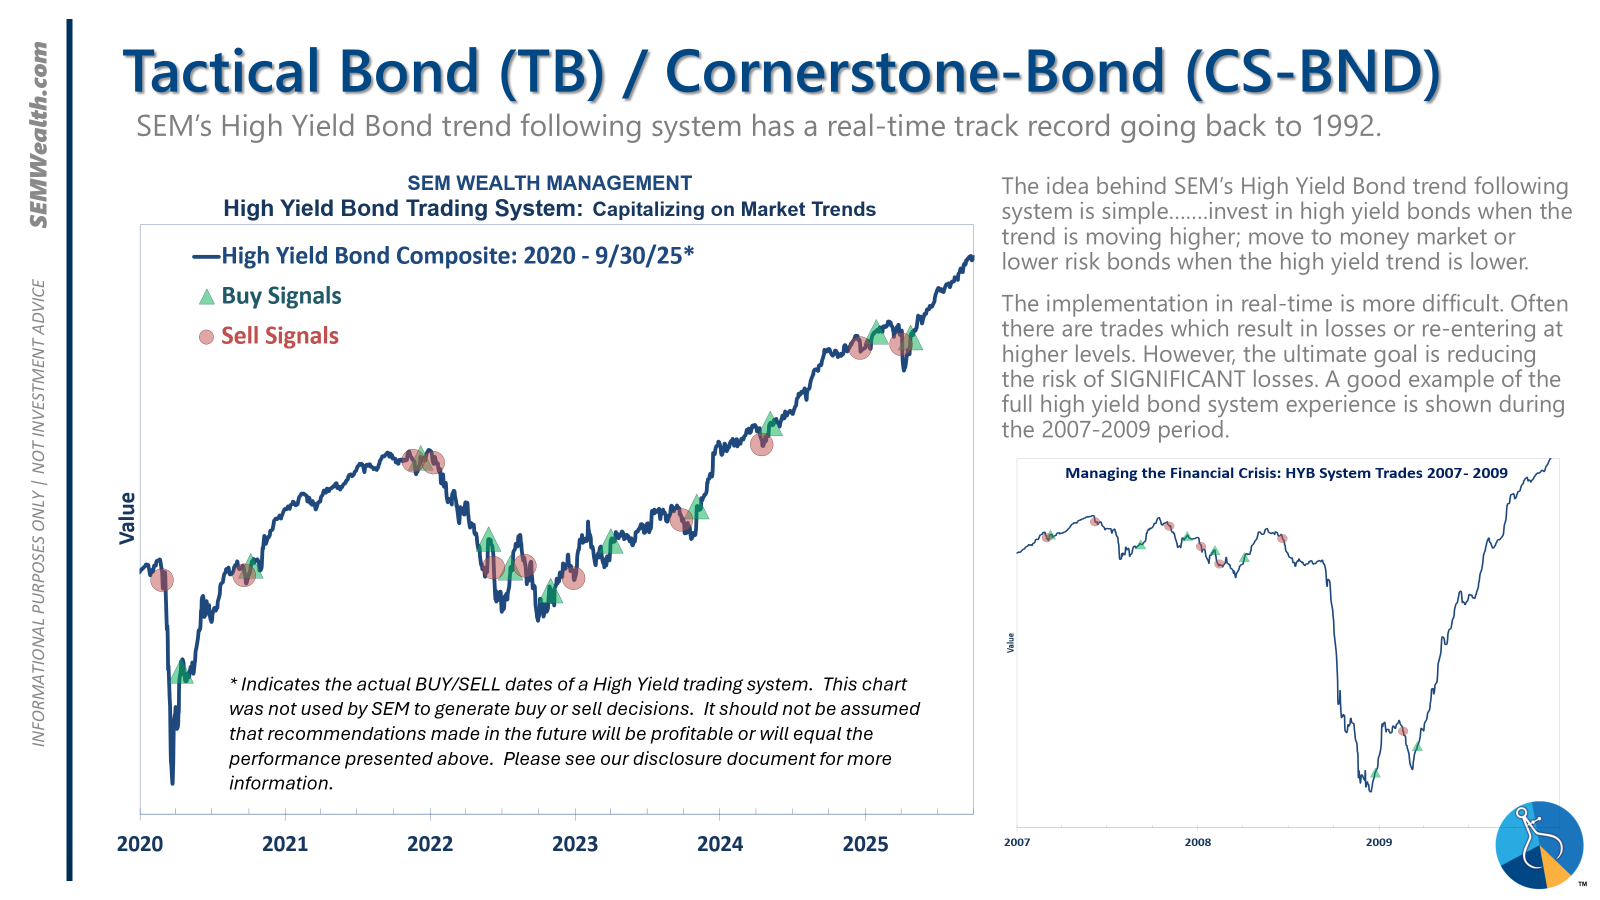
| Tactical | 100% high yield | High-yield spreads holding, but trend is slowing-watching closely |
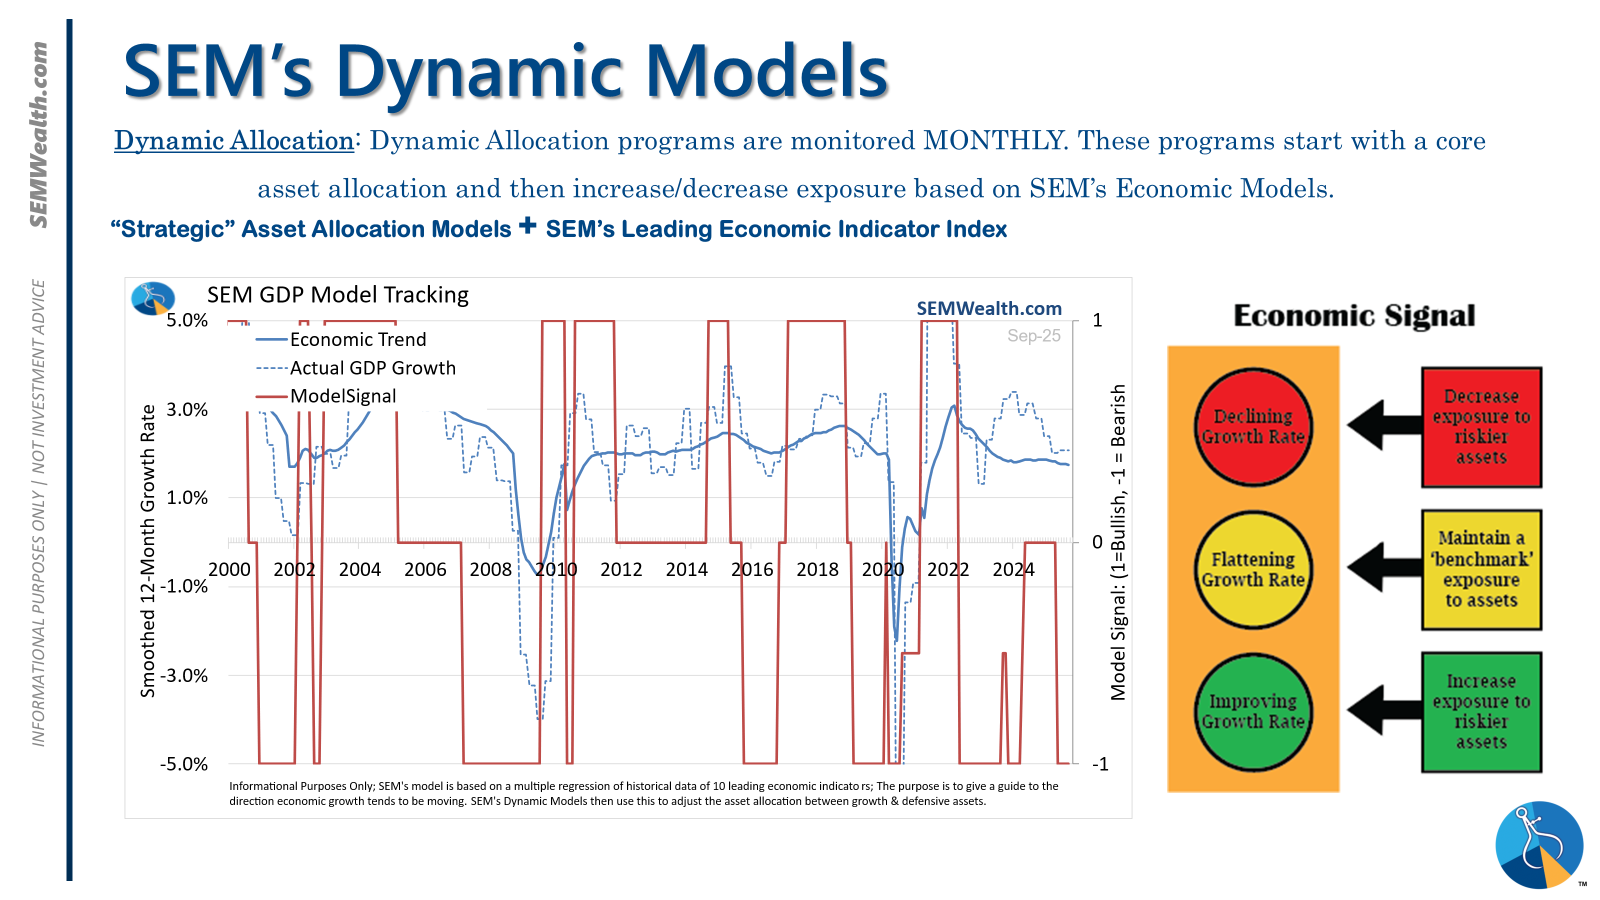
| Dynamic | Bearish | Economic model turned red – leaning defensive |
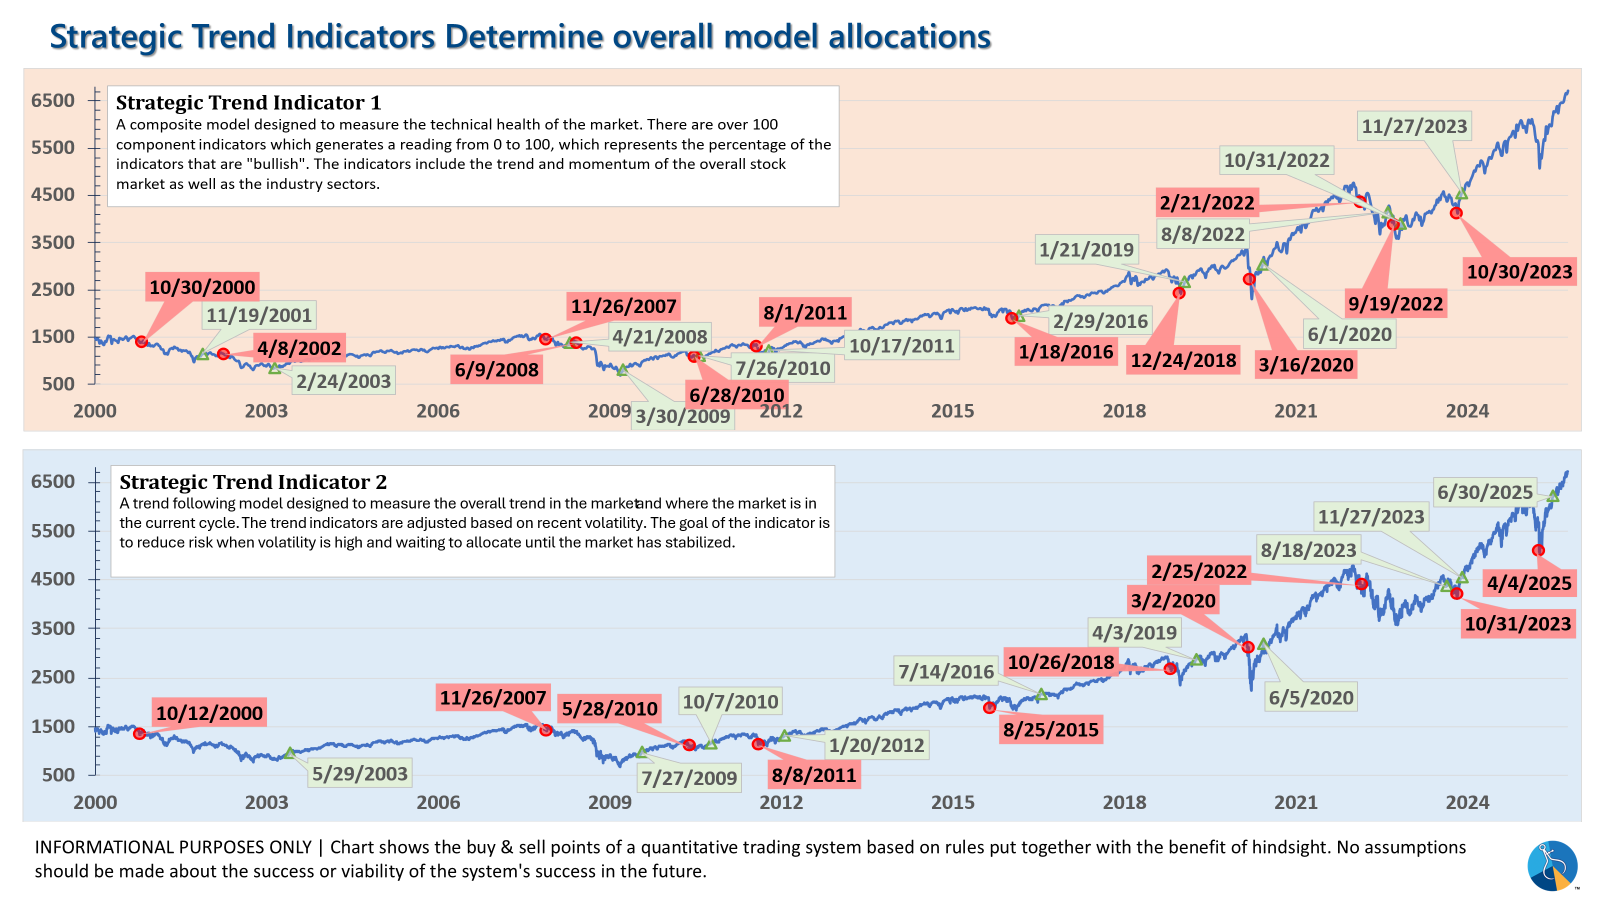
| Strategic | Slight under-weight | Trend overlay shaved 10 % equity in April -- added 5% back early July |
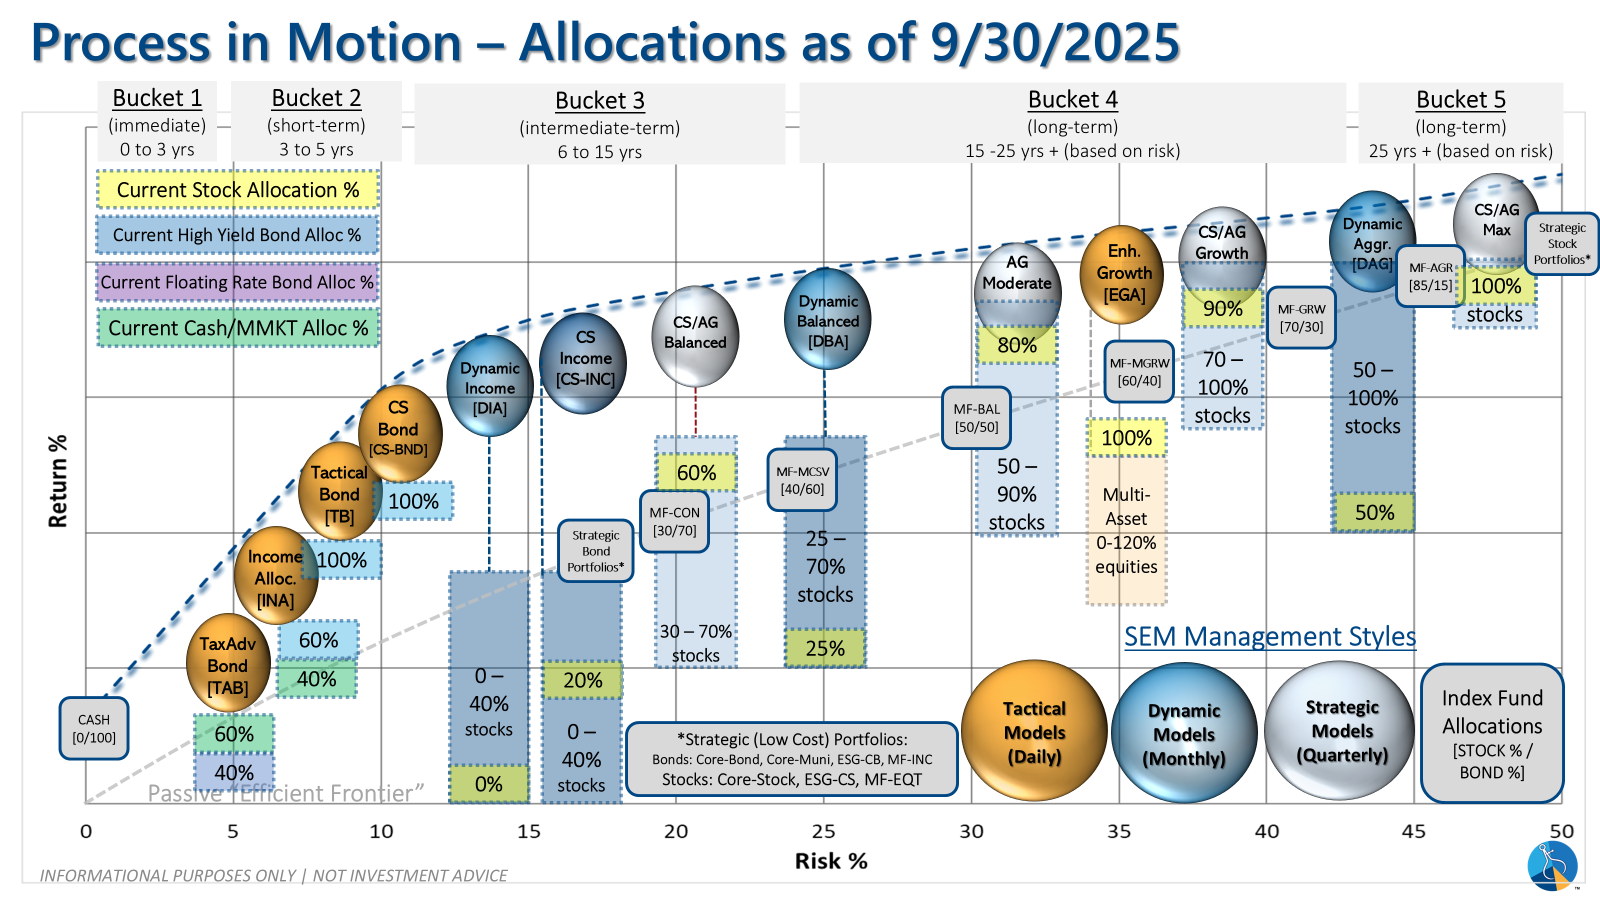
SEM deploys 3 distinct approaches – Tactical, Dynamic, and Strategic. These systems have been described as 'daily, monthly, quarterly' given how often they may make adjustments. Here is where they each stand.
Tactical (daily): The high yield system has been invested since 4/23/25 after a short time out of the market following the sell signal on 4/3/25.
Dynamic (monthly): The economic model went 'bearish' in June 2025 after being 'neutral' for 11 months. This means eliminating risky assets – sell the 20% dividend stocks in Dynamic Income and the 20% small cap stocks in Dynamic Aggressive Growth. The interest rate model is 'bullish' meaning higher duration (Treasury Bond) investments for the bulk of the bonds.
Strategic (quarterly)*: One Trend System sold on 4/4/2025; Re-entered on 6/30/2025
The core rotation is adjusted quarterly. On August 17 it rotated out of mid-cap growth and into small cap value. It also sold some large cap value to buy some large cap blend and growth. The large cap purchases were in actively managed funds with more diversification than the S&P 500 (banking on the market broadening out beyond the top 5-10 stocks.) On January 8 it rotated completely out of small cap value and mid-cap growth to purchase another broad (more diversified) large cap blend fund along with a Dividend Growth fund.
The * in quarterly is for the trend models. These models are watched daily but they trade infrequently based on readings of where each believe we are in the cycle. The trend systems can be susceptible to "whipsaws" as we saw with the recent sell and buy signals at the end of October and November. The goal of the systems is to miss major downturns in the market. Risks are high when the market has been stampeding higher as it has for most of 2023. This means sometimes selling too soon. As we saw with the recent trade, the systems can quickly reverse if they are wrong.
Overall, this is how our various models stack up based on the last allocation change:
Curious if your current investment allocation aligns with your overall objectives and risk tolerance? Take our risk questionnaire


