
Keeping in mind that past performance is not a guarantee of future results and that things can change in the future, let's keep a few things in mind:
1.) Over the very long-term (15+ years) the stock market goes up.
2.) Over shorter periods of time (1 month) stocks are down about 1/3 of the time.
3.) On average the stock market loses 10% from the highs every 12-15 months.
Now, let's look at some of the fundamentals behind the market:
A.) The long-term performance of a stock market can be broken down to: Economic Growth (GDP) + Dividend Yield + Inflation.
B.) Market participants therefore attempt to project what those components will be to decide how much they should allocate to the stock market.
C.) Market participants are human and subject to their own emotional biases which leads to long periods of overly optimistic assessments followed by periods of overly pessimistic assessments.
D.) Despite the knowledge of #1 above (stocks go up over the long-term), B & C leads to #2 & 3 above (stock prices fluctuate).
I bring all this up because one of the catalysts for what the financial media described as the "worst week for the market since April" was several big name Wall Street firms "warning" about the potential for a 10% sell-off. We laughed in our office Monday morning because we remind every client and advisor about the frequency of losses (#2 & 3 above) so they can hopefully stick to their LONG-TERM plan when those inevitable losses occur.
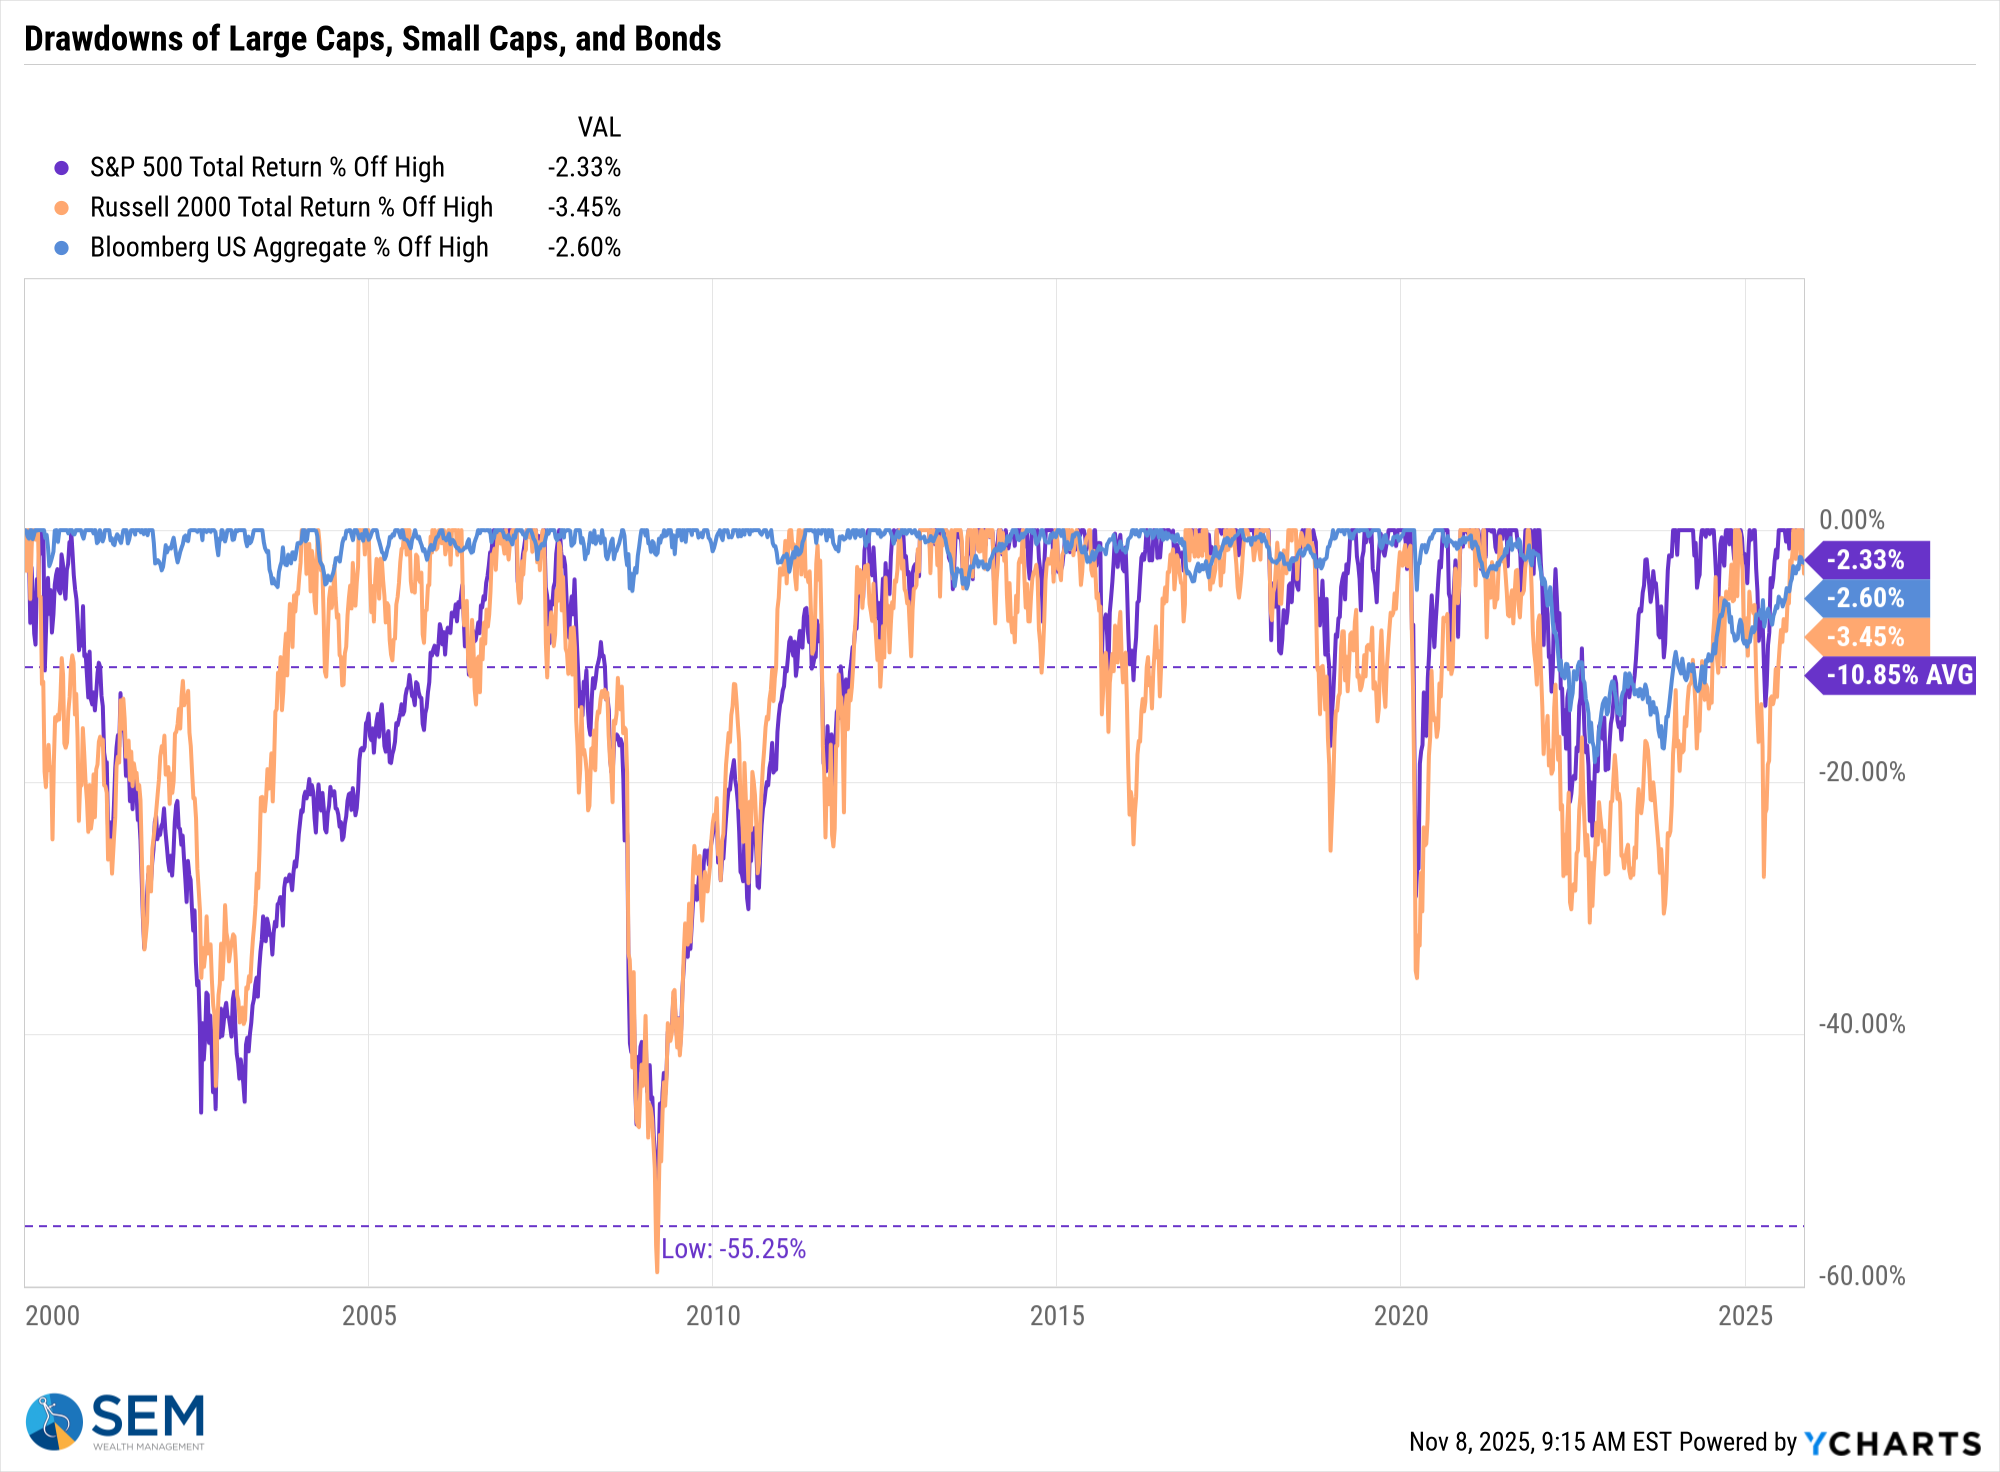
That didn't stop the over-reaction from happening – we all are, after all humans. By the way, the S&P only lost 1.6% last week and is down just 2.3% from its high. The chart below shows the "drawdowns" for large & small cap stocks and the aggregate bond market since 2000. Note the AVERAGE drawdown is 10.85% with a couple obviously scary drops.
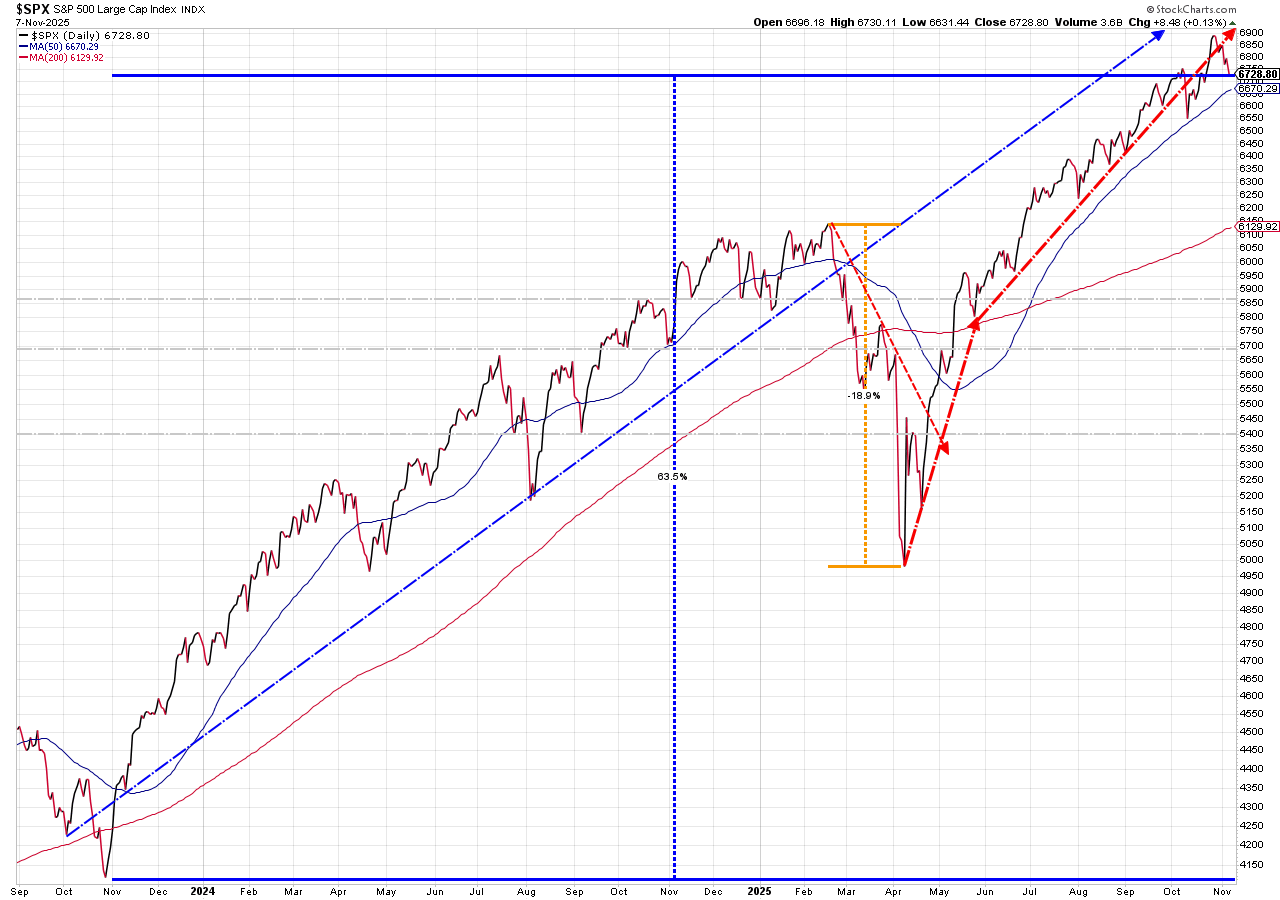
Yes, the market just had its worst week since April, but as noted in the Market Charts section near the bottom of this blog, we've had a spectacular run since the President relented on his "liberation day" threats and are up 63% since the Fed stopped hiking interest rates 2 years ago.
In other words, based on the LONG-TERM history of the market, we are DUE for a 10% (or greater) correction in stock prices.
AI Reality Check?
I've spent too much of this space since the beginning of October talking both about the circular equity swap deals to purchase components for the AI build out as well as the shift from equity to debt financing. This debt financing is becoming increasingly "creative" which is something we've seen occur near the end of past market cycles.
Readers of our blog shouldn't have been surprised when some of the bigger names on Wall Street last week cited this as cause for concern. In case you missed it, here are a few of the recent posts:


We will have more in the coming weeks, but this week let's take a look at a few non-AI related things that have been occupying my brain.
Government for the people and by the people?
I don't want to go into politics. As most readers know I'm a registered independent and have been since the Republicans helped bailout the failed banks in 2008 at the expense of the smaller banks who didn't get sucked into the creative financing bubble. That, in my opinion, is not a "free market, fiscally conservative" action. Being independent the last 17 years means equally offending both sides. If you're registered with either party, please don't take offense. As an independent I want to hear BOTH sides and why they thing the way they do.
For basically this entire century, we've seen control of the House, Senate, and/or White House flip with every 2-year election. The margins are typically small (most of the time less than 52% of the voters chose the winning side). However, each year the winning side has increasingly pushed their policies further and further to their side of the political spectrum. I don't understand this — you keep losing every 4 years (after 2 years in power), yet you think Americans want to go all the way to your way of thinking.
I can't change that and what I say doesn't matter. What matters is the impact this has on the economy and markets. The now record government shutdown is beginning to have a big impact on the economy. The FAA is cancelling 10% (or more) of flights just ahead of the busiest two months of travel. Airlines are required by law to give refunds, so this will be a big economic hit. The blue team is holding out over looming changes in health care coverage. The biggest focus is on the expiration of the COVID-era subsidies set to expire at the end of the year. Some on the blue team are also fighting over some of the changes in the "Big Beautiful Bill" to Medicaid.
What drives me crazy, is the fact we are going to run anywhere from a $1.8 to $1.9 Trillion deficit – to put that in perspective, that's $1800 BILLION. When President Trump took over in 2017, we were running a $400 Billion deficit. The "BBB" is not projected to shrink the deficit by more than a few hundred billion – it simply shifts some of the spending and revenue around.
I've been fiscally concerned about our spending since 2003 and have been vocal about it since 2011 (remember the Tea Party – the last attempt to fix our budget deficit which helped get us down to a "mere" $400B deficit. They were essentially pushed out of power in the primaries by the leaders of the red team which puts us where we are today.)
I don't like spending money and I don't like saying things like "only $60 Billion", or "just $104 Billion), but Friday morning I woke up angry as I read about travelers not being able to get home because of the government shutdown. We've heard from some clients who received sticker shock on their ACA premium renewals last week. I put this graphic together to illustrate what we are all fighting about.
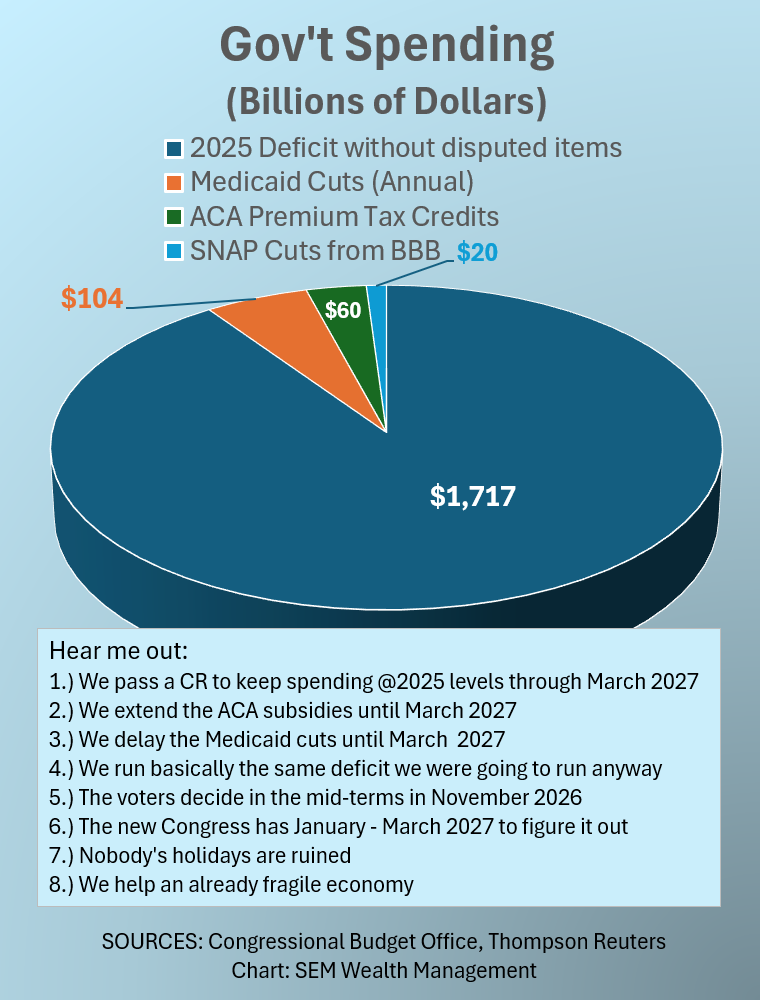
My idea – why can't Congress do what's right for the PEOPLE, agree to disagree, and let the PEOPLE decide which direction we want to go for the next Congress. In the whole scheme of things are we really fighting over $60 Billion (the amount we spent in 2025 for the extended subsidies) or $104 Billion (the looming Medicaid cuts included in the BBB) when we will STILL be running at least a $1700 Billion deficit? [It's actually likely to be closer to $1800 Billion if not $1900 Billion if GDP growth slows in 2026, bringing down tax revenues.]
The Return of the K-Shaped Economy
One of the things we discussed in great detail during COVID was the K-Shaped Economy created by the 3 rounds of stimulus checks and other actions taken by Congress and the Federal Reserve. Essentially, you could divide the economy into two groups – those who could continue working on their laptops (as well as all those people who were retired and not impacted by losing their source of income) and those who physically had to work in person.
The upper part of the K already had extra money because they could no longer travel, go out to eat, get their nails done, go shopping, etc. The government, in their infinite wisdom decided to send everybody in that upper part of the K extra checks anyway.
The lower part of the K struggled and was hurt both by a drop in income (or completely losing their jobs), but also by all the extra money being allocated to things like home improvements, second homes, and other things people do when they receive money they didn't need.
The upper part of the K didn't need any extra money. The lower part of the K didn't get enough.
While the pandemic is over, we are seeing the strains of the K-Shaped economy emerging again. The lower half has not recovered economically from the pandemic. Inflation crushed their budgets. Rent has skyrocketed. Interest rates remain high making already high real estate prices unattainable for most in their income brackets. As it did briefly in 2022, this could again threaten the economy.
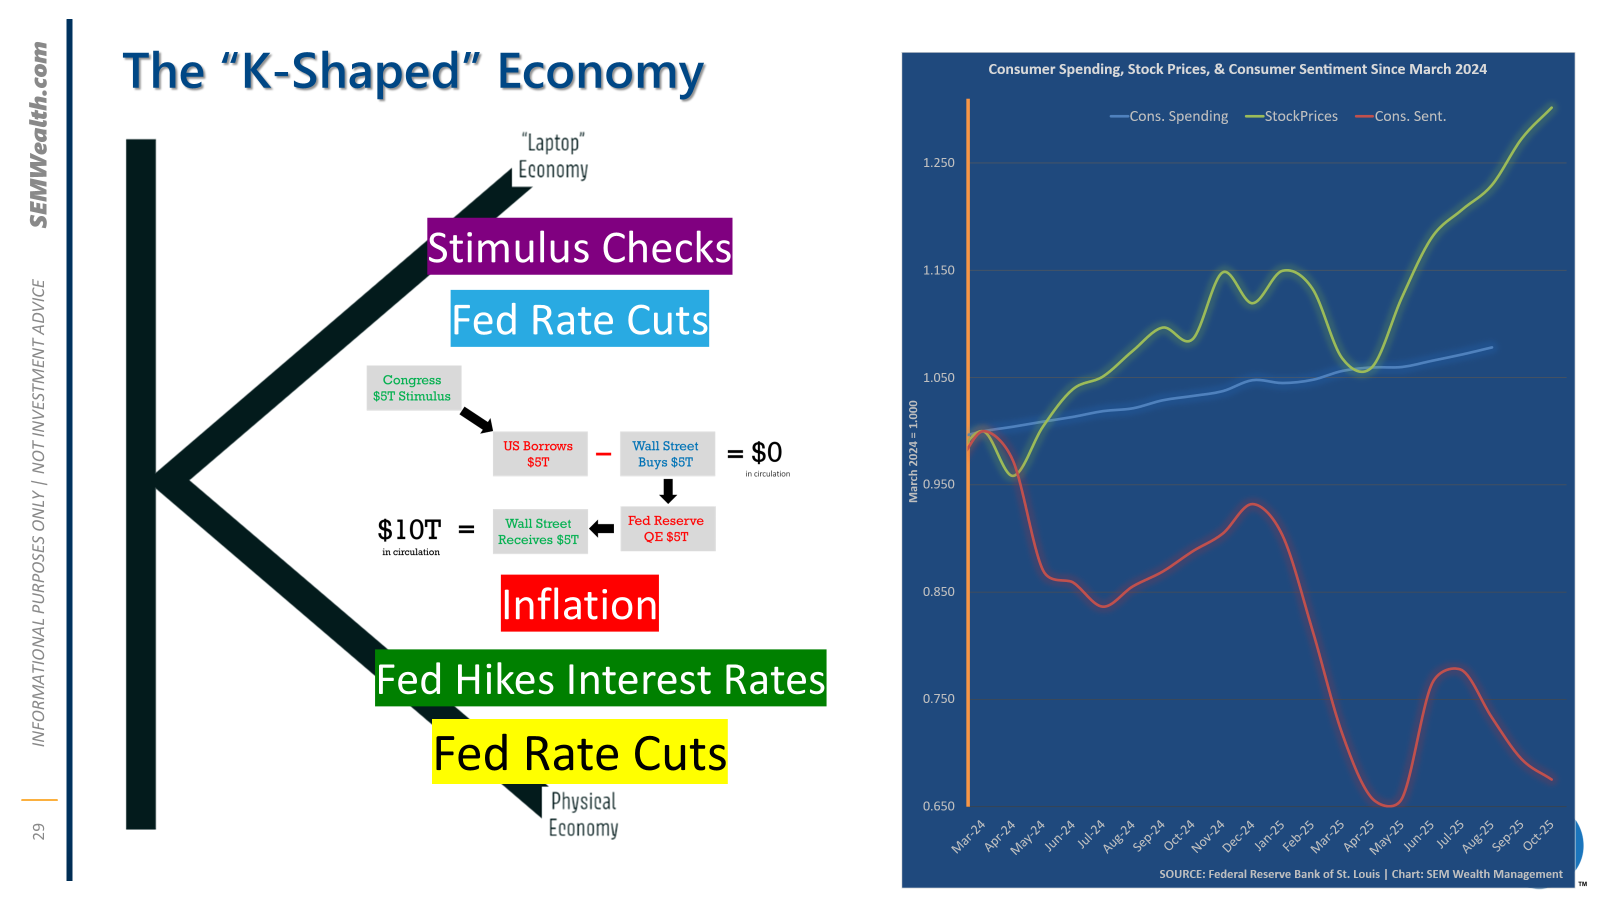
The chart above illustrates the disconnect, which started in the spring of 2024. I don't know what the catalyst was, but that was the peak in consumer sentiment. It has since declined significantly and on Friday hit the lowest levels since the summer of 2022 (when inflation was hitting 9%).
The median household income in the US last year was $83K (meaning half of American households earn more than that and half earn less). Let's go back to the extended ACA subsidies — the biggest impacted category with the expiration of the subsidies will be for those households earning between $60-100K, so in other words, those right around what you would consider "middle class".
Look, I've long been critical of the ACA. I've seen what it has done to our small business premiums each and every year. I've seen that it has only INCREASED the cost of actual medical care (ever check how much common procedures "cost" on your itemized bill sent to the insurance company). However, now is not the time to be changing it. The COVID era subsidies were put in place to help those Americans in the lower middle class. The thought was we'd be through the economic pain the pandemic created by 2025. The problem is we haven't.
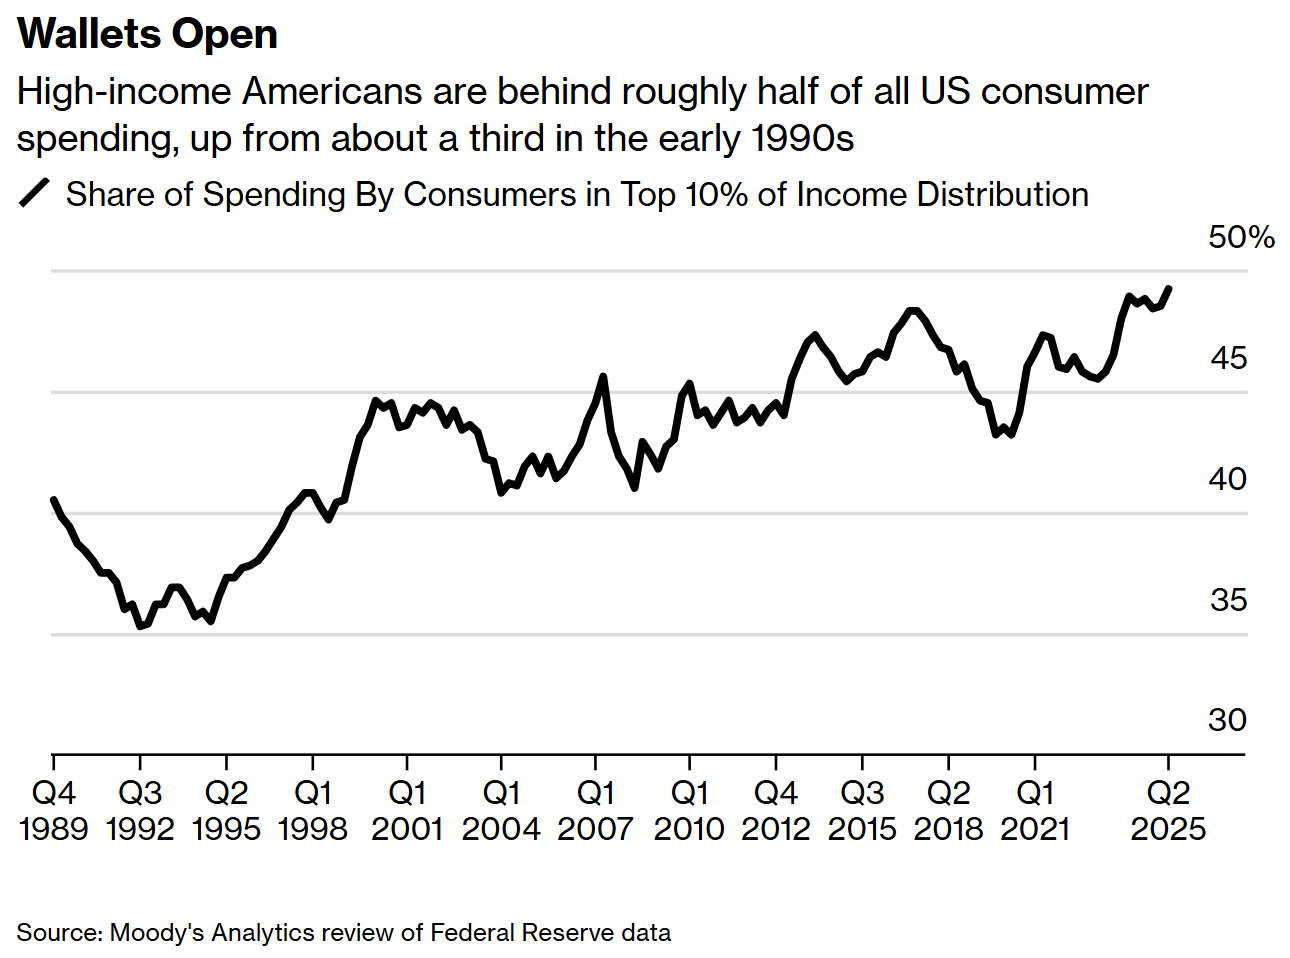
I included consumer spending on the K-shaped chart above. That number, along with stock prices, has been cited as a sign of strength for the economy. Bloomberg last week had a chart that should make us all ask, "how strong is the AVERAGE consumer right now?"
Nearly HALF of consumer spending is from households in the upper 10% (those making more than $250K per year).
The biggest question for the markets going forward is whether or not the success of the upper half of the K will trickle down to the lower half or if we will see the increasing struggles from the lower half pull down everything else.
Given the deficit we are already running, I'm not sure why we cannot buy more time and help the middle class out by extending the ACA subsidies for one more year. This gives Congress time to work on a better plan and takes away yet another thing hammering the middle class. Our economic model already shows the economy is slowing rapidly. Without the Data Center buildout, we would be teetering towards a recession early next year.
Now is not the time to play politics. Now is the time for our government to focus on the middle class. If they don't we ALL will pay the price.
Market Charts

While the media likes to talk about the "worst week since April", let's put things in perspective............the market is back to where it was on October 10. The S&P has given up just 1 month of gains and is still up 16% for the year.

From a technical perspective this is just a normal pullback to the trend line, in this case the rising 50 day moving average.
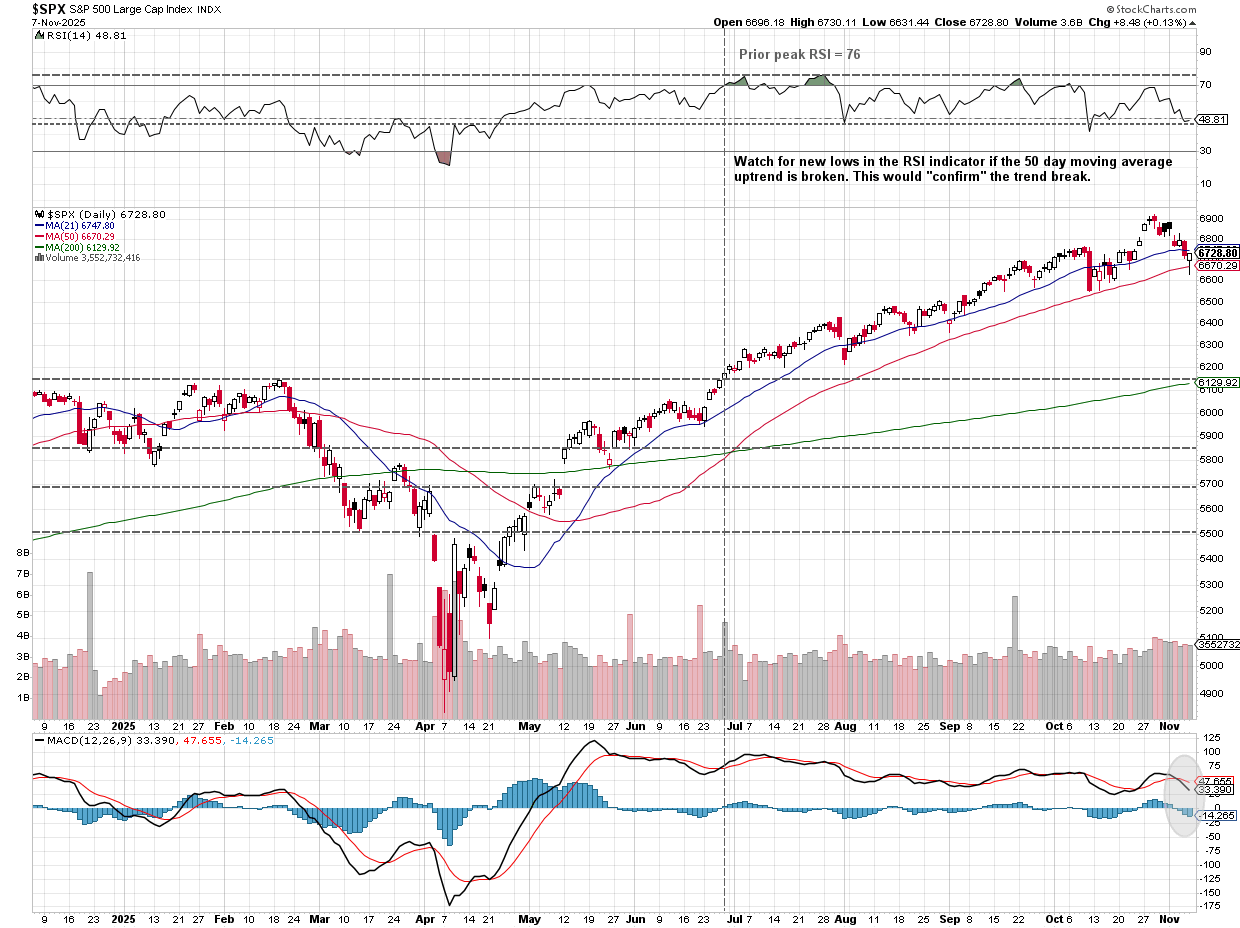
Perspective is always key. The S&P 500 is still up 63% since the Fed stopped raising interest rates at the end of 2023. That annualized rate of return is 3x the long-term average. A pullback should not be surprising. Stocks are not supposed to go straight up like they have since President Trump delayed/rescinded his "liberation day" tariffs.
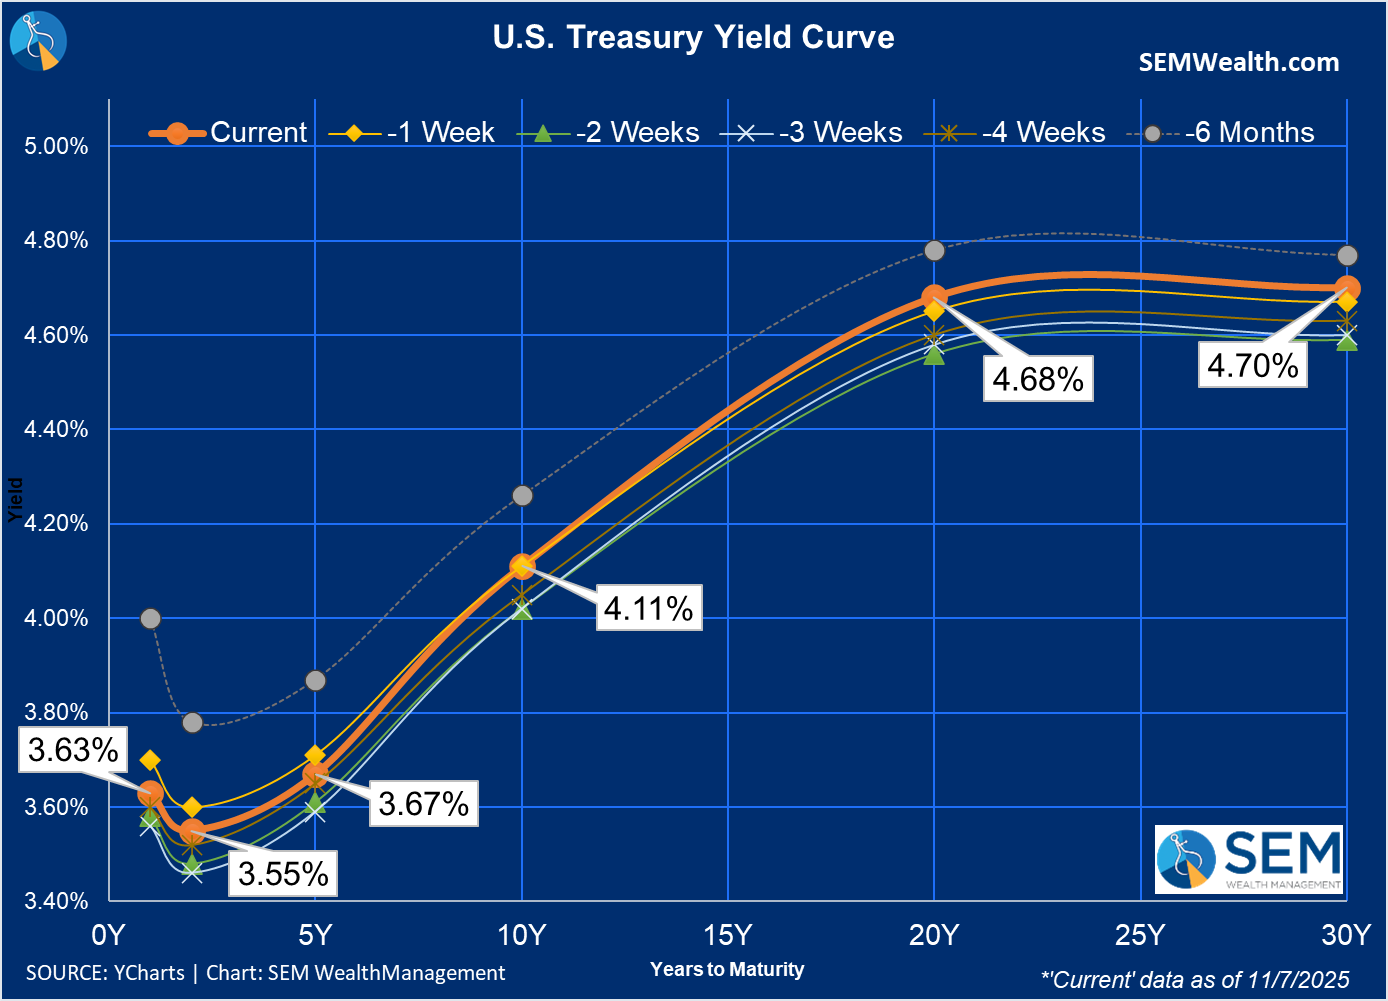
Short-term bond yields declined a bit for the week, but the 10-year, which is far more important for the economy than what the Fed does with interest rates was unchanged and remains above 4%. The short-term inverted yield curve shows the markets still expect the Fed to cut rates a few more times.
SEM Market Positioning
| Model Style | Current Stance | Notes |
|---|---|---|
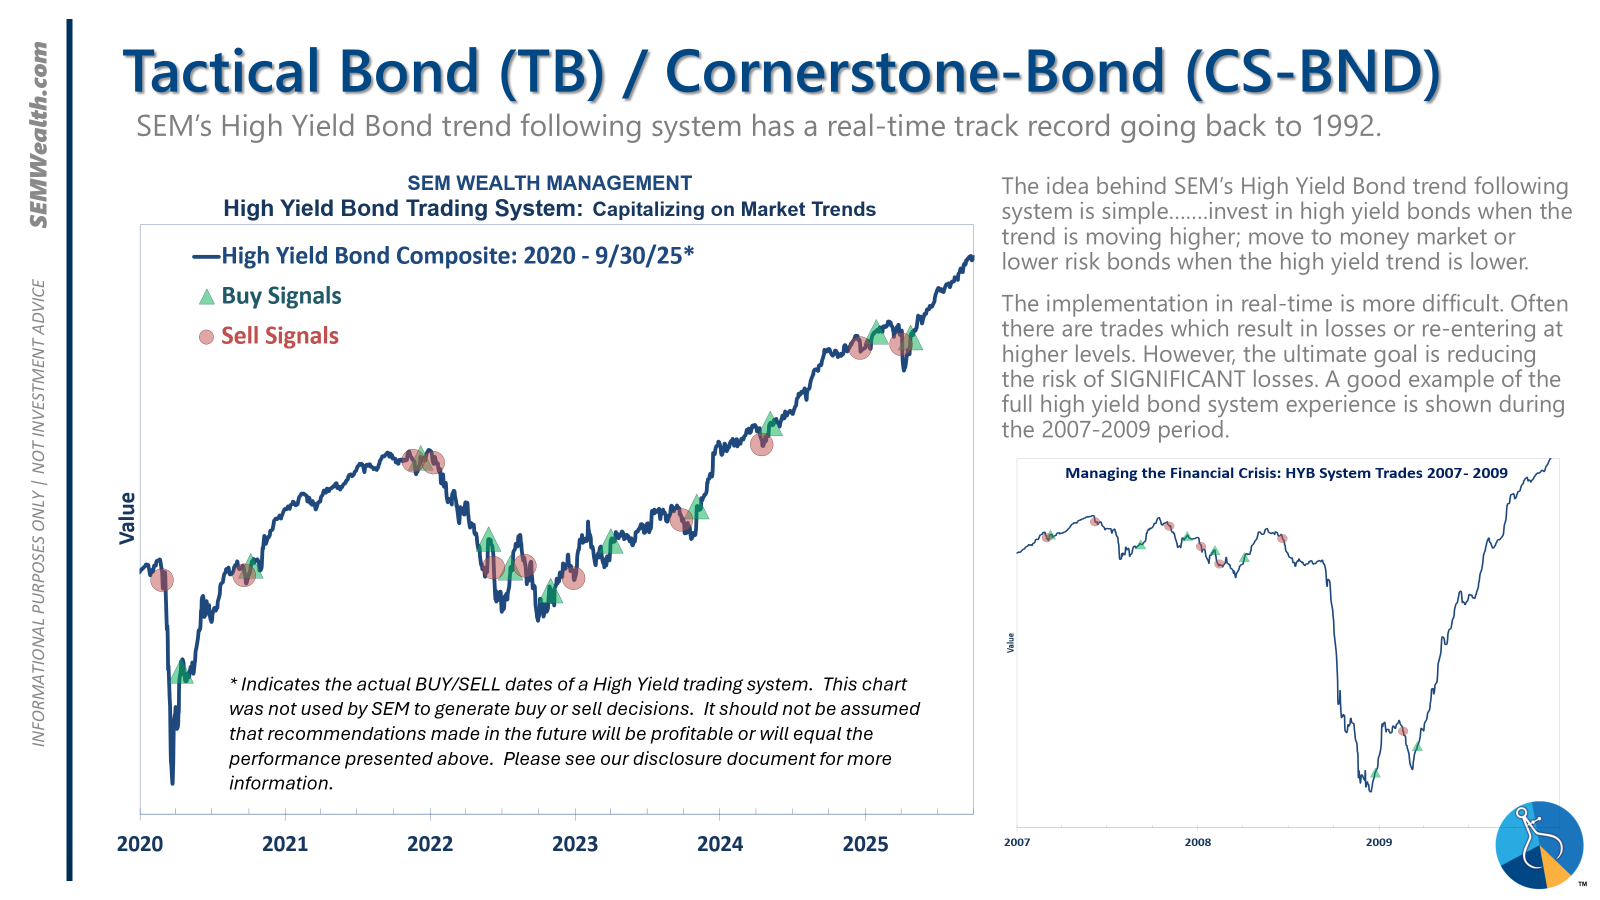
| Tactical | 100% high yield | High-yield spreads holding, but trend is slowing-watching closely |
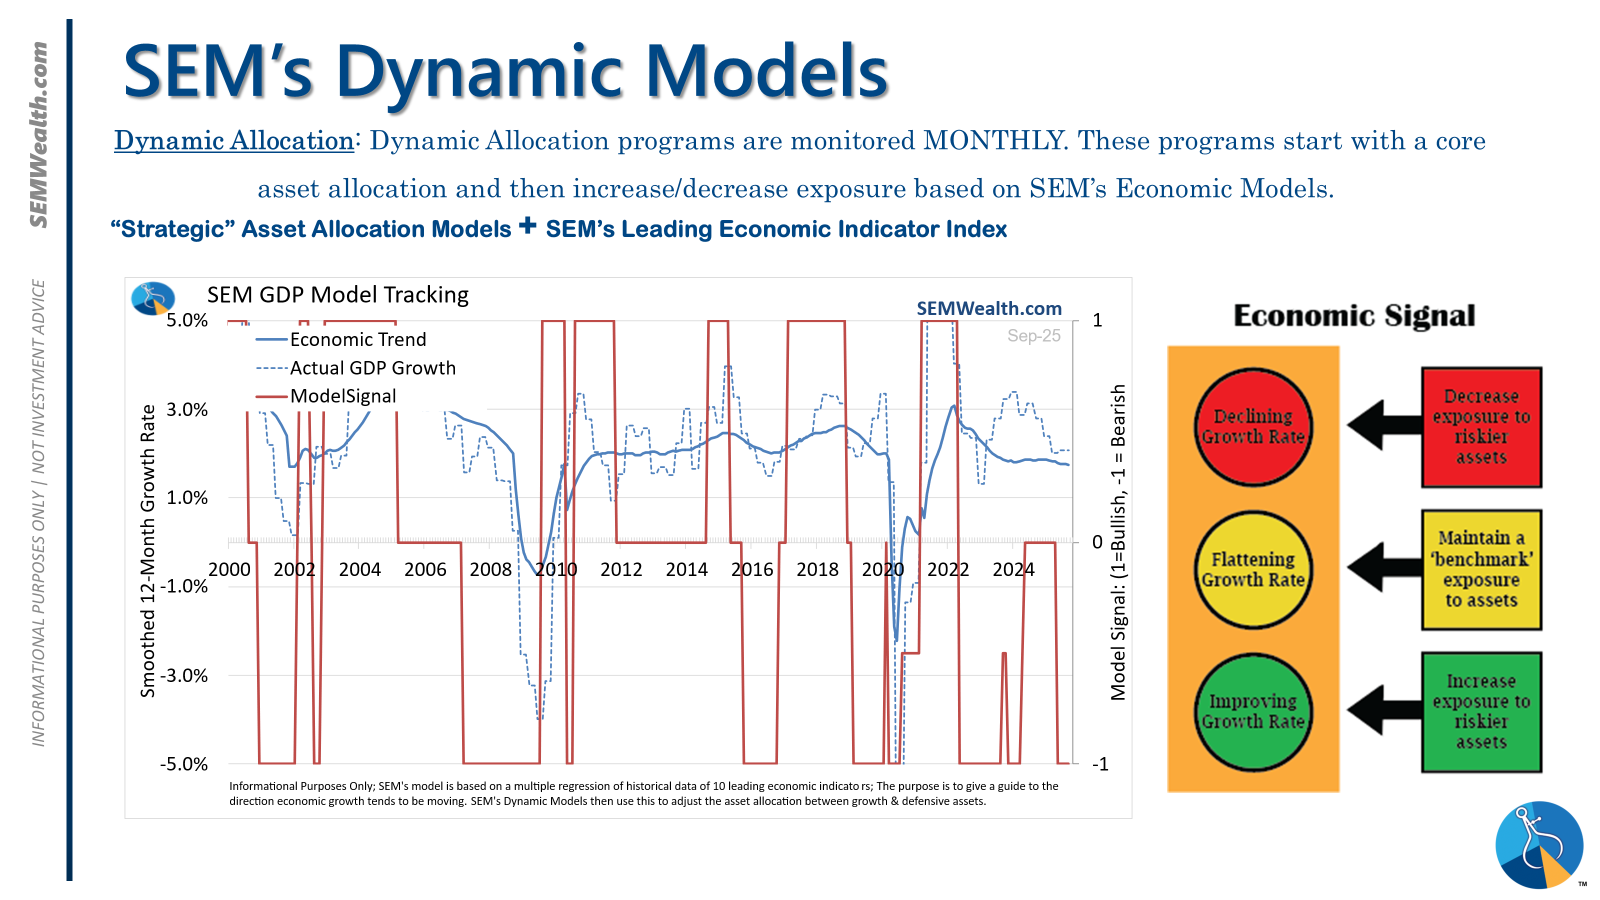
| Dynamic | Bearish | Economic model turned red – leaning defensive |
| Strategic | Slight under-weight | Trend overlay shaved 10 % equity in April -- added 5% back early July |
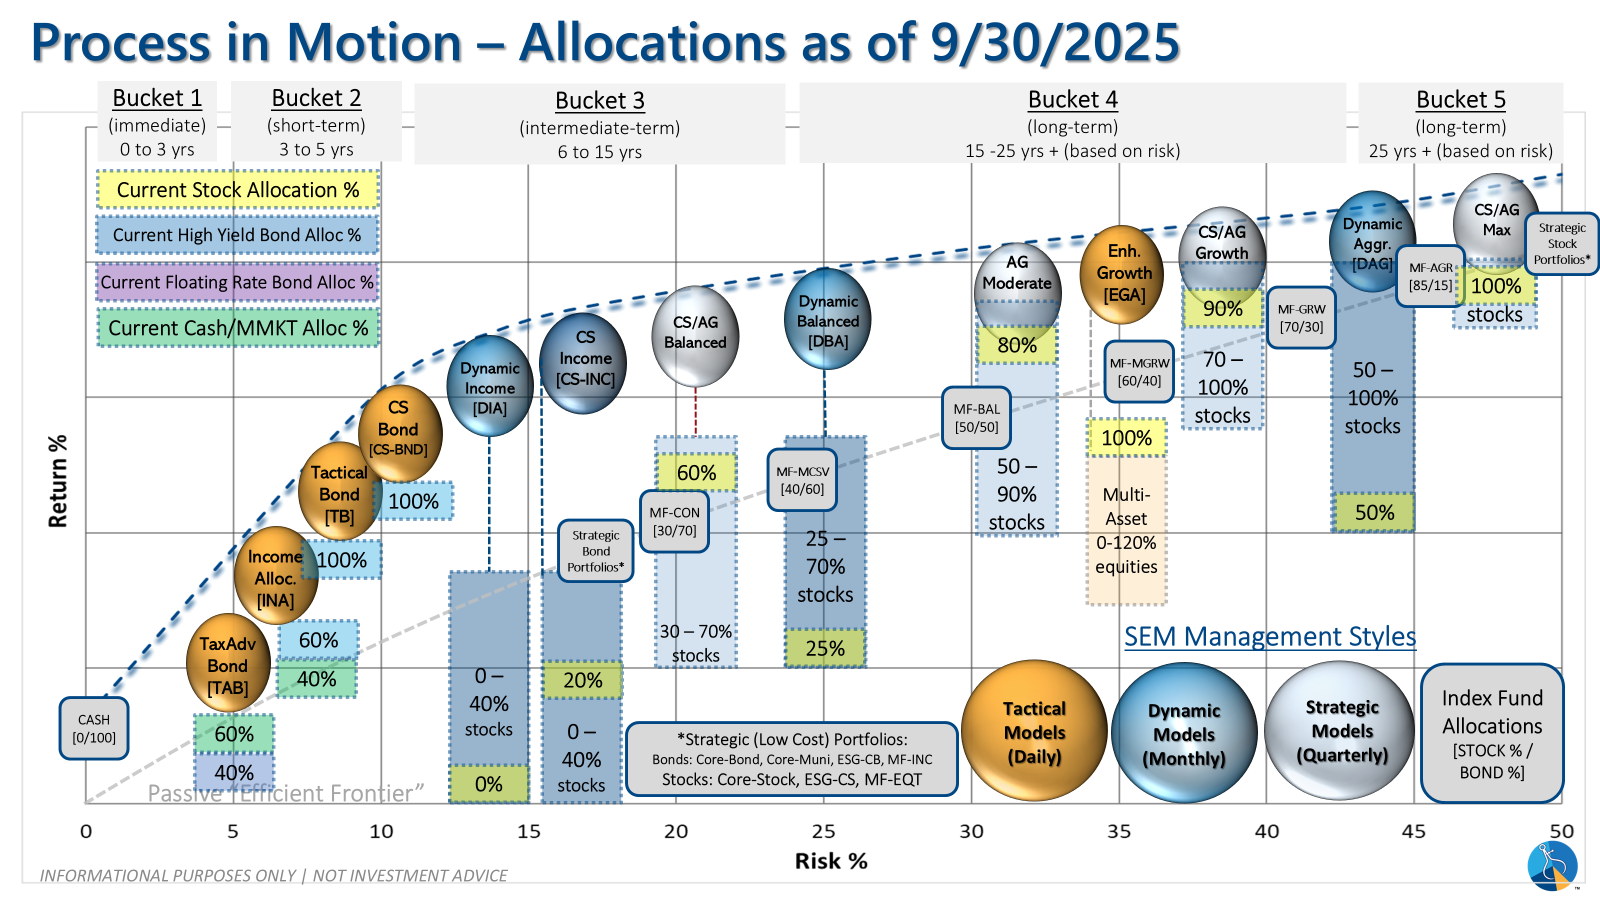
SEM deploys 3 distinct approaches – Tactical, Dynamic, and Strategic. These systems have been described as 'daily, monthly, quarterly' given how often they may make adjustments. Here is where they each stand.
Tactical (daily): The high yield system has been invested since 4/23/25 after a short time out of the market following the sell signal on 4/3/25.
Dynamic (monthly): The economic model went 'bearish' in June 2025 after being 'neutral' for 11 months. This means eliminating risky assets – sell the 20% dividend stocks in Dynamic Income and the 20% small cap stocks in Dynamic Aggressive Growth. The interest rate model is 'bullish' meaning higher duration (Treasury Bond) investments for the bulk of the bonds.
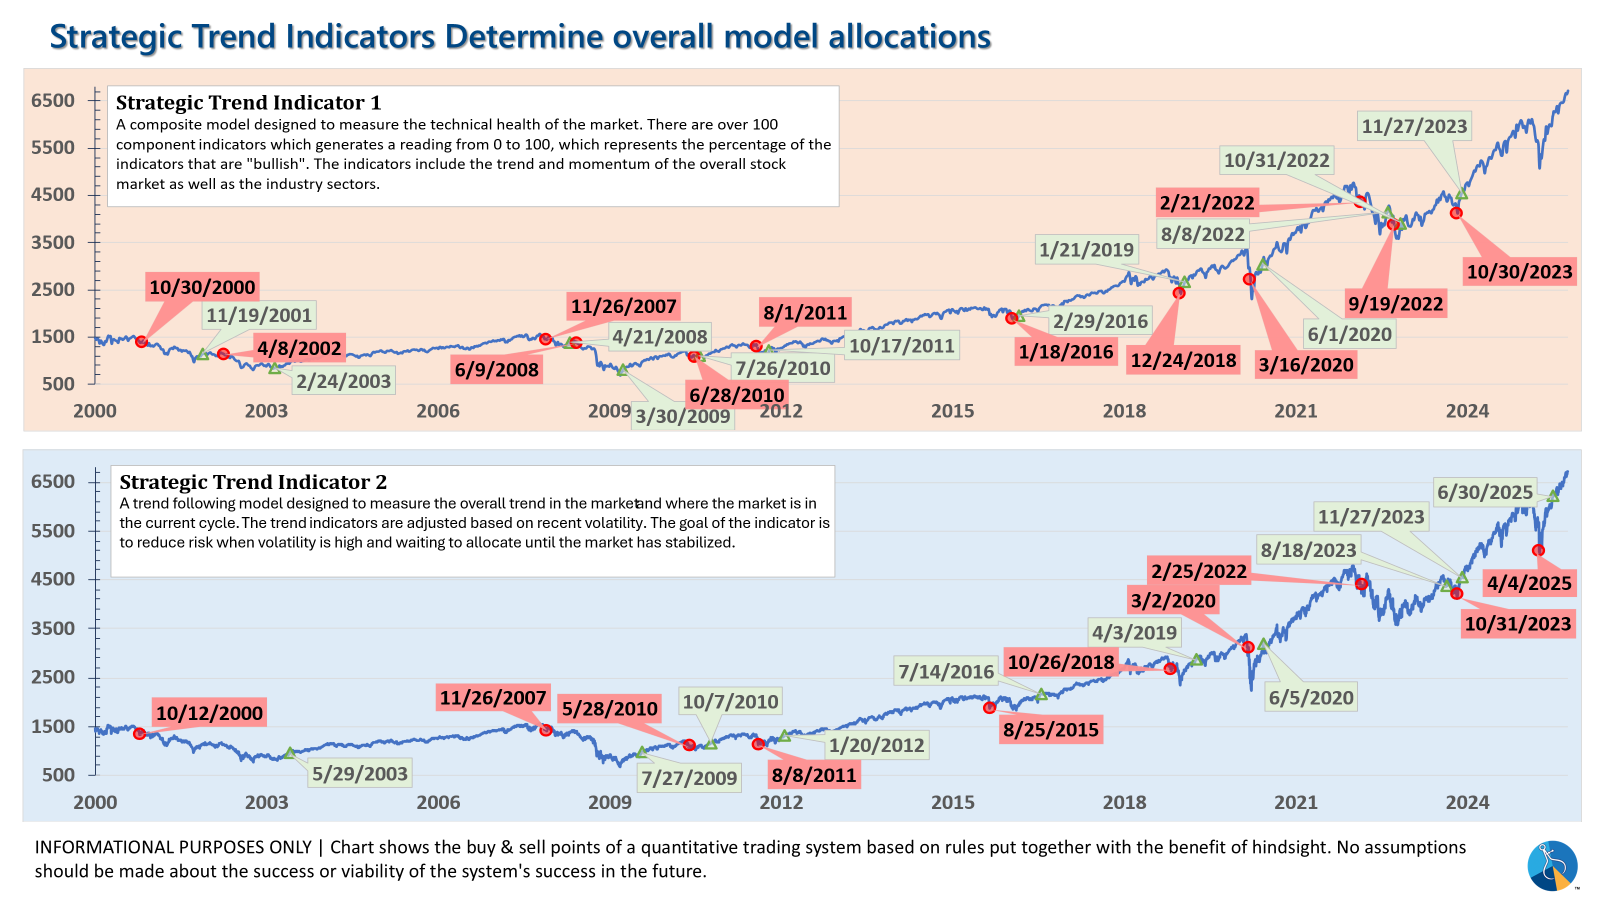
Strategic (quarterly)*: One Trend System sold on 4/4/2025; Re-entered on 6/30/2025
The core rotation is adjusted quarterly. On August 17 it rotated out of mid-cap growth and into small cap value. It also sold some large cap value to buy some large cap blend and growth. The large cap purchases were in actively managed funds with more diversification than the S&P 500 (banking on the market broadening out beyond the top 5-10 stocks.) On January 8 it rotated completely out of small cap value and mid-cap growth to purchase another broad (more diversified) large cap blend fund along with a Dividend Growth fund.
The * in quarterly is for the trend models. These models are watched daily but they trade infrequently based on readings of where each believe we are in the cycle. The trend systems can be susceptible to "whipsaws" as we saw with the recent sell and buy signals at the end of October and November. The goal of the systems is to miss major downturns in the market. Risks are high when the market has been stampeding higher as it has for most of 2023. This means sometimes selling too soon. As we saw with the recent trade, the systems can quickly reverse if they are wrong.
Overall, this is how our various models stack up based on the last allocation change:
Curious if your current investment allocation aligns with your overall objectives and risk tolerance? Take our risk questionnaire


