
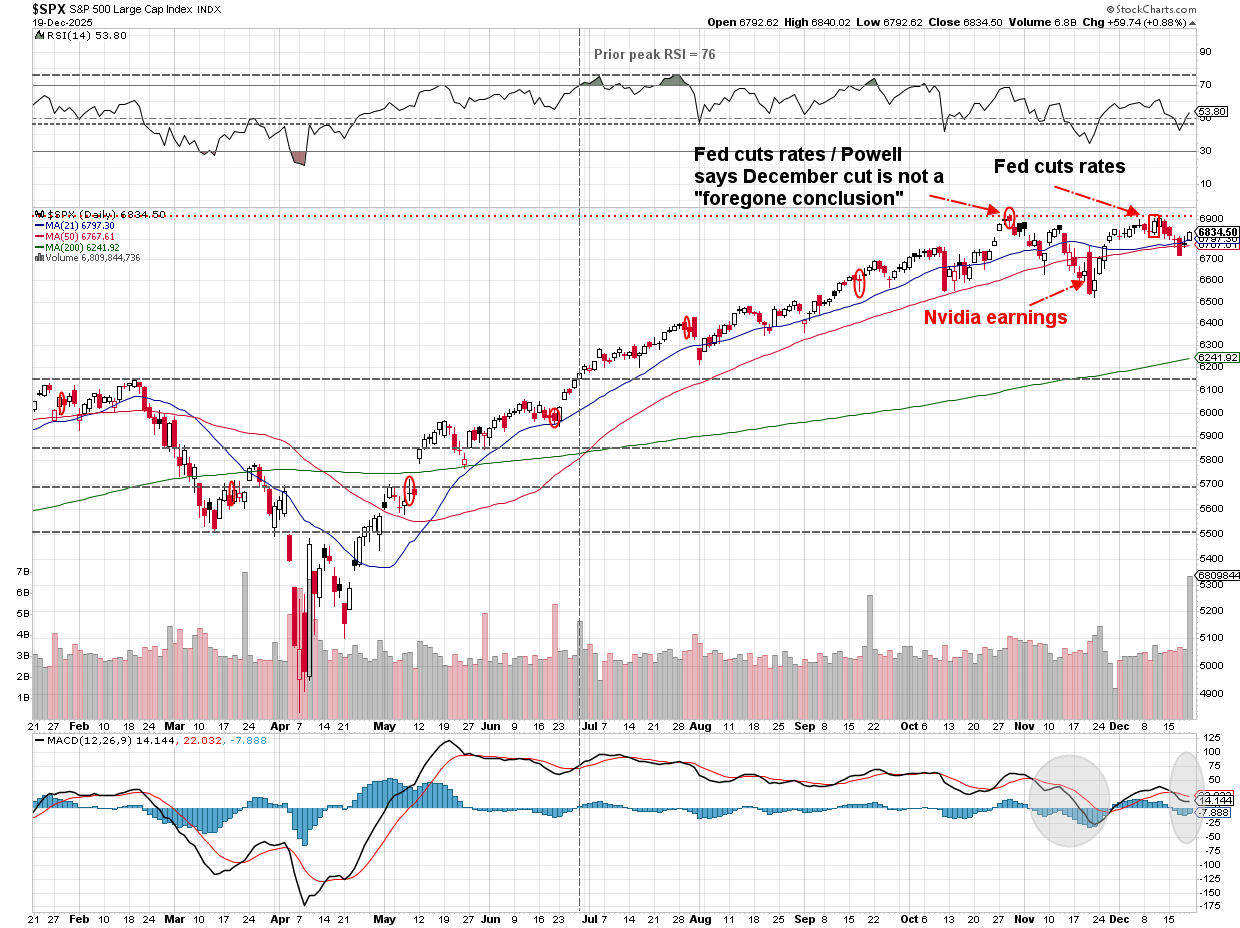
The Federal Reserve often says they are "data dependent". This often leads to confusion and hyper-focus on every data release as the market speculates what it means for the next Fed meeting. Most of November saw a drop in stock prices after the Fed pushed back on the thought of another rate cut in December. Then a few key players on the Fed softened their stance and without any sort of "data" to work from decided to perform a "safety" cut in December. The thought was it wouldn't add to any sort of inflation pressure and could help business owners and consumers feel as if the Fed was trying to help the economy.
We've also seen some growing concern about the independence of both the Federal Reserve and the departments supplying the data. When President Trump fired the head of the Bureau of Labor Statistics (BLS) earlier this year due following a weak payroll report, some questioned whether we could trust the data coming out of the BLS. This is important as the BLS provides both the monthly payrolls report as well as the consumer and producer inflation reports (CPI & PPI). Not much was said about this until this week when the BLS released an inflation report that surprised even the most optimistic economists. CPI had been trending up before the government shutdown. During the shutdown the government wasn't collecting data. The BLS decided to both skip any sort of October data as well as use "statistical adjustments" for the November data. Those adjustments did not make much sense to most observers, including New York Fed President John Williams.
I don't fall into the type of conspiracy theories that others have. We have a $30 Trillion+ economy and over 300 million people across some economically and geographically diverse states. I believe the various departments are doing the best they can. There's always going to be some subjectivity, adjustments, and most certainly a range of "experts" telling us what we should think about the data (including me). I try to focus on the trends and take a mosaic approach of all the data. We use our economic model as a guide. It doesn't mean we're always right and at times the data may be very early in warning about a major change.
Over the past 18 months we've gone through an environment where the economic data has not come anywhere near representing what the stock market has been showing. This has led to many people to ask whether or not it is "different this time." Are we in a "new era"? I've been following stocks for over 30 years and have endured a few periods where for 3-4 years it seemed we were for sure in a "new era". My study of history (remember we now have 100 years of "modern" data on the markets) tells me it is never different. Human nature has not changed in the history of the world which leads to long periods of overly optimistic outlooks, followed by periods of overly pessimistic (over) reactions to reality.
We're at the time of year where everyone is giving their market outlook. In case you missed it, we gave our own "outlook" a few weeks back. It is divided into 30 minutes of our prepared remarks and a record 45 minutes of Q&A.
As usual, not a single Wall Street firm is predicting a decline in stocks for 2026. In my 30+ years I've only seen a decline predicted once by a major firm – Morgan Stanley predicted a 2% drop in stocks in 2022 when everyone was again predicting 5-12% returns. There are two reasons for this:
1.) Wall Street firms make money by people investing and staying invested in the markets. If they predict a decline their clients may move out of their firms and into cash investments.
2.) Framing & adjustment bias leads analysts to start with the "normal" or long-term average (10% for stocks) and then make adjustments based on the outlook.
Stocks have been down historically 26% of the years (as well as 26% of the rolling 12-month periods). This means 74% of the time the market is up. Are you as an analyst or a firm brave enough to predict something that only happens 1 out of every 4 years?
Going into 2026 here is the overall sentiment I see:
- Economic growth will expand, possibly up to a 3-4% annual rate
- Technology stocks will continue to see earnings growth above 30%
- The rest of the sectors will see a strong recovery in earnings growth
- The market will "broaden" beyond the "Mag-7" stocks
- Unemployment will reverse
- Inflation will decline
- The Fed will continue to stimulate the economy with easy money policies
I can see all of that happening. While our economic model remains bearish, the data through August/September did show the slowdown in growth was easing. If the economy is able to stabilize, we could see the rest of the sectors recover with strong earnings growth. The question that remains in my accounting/logical brain is whether Tech stocks can continue to grow as fast as they have and if they can't how the S&P 500 could withstand a slowdown. The higher the expected growth, the bigger the reaction if those expectations are missed.
We will stick to the data, whatever that looks like.
We did receive some data last week. We were supposed to receive more, but most of those releases were postponed until Tuesday, December 23. Hopefully next week I'll be able to post our monthly economic update. For now, here's what we learned last week:
Payrolls, Inflation, and Sentiment
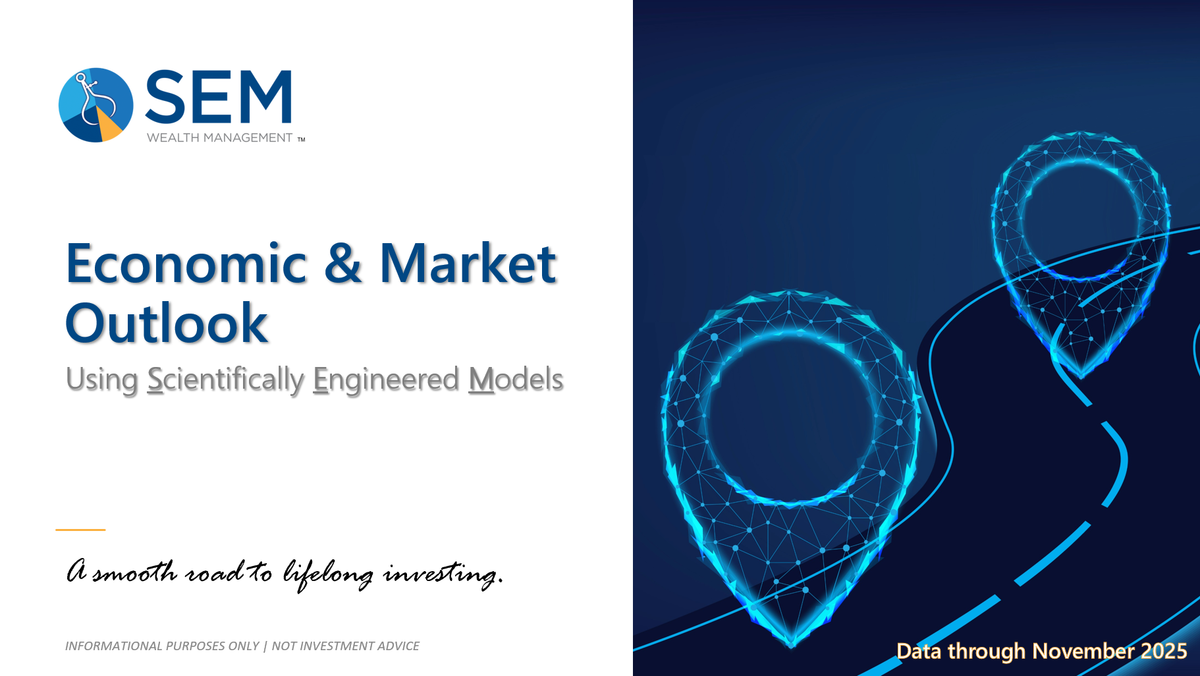
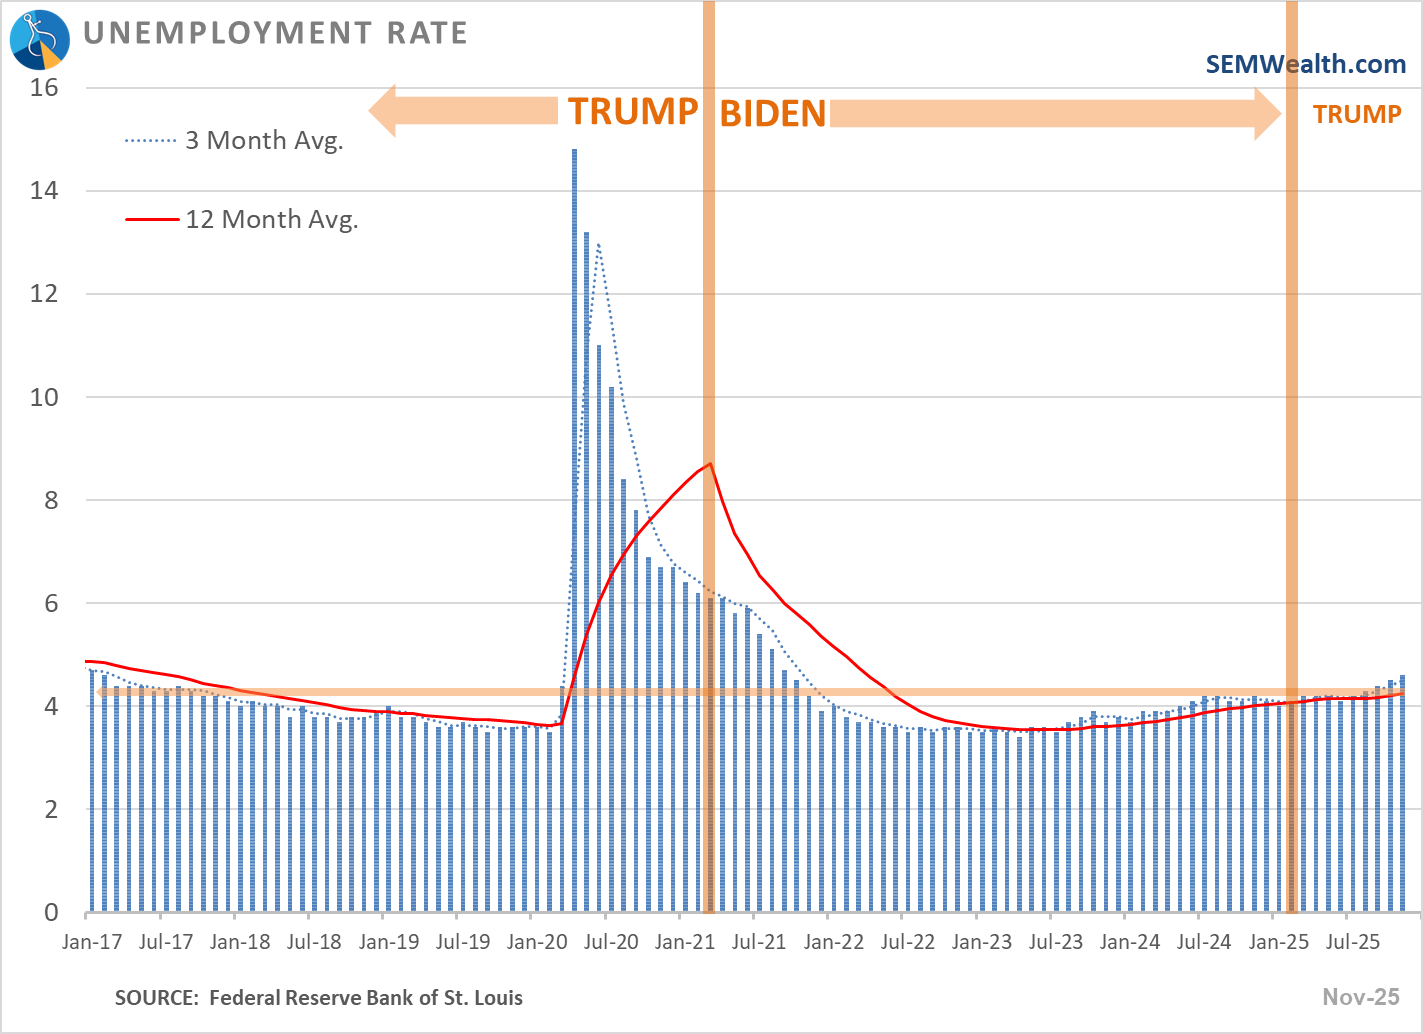
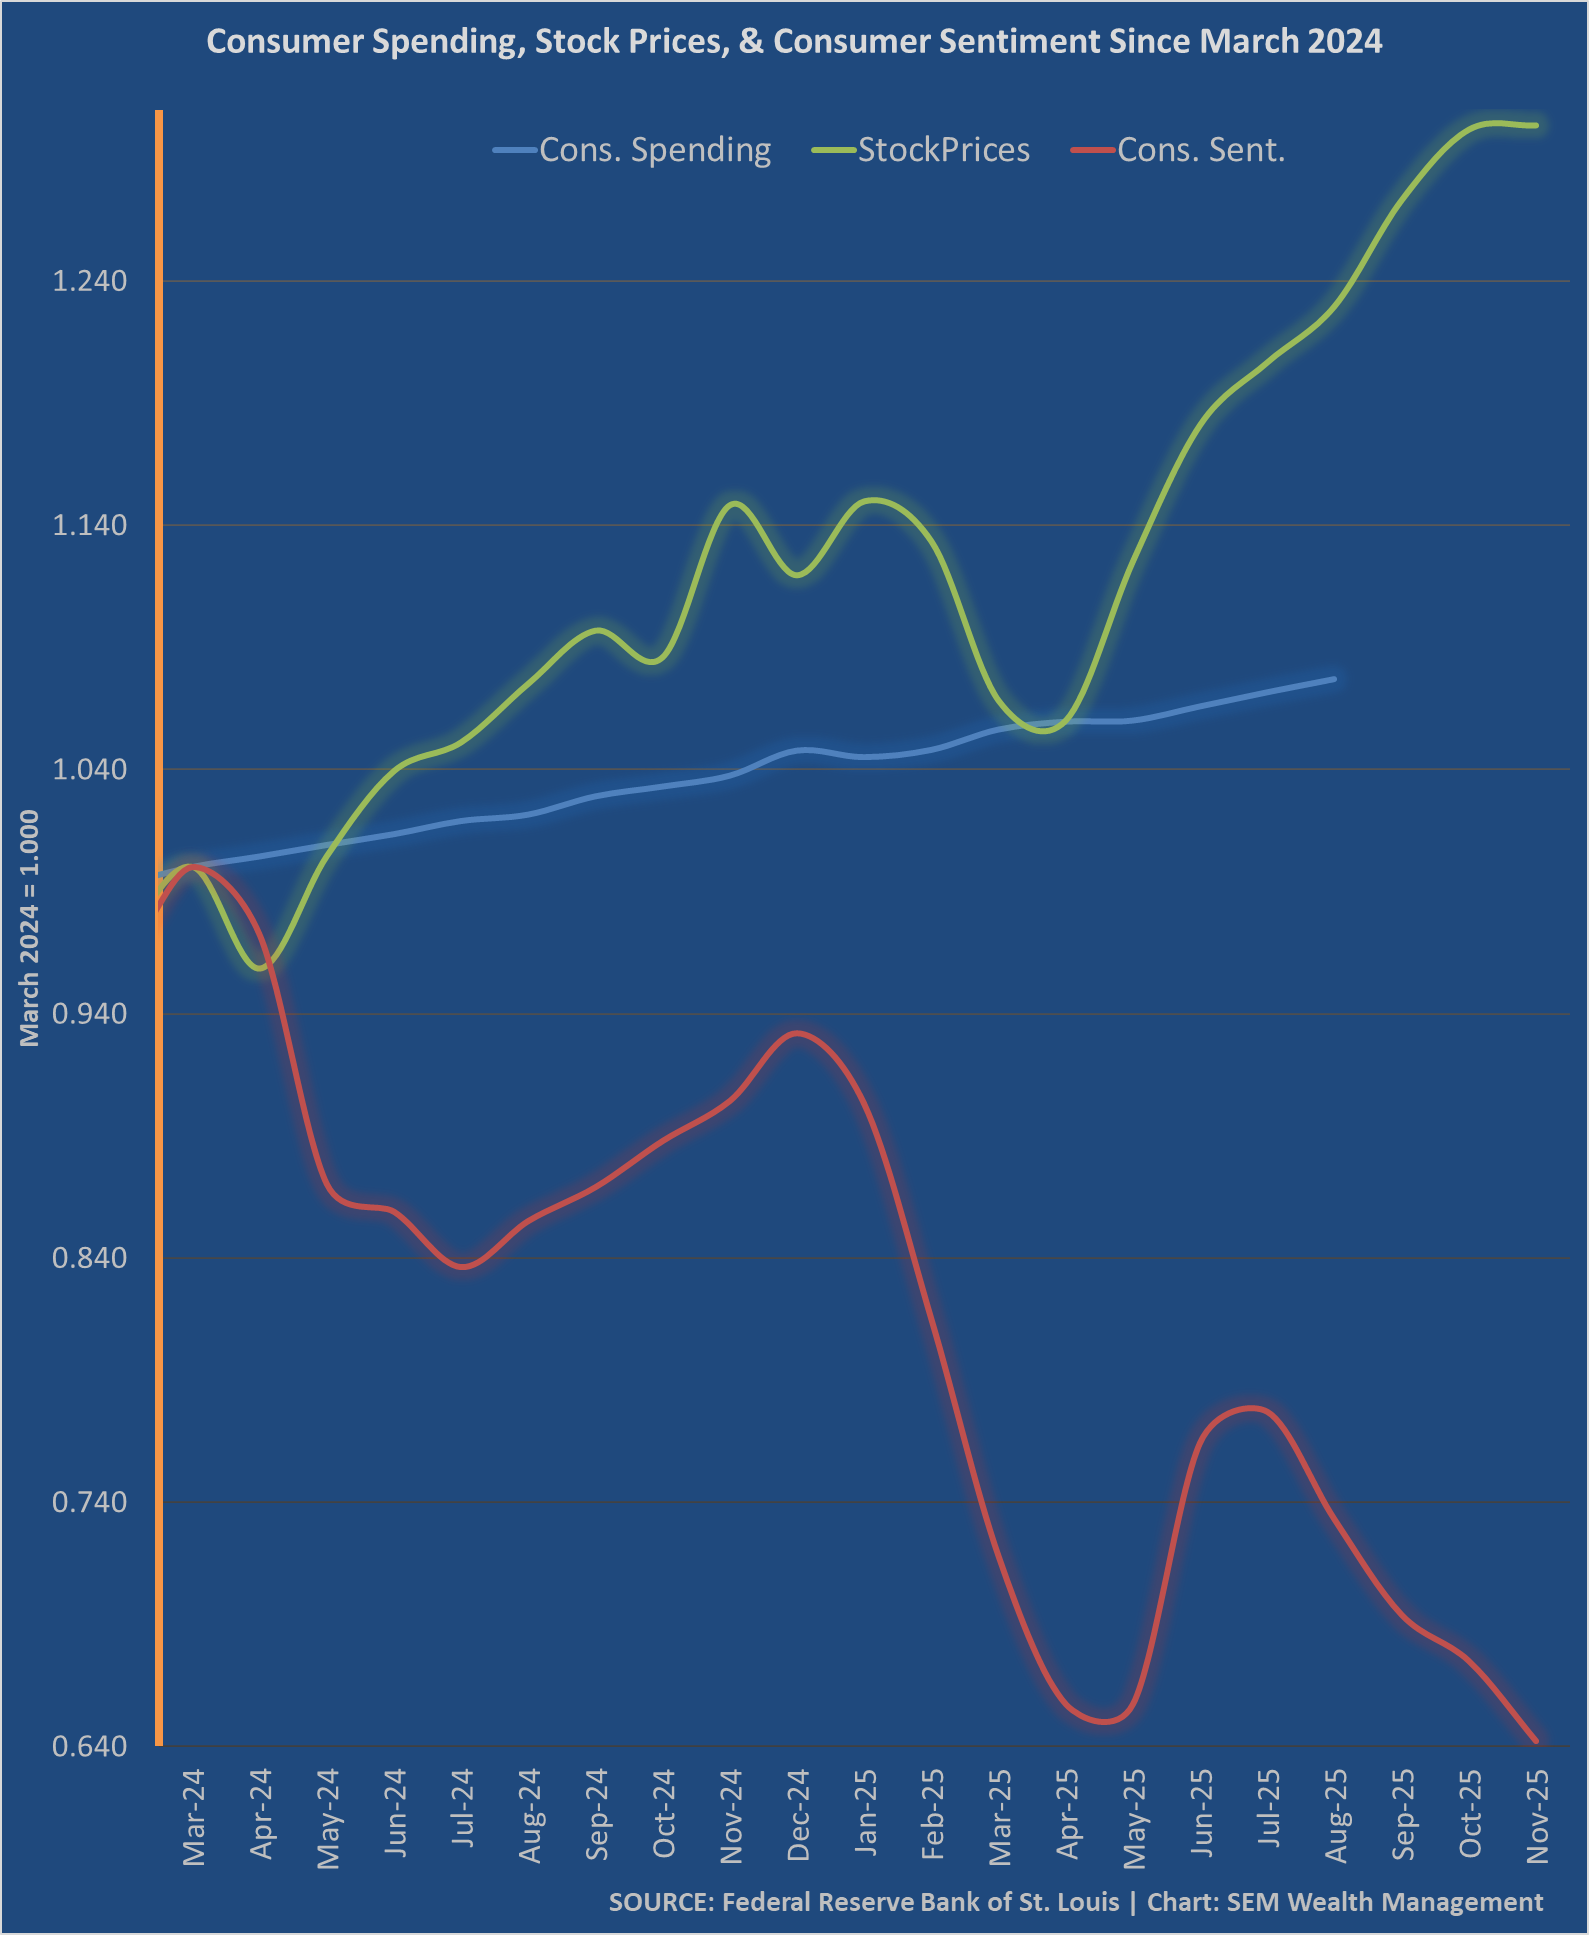
The Payrolls report for October and November confirmed what we learned from the ADP and other private sector data that we received during the government shutdown – the labor market is most certainly slowing. The monthly chart illustrates the continued decline in the number of new jobs, which has been falling at a steady rate since early 2024.
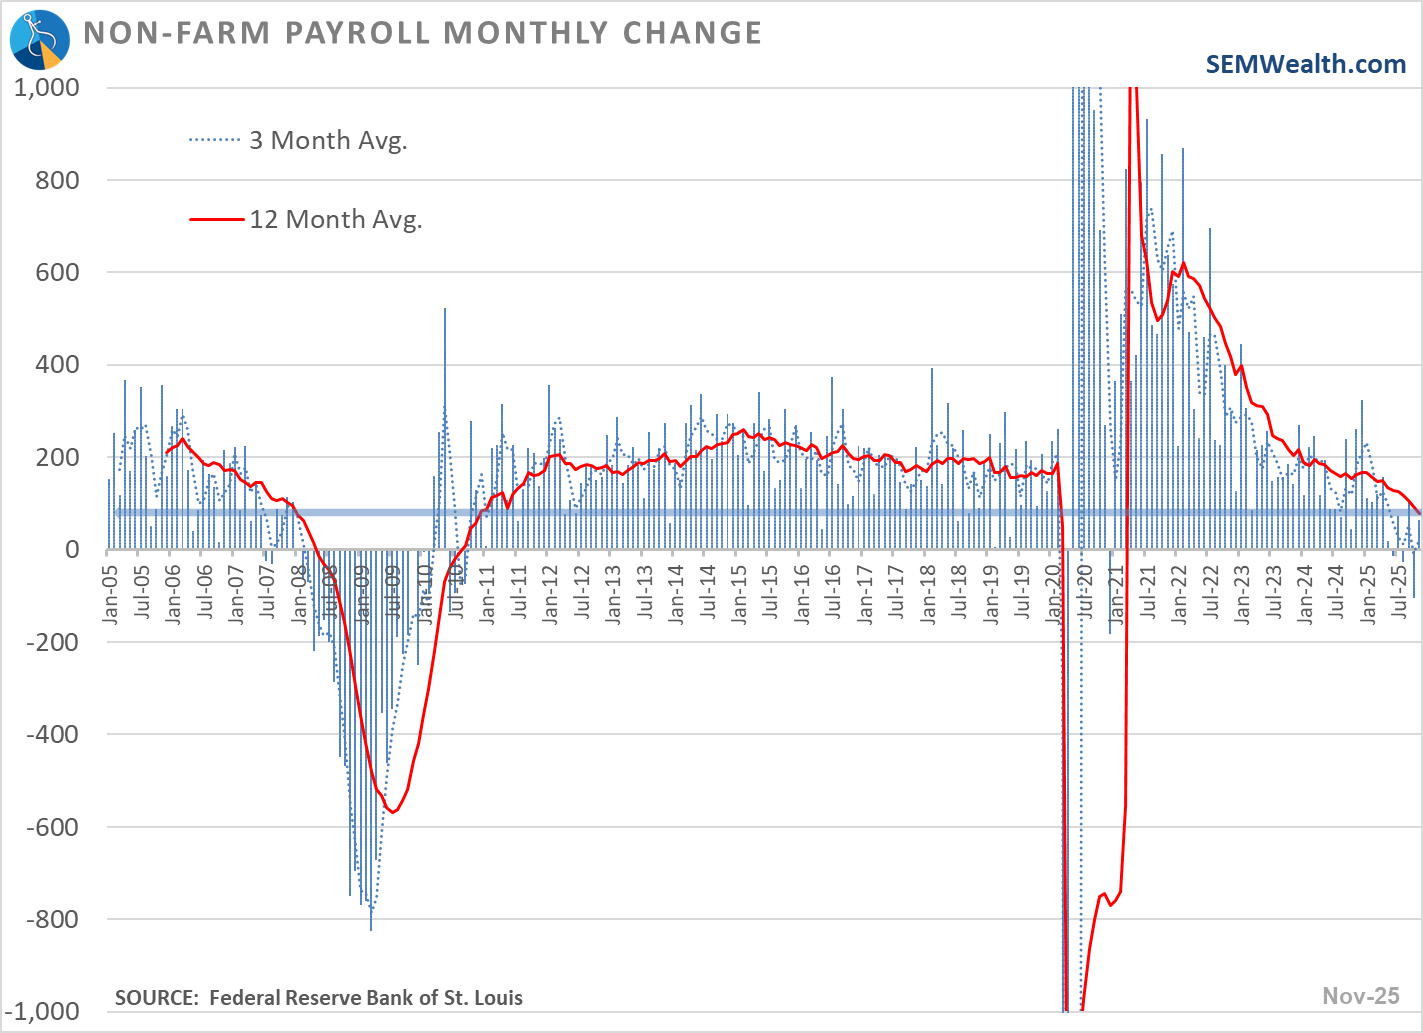
The unemployment rate ticked up again. It still isn't at a level to be overly concerned about, but it is now approaching the highest non-pandemic level we've seen since early in President Trump's 1st term.
Historically, every time we've seen the 12-month change fall below 1% we've been in the early stages of a recession. (Remember, we often do not know we entered a recession until months down the road as the official data rolls in.)
The market is hoping the Fed's rate cuts will be enough to stem these payroll losses without sparking inflation. The issue of course, is the bond market is still keeping longer-term rates too high.
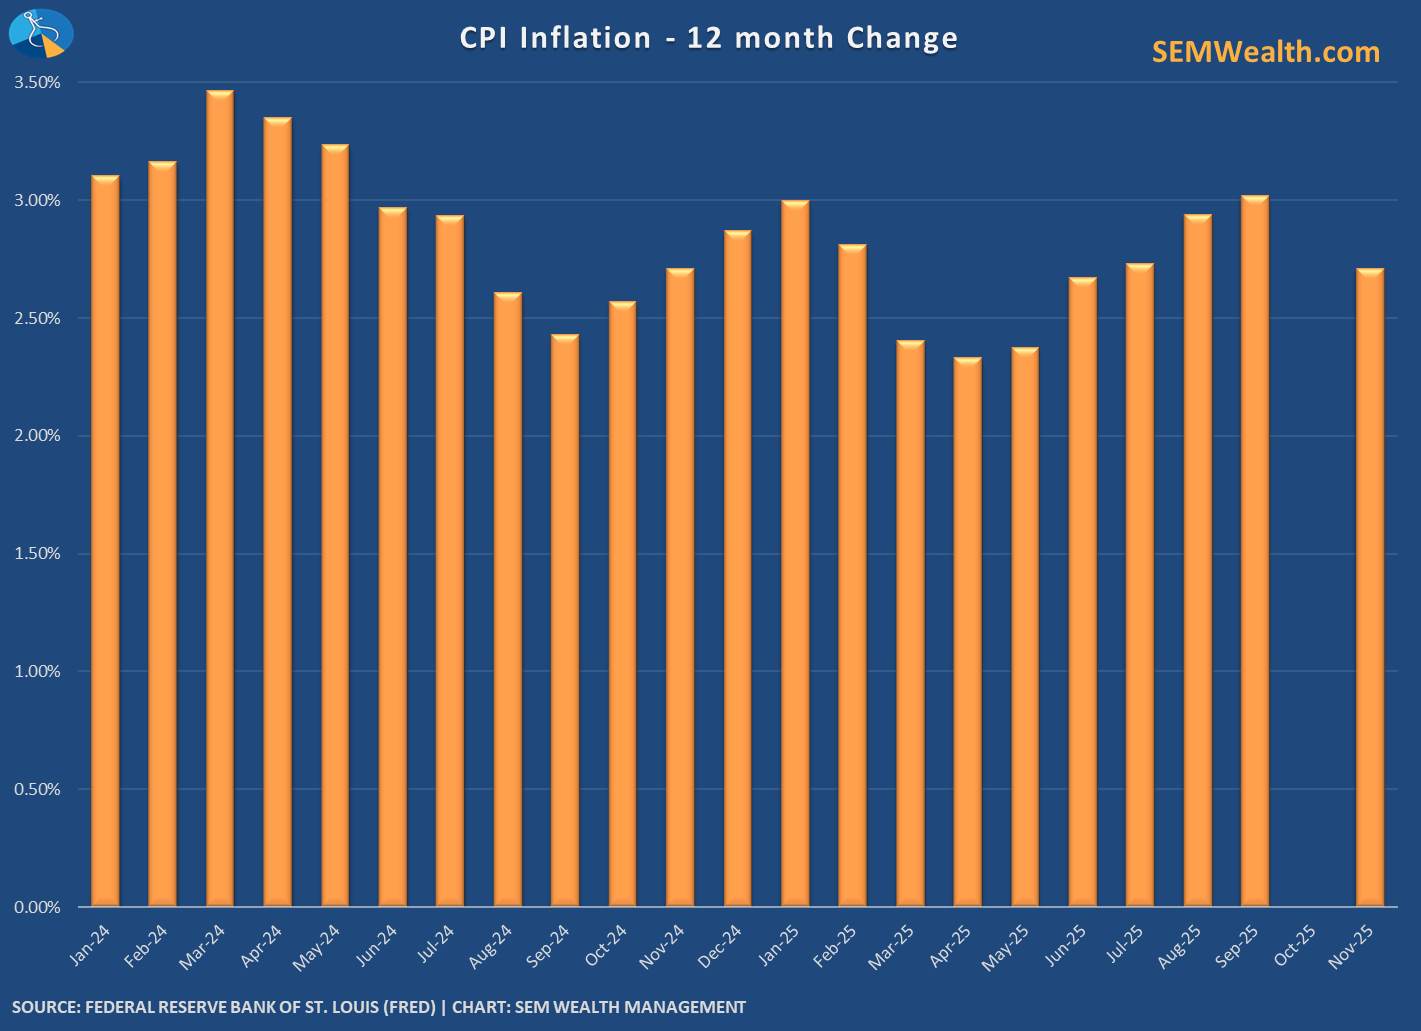
The stock market did celebrate Thursday's release of CPI data for November, which showed the 12-month inflation rate falling to 2.7% from September's 3.0%. Economists questioned the data, including New York Fed Governor (and the latest "finalist" to be tossed into the 'favorite' category to be named the next Fed Chair), John Williams said the data is missing some key weeks and probably is not showing the whole picture. Mr. Williams indicated this is one reason why the Fed went "slow" with just a 25 bp cut in December.
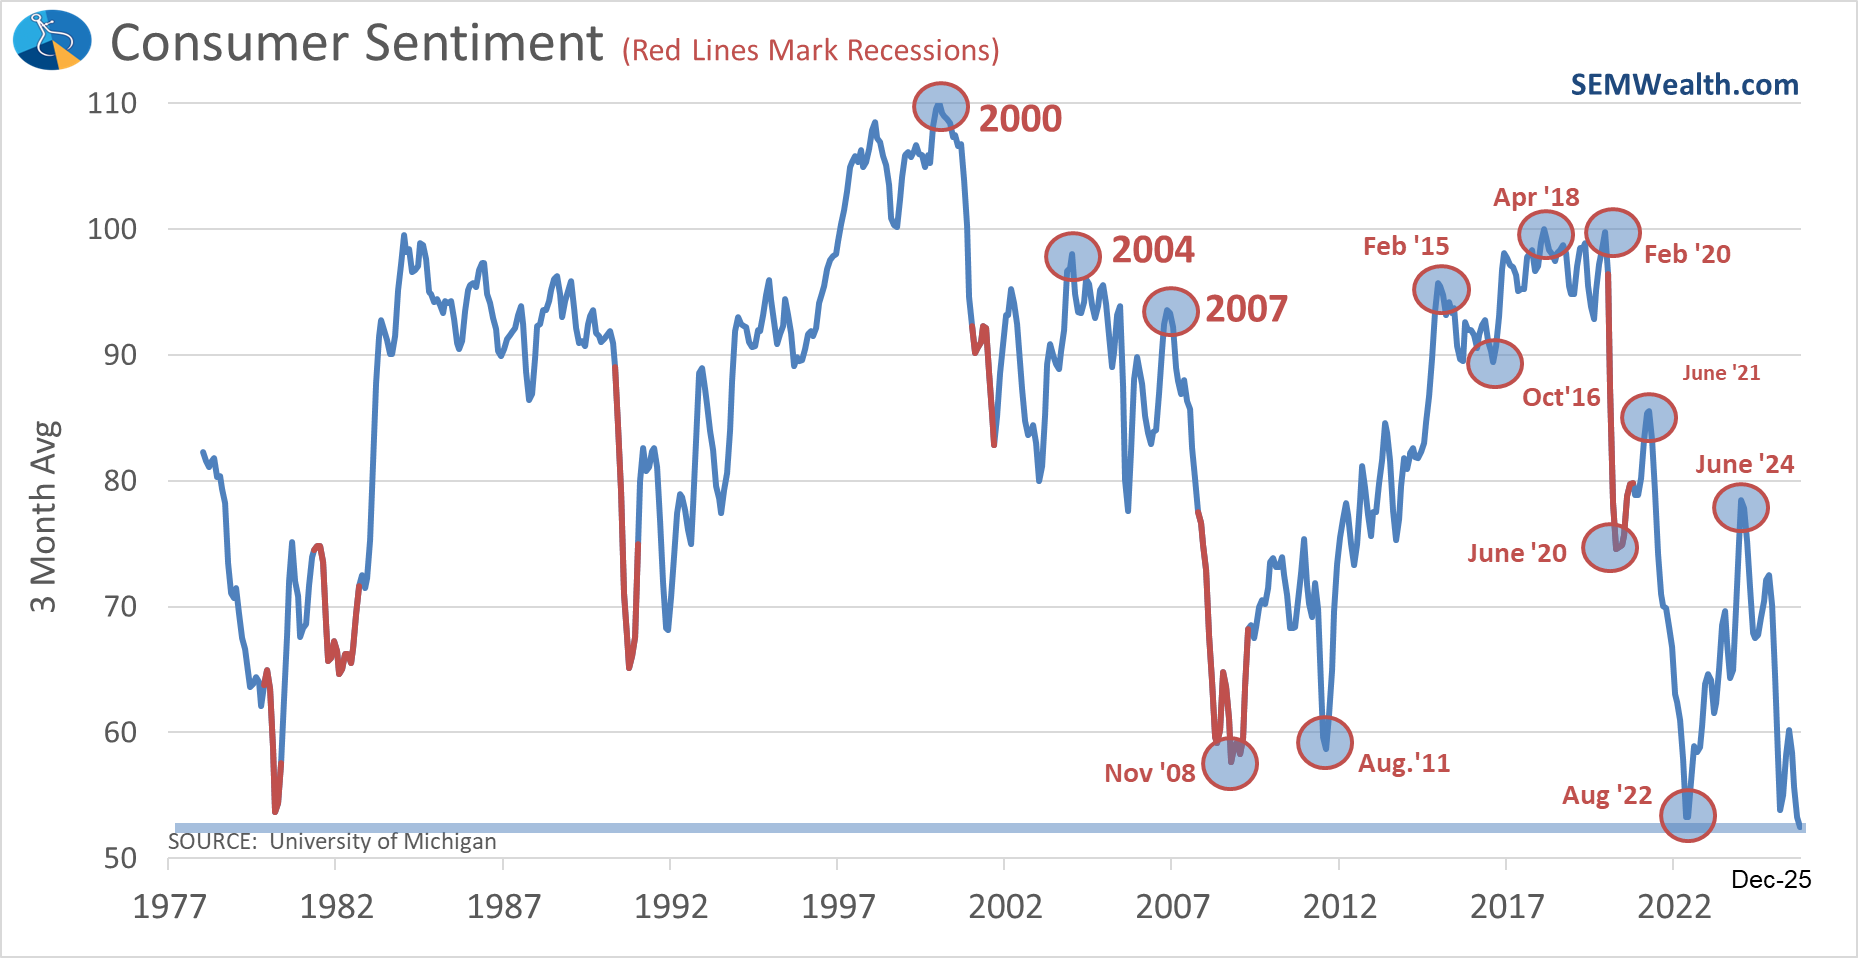
The final piece of data we received last week was the December Consumer Sentiment report. The 3-month average has now fallen to the lowest level on record – eclipsing the lows of August 2022 (when inflation was at 8%) and 1981 (when inflation was 11%).
President Trump's approval rating has been falling throughout the year, but he has enjoyed an uptick recently. Last week the President began what is expected to be the focus of 2026 heading into the mid-terms – a campaign to highlight his accomplishments and to expand his focus on ways he is helping the middle class.
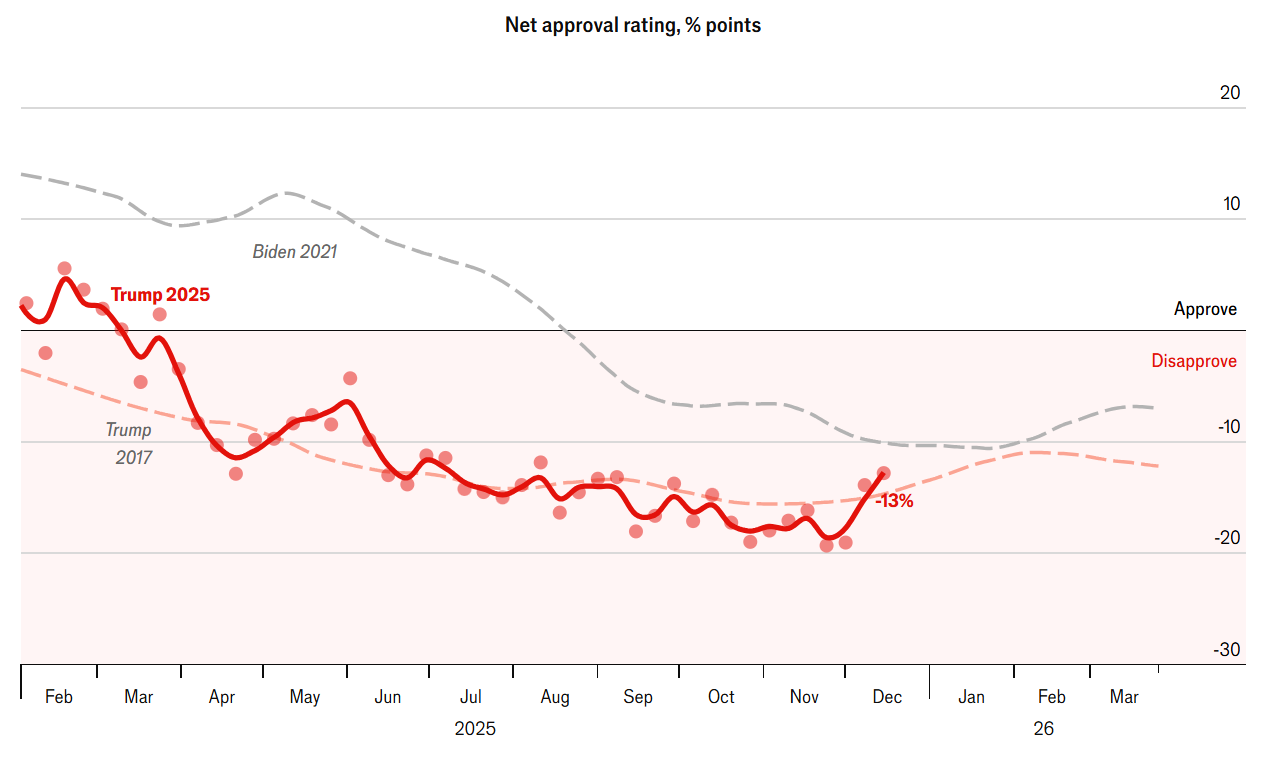
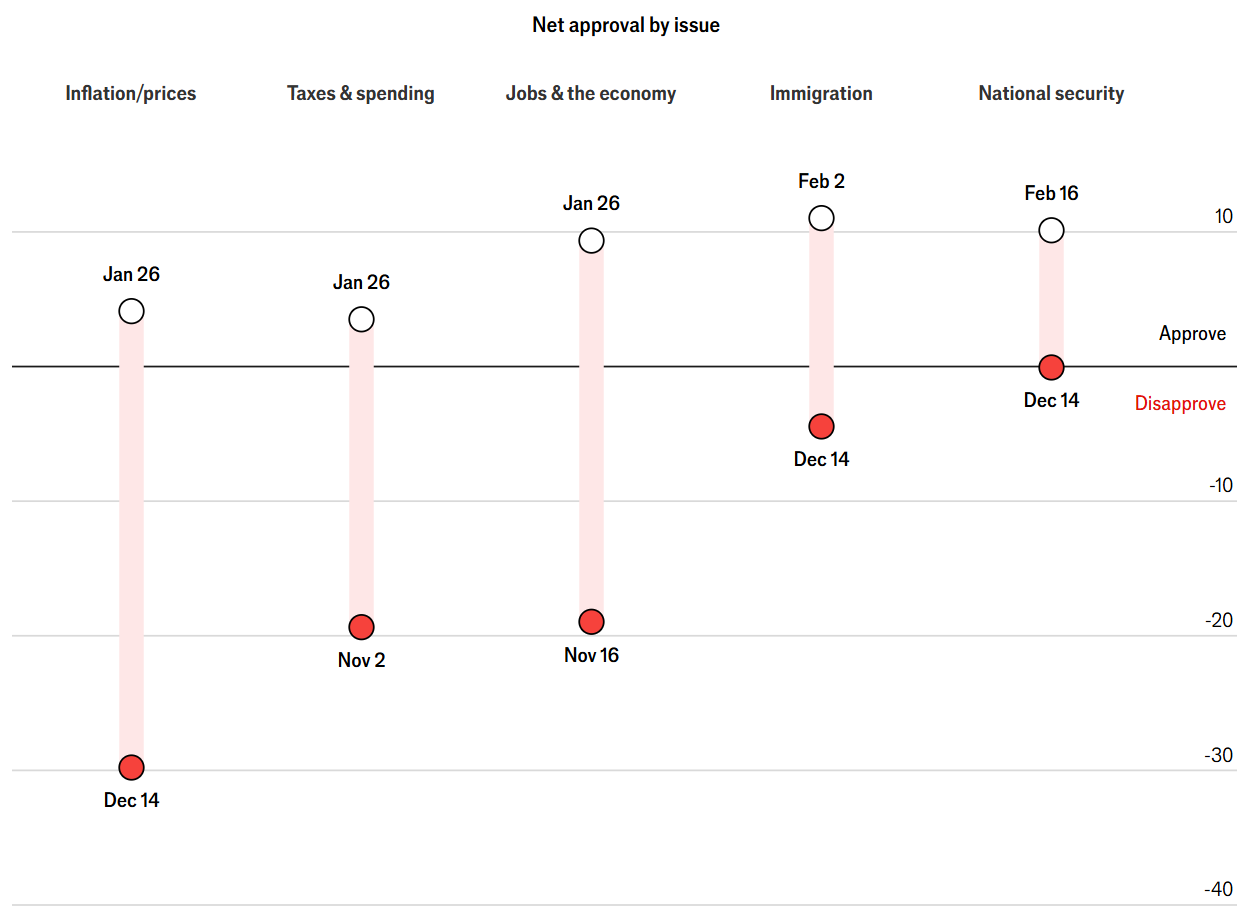
It is certainly a concern given the overall disapproval the country has on topics where both President Trump and the Republican party in general have historically had an edge.
All of this goes back to the K-Shaped economy we first discussed during the pandemic. Those who were able to work from a laptop (or who were already retired) received stimulus checks they didn't need. Those who's income needed to be generated in person received stimulus checks that weren't big enough to sustain them. This broke the economy and is something we are still dealing with today.
I don't know HOW the President or Congress will try to fix this, but we do know they will most certainly try.
What that means for the market and the economy is anybody's guess. For now we will continue to do what we've always done – focus on the data with an eye towards risk management. We'll leave the opinions and speculation to the "experts".
Toby's Take
A summary of the WSJ articles our intern read last week.
12/15/2025 - Why Everyone Got Trump’s Tariffs Wrong - WSJ
When "Liberation Day" happened, everybody had a feeling that it could cause some major issues, and according to economists increased the chances of a recession by over 20%. They also expected that there would be major layoffs. However, it is starting to look like their predictions may be wrong. Since the tariffs have been put in place there hasn't been any major job growth declines, in fact there has been increased jobs almost every month. We did see it affect the market for a little bit at the beginning, mostly caused by emotional consumer reactions. We aren't at a point yet where we can say how it is going to end, but at this point it's looking pretty good.
12/16/2025 - U.S. Strikes Three Alleged Drug Boats, Killing Eight - WSJ
There have been quite a few air strikes sent on alleged "drug-trafficking" boats done by the U.S. The Trump administration has released little evidence to support their claims on the boats and people inside of them. Because all of these strikes being done on alleged criminals that aren't in an armed conflict with the U.S., it is being questioned on if these are possible war crimes. Also, the strike on September 2nd in the Caribbean had two men killed after surviving the initial strike. That may constitute a war crime. Because of all of this, there may be a lot of focus on overall defense spending and lead to pulling out of any military investing and can impact our Patriot Portfolio.
12/17/2025 - Exclusive | Warner Preparing to Tell Shareholders to Reject Paramount Offer - WSJ
More news on the fight over Warner Bros. Warner Bros. is now preparing to tell it's shareholders that they are rejecting Paramount's latest offer and accept Netflix's. Yesterday, WBD closed at $28.90 and Netflix is offering to pay $27.75 per share in cash-and-stock, while Paramount's offer is $30 per share in cash. Now we are waiting to see if Paramount is going to increase their offer or just back off the fight. Either way, there is a solid chance of consumer emotions around all three companies stocks and can see big jumps or drops.
12/18/2025 - U.S. Approves $11 Billion in Arms Sales to Taiwan, Angering Beijing - WSJ
The United States approved a $10 billion+ arms-sale to Taiwan. This is a soft way of showing that the U.S. backs Taiwan, but also trying to not offend China too much. China's Foreign Ministry spokesman Guo Jiakun said that the deal would backfire by turning Taiwan into a "powder keg." Despite that, this is a huge deal and can show signs of more military sales potentially increasing value of our Patriot Portfolio.
12/19/2025 - Exclusive | Meta Is Developing a New AI Image and Video Model Code-Named ‘Mango’ - WSJ
Meta Platforms is now working on developing a new AI image and Video Model that will learn from visual information. This is not just a big step in AI development itself, but could be very positive for Meta if it is successful. Meta has an AI team that has been restructured over the summer with their new hire, Chief AI officer, Alexandr Wang. They also hired 20 researchers from OpenAI having over 50 new researchers, engineers, and other staff all with AI expertise. This news alone can affect the market in a positive way because of this innovative step in AI from yet another big player.
Market Charts
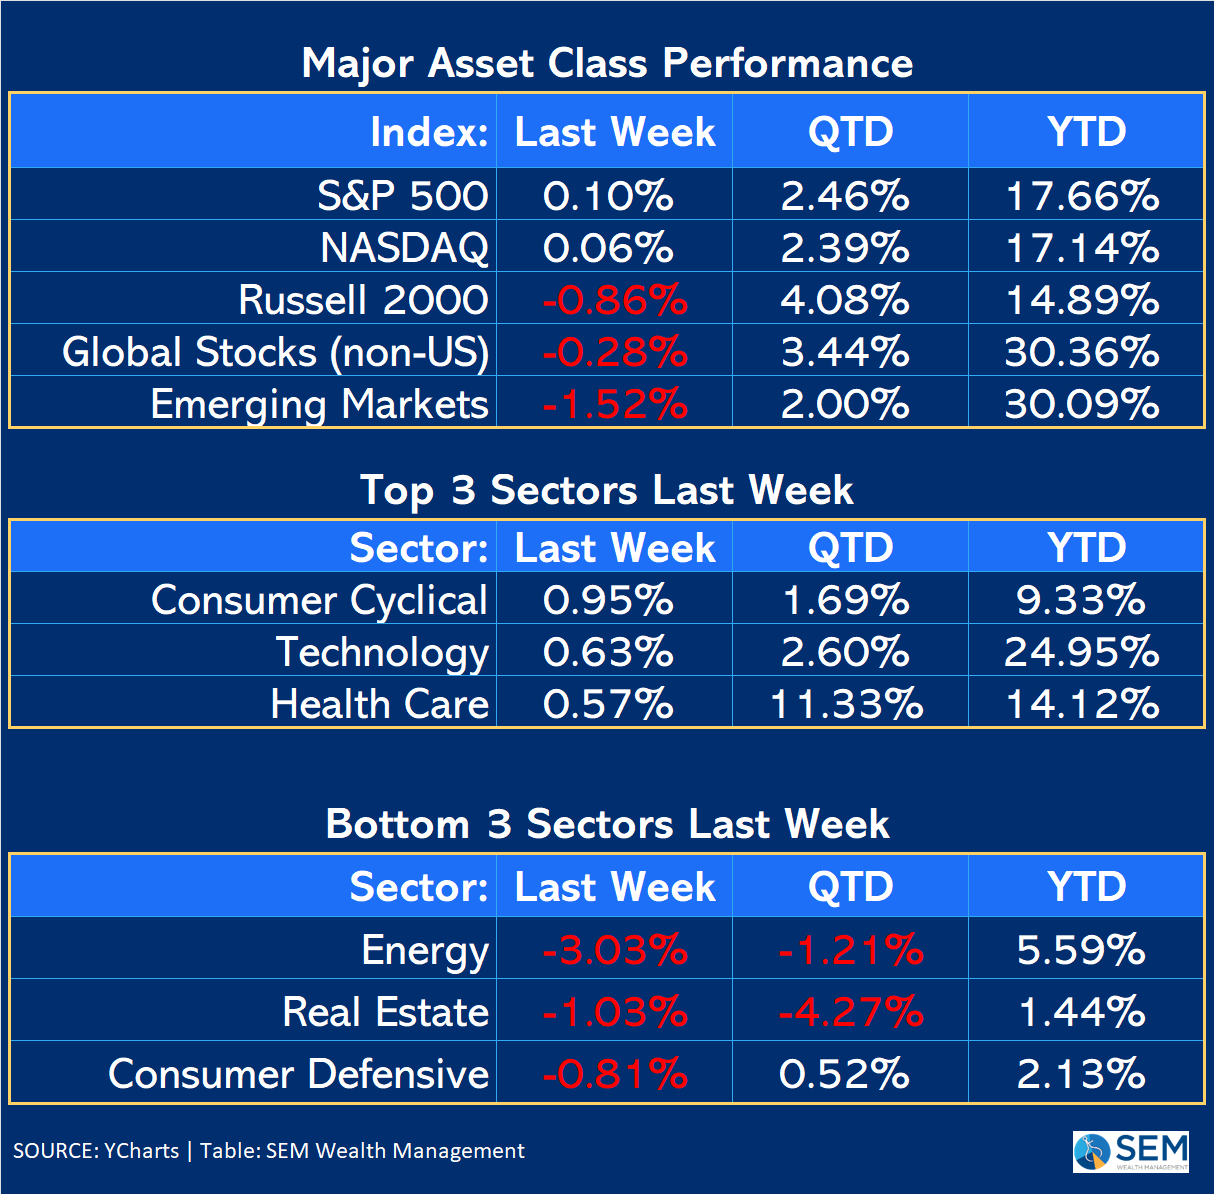
The market again shifted last week to "growth" mode, with the defensive sectors getting hit once again. The first 3 days were down and the last 2 were up just enough to give us a "flat" week for the S&P 500. Small caps (again) fell.
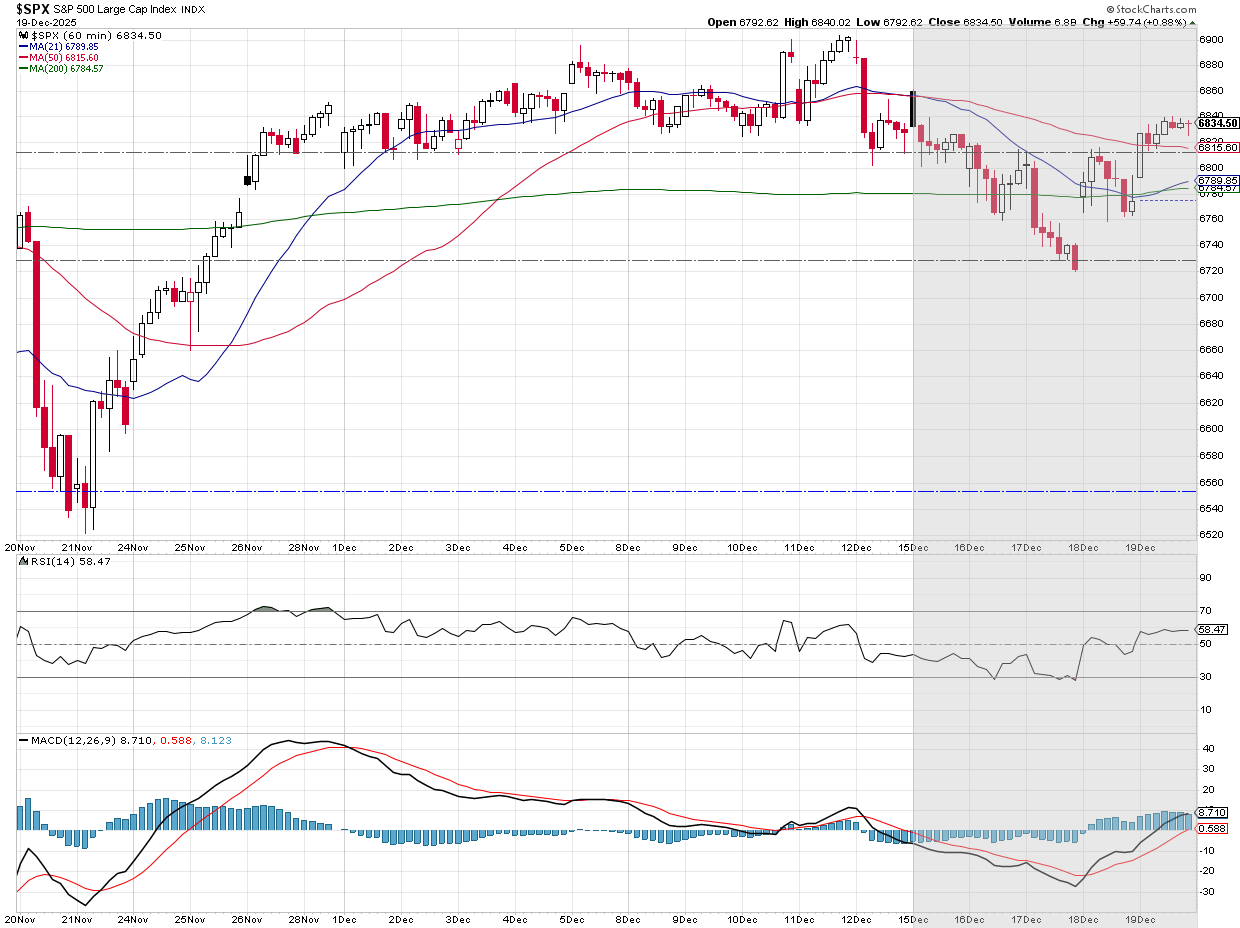
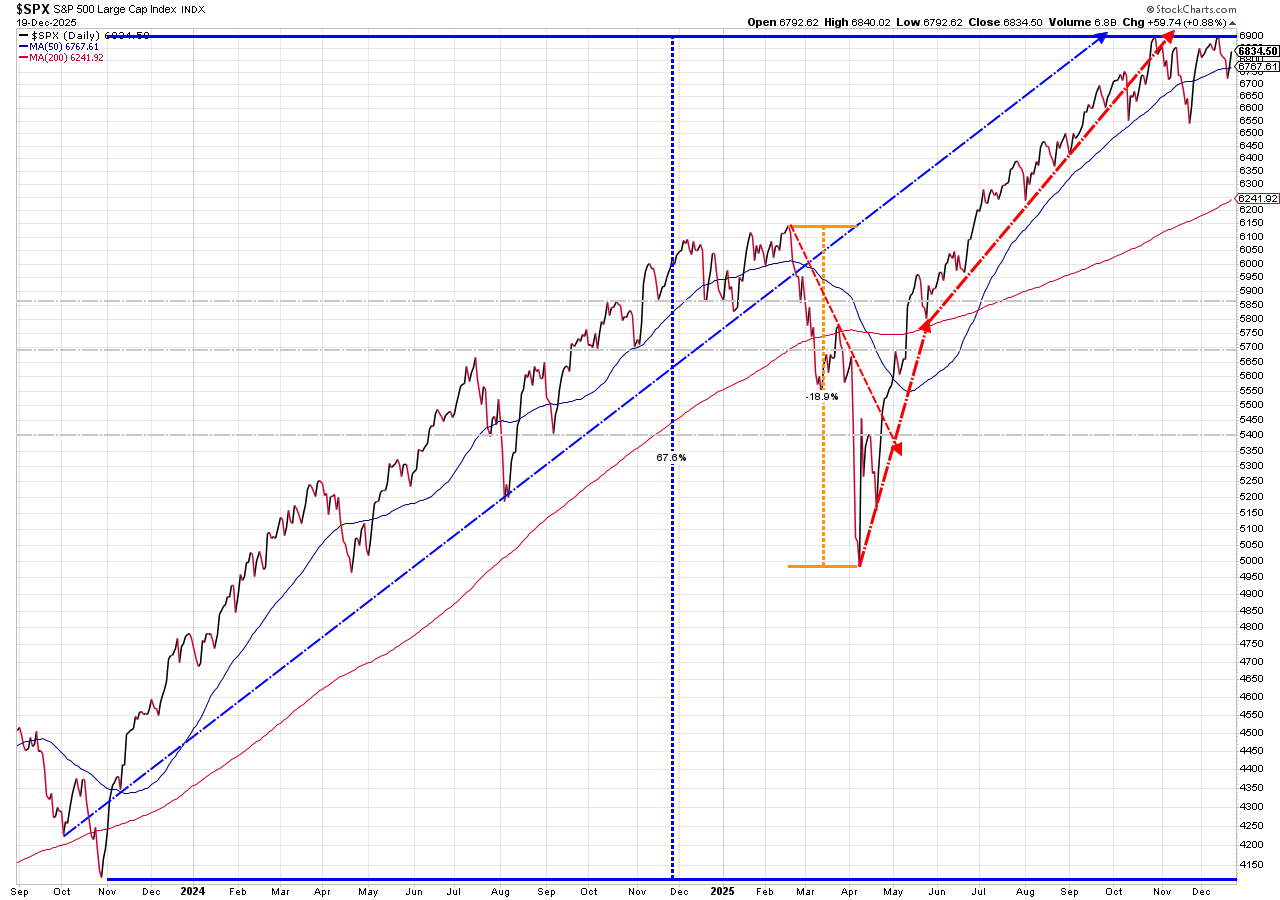
Bigger picture we did see some negative signals for the S&P, but the "Santa Claus" rally typically starts around December 18 and continues through the first 3-5 days of January (at least according to our testing.) This could lead to some tailwinds behind the market.
If most portfolios look like ours there are some very large unrealized gains especially in large cap stocks that managers will be reluctant to sell in 2025. If like us, those managers harvested losses the first week of April, those positions may not be sold/rebalanced until early in the 2nd quarter.
Lest anybody forget, this rally started a little over 2 years ago when the Fed announced the end of their rate hiking cycle. A 25-month, 67% rally has ensued in the S&P 500, only interrupted by the 19% drop during "liberation week" in April.
Bond yields fell a bit last week on the inflation data. Despite that, the longer-term yields are still hinting at inflation problems down the road.
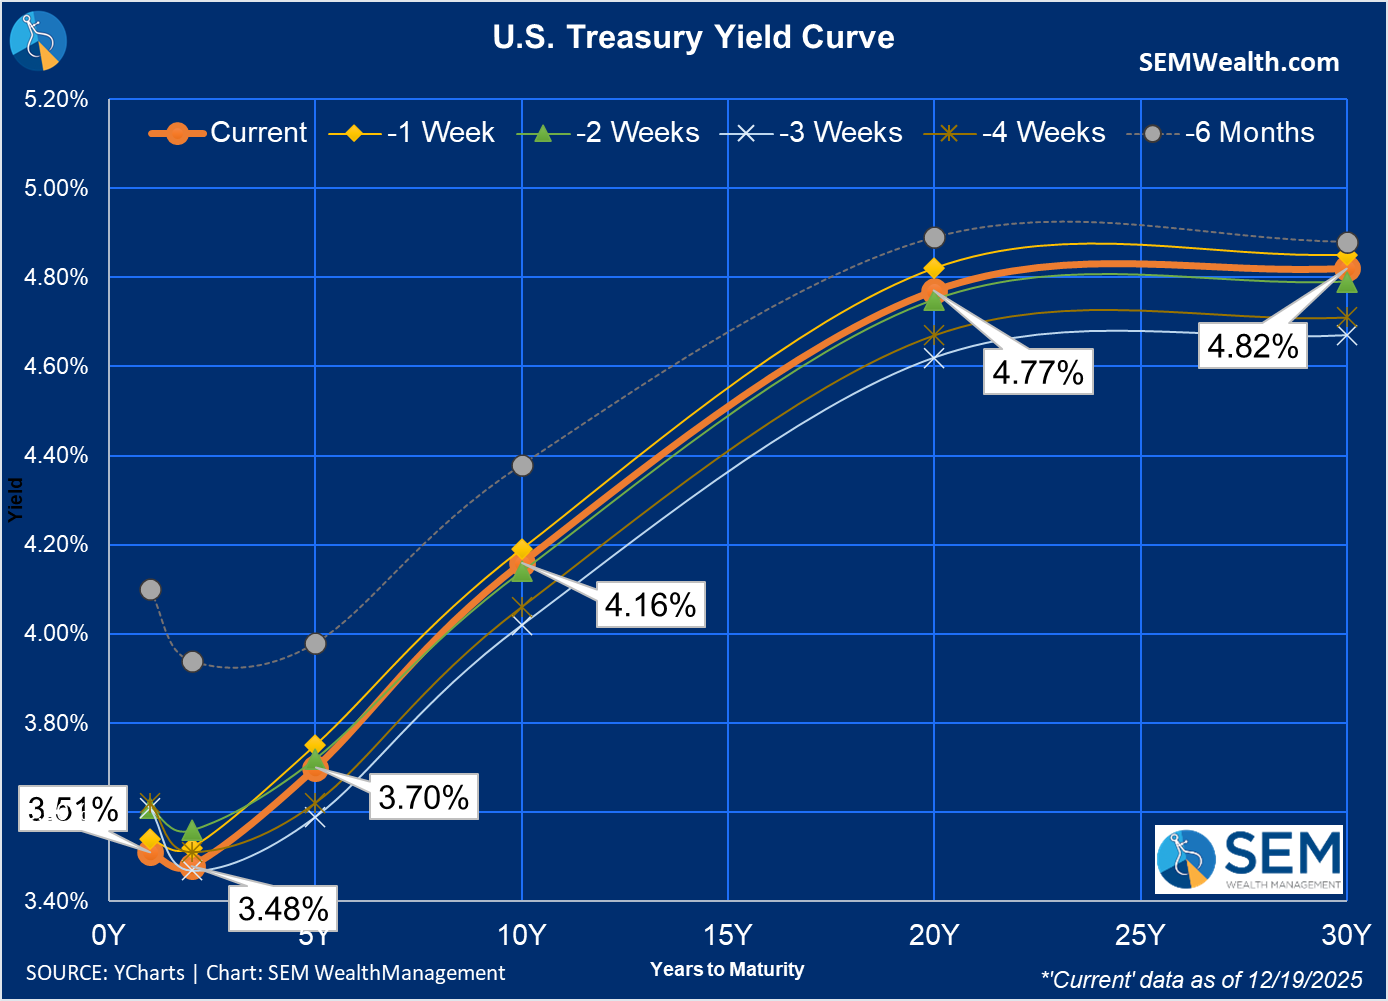
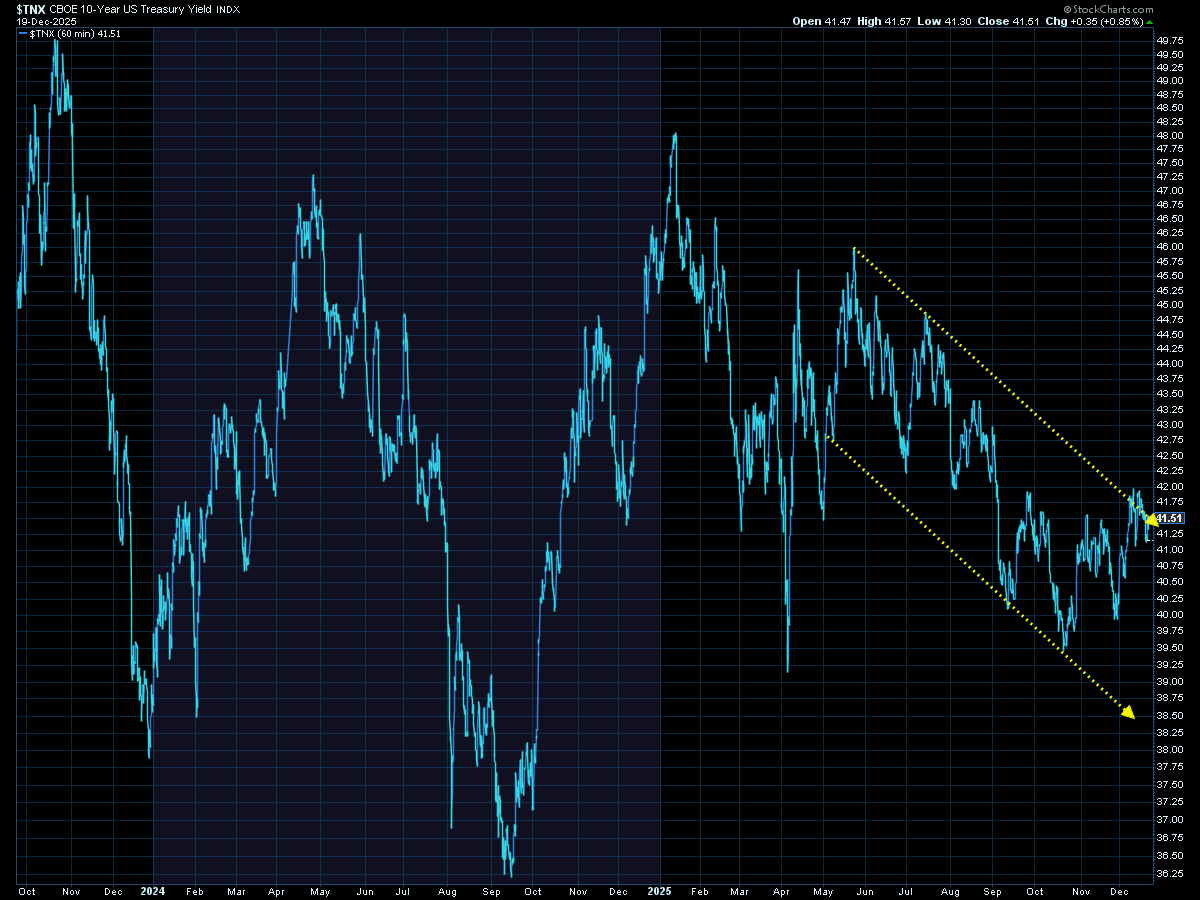
The 10-year did fall back into our downtrend channel, which is good news (for now.)
SEM Market Positioning
| Model Style | Current Stance | Notes |
|---|---|---|
| Tactical | 100% high yield | High-yield spreads holding, but trend is slowing-watching closely |
| Dynamic | Bearish | Economic model turned red – leaning defensive |
| Strategic | Slight under-weight | Trend overlay shaved 10 % equity in April -- added 5% back early July |
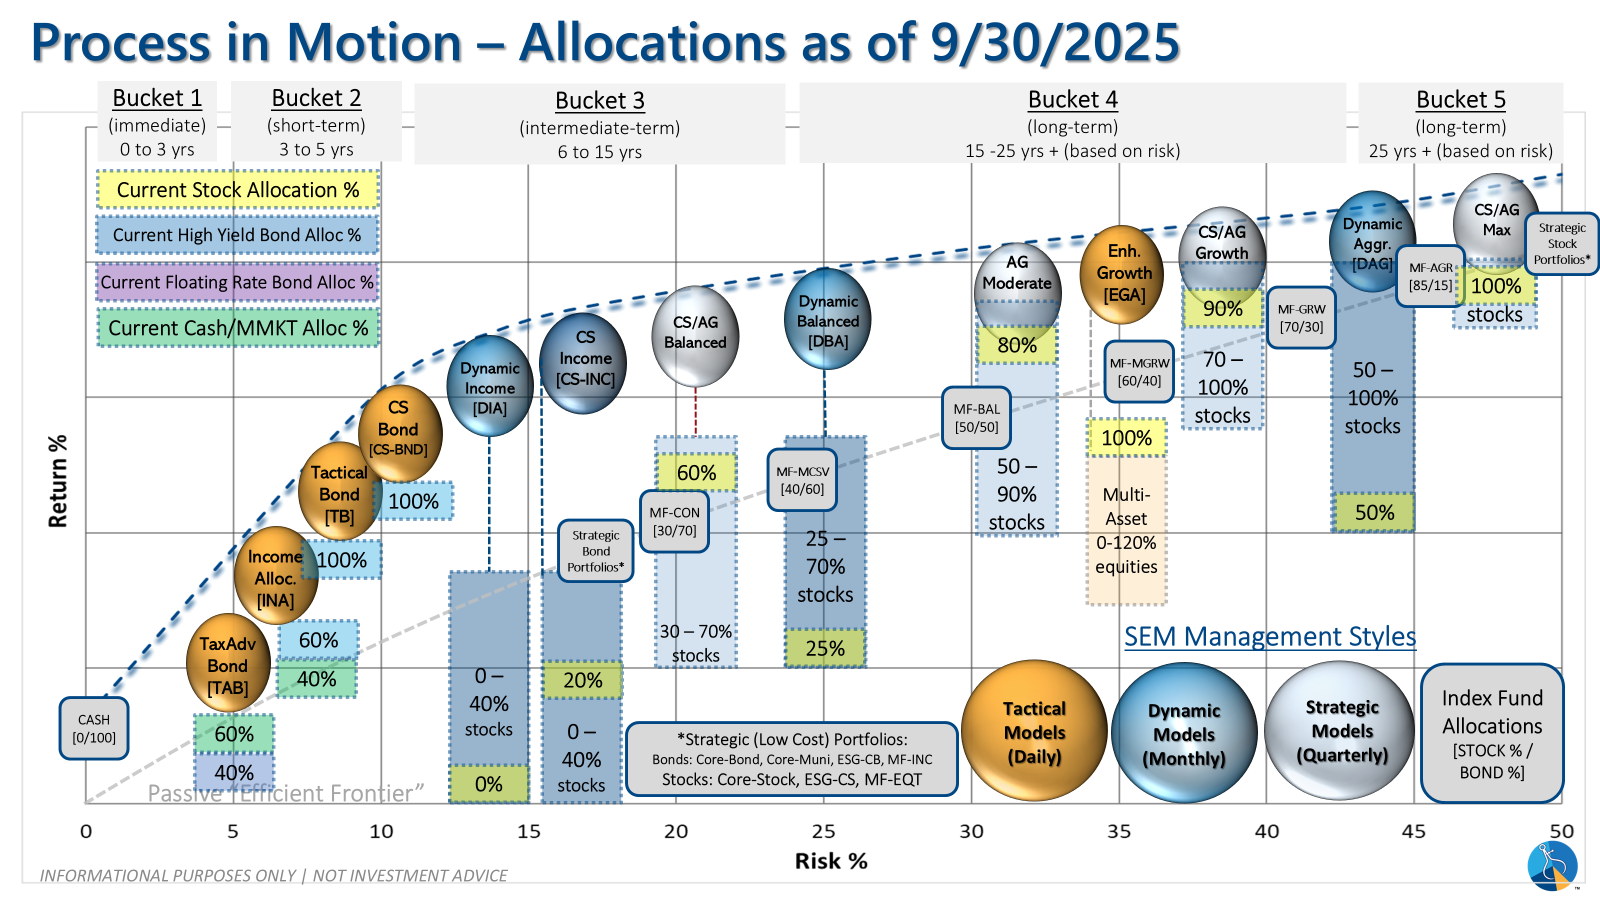
SEM deploys 3 distinct approaches – Tactical, Dynamic, and Strategic. These systems have been described as 'daily, monthly, quarterly' given how often they may make adjustments. Here is where they each stand.
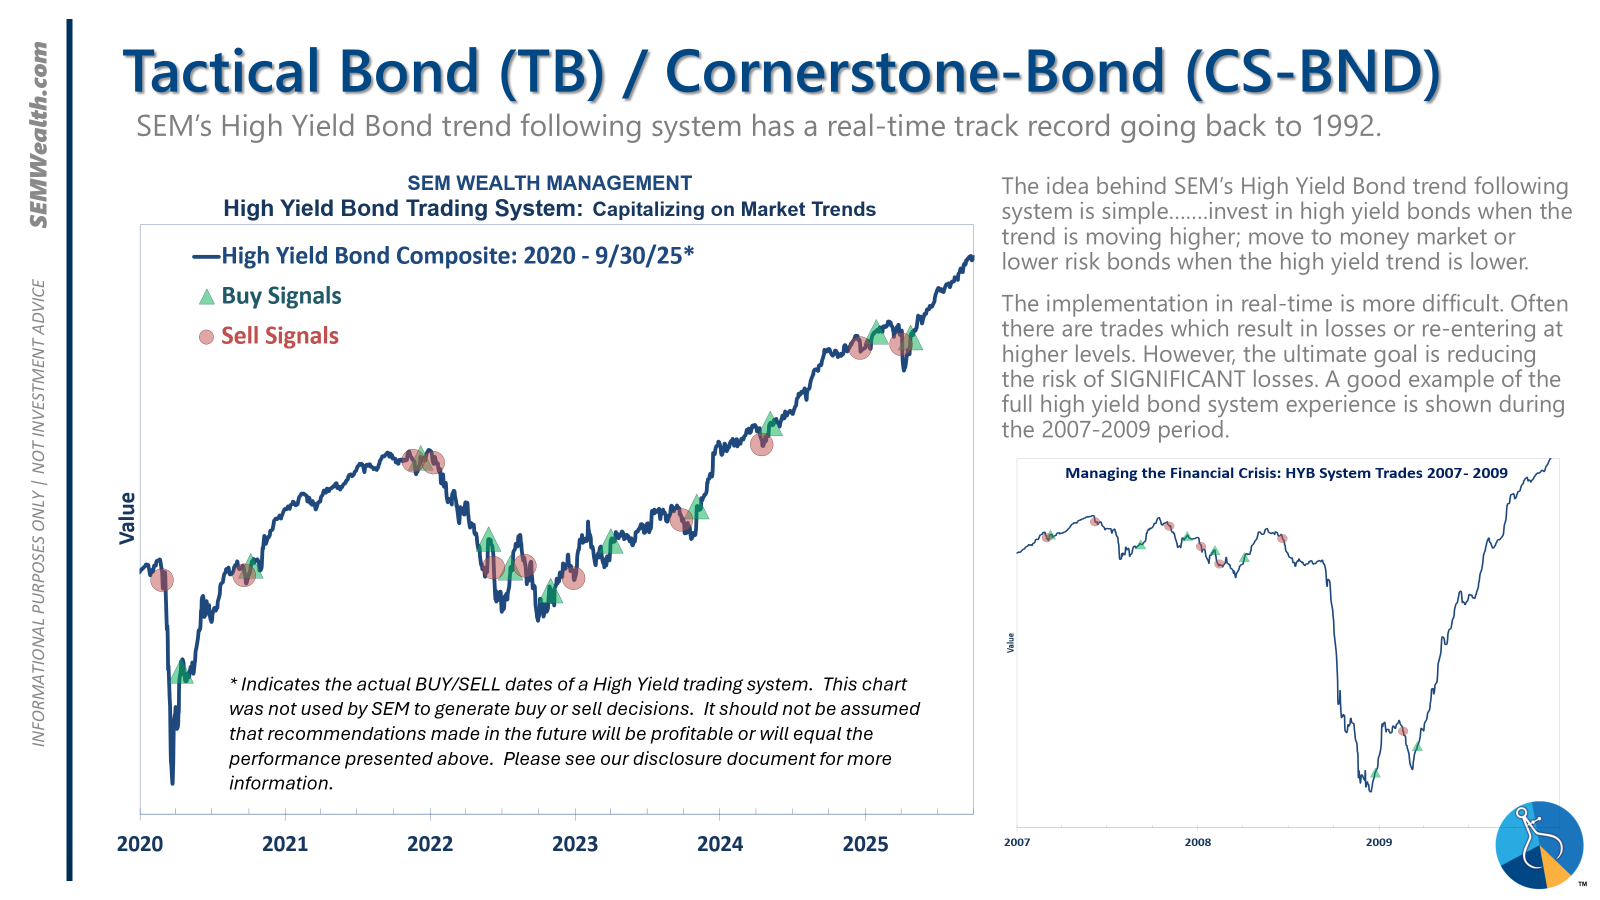
Tactical (daily): The high yield system has been invested since 4/23/25 after a short time out of the market following the sell signal on 4/3/25.
Dynamic (monthly): The economic model went 'bearish' in June 2025 after being 'neutral' for 11 months. This means eliminating risky assets – sell the 20% dividend stocks in Dynamic Income and the 20% small cap stocks in Dynamic Aggressive Growth. The interest rate model is 'bullish' meaning higher duration (Treasury Bond) investments for the bulk of the bonds.
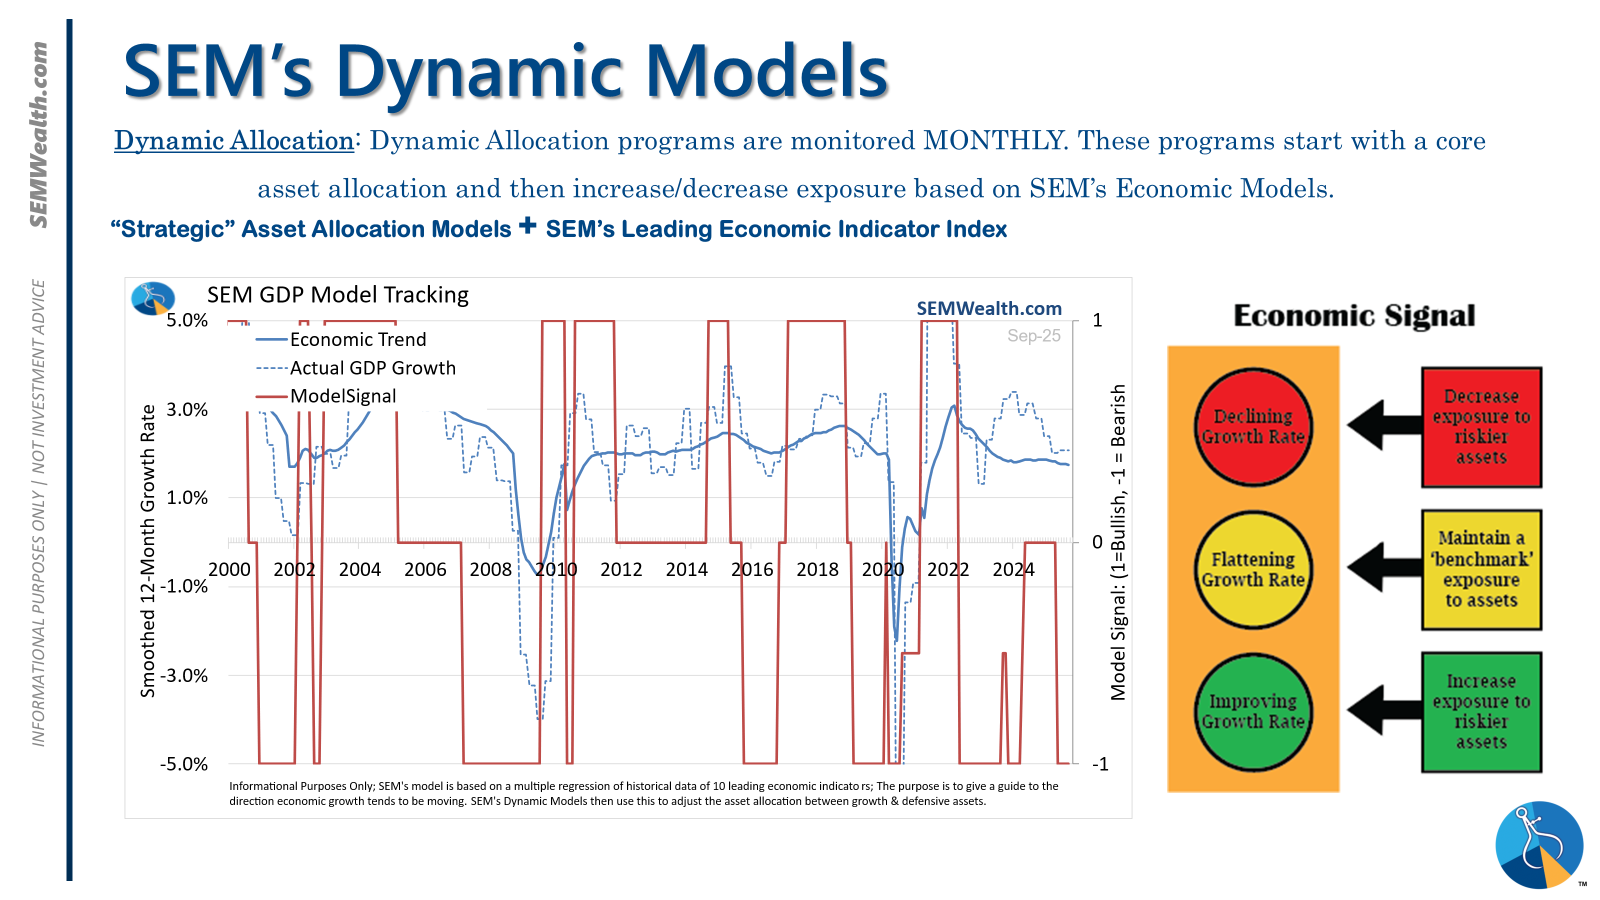
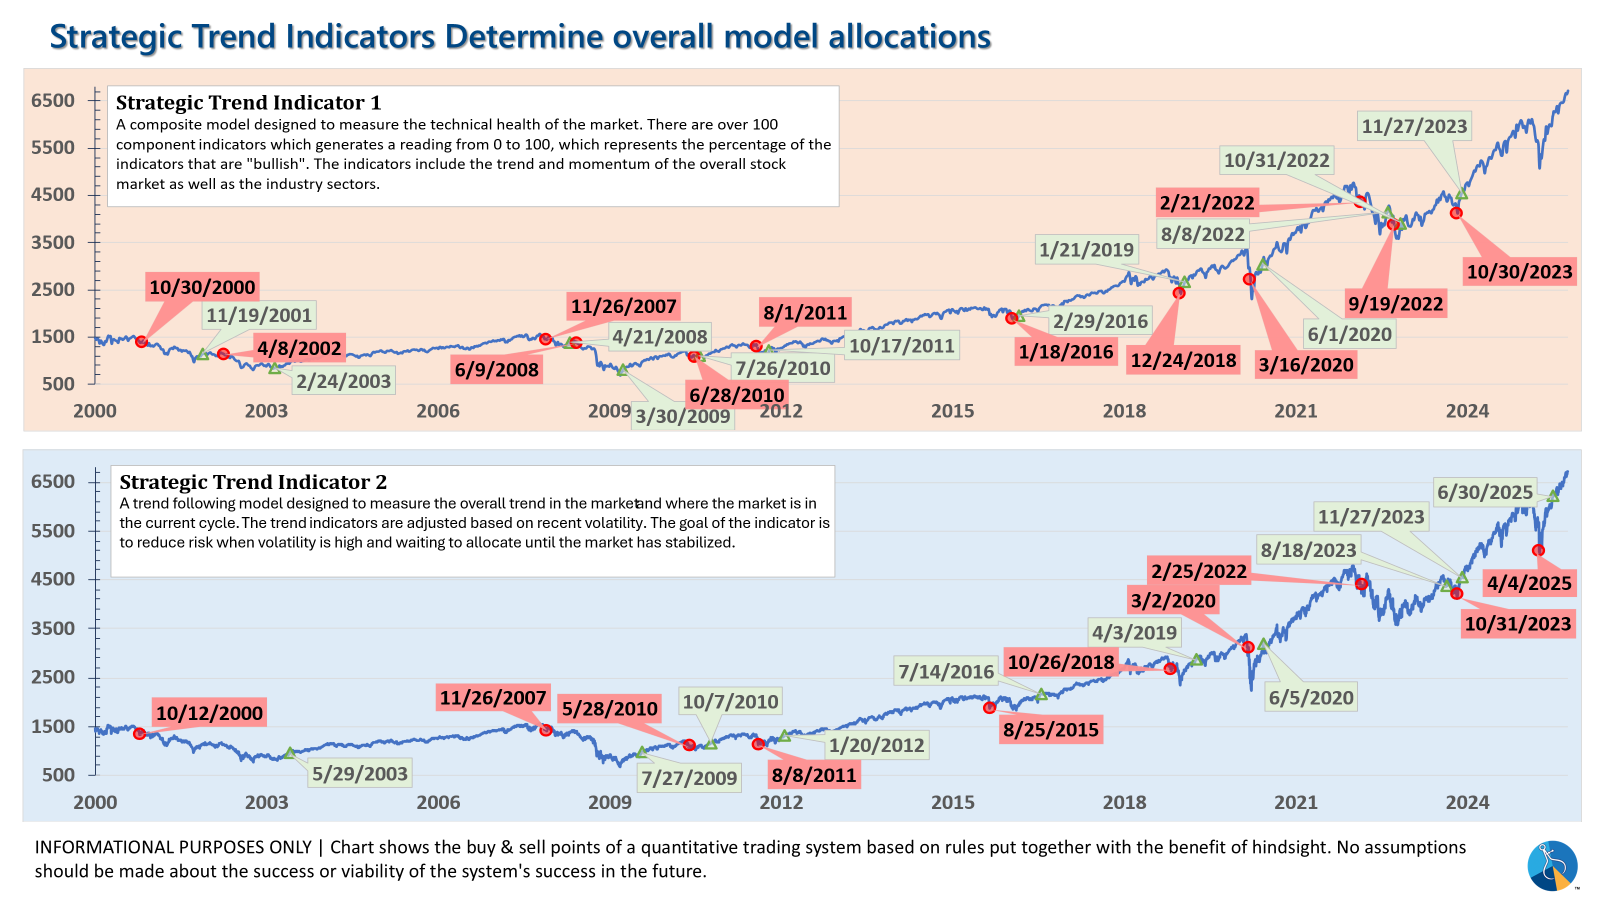
Strategic (quarterly)*: One Trend System sold on 4/4/2025; Re-entered on 6/30/2025
The core rotation is adjusted quarterly. On August 17 it rotated out of mid-cap growth and into small cap value. It also sold some large cap value to buy some large cap blend and growth. The large cap purchases were in actively managed funds with more diversification than the S&P 500 (banking on the market broadening out beyond the top 5-10 stocks.) On January 8 it rotated completely out of small cap value and mid-cap growth to purchase another broad (more diversified) large cap blend fund along with a Dividend Growth fund.
The * in quarterly is for the trend models. These models are watched daily but they trade infrequently based on readings of where each believe we are in the cycle. The trend systems can be susceptible to "whipsaws" as we saw with the recent sell and buy signals at the end of October and November. The goal of the systems is to miss major downturns in the market. Risks are high when the market has been stampeding higher as it has for most of 2023. This means sometimes selling too soon. As we saw with the recent trade, the systems can quickly reverse if they are wrong.
Overall, this is how our various models stack up based on the last allocation change:
Curious if your current investment allocation aligns with your overall objectives and risk tolerance? Take our risk questionnaire


