
If you read last week’s headlines, you’d think the economy just chugged an energy drink and sprinted to 4.3% growth. Sounds great—finally, something going up that isn’t the price of eggs or your morning latte, right? (Seriously, when did coffee become a luxury item?) But before we start high-fiving and printing ‘Mission Accomplished’ banners, let’s pump the brakes. That number is more accounting quirks than actual economic muscle. So here’s the real question: Did the economy really grow at 4.3% as the government reported last week?
No
How do we get to a 4.3% official number?
From July 1 - September 30, the economy expanded by 1.07%. The calculation works like this:
[GDP(Q3) / GDP(Q2)] ^4 -or- take the last 3 months and assume we will grow at the same rate the next 9 months.
So you get 1.0107 x 1.0107 x 1.0107 x 1.0107 = 1.0434....(then subtract 1 and multiply by 100 to get 4.34%)
GDP is the only financial number I know of where a 3-month rate of growth is then annualized (also CPI, but they give BOTH the "annualized" and "year-over-year" numbers). For everything else we compare the growth now versus the last 12 months.
The economy has expanded at a 2.33% rate over the last 12 months. That's BELOW the 2.79% rate we saw a year ago as well as in the fall of 2022 (when many people said we were in a recession.) Granted, back then we had 2 more quarters of ANNUAL declines.
The economy was growing at a 3.23% rate in the fall of 2023.
This is the chart I use to show the difference between the "official" (orange bars) and the annual growth (the solid blue line). The dashed blue line shows the long-term average of 3.1%. This should be the benchmark we use to evaluate the economy.
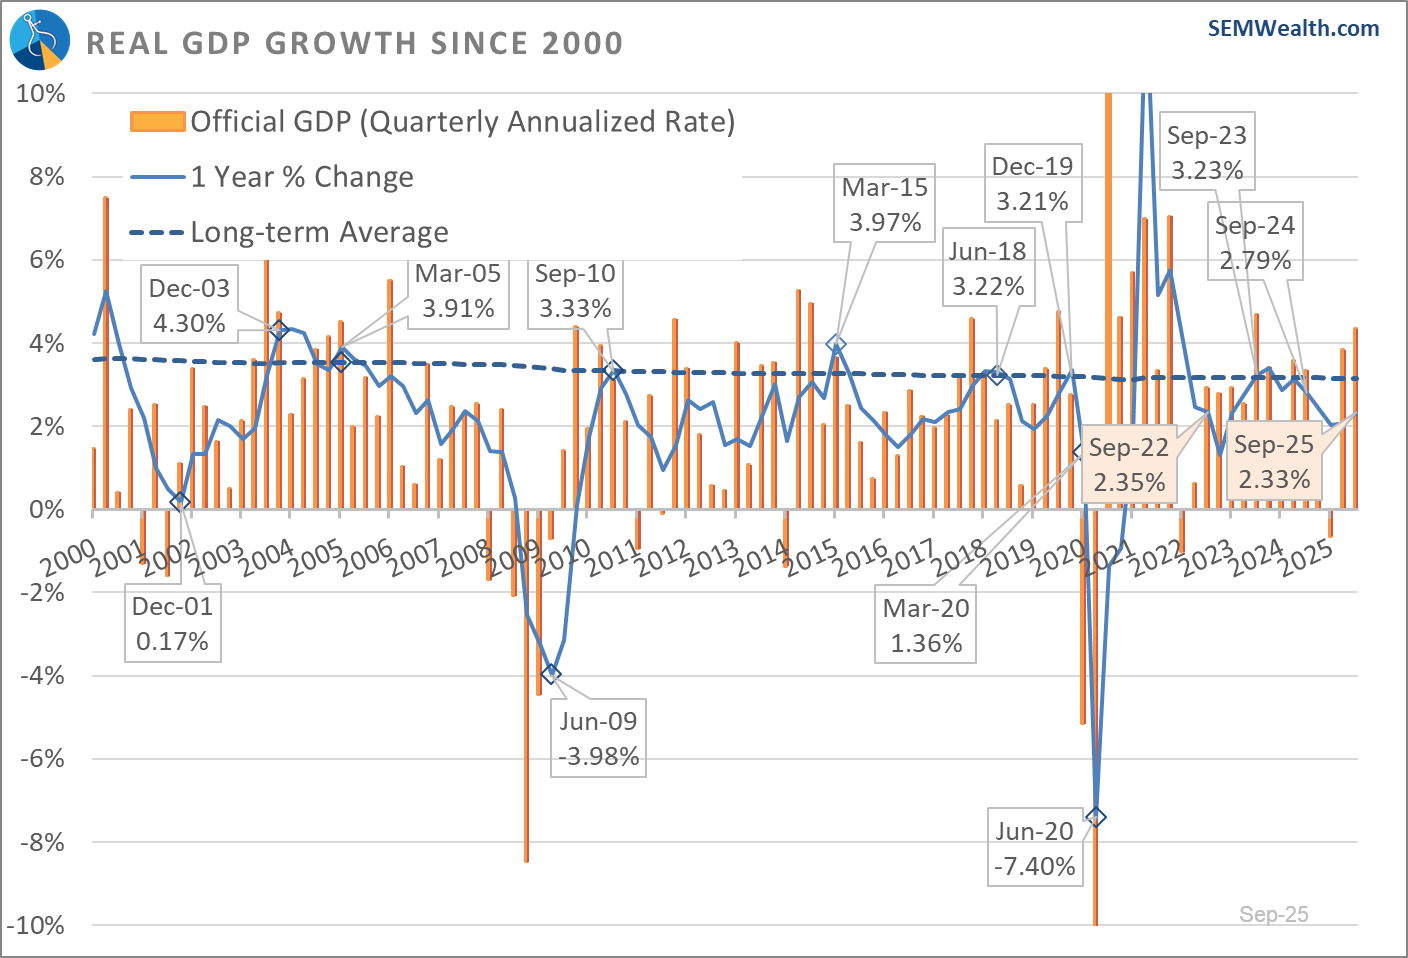
Don't get me wrong, a 1.1% gain in 3 months is amazing, but it is most certainly not unprecedented. We saw 1.15% growth in 3 months (4.69% "officially") back in the 3rd quarter of 2023. We also enjoyed an official 4.76% growth rate in Q3 2019 and 4.59% in Q4 2017. There were 4 quarters with higher growth rates during the 2010-2016 recovery. We also saw 5 quarters of over 4% "official" growth in the post-9/11 economic recovery.
These are backwards looking numbers that politicians on both sides like to use to support their side. They take advantage of Americans not understanding the difference between the "official" GDP number and what the economy actually did. Looking forward, we are still in a bit of a dark zone as the government shutdown both delayed and eliminated numbers as well as leaving us with skepticism about the numbers they have reported (since data wasn't being collected and statistical assumptions had to be made.)
We still only have a few bits of data from October and November. That data shows a cooling economy. That can change of course. Some of the things which supported the huge jump may continue:
- Surge in Net Exports (trade deficit reduction): This added 1.6% points to the growth rate. There may be some strange adjustments due to inventory surges in January, but for now, the trade deficit is declining, which helps GDP.
- AI Spending: Spending on information Processing Equipment and Software added 0.8% to the Q3 growth rate. Non-residential structures (the shell of the data centers) subtracted 0.2% in Q3. That may not all be data center related as it includes all commercial building projects.
- Health Care Services: While not a positive overall for the economy, spending on health care services added 0.8% to the Q3 number. With approximately 20 million people losing their ACA Subsidies, I'm not sure of the impact this will have on health care spending.
- Defense Spending: This contributed another 0.4% to Q3 growth. The recently passed defense spending bill ensures this will be a driver of "growth" in the year ahead as the Department of War budget was increased once again.
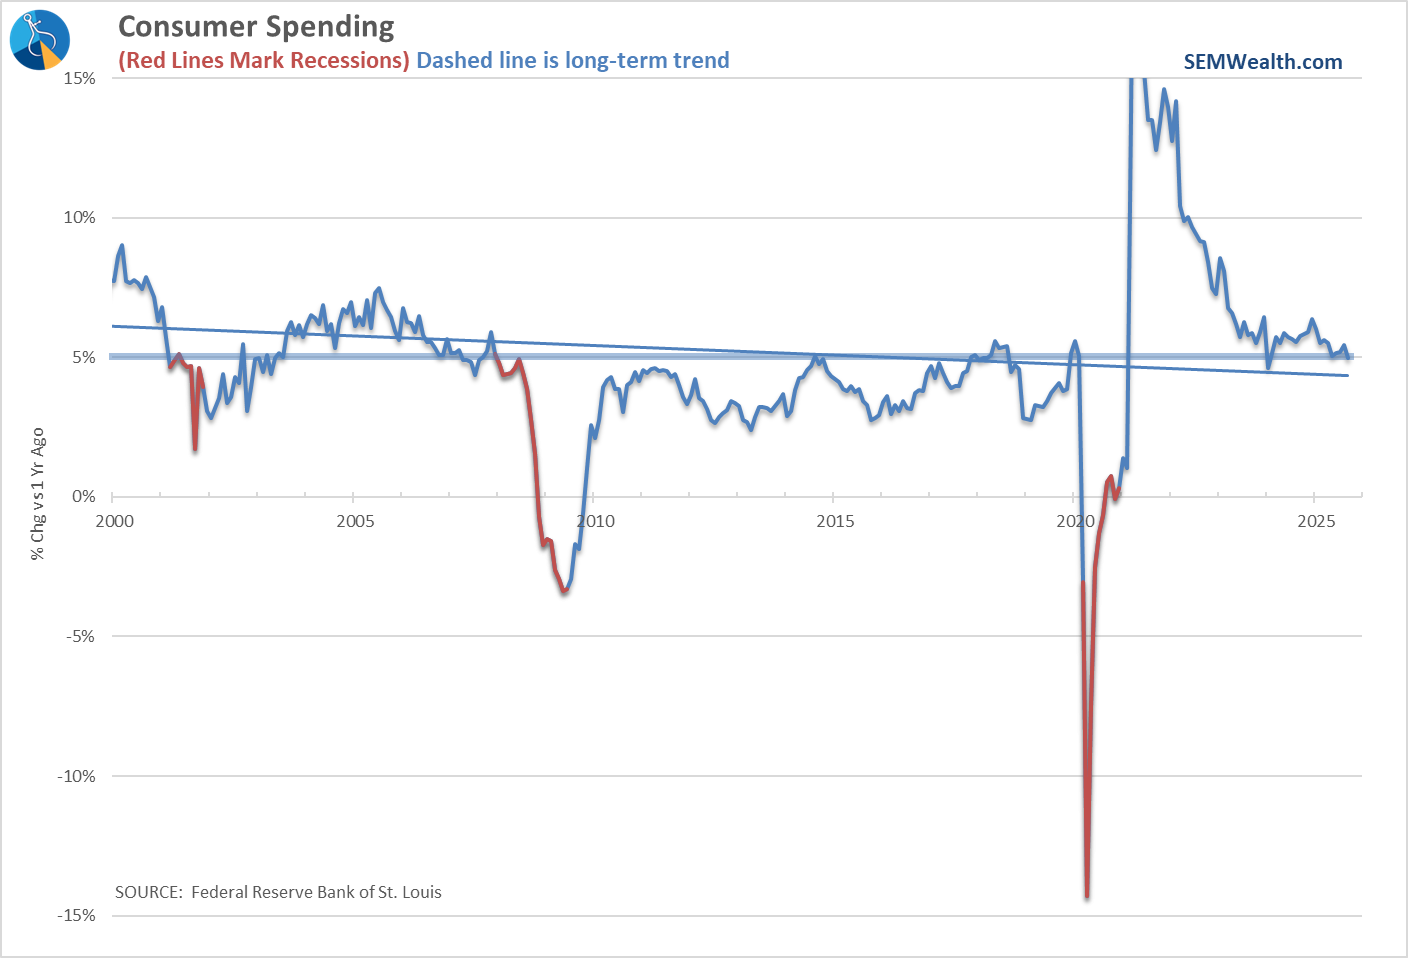
Those 4 categories accounted for 84% of the growth in the 3rd quarter. The rest of the growth was attributed to Consumer Spending. While still positive, the year-over-year growth rate continues to decelerate. It remains a still strong 5% (through September). The chart below puts this in perspective – consumer spending growth was a spectacular driver in the post-pandemic recovery and shifted to levels not seen this century. Since then, the "K-shaped" economy and the fact we only need so much "stuff" has pulled spending growth down a bit to more reasonable levels.
Basically, what we learned last week is the same thing I mentioned in our 2026 market and economic outlook (click here if you missed it):
2026 will be another strong year if:
- The data center buildout continues
- Companies are able to "monetize" their AI spending
- We don't have any major private credit loan defaults (which will hurt the data center buildout)
- Unemployment does not increase too much more
- Consumer spending remains strong
- Inflation does not move back to 3% or higher.
If all of that happens, it could be another fun year for S&P 500 investors (with the hope smaller companies will be pulled along for the ride.)
If any of those things do not happen, then buckle your seatbelts. Record high valuations are only a problem if the growth behind those valuations takes a hit. When that happens, normal human behavior leads us (or at least most people) to overreact and look to lock in profits before they are gone.
As always, through the good times and bad for the market and economy we will be here, watching the data and adjusting accordingly. Human nature is the reason this works and has been the key for SEM's 30+ years of experience through all types of cycles (up and down).
Speaking of the price of coffee, Season 2, Episode 2 of Money Talks with Dad has posted. In this we played "beard budget or bad budget? (because apparently everyone but me thinks the beard is a "good" idea). Here's a small clip of Corryn and I talking about spending on coffee.
You can watch the full episode here:
Toby's Take
A look at our intern's review of the top WSJ articles he read last week
12/22/2025 - ‘He Was Poisoned.’ Toxic Fumes on Planes Blamed for Deaths of Pilots and Crew - WSJ
Is it safe to fly on airplanes? There is an ongoing issue still debated with Boeing airplanes on if the air in the cabin can sometimes be "poisonous." A pilot named Ron Weiland was healthy and after a strange event, now known as a fume event, was diagnosed with ALS and died a couple years after. His widowed wife sued Boeing for this and Boeing settled the suit a day before jury selection. The amount of the settlement is subject to an nondisclosure agreement. Now, fume events happen almost 10 times as often in 2024 as they were 10 years prior. This is a scary and very serious issue that can cause a lot of consumer emotional responses to potentially sell their air travel stocks. With that, if there are official scientific findings about these fume events causing issues, these potential risks could lead to much further drops.
12/23/2025 - China’s Sprint for Tech Dominance Can’t Hide an Economy Full of Holes - WSJ
China is catching up with the U.S. in global technological dominance, but spending too much money to do it. China has been putting lots of money in things like electric vehicles and AI factory robots. They have had success with growing these industries, however in the process they are having a lot of jobless college graduates that can't afford anything to add to their economy. Another issue with their plan is that they have wasted a lot of money on bad startups. Just because they are creating advanced technology trying to catch up with the U.S. and doing well in that matter, doesn't mean they will have the money to sustain that. With a possible decline in Chinese competition, we could see potential gains in our own AI and EV sectors.
12/26/2025 - Family Offices Have Become the New Power Players on Wall Street - WSJ
A rapidly growing player on Wall Street known as Family Offices are becoming quite powerful. Family Offices are offices that manage money for wealthy families some managing amounts of $5.5 trillion. These offices are going to manage more money than hedge-fund firms. Now, banks and other firms are wanting to get a part into these family offices by catering to their every need. There are also many investment managers that are trying to get a piece of these families' wealth. The more these grow, the more likely they are going to branch into different investment managers and banks. This is another new trend we should be watching and looking to find ways to take advantage of.
Market Charts
Note: Y-charts uses the last 5-days as the "week", meaning the "last week" data is for the last 5 trading days (which includes Friday, December 19).
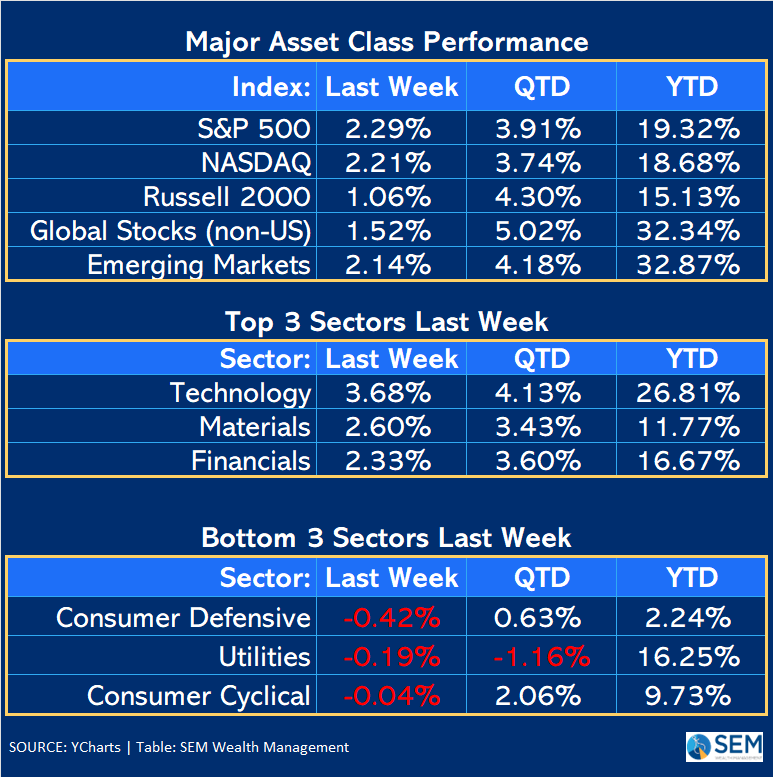
Stocks had a very strong 3 1/2 days, with the S&P moving higher every day it was open and hitting a 5-day winning streak.
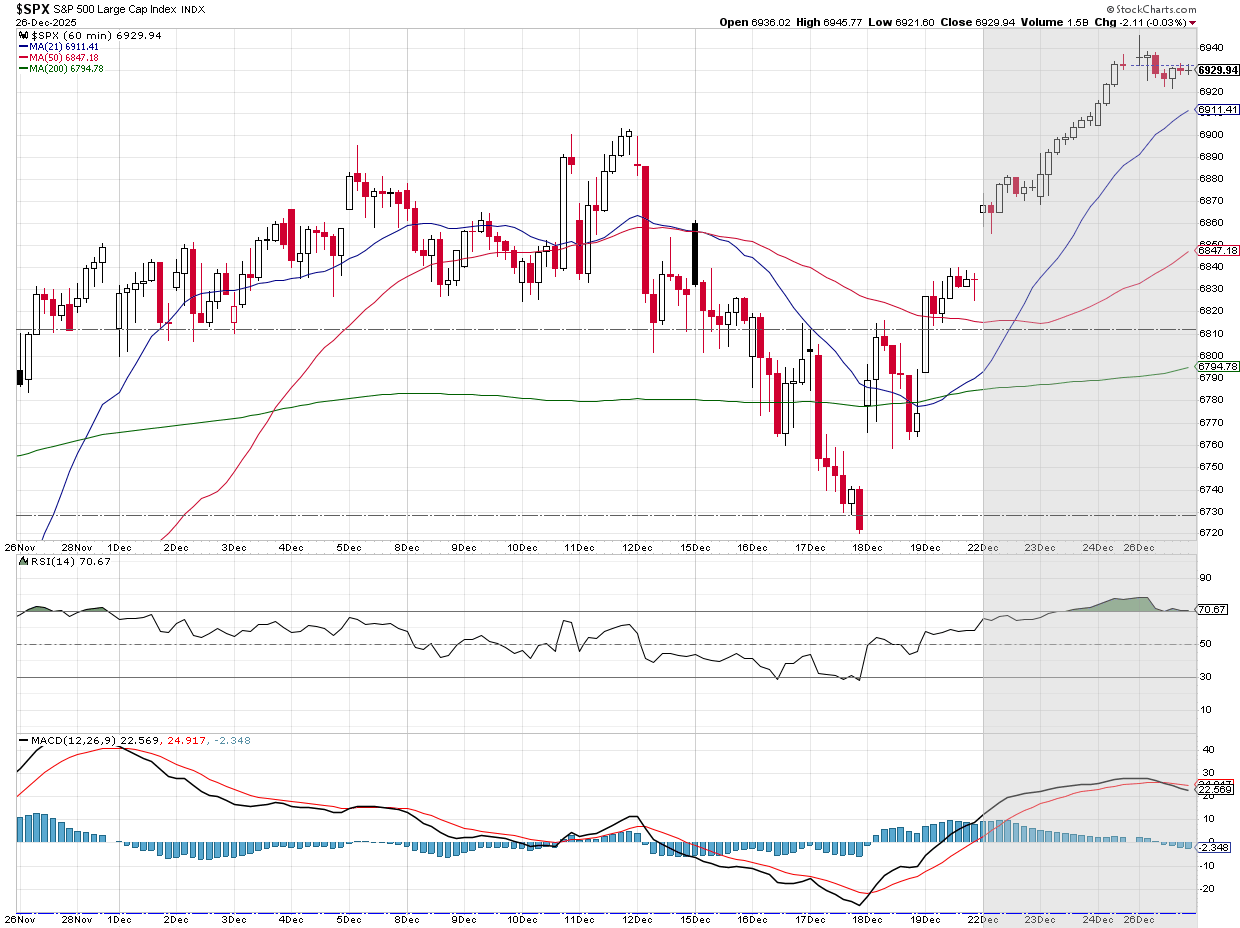
The S&P was able to move to a new record closing high on Friday. This is the same level it hit following the last 2 Fed meetings. From a technical perspective we don't have any "negative" divergences (yet), but there likewise aren't any "positive" technical developments. It's best on these holiday weeks to just let the market do its thing without taking it too seriously in either direction. Volume is light and investors are trying to position their portfolios for the year ahead.
The yield curve was unchanged for the week. Rates are slightly lower than they were 6 months ago, but higher than they were a month ago.
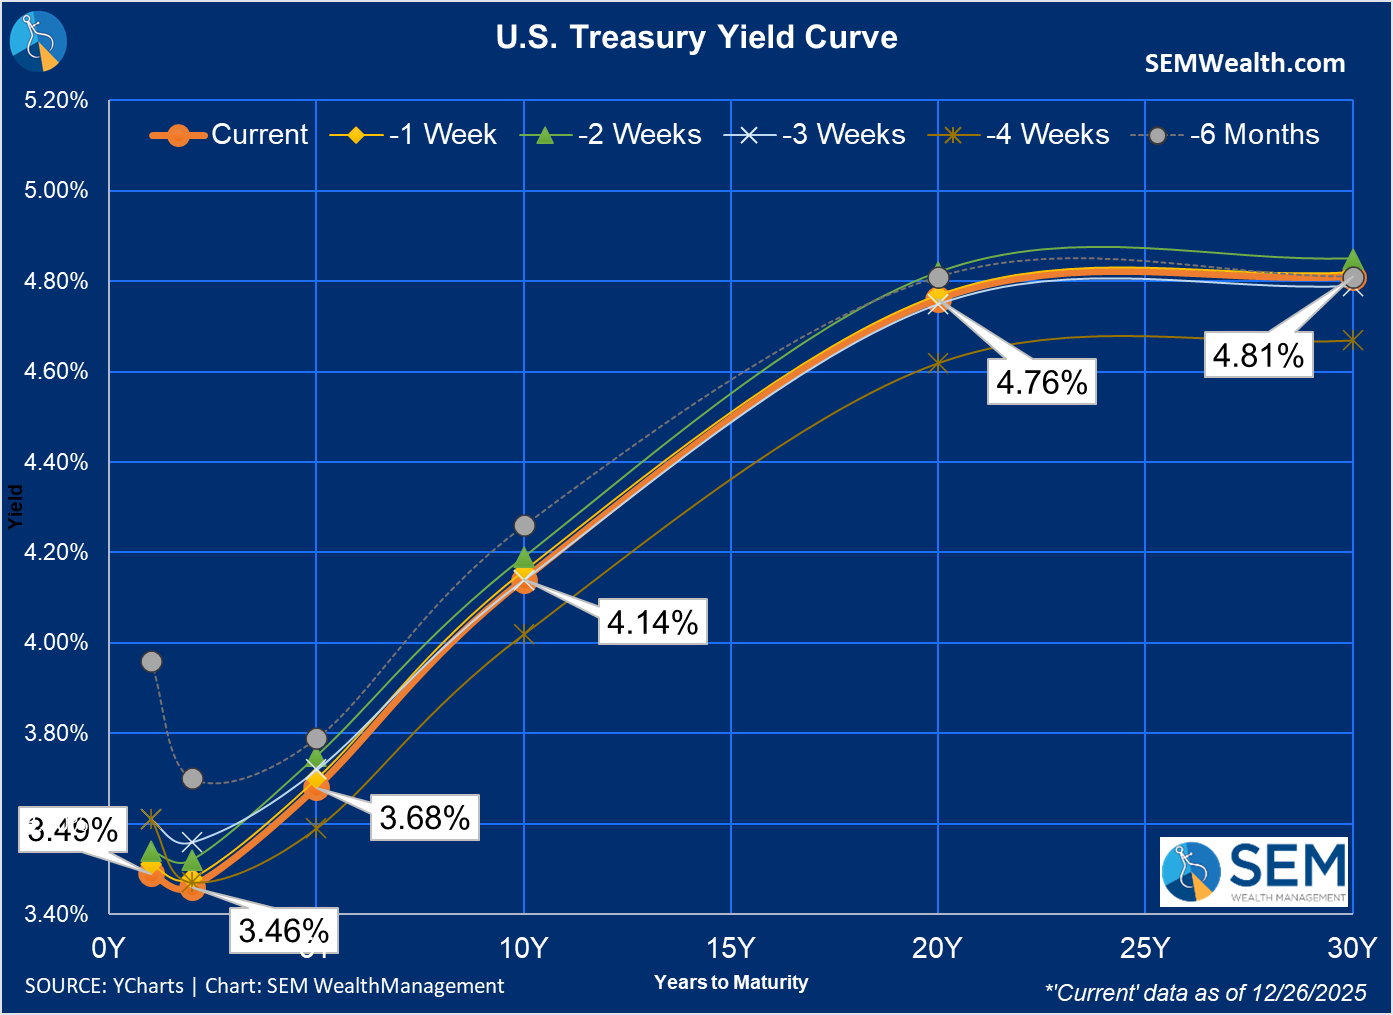
The 10-year bond yield remains at the top of our downtrend channel going back to last spring. If yields break out to the upside, this could be the first thing that causes the growth expectations to be adjusted down. Higher rates are not good for anybody, but we have to keep in mind it is the bond market, not the Fed that sets those rates and if they believe inflation is a bigger problem than unemployment ticking higher (the opposite view of the Fed), they will force rates higher to offset those inflation pressures.

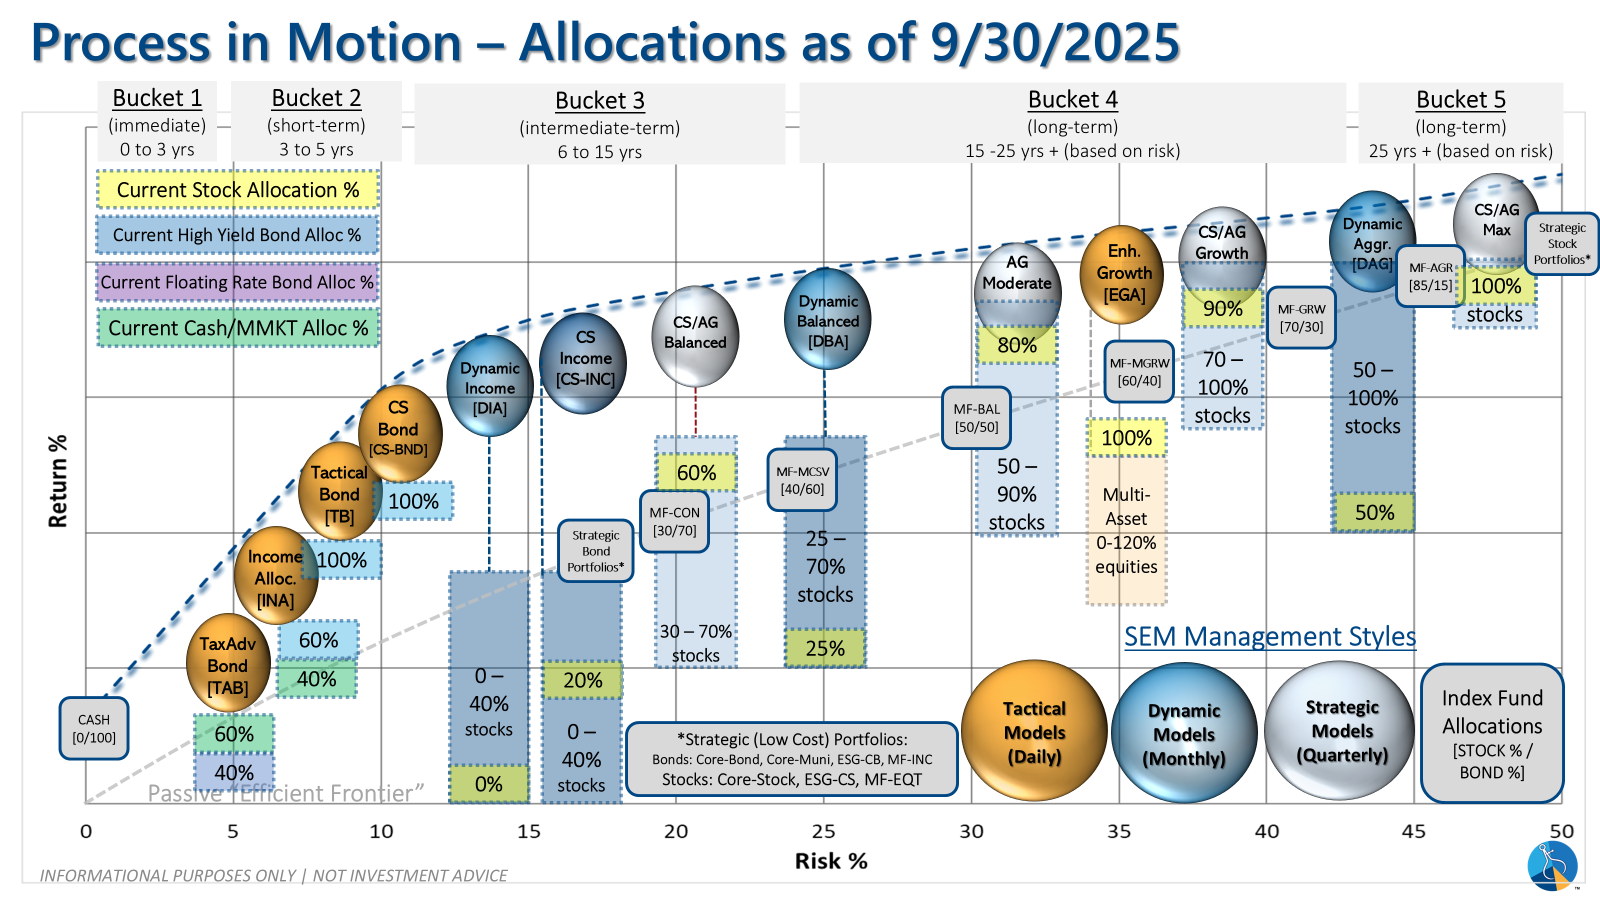
SEM Market Positioning
| Model Style | Current Stance | Notes |
|---|---|---|
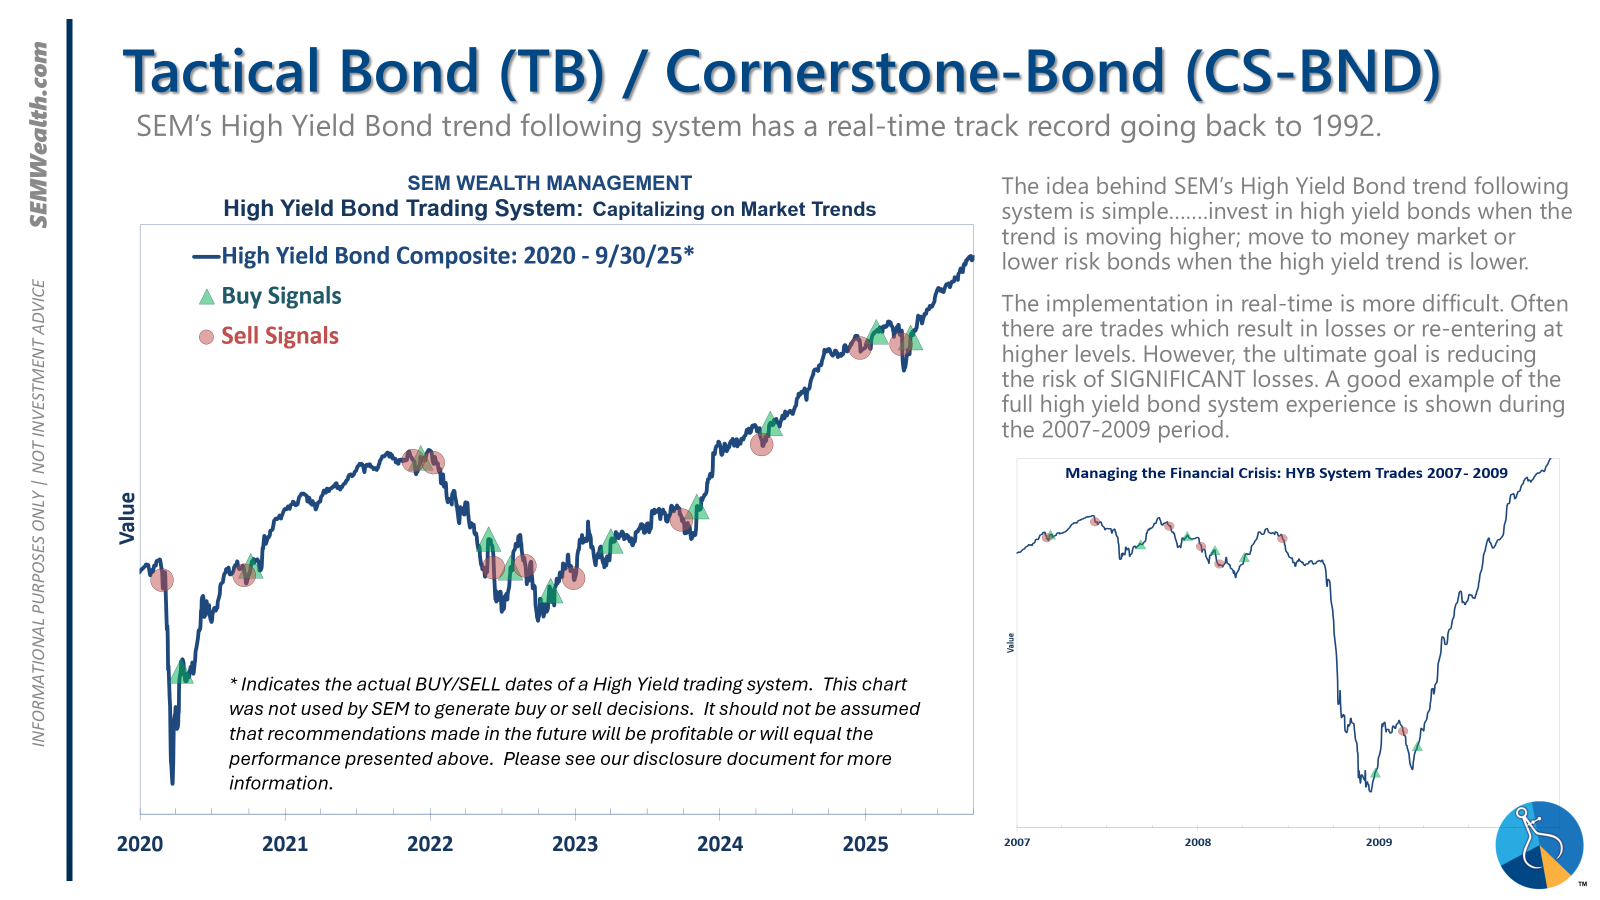
| Tactical | 100% high yield | High-yield spreads holding, but trend is slowing-watching closely |
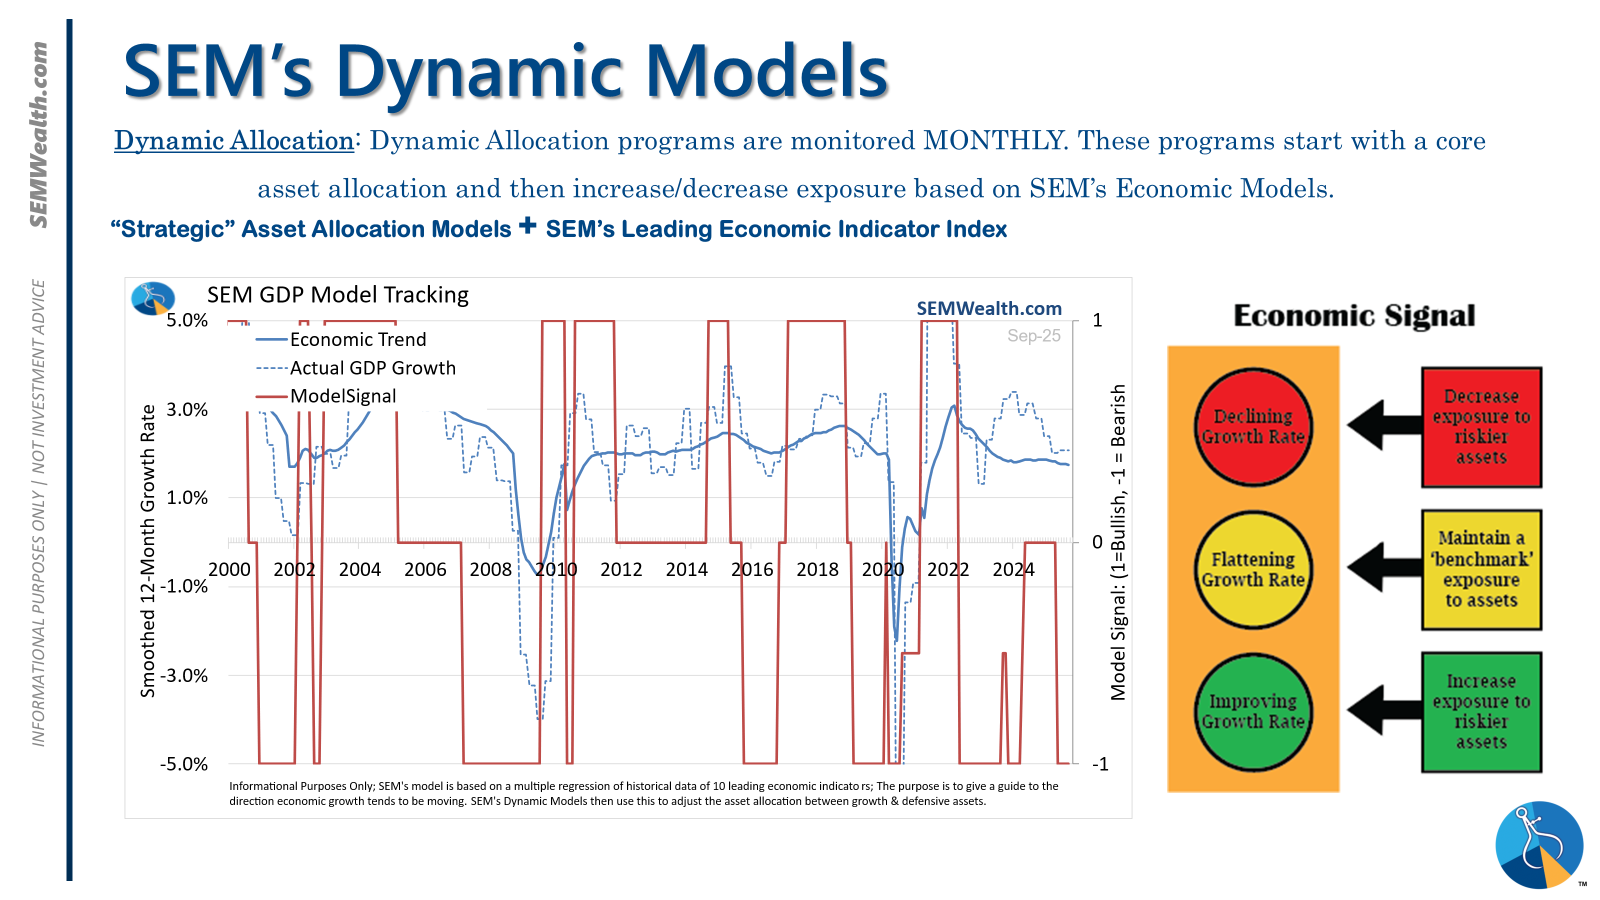
| Dynamic | Bearish | Economic model turned red – leaning defensive |
| Strategic | Slight under-weight | Trend overlay shaved 10 % equity in April -- added 5% back early July |
SEM deploys 3 distinct approaches – Tactical, Dynamic, and Strategic. These systems have been described as 'daily, monthly, quarterly' given how often they may make adjustments. Here is where they each stand.
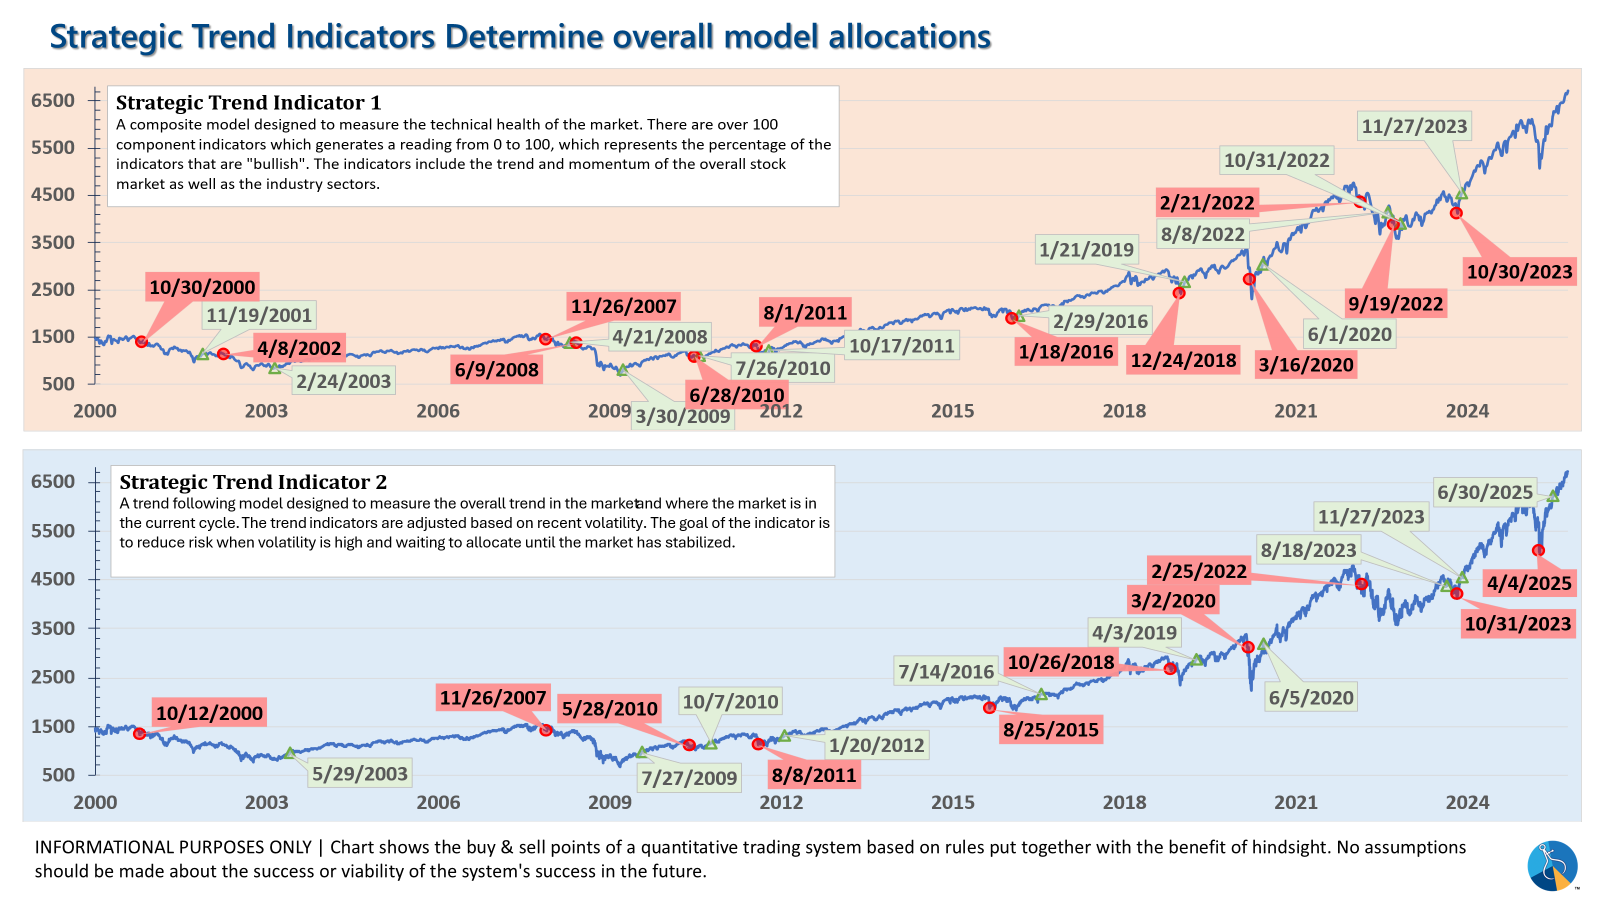
Tactical (daily): The high yield system has been invested since 4/23/25 after a short time out of the market following the sell signal on 4/3/25.
Dynamic (monthly): The economic model went 'bearish' in June 2025 after being 'neutral' for 11 months. This means eliminating risky assets – sell the 20% dividend stocks in Dynamic Income and the 20% small cap stocks in Dynamic Aggressive Growth. The interest rate model is 'bullish' meaning higher duration (Treasury Bond) investments for the bulk of the bonds.
Strategic (quarterly)*: One Trend System sold on 4/4/2025; Re-entered on 6/30/2025
The core rotation is adjusted quarterly. On August 17 it rotated out of mid-cap growth and into small cap value. It also sold some large cap value to buy some large cap blend and growth. The large cap purchases were in actively managed funds with more diversification than the S&P 500 (banking on the market broadening out beyond the top 5-10 stocks.) On January 8 it rotated completely out of small cap value and mid-cap growth to purchase another broad (more diversified) large cap blend fund along with a Dividend Growth fund.
The * in quarterly is for the trend models. These models are watched daily but they trade infrequently based on readings of where each believe we are in the cycle. The trend systems can be susceptible to "whipsaws" as we saw with the recent sell and buy signals at the end of October and November. The goal of the systems is to miss major downturns in the market. Risks are high when the market has been stampeding higher as it has for most of 2023. This means sometimes selling too soon. As we saw with the recent trade, the systems can quickly reverse if they are wrong.
Overall, this is how our various models stack up based on the last allocation change:
Curious if your current investment allocation aligns with your overall objectives and risk tolerance? Take our risk questionnaire


