
Whether sports, business, or war, the person designing the strategy is attempting to confuse their opponents to gain an edge. Sometimes the goal is to throw complete chaos at them. If they don't know what to expect, they will always be on their heels.
For most of modern US history everything has had a typical "playbook" where all of the players follow the same decision rules and procedures. This led to few surprises and gave us all time to adjust to the direction the "game" was going. We learned during President Trump's first term that he does not follow the same playbook – he never did in business and told us he would be different. This time around it feels like chaos, but that is exactly how he wants us to feel.
This doesn't mean it's a "bad" strategy. It's just 'different'. This means being on our toes and being careful to not jump to any conclusions or make any rushed decisions. This is the very reason we write the blog – to be your filter about what matters, what may be something to watch, and what you can completely ignore (unless you find it 'fun' to watch).
Here's the recap of things I thought could be important from the past week:
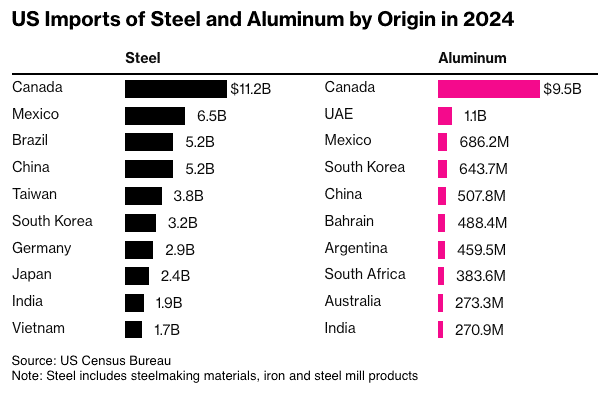
25% Steel & Aluminum Tariffs
Last week the President announced across-the board 25% steel and aluminum tariffs with no exceptions. Last time around, the President gave Mexico, Canada, and the EU exceptions on these tariffs. This move was praised by the steel & aluminum producers, but highly criticized by those who manufacture in the US and use steel and aluminum in their products. The problem is 25% of the steel used by the US is imported, which theoretically (for now) could make it CHEAPER to produce your product somewhere else (can you say China or another country that hasn't been hit with a 25% tariff (yet)).
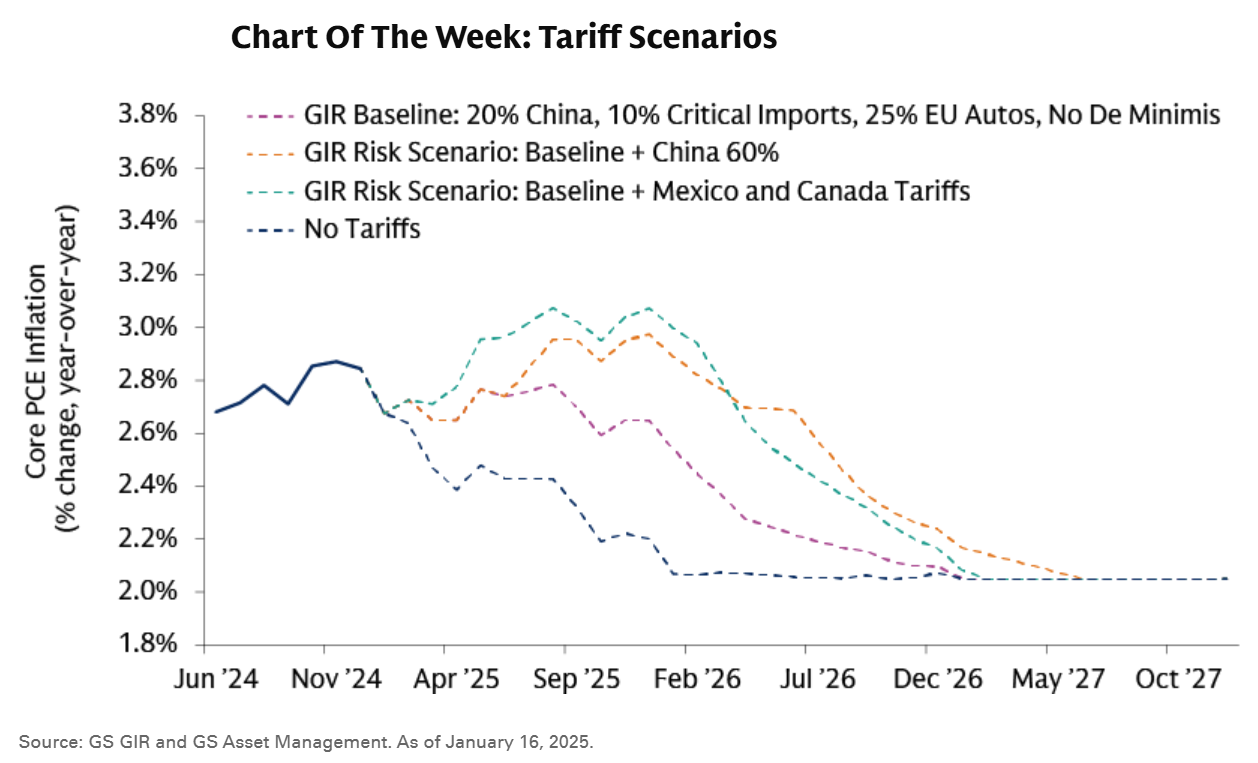
Goldman Sachs's Chart of the Week last week illustrated the impact of various tariff scenarios. Their "baseline" is a 20% tariff on China, 10% on "critical imports (from all countries including Mexico & Canada), and 25% on European Autos. Obviously their team is currently assuming the 25% across the board tariffs on Canada and Mexico will not be implemented. Under their baseline scenario, inflation would increase a bit, but not exceed the peak 2024 levels. If all threatened/announced tariffs are fully implemented, we could see inflation rising throughout the year and remaining around 3% into 2026.
Reciprocal Tariffs
The President has mentioned several times over the past couple of weeks that reciprocal tariffs (US tariffs matching the tariff imposed on US goods) were coming "soon". Last week we learned (what we said in this blog after inauguration day) that the EARLIEST a FORMAL plan will be announced is April 1 (the deadline of the executive order to review all trade policies). Goldman said it may not be until August given the complexity (and legally binding terms) of our trade agreements with Europe. The expected delay also considers the outline of the Trump plan to take into account "other costs" such as value-added-taxes, restrictions on quantities, and regulatory "costs". It is also likely these will be a big chip in the negotiations the administration has planned to even the playing field on trade.
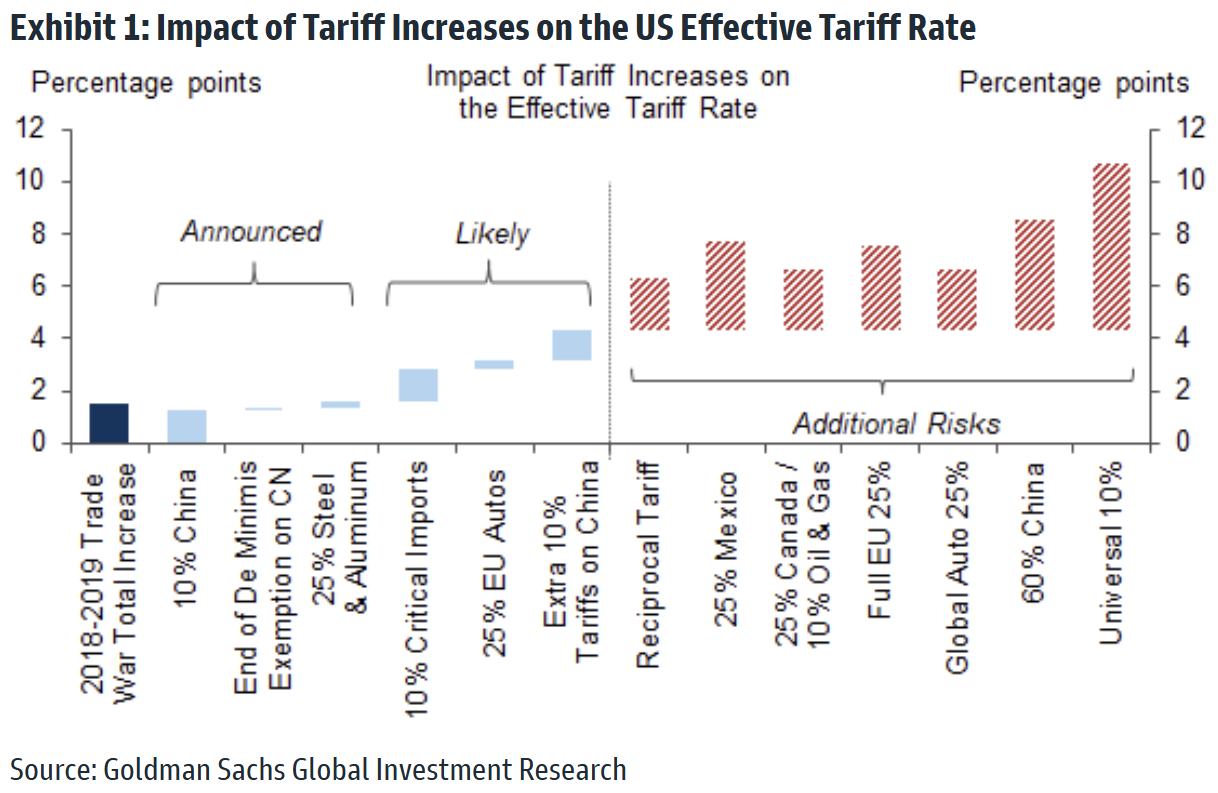
This doesn't mean all tariffs will be delayed until April-August. Goldman expects additional tariffs to be announced in the coming weeks. While many on Wall Street have said used the 2018-19 tariff 'costs' as a roadmap, this chart puts in perspective how much larger this trade war could be. They expect the US effective Tariff rate to at a minimum double. If all the additional "threats" are implemented, our tariff rate would be 5x what it was in 2018-2019. That's a big shift that NOBODY can predict the output of, no matter how confidently or frequently they declare it.
Powell takes the High Ground
Fed Chair Jerome Powell completed his twice a year 2-day testimony in front of Congress. As he has done the last 6 years, he did his best to stay out of politics, emphasizing the need for Fed independence, and again reminding Congress that the FISCAL (not Monetary) string is by far the most powerful one to both control inflation and stimulate the economy.
In terms of monetary policy (the one the Fed independently controls), Chair Powell emphasized multiple times that the Fed does not need to be in a hurry to lower rates. He reminded them that inflation is still a bit too high and the progress has slowed a bit. Finally, Powell said the Fed will take a wait and see approach on the impact of tariffs rather than acting AHEAD of their implementation.
In related news, President Trump once again said last week that interest rates should be "significantly lower" to offset the "costs" of tariffs on US companies. The President could have a point, but this would be the first time he mentioned what most of us logically know – a tariff is paid by the US-based importer meaning it is a COST to that company. If the company borrows money to support its purchases, then lower interest rates would help.
However, if the company simply chooses to pass on the higher costs to the consumer (and keep the interest savings), this would be HIGHLY inflationary, and thus why Chair Powell both emphasized the news of Fed independence and a "wait and see" approach.
Inflation still a concern
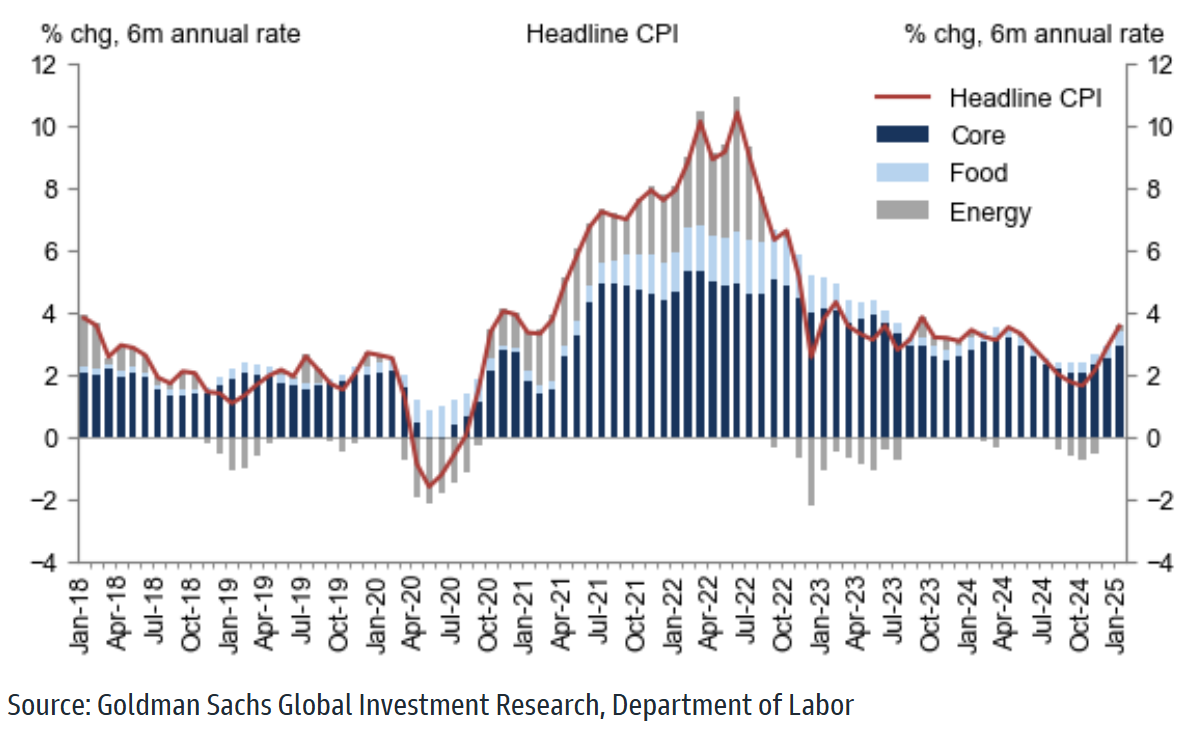
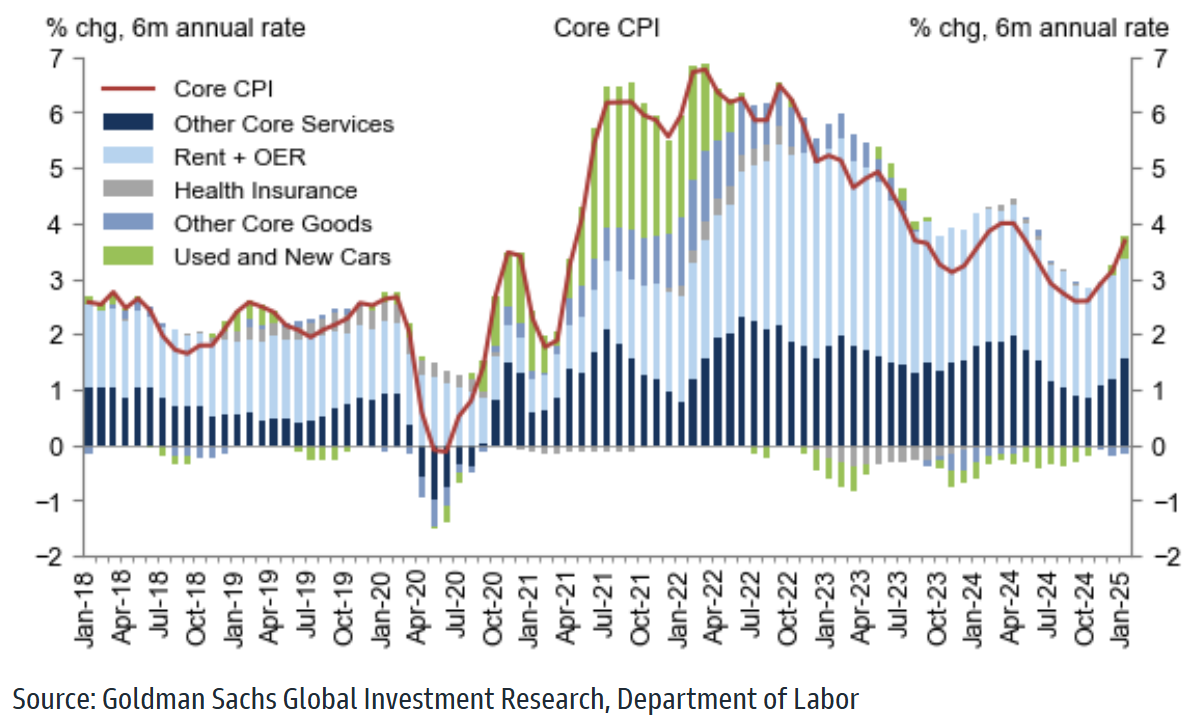
Last week the Consumer Price Index (CPI) came out much higher than expected. Bonds reacted negatively (yields jumped higher) as did stocks (S&P down over 1.5% at one point). Stocks were able to rebound off their lows after the President essentially announced a delay in reciprocal tariffs (as discussed above). Also discussed above is the unknown cost of tariffs, particularly when it comes to inflation. I like how Goldman presents the CPI indexes by using a 6 month annualized rate (rather than annualizing the last month). They also break out the various components.
The trend in inflation is clear and it is not good for those counting on the Fed continuing to cut interest rates throughout the year.
DOGE and Downsizing
Focus seems to be on front-line jobs, which are the lowest paying positions, rather than looking at holding the top level managers in each department accountable. Not only do they make an exorbitant salary compared to the average worker, but they are the ones ultimately in charge of the efficiency of their department. If the department isn't efficient, shouldn't they be fired and replaced?
By focusing on the lower-paying/front-line positions, there will not be much savings, but we will see a drop in services. Ask anybody who has had to call the VA or Social Security Administration what their experience has been like. It's likely going to get much, much worse. Completely revamping the IT infrastructure is necessary, but costly and time consuming. That is the only way to make the government truly efficient.
Unfortunately, a long-term cross-agency rebuild does not make fun headlines or get your posts shared on X or Truth Social, so we are left with the more fun idea of cutting waste, even though it won't add to much and will make government less efficient.
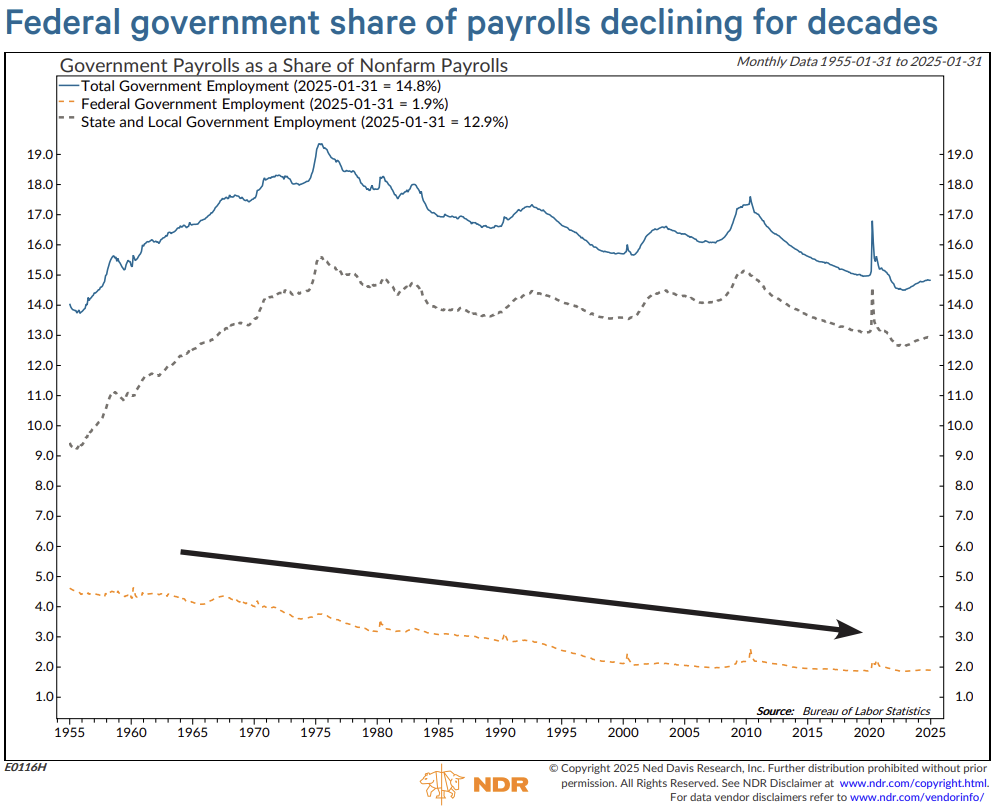
Federal government payrolls have been declining as a percentage of overall employment for years. The bulk of "government" jobs are at the state & local level as illustrated below. The bigger impact of the DOGE and other executive order plans will be felt at the state and local level (think of all the grants and government sponsored programs on the cutting block). This may cut the deficit a bit, but if it results in lower growth overall for the economy, it may not be worth it. Right now everything is just an idea so we will have to wait and see how much impact, if any there is on the economy.
Defense vs Meme stocks
Speaking of DOGE (sort of) I've found it interesting to look at the movement in various stocks. At SEM we have two individual stock portfolio models (the rest are comprised of low cost ETFs, and actively managed bond, specialty stock, or alternative funds). Our Patriot Portfolio, which holds the top 10 US Defense Contractors had a fun 6 week rally after election day. That rally ended when Elon Musk highlighted the F-35 program as an example of massive government waste. The reaction in the biggest defense manufacturers was quick and painful. There was a bit of a reprieve after the President said big defense cuts were not on the table, but since then Elon has again been rallying for cuts to ALL spending, including on things such as the F-35. Interestingly enough, Elon's company Tesla was reported to be negotiating a $400M contract to sell electric armored vehicles to the Defense Department, but late last week, the Defense Department nixed that rumor.
What's been interesting to watch though is how our Patriot Portfolio compares at times to our Momentum Stock Model (MSM). The model is not designed to be in "meme" stocks (those stocks which catch popularity on social media and message boards and go up simply because of a funny or interesting story – think GameStop and AMC in 2021). It will, however end up owning these meme stocks if the momentum of them picks up enough to make it to the top of our 3-pronged momentum filter. This portfolio had an astronomical month in October, but then for whatever reason (as Defense Stocks rallied) it took a big hit to close the year.
Since January, it has been "to the moon". I took this snapshot of the daily and month-to-date performance of the individual components of these two models. This is not a recommendation to buy ANY of these stocks. We hold the MSM holdings for a minimum of one month. I've never seen a holding stay in the portfolio for more than 9 months since we launched this in 2020.
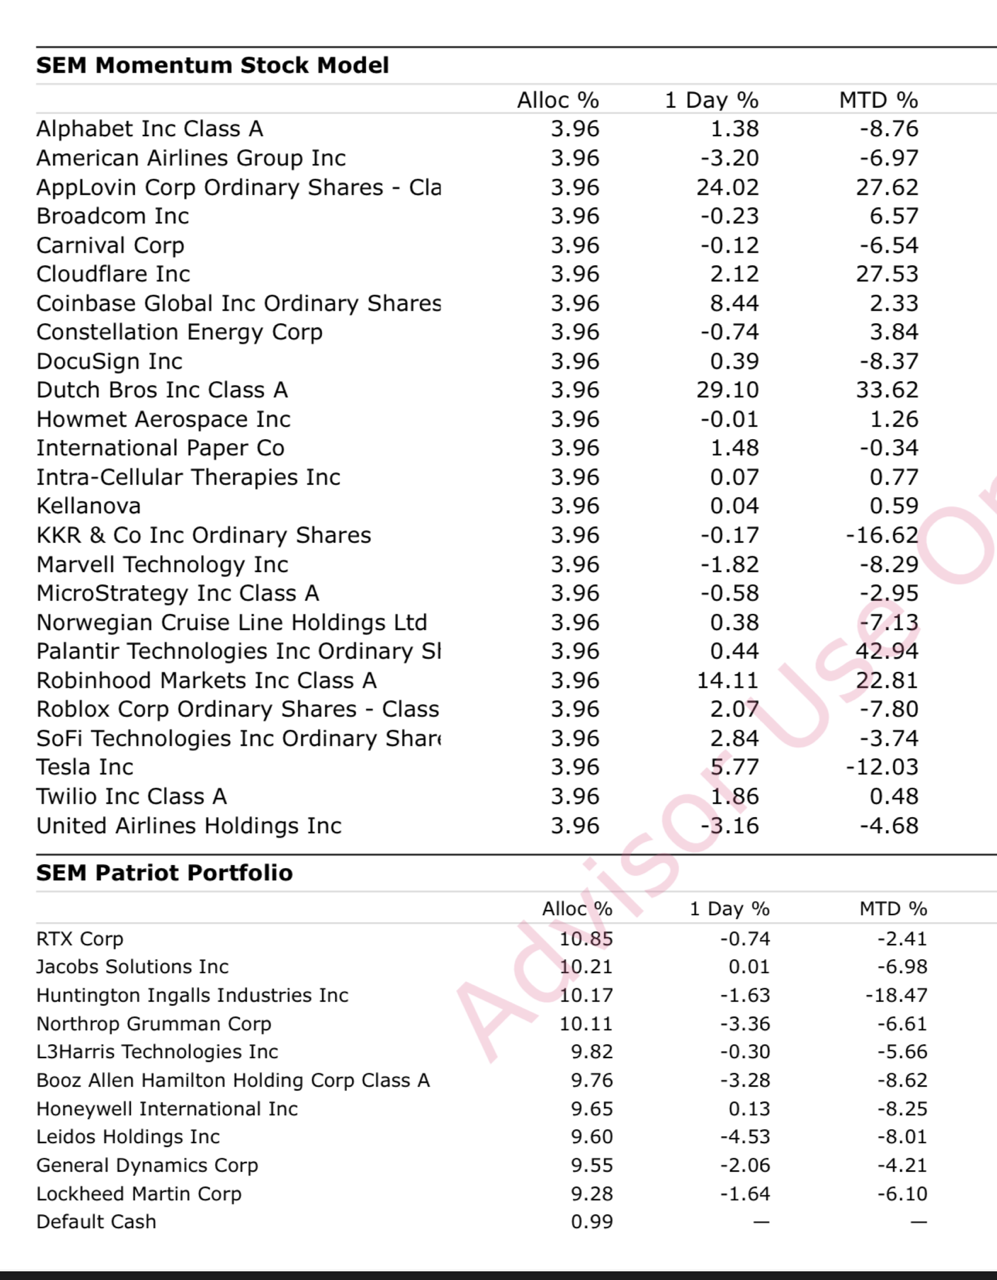
We use these portfolios for clients who are looking for individual stock exposure or something that is not-corelated to the overall stock or bond markets. They are not designed to be "core" holdings as both of them have a fairly low correlation to the stock market. It is not always we see these two models at the two ends of our model performance rankings, but it has happened before. As for the reason, that's beyond my level of understanding.
Market Charts
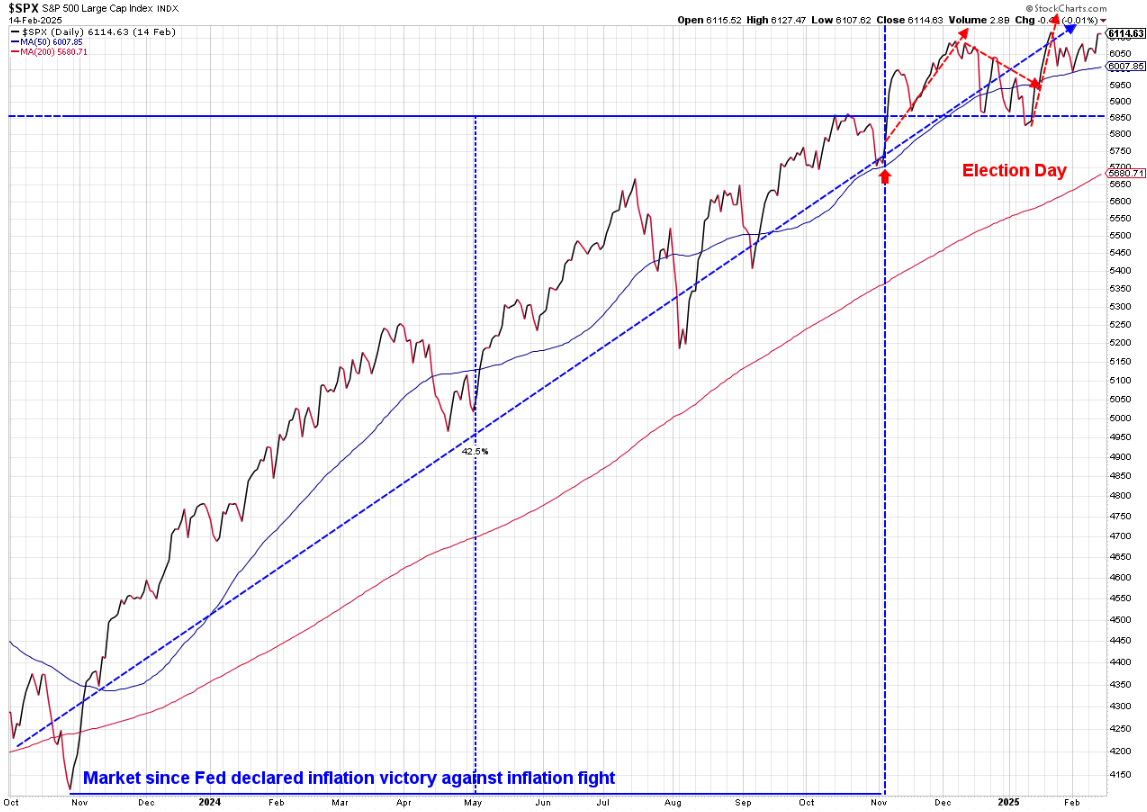
I often say – it doesn't mater, until it does. All of the above "concerns" I have did not matter to the stock market last week as the S&P 500 closed near it's all-time high (which means its post-election high.)
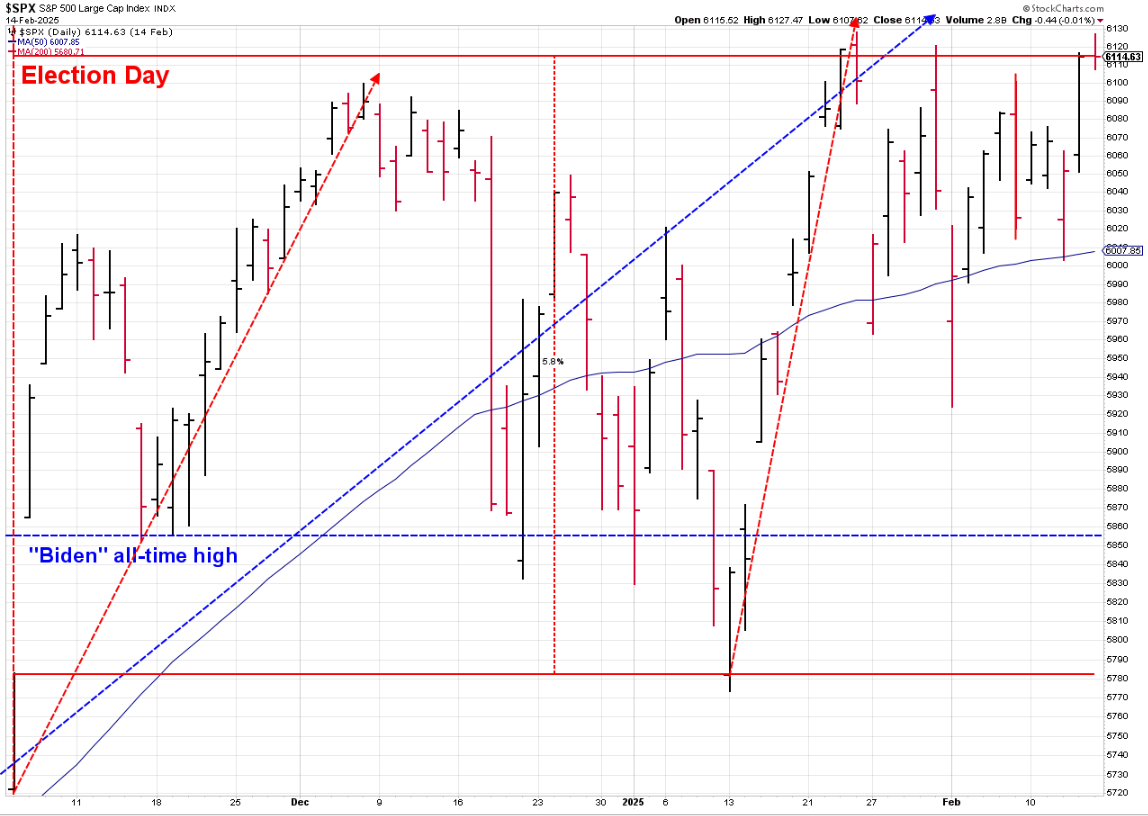
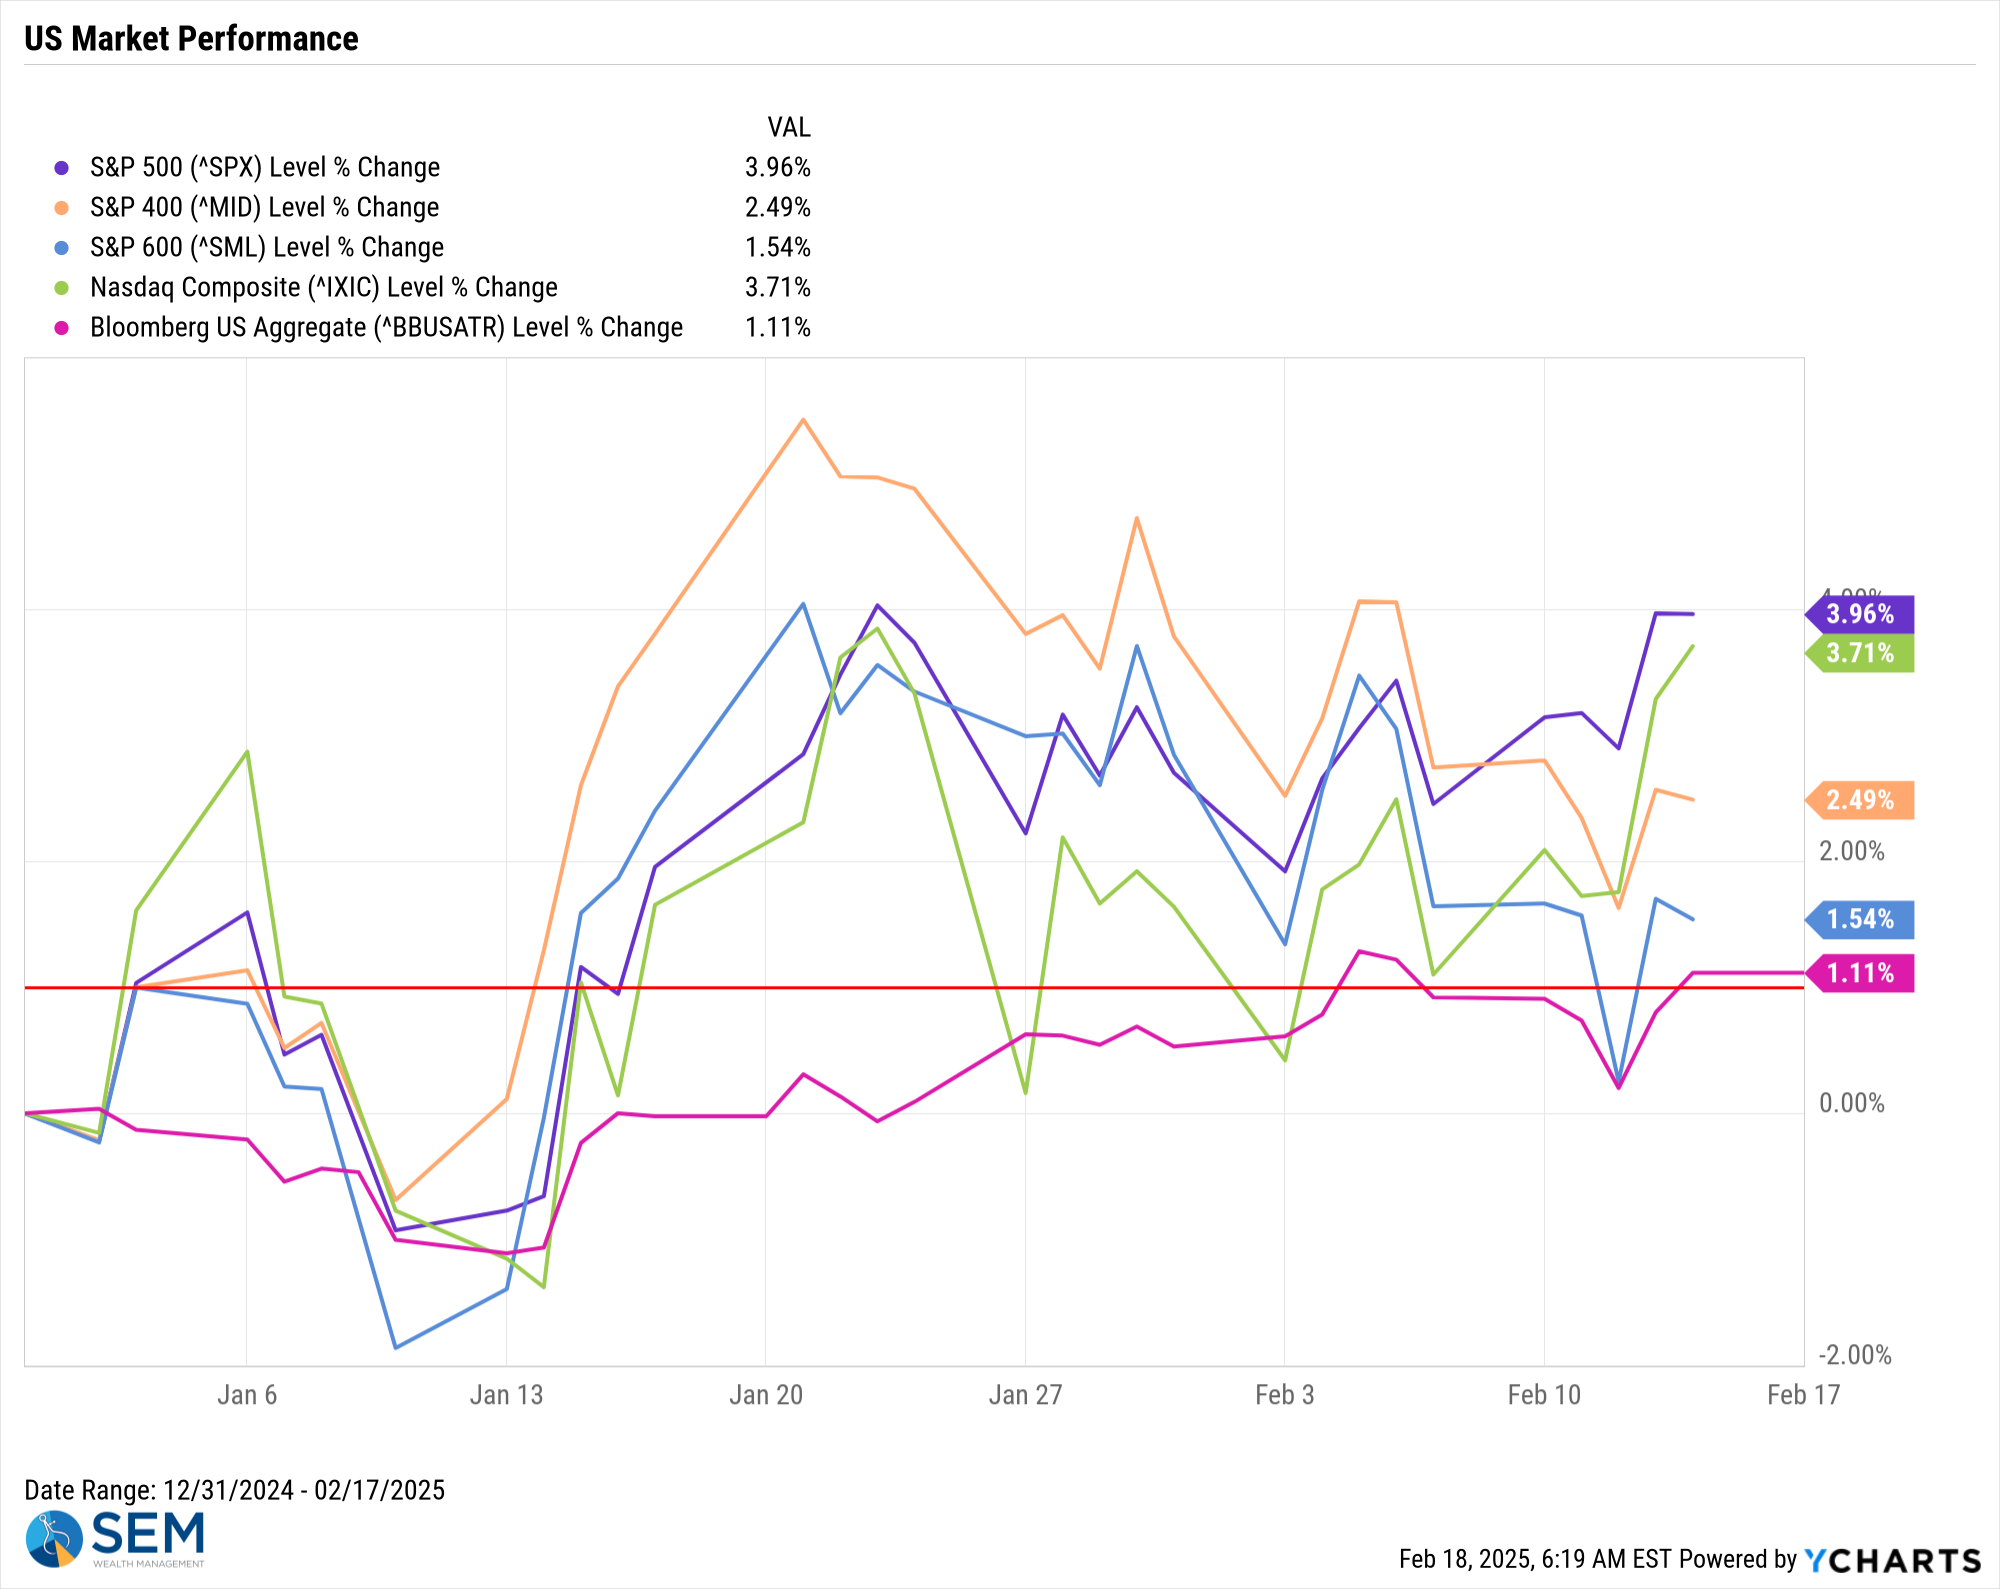
After lagging most of the year, large cap and tech stocks rocketed back to the top of the leaderboard. Small caps struggled and bonds were flat.
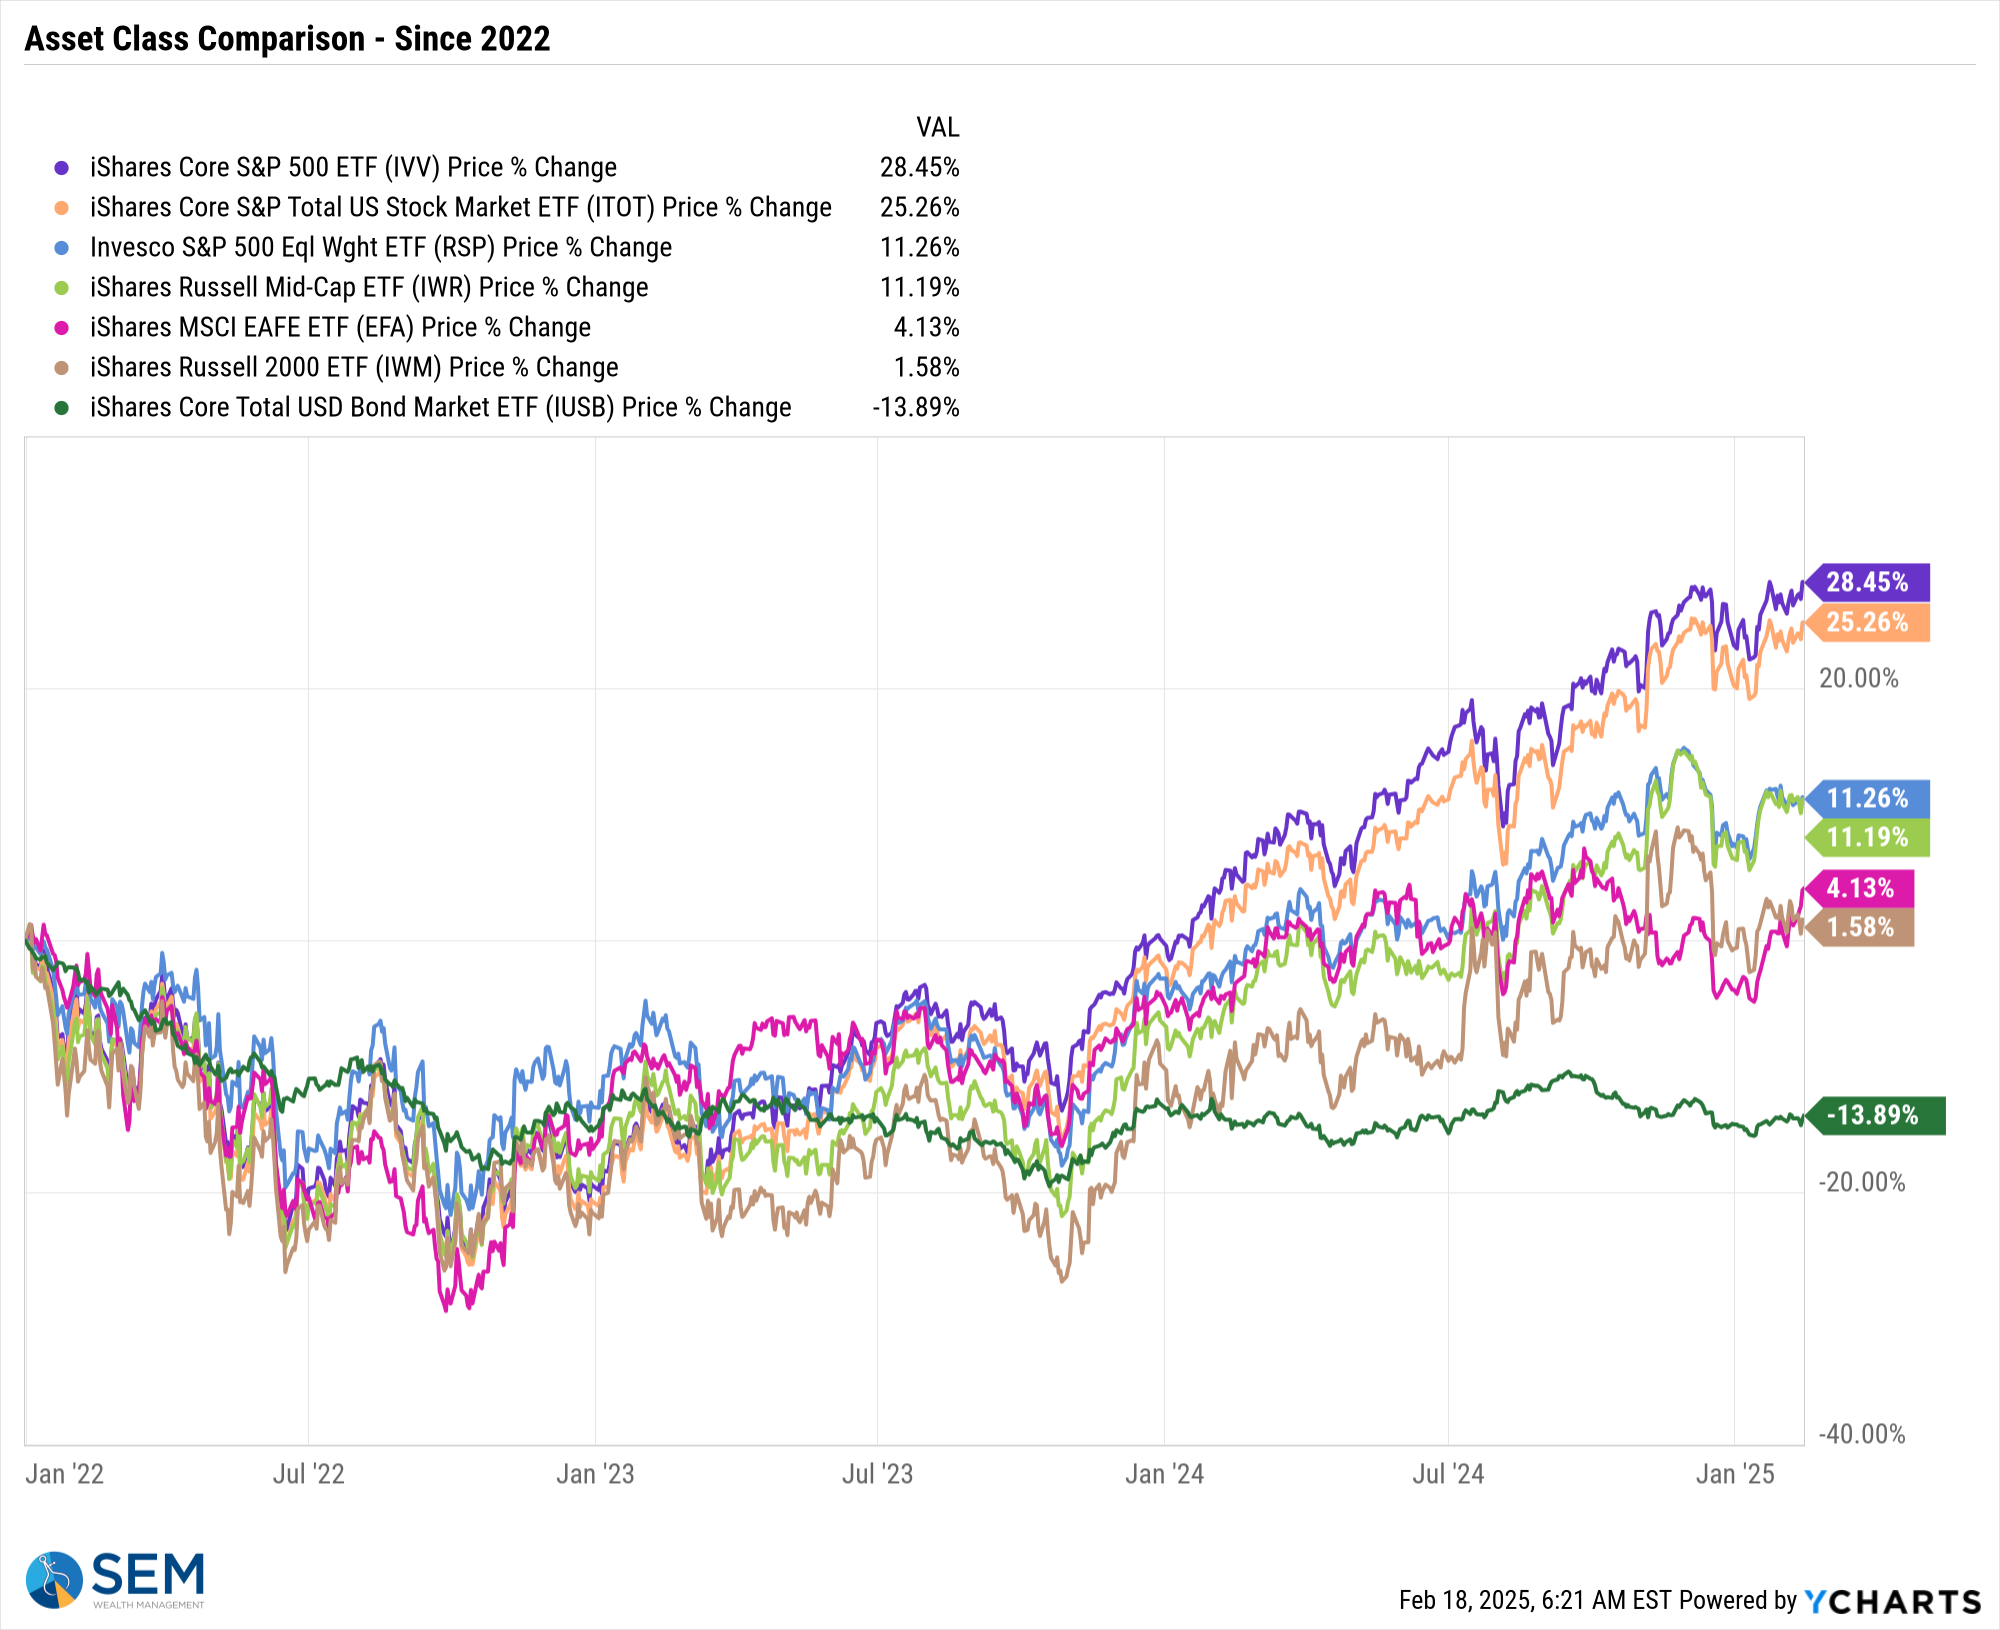
This of course has been the story since 2022.
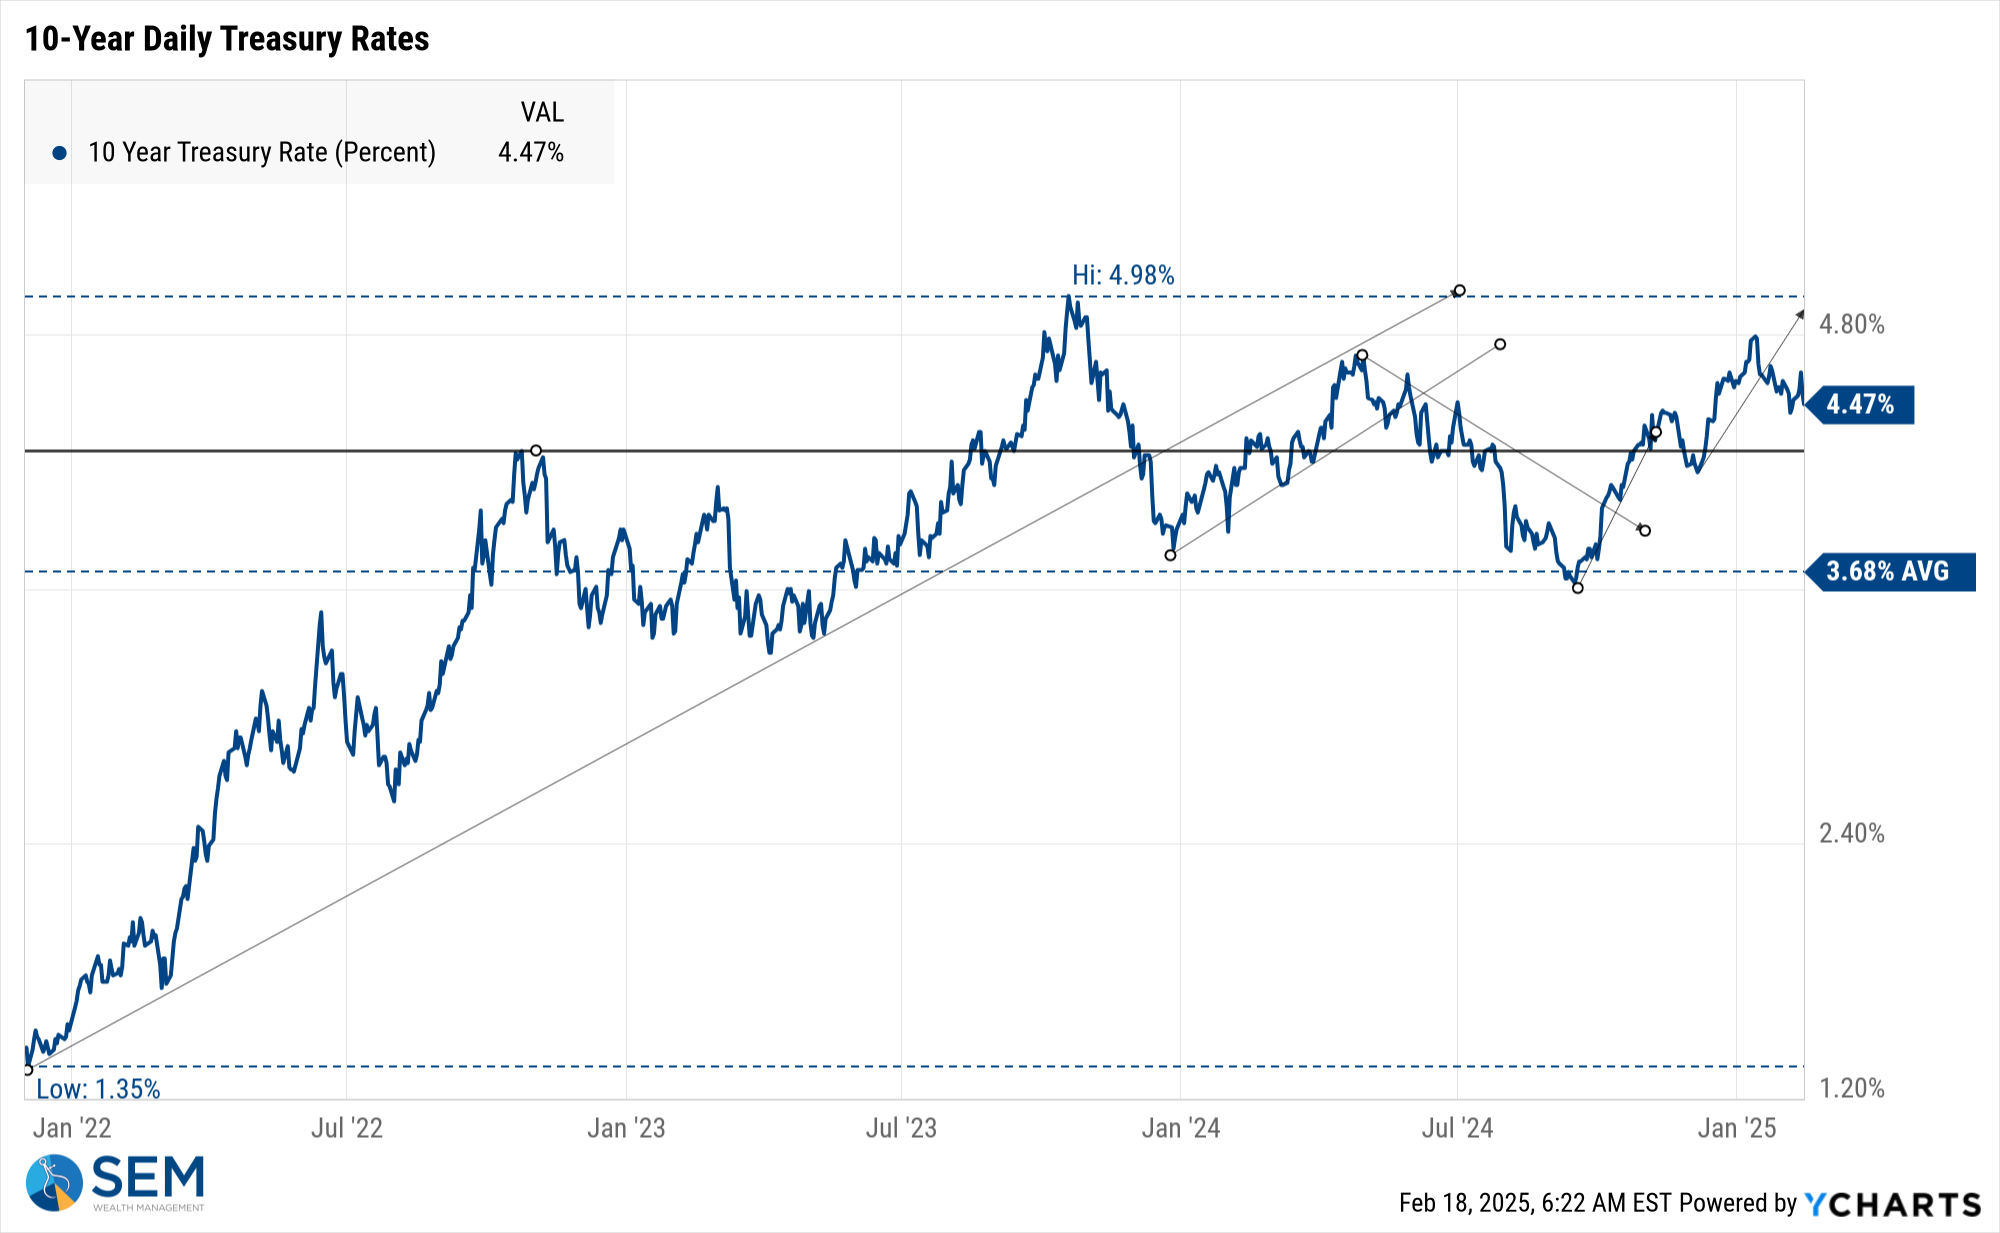
As I continue to say, the key will be interest rates. Despite strong inflation readings, rates did not move higher, which is good news.
SEM Model Positioning
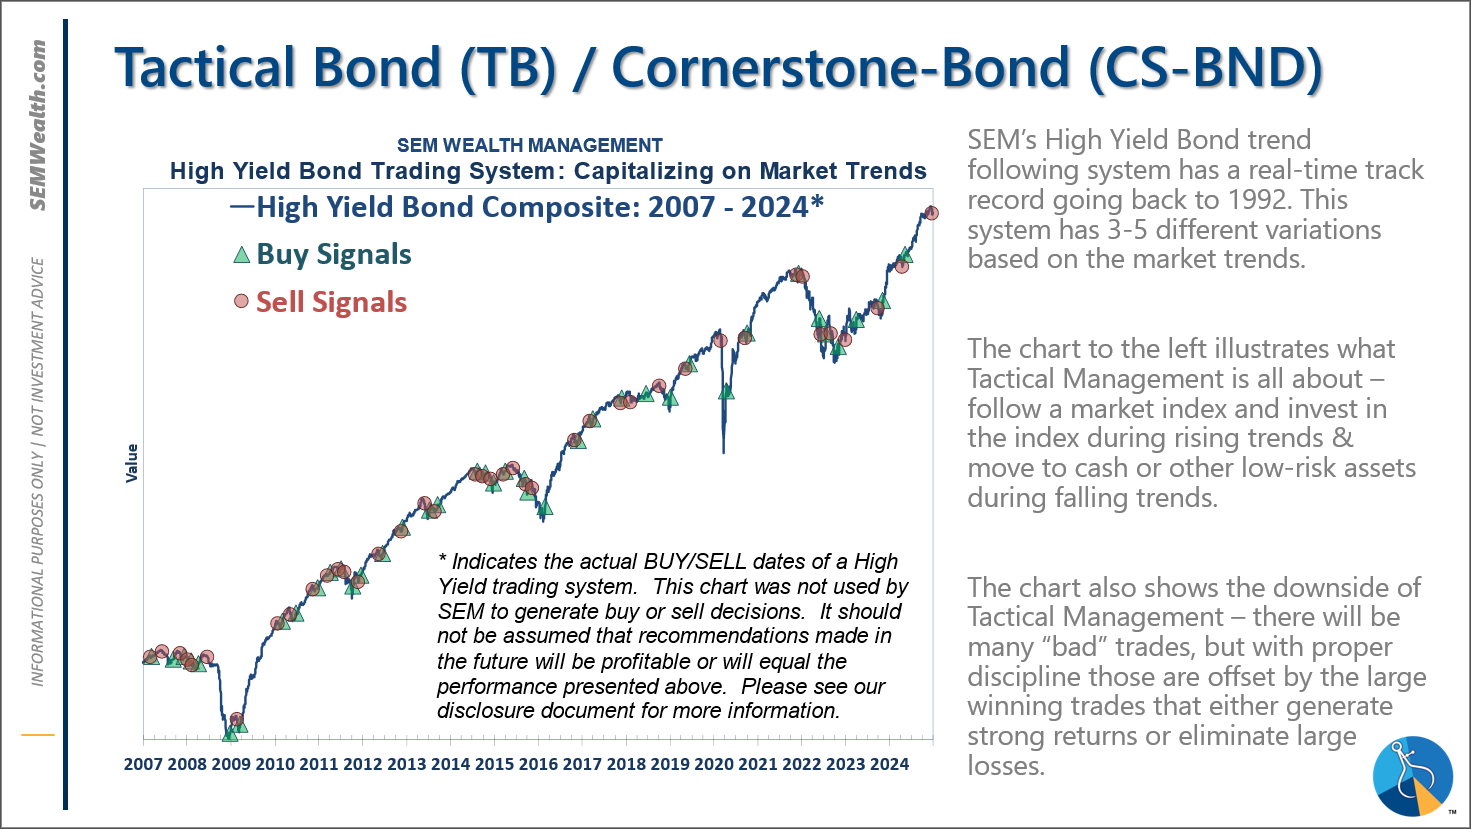
-Tactical High Yield reentered the high yield bond market on 1/27/25 after about 5 weeks on the sidelines. We had added a 30% position in floating rate bonds on 12/6/24, which currently have a 9% yield compared to a 6% yield in high yields and 4.6% in money markets.
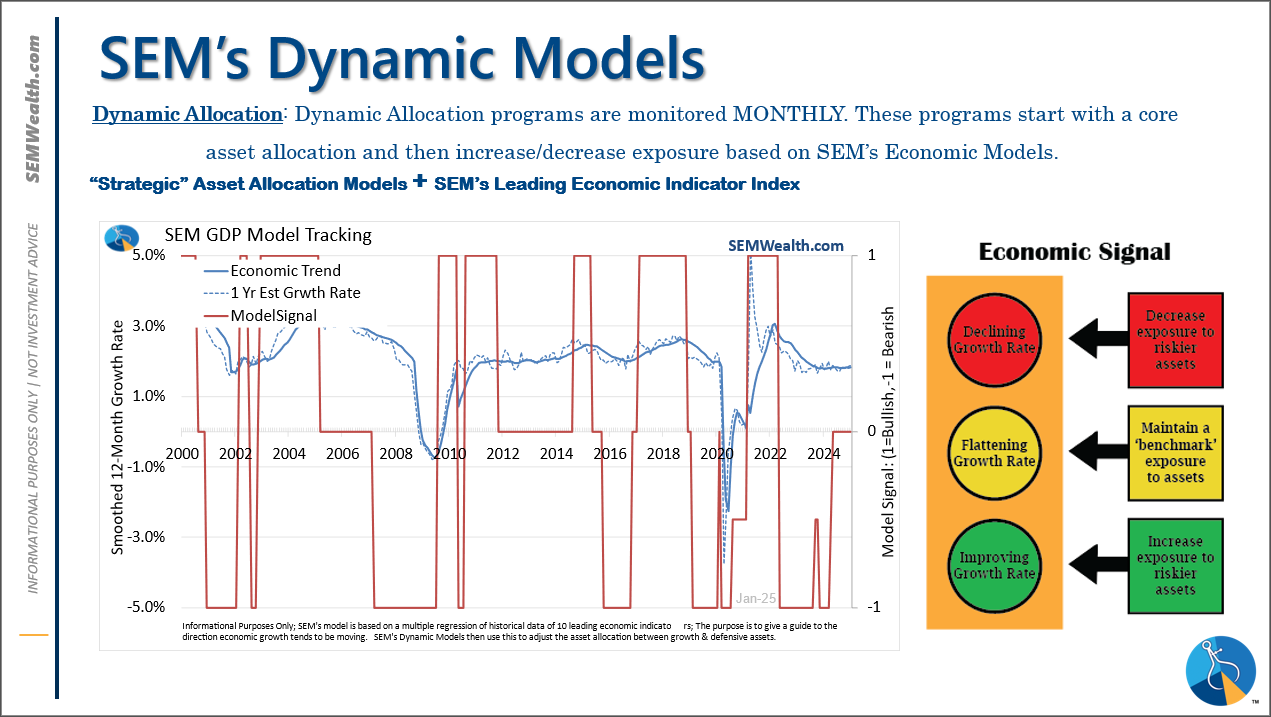
-Dynamic Models are 'neutral' as of 6/7/24, reversing the half 'bearish' signal from 5/3/2024. 7/8/24 - interest rate model flipped from partially bearish to partially bullish (lower long-term rates).
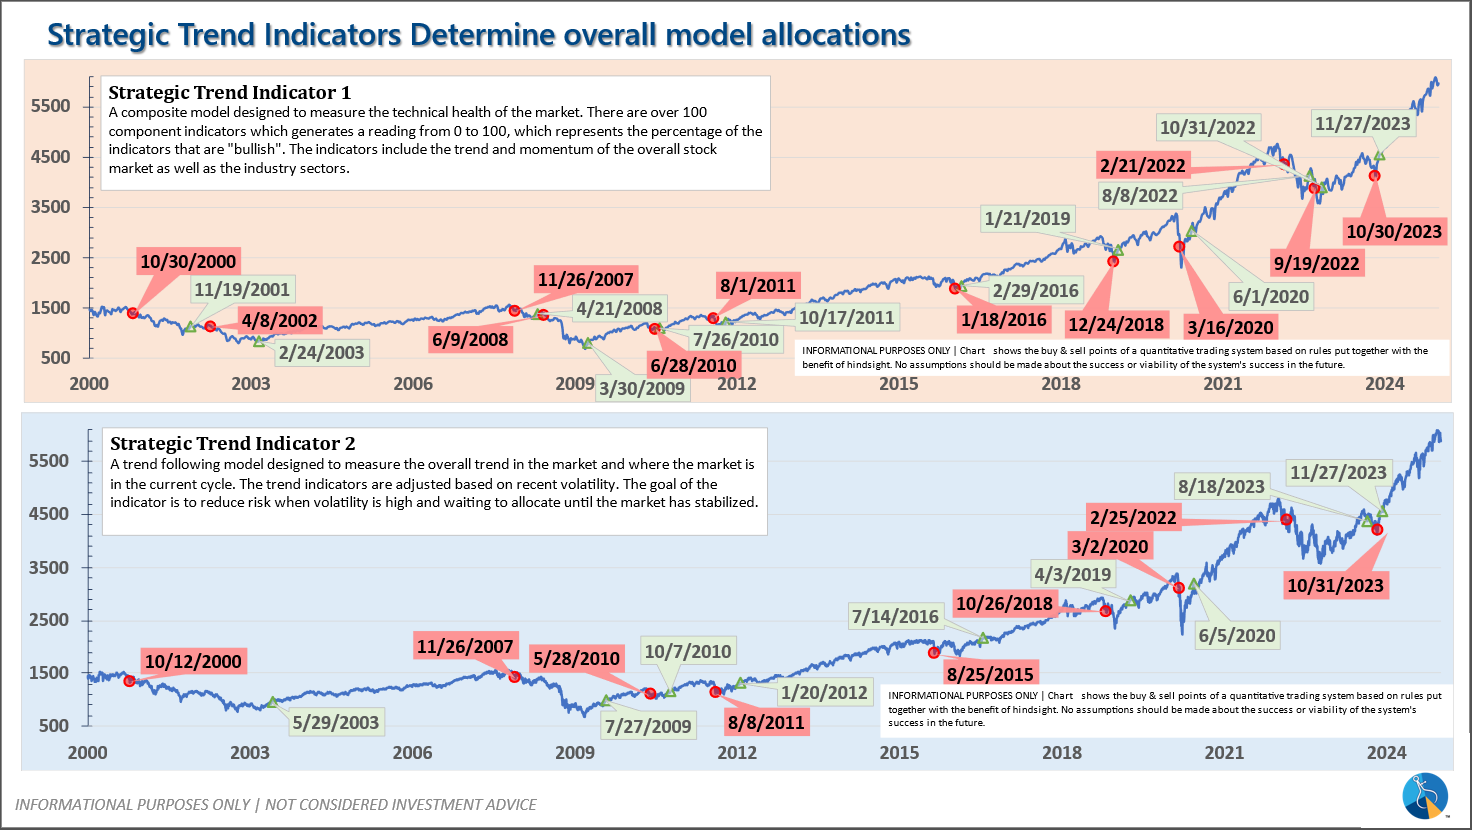
-Strategic Trend Models went on a buy 11/27/2023; 7/8/24 – small and mid-cap positions eliminated with latest Core Rotation System update – money shifted to Large Cap Value (Dividend Growth) & International Funds
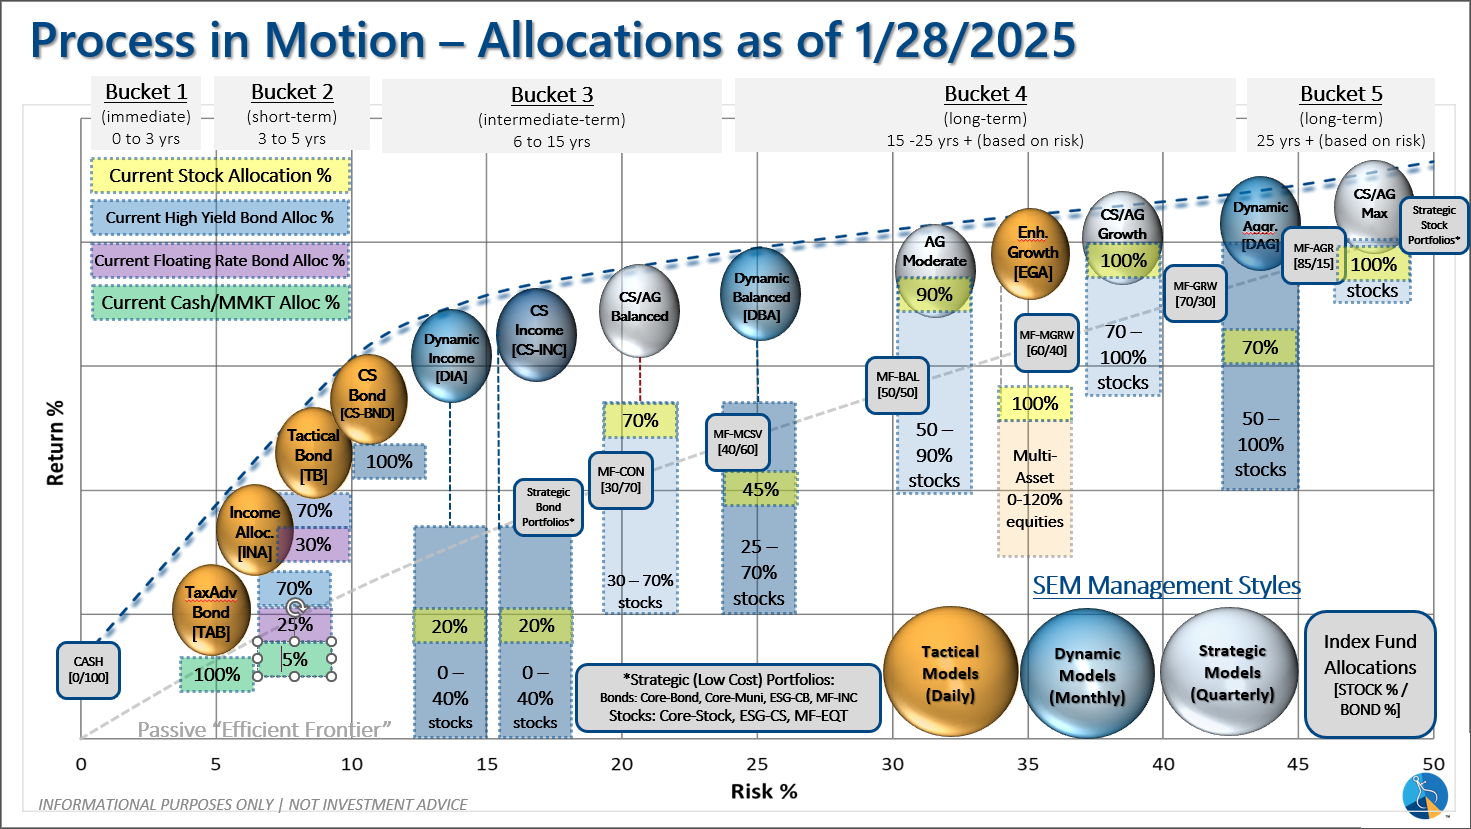
SEM deploys 3 distinct approaches – Tactical, Dynamic, and Strategic. These systems have been described as 'daily, monthly, quarterly' given how often they may make adjustments. Here is where they each stand.
Tactical (daily): On 12/20/2024 our tactical high yield model sold out of high yield bond (about 70% of our holdings) into money market. The other 30% is invested in shorter duration, higher yielding floating rate bonds. These instruments are not as sensitive to credit risk and are typically allocated to in the early and late stages of a high yield bond move in our model.
Dynamic (monthly): The economic model was 'neutral' since February. In early May the model moved slightly negative, but reversed back to 'neutral' in June. This means 'benchmark' positions – 20% dividend stocks in Dynamic Income and 20% small cap stocks in Dynamic Aggressive Growth. The interest rate model is slightly 'bullish'.
Strategic (quarterly)*
: BOTH Trend Systems reversed back to a buy on 11/27/2023
The core rotation is adjusted quarterly. On August 17 it rotated out of mid-cap growth and into small cap value. It also sold some large cap value to buy some large cap blend and growth. The large cap purchases were in actively managed funds with more diversification than the S&P 500 (banking on the market broadening out beyond the top 5-10 stocks.) On January 8 it rotated completely out of small cap value and mid-cap growth to purchase another broad (more diversified) large cap blend fund along with a Dividend Growth fund.
The * in quarterly is for the trend models. These models are watched daily but they trade infrequently based on readings of where each believe we are in the cycle. The trend systems can be susceptible to "whipsaws" as we saw with the recent sell and buy signals at the end of October and November. The goal of the systems is to miss major downturns in the market. Risks are high when the market has been stampeding higher as it has for most of 2023. This means sometimes selling too soon. As we saw with the recent trade, the systems can quickly reverse if they are wrong.
Overall, this is how our various models stack up based on the last allocation change:
Questions or comments - drop us a note?
Curious if your current investment allocation aligns with your overall objectives and risk tolerance? Take our risk questionnaire


