
Here we go again, time for the 7th year of the Monday Morning Musings (MMM). For newer readers, this was started in early 2020 as this odd virus from China started to hit our borders. With it, market volatility jumped, news alerts were hitting all of our phones multiple times an hour, and everyone was filling our inboxes with "special market updates."
We pivoted from the longer form blog at that time to simply digest all of the stuff crossing my desk and filling my brain. The MMM was and is designed to be the source to show what really matters for the markets so busy financial advisors and investors do not have to fill their brains with all the noise around the markets. Some weeks there are 7-8 "articles" (thoughts), others there are only 1 or 2 that take up all the space. Such is life as an investment manager.
Going into the new year there are many questions, continued high expectations (and valuations), all kinds of "new" developments, and plenty of "news alerts" that take the stock market down or send it on another fantastic rally. We will be here all along the way.
Unless something else develops the attack and seizure of Venezuela's president is simply "noise" right now in terms of the economy and markets. Our Patriot Portfolio, coming off a second consecutive market beating year is a likely beneficiary of this. Energy stocks who are able to profit from our new "relationship" with Venezuela (currently Chevron is the only US based company with a presence there may benefit.) Keep in mind, energy stocks are only 4% of the S&P 500, so there won't be much of a market impact. Ironically their profits may be hit if oil declines as more supply comes onto the market. That could marginally help inflation although oil prices have not been the driver of inflation the past 12 months (shelter, health care and services have been the key contributors). One thing that is missed is the oil from Venezuela is even more "heavy" and "sour" than the US produced oil. It is more expensive to refine and is not suitable for the vehicles used in the US and other developed countries. It is best used for diesel and machinery as well as to export to other emerging economies.
For this week, most of my "big picture" thoughts have already been summarized in our 4th Quarter newsletter, which posted last week. I spent the better part of Tuesday, Wednesday, and Friday drafting it. We will be sending it to advisors and clients later in the week. You can also check it out here:
The main theme for me as we start the year is to set proper expectations. Three consecutive double digit years for the S&P 500 are rare, but it doesn't mean we cannot have a 4th (or even a 5th). Wall Street strategists are certainly betting on it with some seeing even higher returns this year.
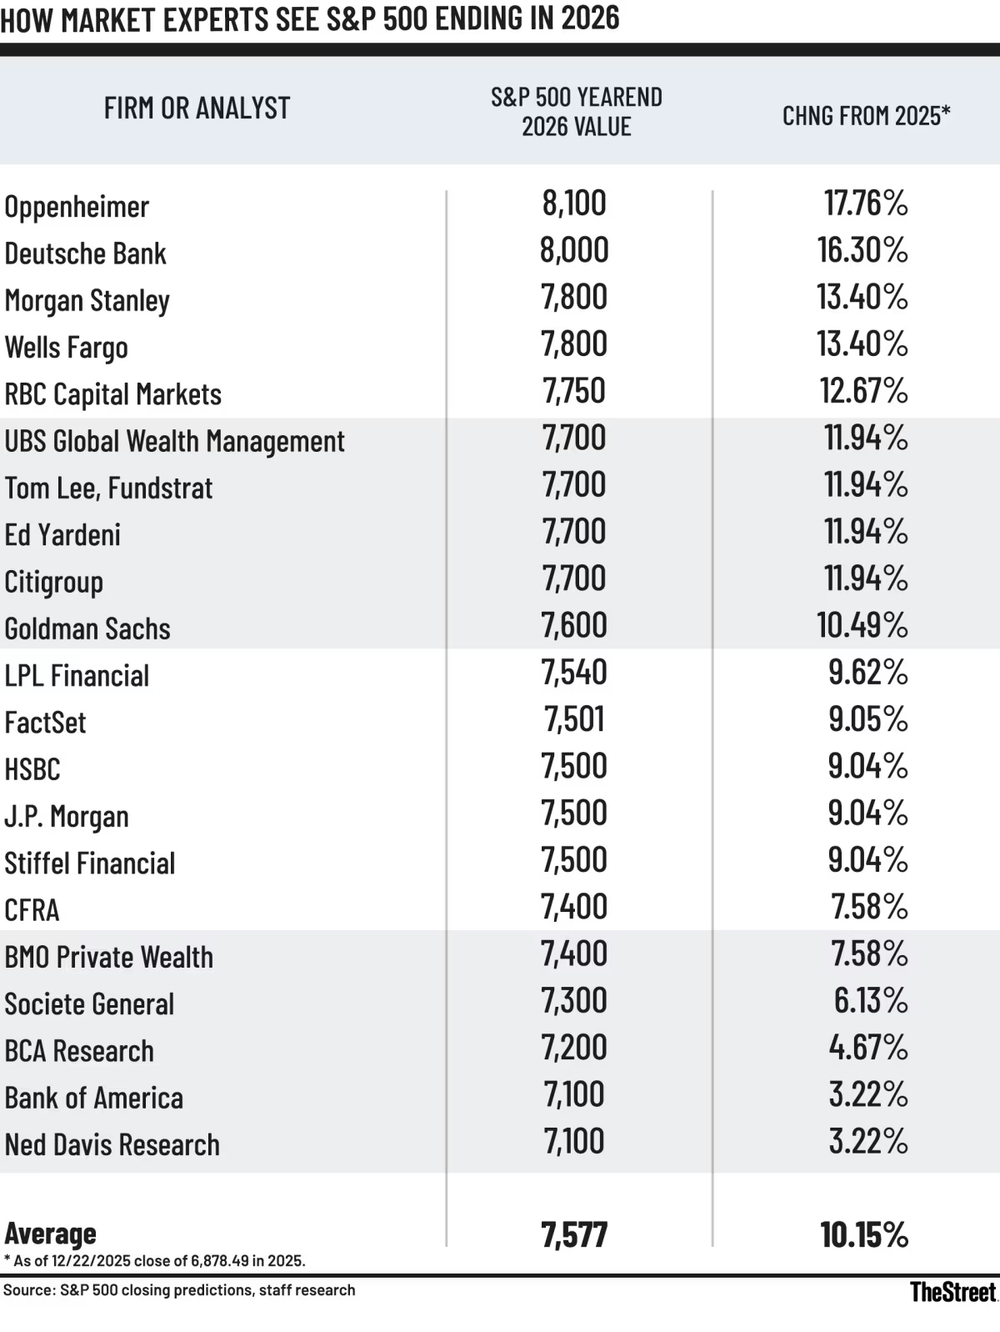
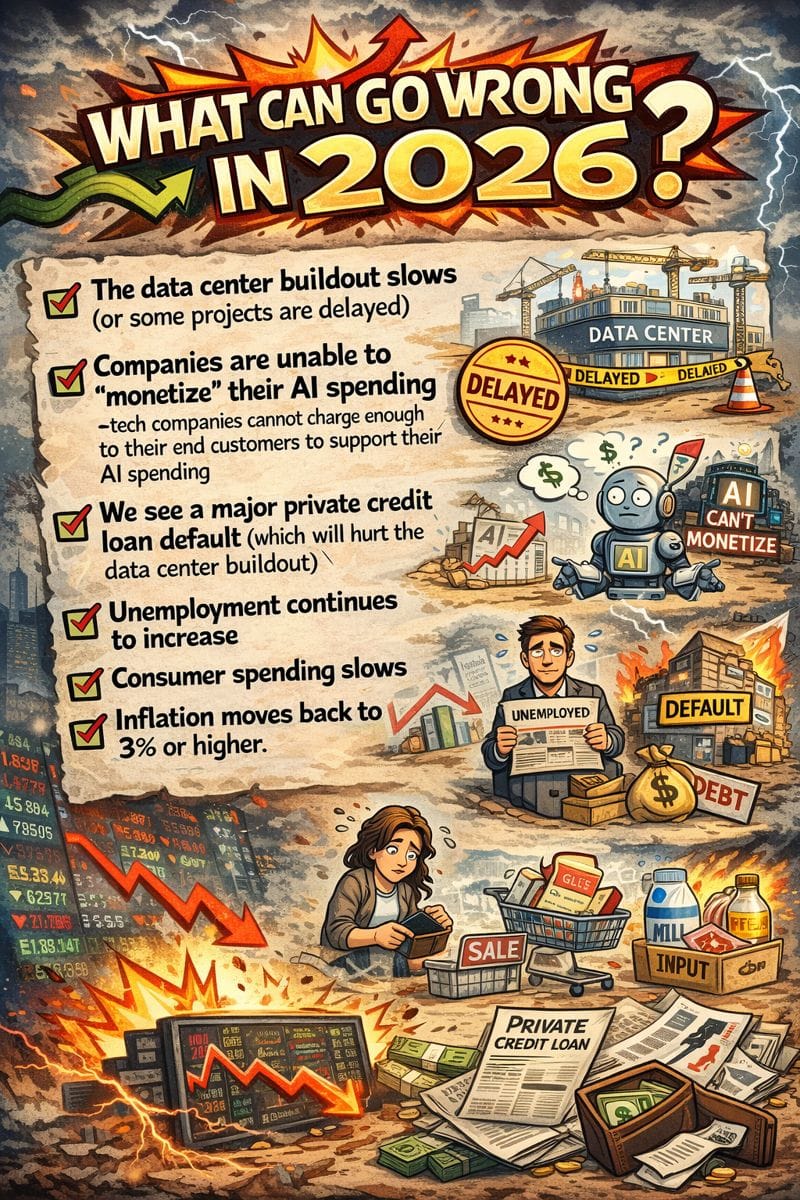
We know that analysts almost always predict positive returns for stocks and were dreadfully wrong ahead of big down years (Oppenheimer predicted a 15% gain in 2022 – a year the market lost 18%). The big question and something we'll be watching in the blog this week is "what can go wrong". Here is my list:
Given the returns of the last 3 years for the S&P 500, we fully expect the number of request for "more equity exposure" to come both to us and to employer retirement plans in the next few months as the "reviews" of the last 5 years will show exceptionally strong returns for US stocks and much smaller returns for bond investments. For some investors it does make sense. It really comes down to 3 things:
1.) Financial Plan (what is the planned use and time frame of the money invested?)
2.) Cash Flow Strategy (when and how much will you be taking from the investments?)
3.) Investment Personality (can you handle the inevitable recessionary bear market?)
We should EXPECT a 35-50% drop in stock prices. Recessions and the bear markets which accompany them will happen. If you NEED the money during or 3-7 years after the large drop, having too much money in stocks could do significant long-term damage to your plan. If you know you will want to take some money off the table if you see a 12-18 month period of losses of 35% or more, you also should be adjusting your stock allocation down, not up.
A move to more equities/risk now could end up looking "smart" over the next year or two, but still be the "wrong" decision when you take a 7-10 year time frame into account. This is because by all accounts stocks are significantly overvalued and at levels which historically have led to returns well below average. Yes, we said the exact same thing last year. Valuations are not a timing mechanism, but should instead be used to set expectations and to consider rebalancing the portfolio.
The big name firms are all forecasting returns over the next 10 years for US stocks to be well below average, international stocks to outperform the US and for bonds to generate returns just below stocks.
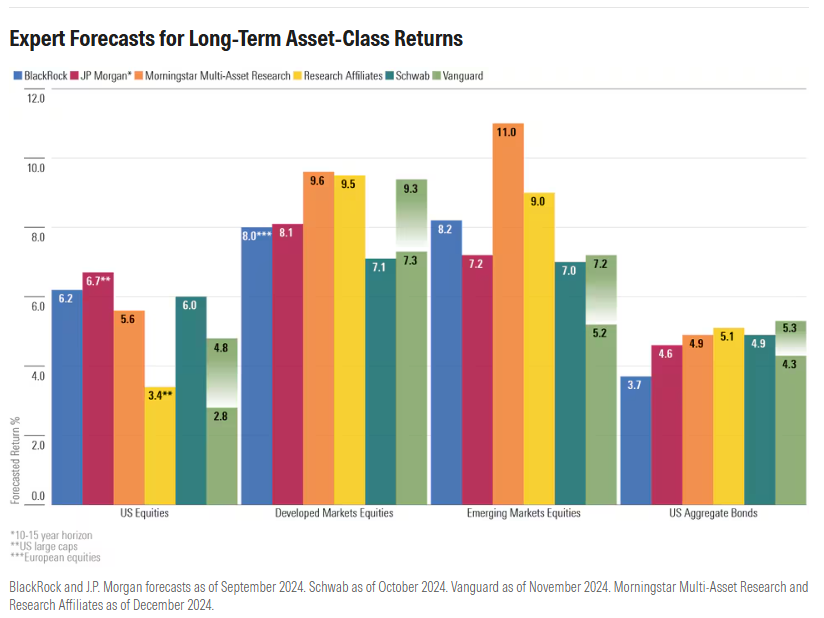
The most important thing to keep in mind is it is highly unlikely we simply see US stocks compounding at a steady 5-6% per year for the next 10 years. Anytime we've had valuation extremes such as now, what has happened was a 12-18 month decline followed by 5-8 years of much larger gains just to recover the losses. Yes, from the 10-year point A to point B you would have compounded at an AVERAGE of 5-6%, but it has not been a comfortable ride.
I like to use this chart to keep things in perspective:
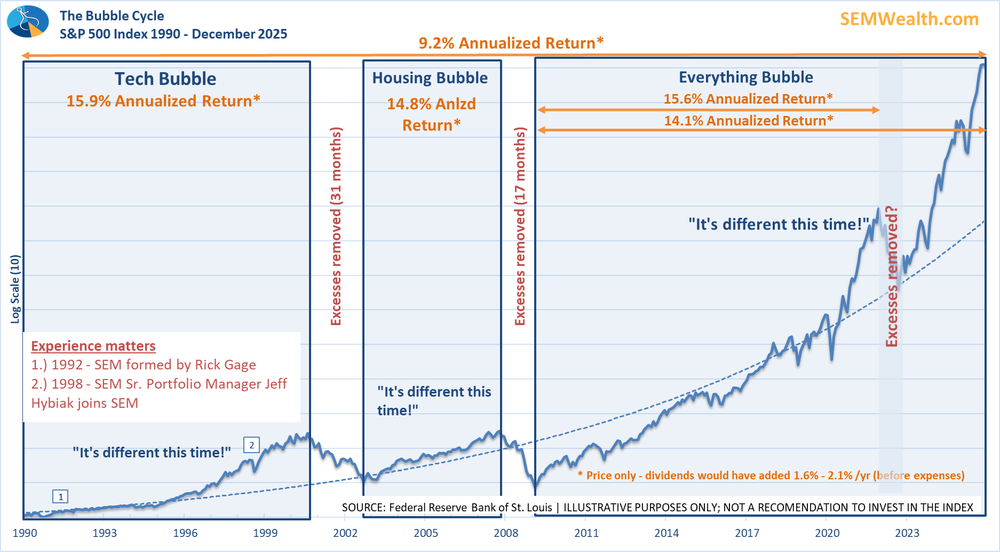
Looking at this chart, it's important to consider all of the amazing technological revolutions which have been developed since 1990. They've made us more productive, efficient, increased profit margins and been a source of tremendous growth for corporations and individuals alike – exactly like they were predicting in the 1990s. Yet, since that time, the stock market has compounded at a 9.2% annualized rate (without dividend reinvestment).
Everyone is saying the same thing about "AI" as they were about the technology revolution of the 90s. I fully expect (most of) those predictions to come true. However, that doesn't mean stocks will suddenly continue compounding at a 14-15% annualized rate rather than the long-term rate of 9-10% (which is the same rate we've enjoyed going back 50 & 100 years!) Excesses have always been removed when we get to these types of expectations and is something we should plan for.
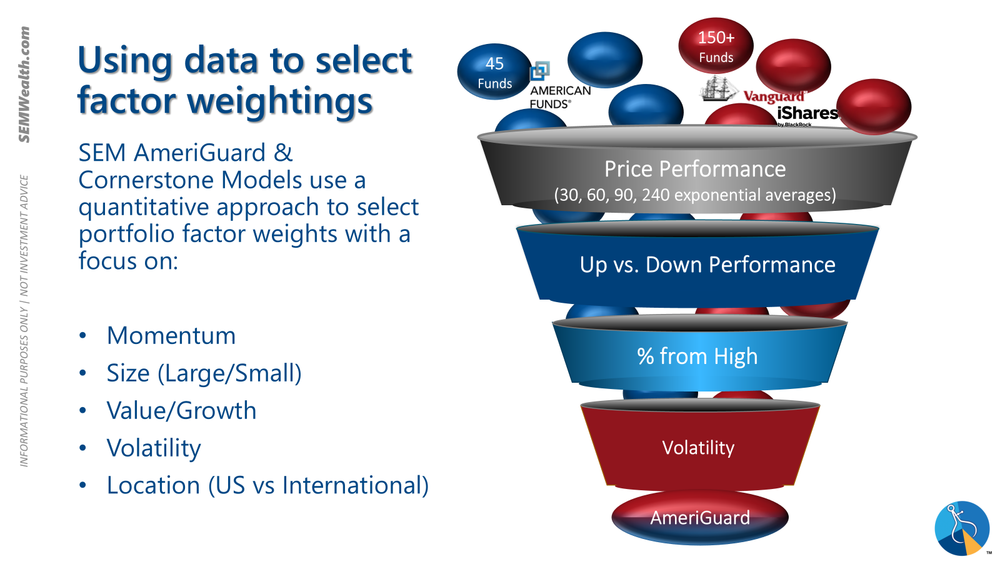
Our goal at SEM is to do what we've always done. Use our data driven models to take money off the table when risks are high (even if they end up with hindsight being "bad" trades). We would rather give up some upside than risk having too much downside. We also fully expect our core systems to rotate more into international stocks should the data indicate that is where the momentum is. On the bond side, we also expect plenty of opportunities to make-up for "lackluster" recent returns. The key there is keeping the losses at manageable levels so when those opportunities emerge we do not have to take on large amounts of risk just to make up the losses.
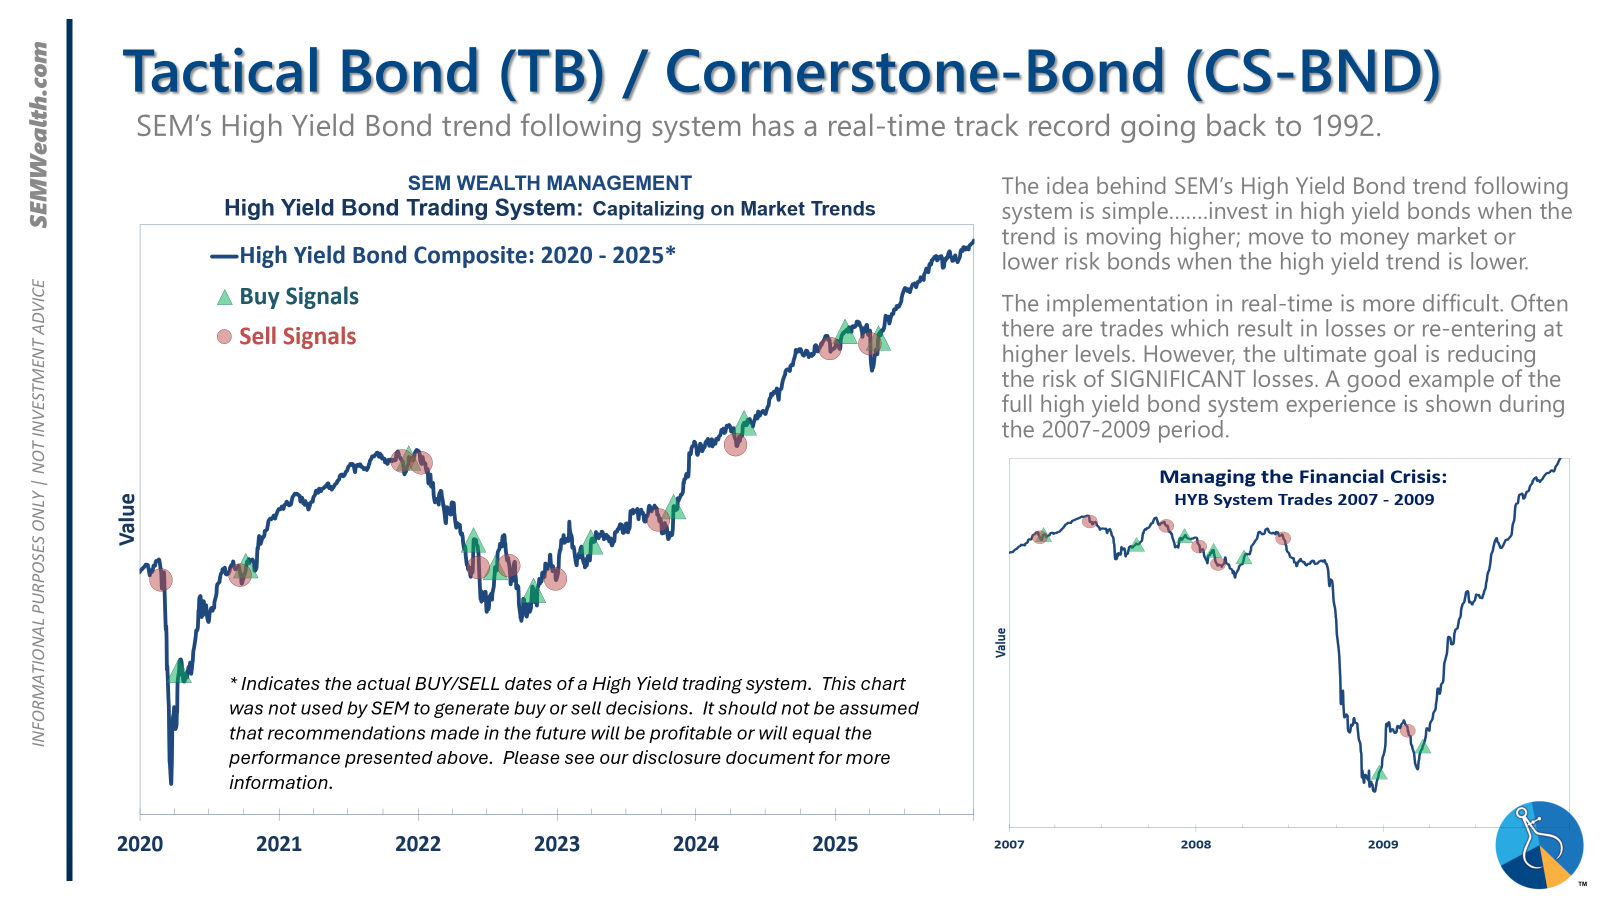
Speaking of bonds, while our fixed income portfolio returns were obviously much lower than stocks, they did generate a nice, 'average' year. Considering the big shock stocks and bonds took in April, once again our Tactical Bond, Cornerstone Bond, and Income Allocator models proved the value of a data-driven quantitative approach. Here is the updated slide showing the real-time trades of our core Tactical Bond model. Note the "whipsaw" sell/buy signal in April of 2025. We got back in 3 weeks after we sold and ended up carrying those positions through the rest of the year.

These models are your first line of defense for our custom portfolios. They can react rather quickly if necessary to take money off the table.
The newsletter also addressed the reason our "growth" portfolios underperformed. We did see these models "re-calibrate" as they "trend" model which sold in April got back in and our July "core" rebalance took us into areas which allowed us to claw back some of the missed opportunities. Given the outlook for US and international stocks, having a way to systematically allocate to and from these segments is going to be important in the years ahead.
Where we are in the cycle most certainly matters. Our models, which have been used both in real-time during past market bubbles as well as tested through all sorts of markets are telling us we are either approaching the "top" or have already hit it. We won't know until we have the benefit of hindsight to know WHEN that occurred. As Rick has always said, "we invest on the hard right edge," meaning we are on the right side of the chart and have to use the tools available to us (not our fallible human brains) to make the decision on how to invest for the FUTURE, not what just happened.
We won't always be right, but the key is we have a plan for no matter what comes our way.
Toby's Take
A look at our intern's summary of the top WSJ articles from last week
12/29/2025 - Sam’s Club Is Beating Costco at Its Own Game—in China - WSJ
Sam's Club has a new strategy to fight Costco and lead the industry by going to China. Sam's Club has opened 21 stores in the last three years adding onto their already existing 39. With 60 stores in the world's second-largest economy compared to Costco's 7 stores. Being that Sam's Club is owned by Walmart, their reason for struggle has been the budget reputation that Walmart has built. But, now they can get a do-over in China. So far it has been working with their biggest stores making over $500 million in sales annually. We may want to keep our eye on Walmart's stock value to see how this affects them in their earnings reports!
12/30/2025 - After a Year of Blistering Growth, AI Chip Makers Get Ready for Bigger 2026 - WSJ
This year has had lots of talk of artificial intelligence and as a result the semiconductor business has been huge. There was more than $400 billion in combined semiconductor sales this year. Next year may be even bigger! We have followed the growth of these different semiconductor makers and will continue to hopefully see more growth in this next year.
12/31/2025 - A Shrimper, a Carmaker, a Lawyer: How the World Tackled Trump’s Trade War - WSJ
President Trump's Trade War was intimidating at first for everyone, not just for how our own prices would be impacted, but also how world trade would be affected. Things were definitely uncomfortable at first, but global trade merchandise volumes should end the year at 2.4% up! We did see Chinese exports branch out to other countries, especially Europe as another side effect.
1/2/2026 - Five Wall Street Investors Explain How They’re Approaching the Coming Year - WSJ
The S&P 500 has gained 80% from 2023 through the end of 2025. That is one of its biggest three-year runs in history! There are many investors that believe that it will have even further gains in 2026. However, there are concerns surrounding stretched valuations of AI companies, where interest rates are heading, and outlook in Washington, D.C. With such high expectations, the S&P 500 could be interesting to watch this year following the last three.
Market Charts
Note: the "last week" numbers are for the past 5 trading days. Y-Charts is unable to show us the last calendar week.
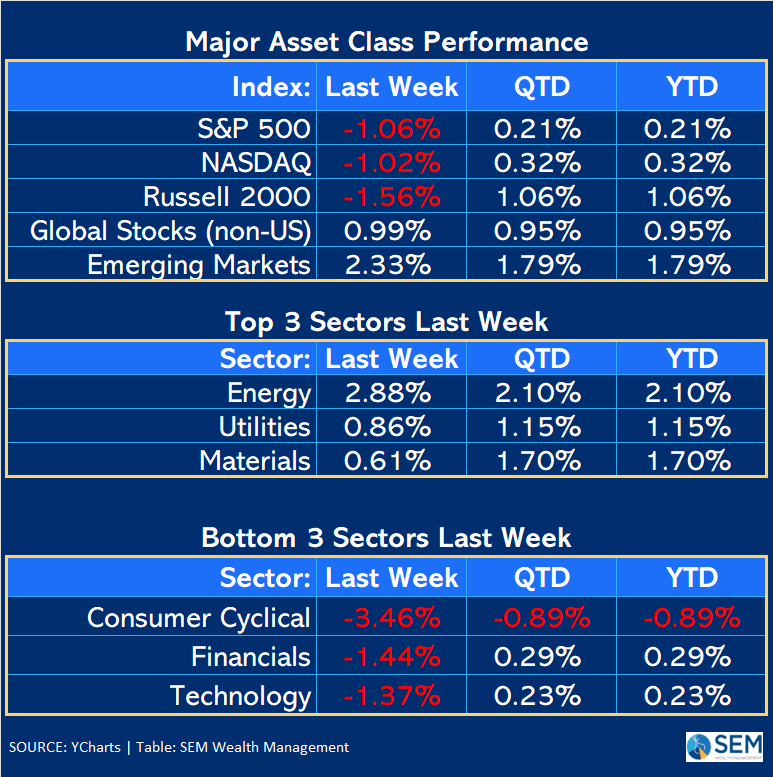
2025 closed with a bit of rotation to sectors that would do better during an economic slowdown and out of those which are economically sensitive. Of course, if we understand technology is expected to be nearly 70% of the total earnings it would be hard for the S&P 500 to handle any sort of disappointment from tech earnings.
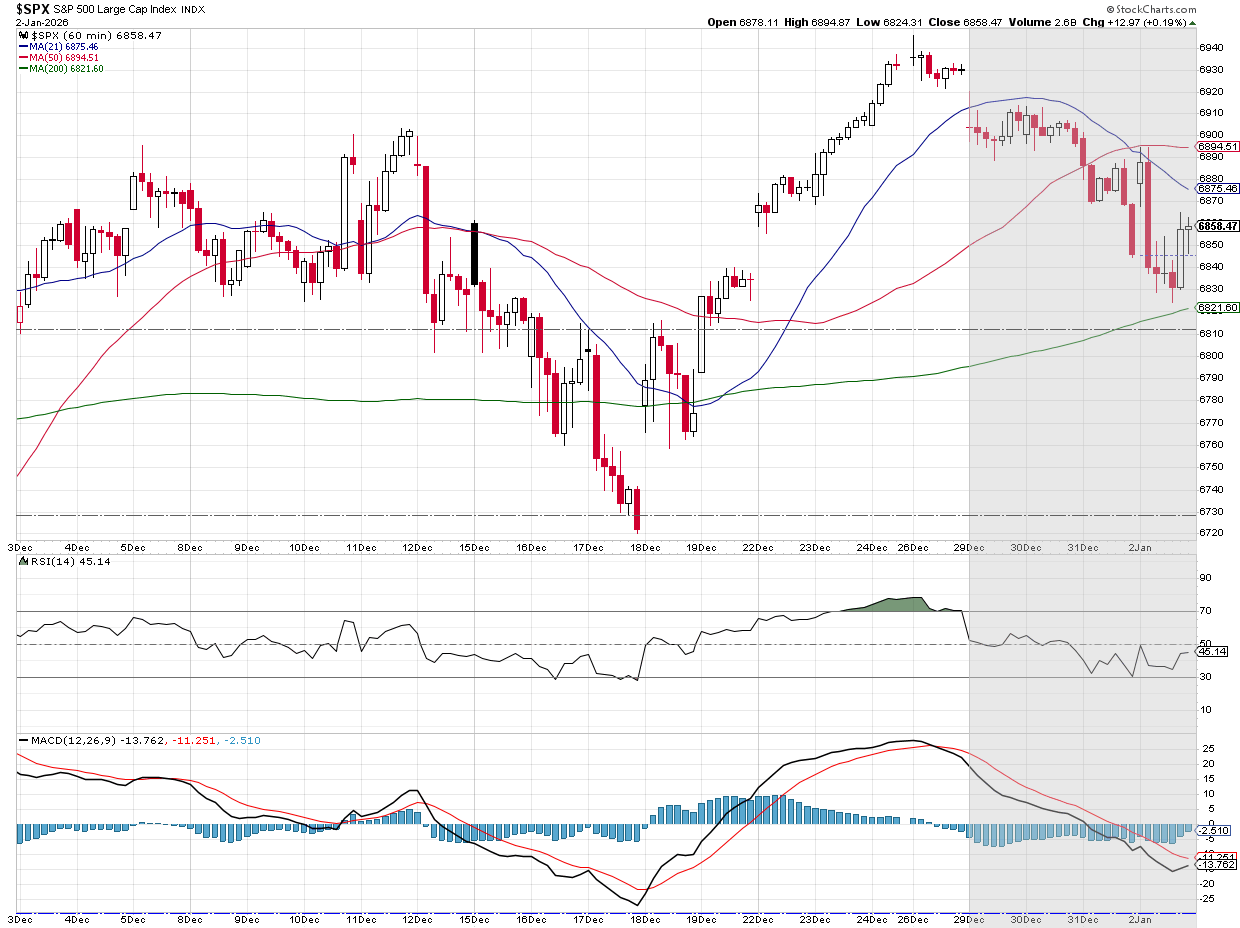
Two weeks ago stocks closed at essentially the same level it was at following the last 2 Fed meetings. They again have retreated a bit. I tend to not make any assessments on the trading action the first day or even the first 10 days of a year. We'll need to let corporate earnings start to come out to get a feel for the sentiment and "stories" the market is starting to tell us.
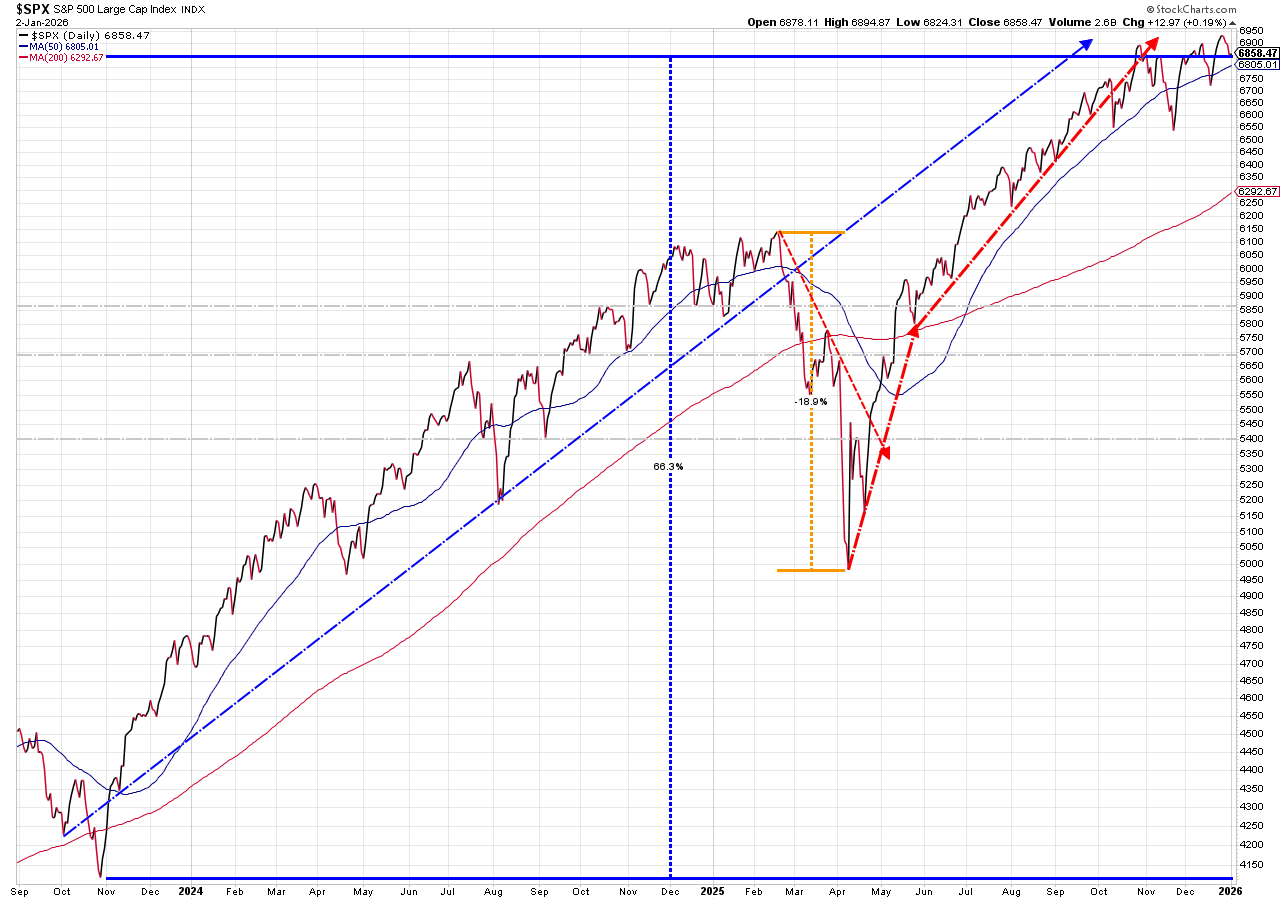
As it is, the S&P is up 66% in a little over 3 years. The rally began when the Fed announced they were done raising interest rates. The only real blip was the trade war sell-off in February - April 2025.
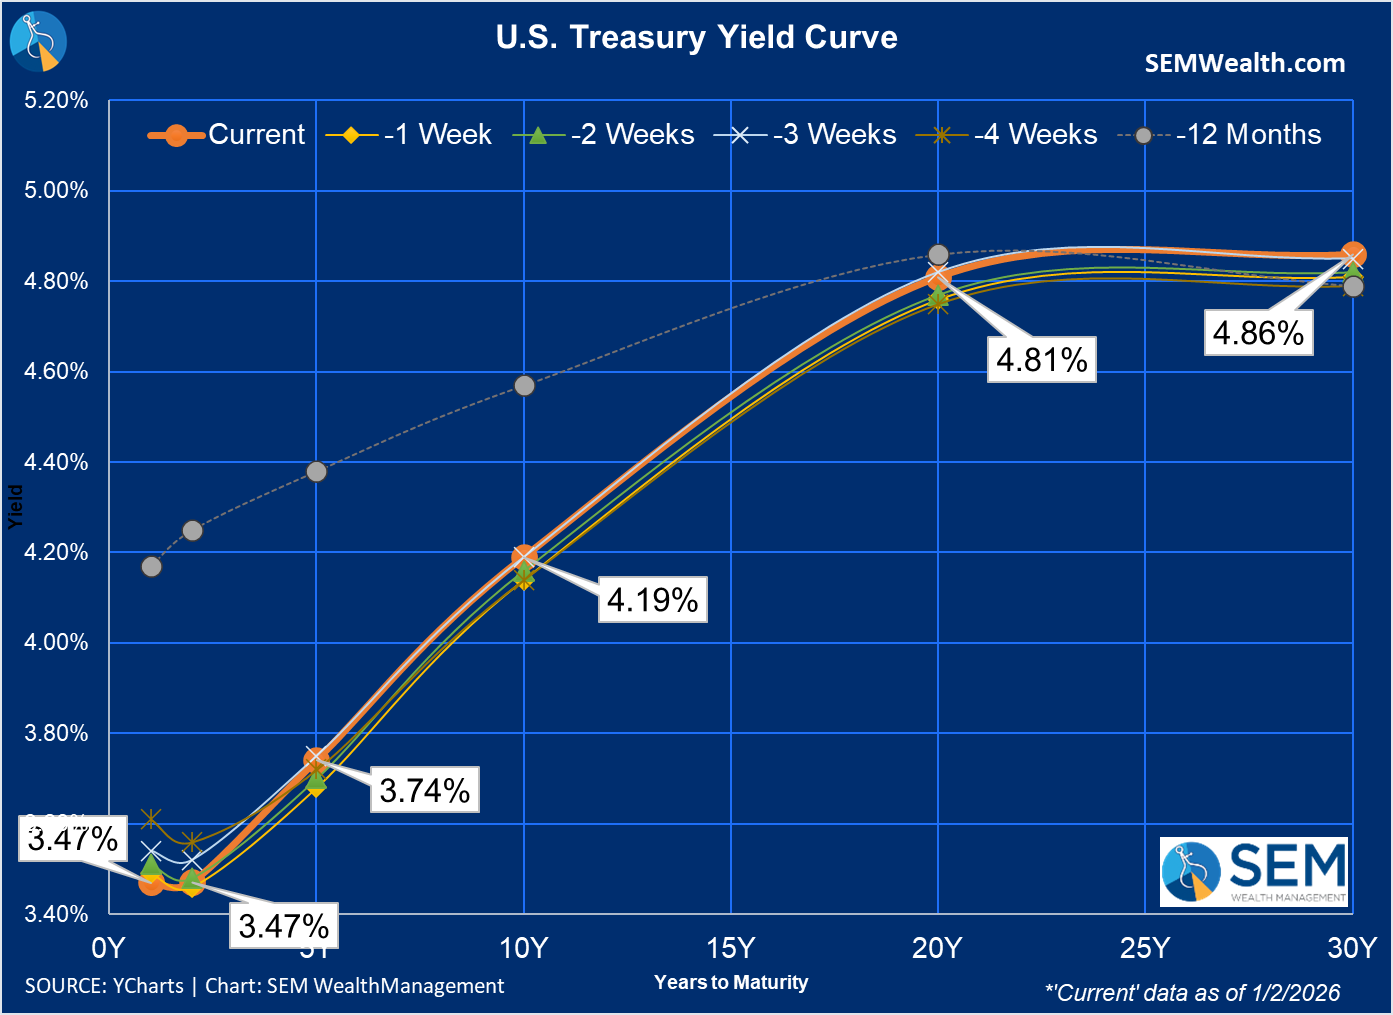
Looking at the bond market, the interest rate environment has become much more favorable over the past year. Longer-term rates have creeped up a bit the past few weeks, but the overall environment is still quite "easy" in terms of the interest rate market.
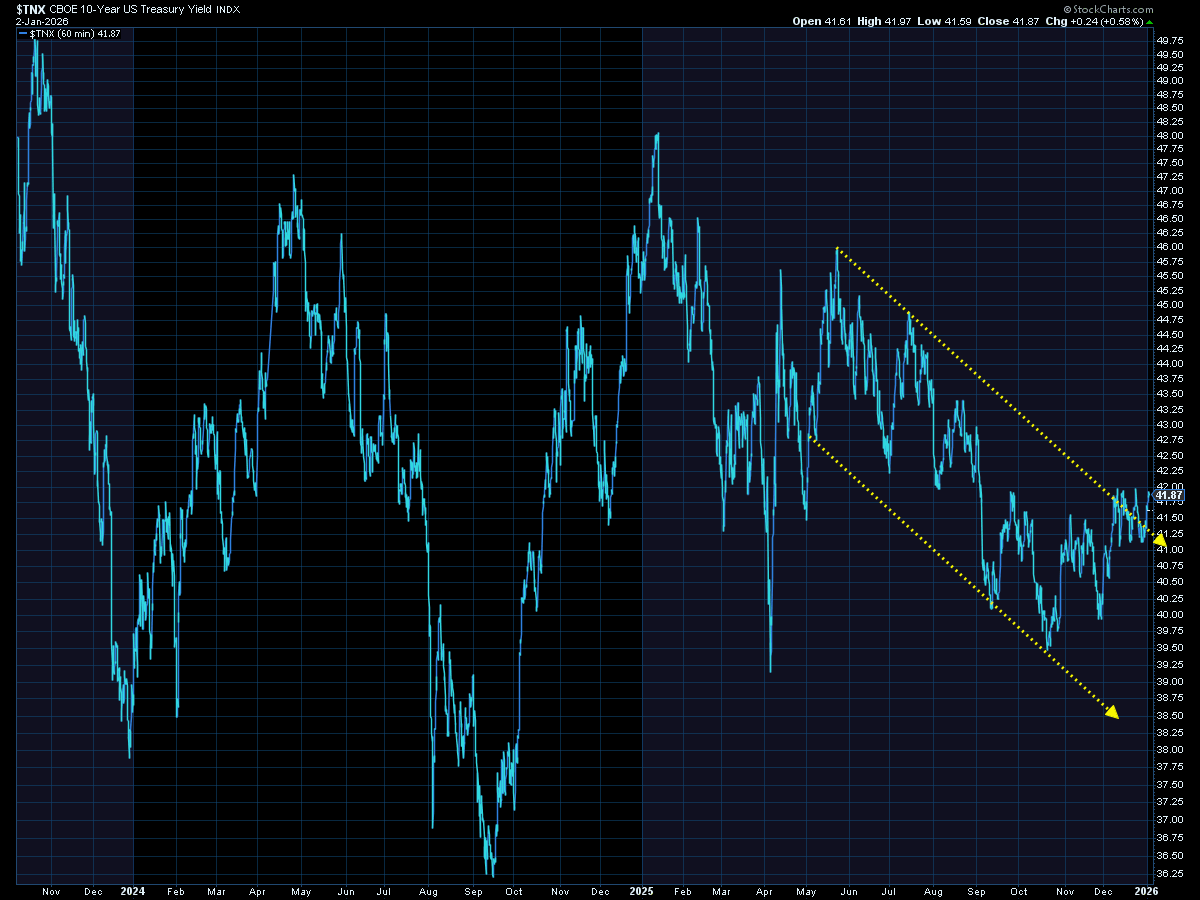
The more important metric to watch will be the 10-year Treasury yield. If it appears the President is going to pick a "yes man" who wants to push rates significantly lower AND the bond market perceives that as an inflation risk, all bets are off for the rosy growth scenarios the market is counting on. As it is, the downtrend channel for yields has been clearly broken although 4.20% seems to be a resistance point for now.
As we always say – be ready for whatever happens.
SEM Market Positioning
| Model Style | Current Stance | Notes |
|---|---|---|
| Tactical | 100% high yield | High-yield spreads holding, but trend is slowing-watching closely |
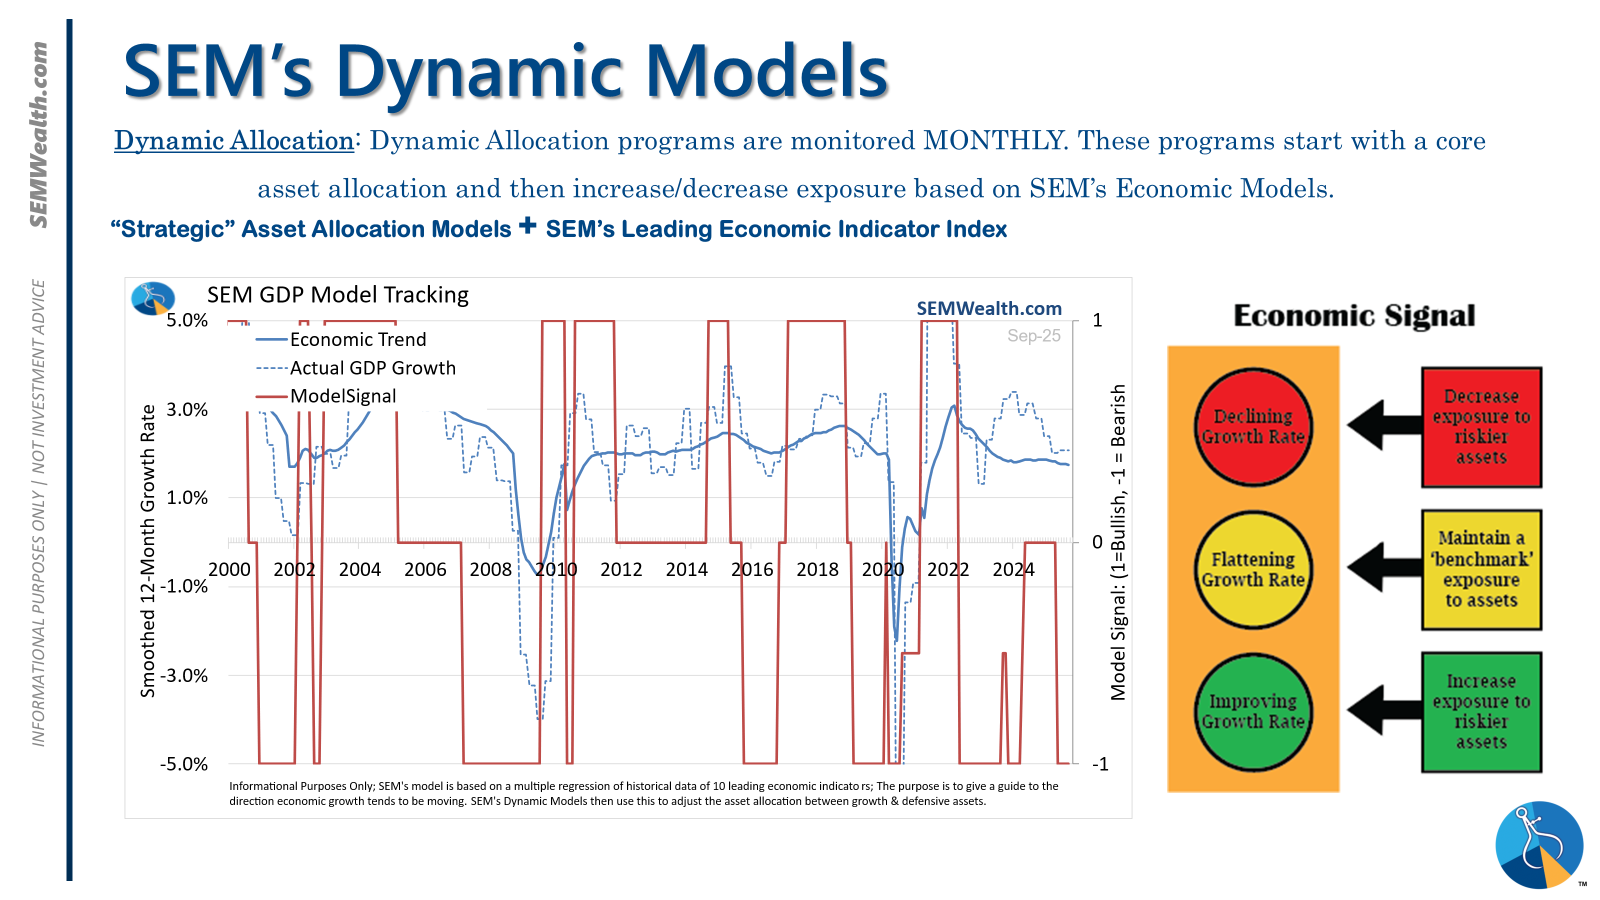
| Dynamic | Bearish | Economic model turned red – leaning defensive |
| Strategic | Slight under-weight | Trend overlay shaved 10 % equity in April -- added 5% back early July |
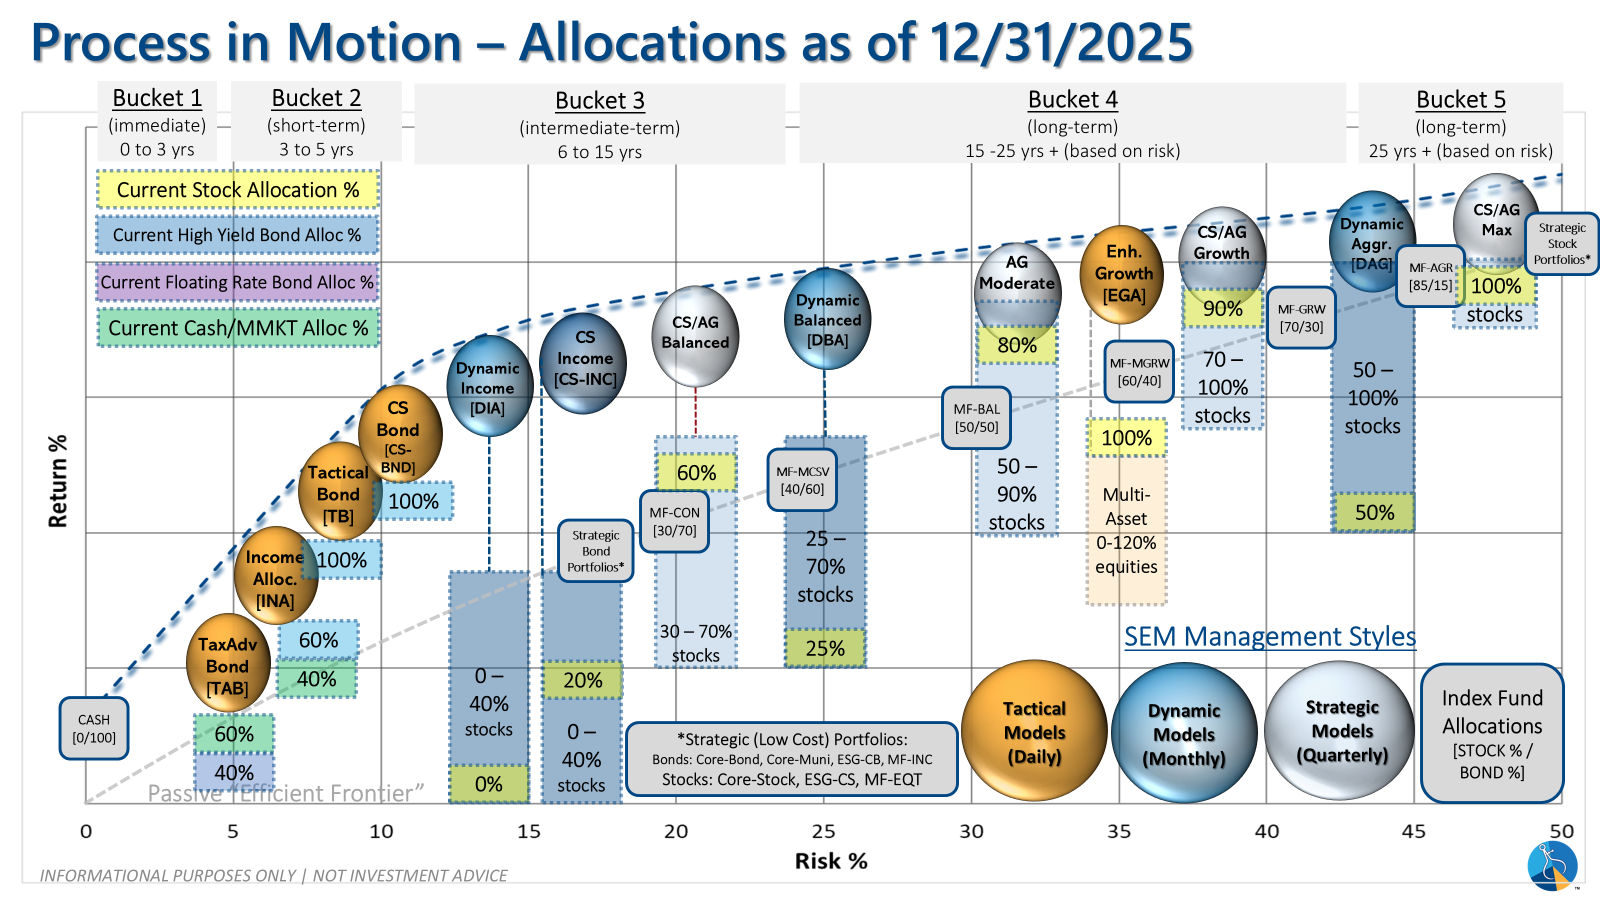
SEM deploys 3 distinct approaches – Tactical, Dynamic, and Strategic. These systems have been described as 'daily, monthly, quarterly' given how often they may make adjustments. Here is where they each stand.
Tactical (daily): The high yield system has been invested since 4/23/25 after a short time out of the market following the sell signal on 4/3/25.
Dynamic (monthly): The economic model went 'bearish' in June 2025 after being 'neutral' for 11 months. This means eliminating risky assets – sell the 20% dividend stocks in Dynamic Income and the 20% small cap stocks in Dynamic Aggressive Growth. The interest rate model is 'bullish' meaning higher duration (Treasury Bond) investments for the bulk of the bonds.
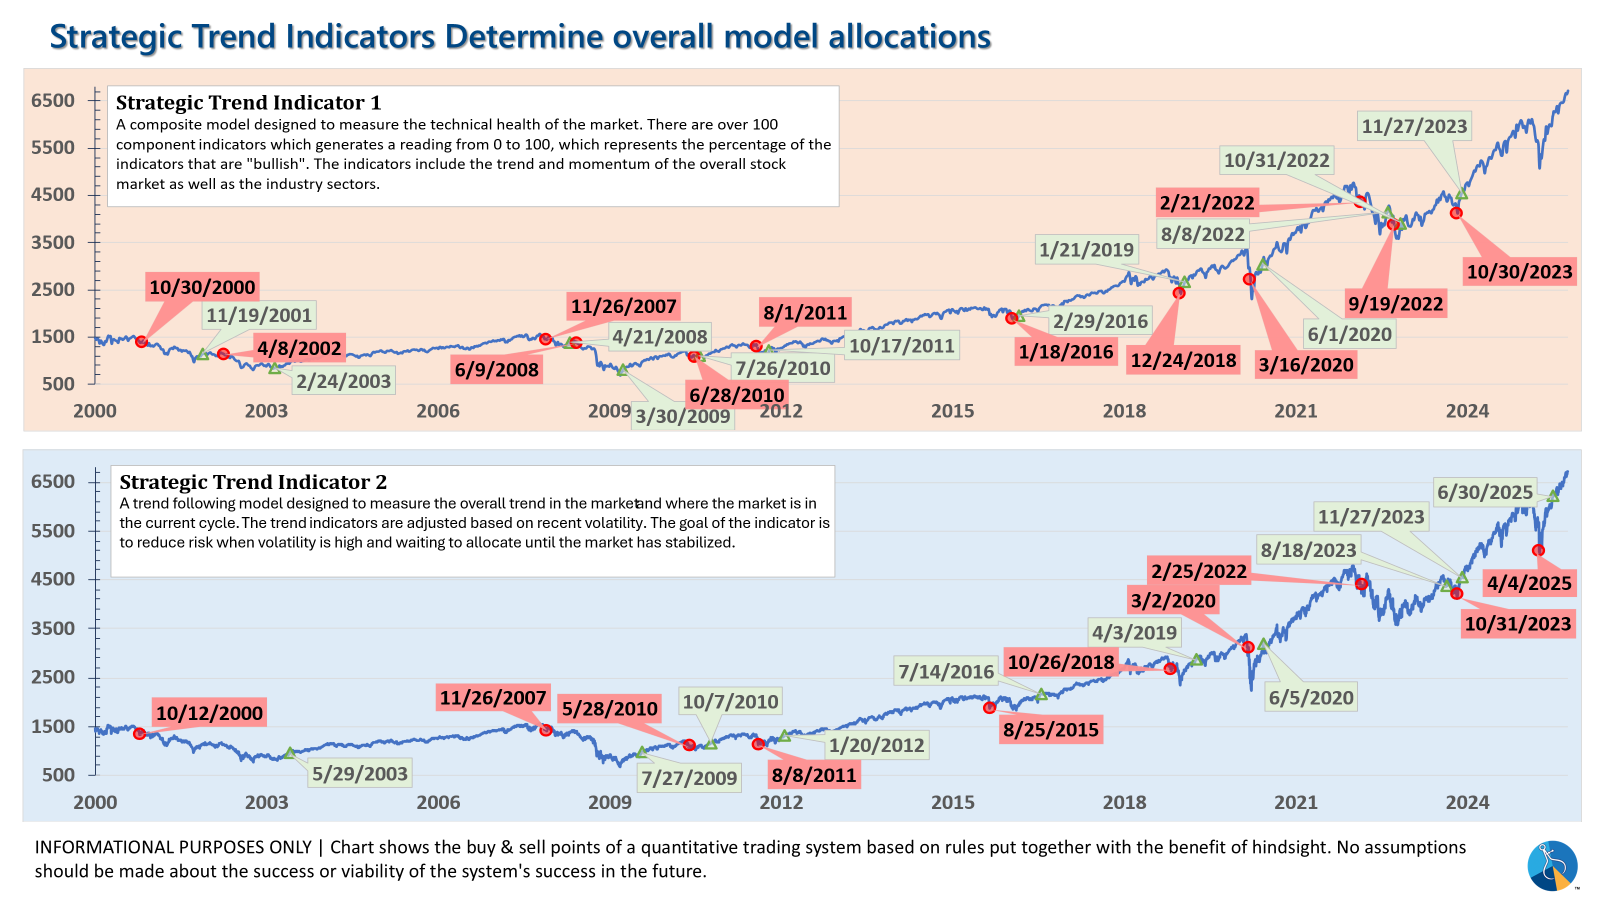
Strategic (quarterly)*: One Trend System sold on 4/4/2025; Re-entered on 6/30/2025
The core rotation is adjusted quarterly. On August 17 it rotated out of mid-cap growth and into small cap value. It also sold some large cap value to buy some large cap blend and growth. The large cap purchases were in actively managed funds with more diversification than the S&P 500 (banking on the market broadening out beyond the top 5-10 stocks.) On January 8 it rotated completely out of small cap value and mid-cap growth to purchase another broad (more diversified) large cap blend fund along with a Dividend Growth fund.
The * in quarterly is for the trend models. These models are watched daily but they trade infrequently based on readings of where each believe we are in the cycle. The trend systems can be susceptible to "whipsaws" as we saw with the recent sell and buy signals at the end of October and November. The goal of the systems is to miss major downturns in the market. Risks are high when the market has been stampeding higher as it has for most of 2023. This means sometimes selling too soon. As we saw with the recent trade, the systems can quickly reverse if they are wrong.
Overall, this is how our various models stack up based on the last allocation change:
Curious if your current investment allocation aligns with your overall objectives and risk tolerance? Take our risk questionnaire


