
It's been four weeks since the United States and Israel attacked Iran. What was thought to be a short-term conflict seems to have turned into something else. This has lead to confusing headlines and statements surrounding the war (including the "statement" on Truth Social this morning that (for now) the US will pause strikes on Iran.) The longer the conflict goes on, the more impact it will likely have on the economy. We now are seeing a few Wall Street analysts adjusting their outlooks for the rest of the year.
At SEM we always use the data to guide us. However, we realize we are all human and want to know what is going on and what we should expect going forward. Whenever there are "non-standard" events, we've found it is best to stick to the data. "Say less", is a good philosophy. With that in mind, this week we're going to focus on the data, our methodology, and what our models are seeing with as little commentary as possible.
I've seen various charts like this one floating around. The point is clear and one I have been emphasizing the last several weeks – over the LONG-TERM the stock market has been able to ignore a wide range of military conflicts. However, over shorter-periods of time the market WILL spend time in a losing position.
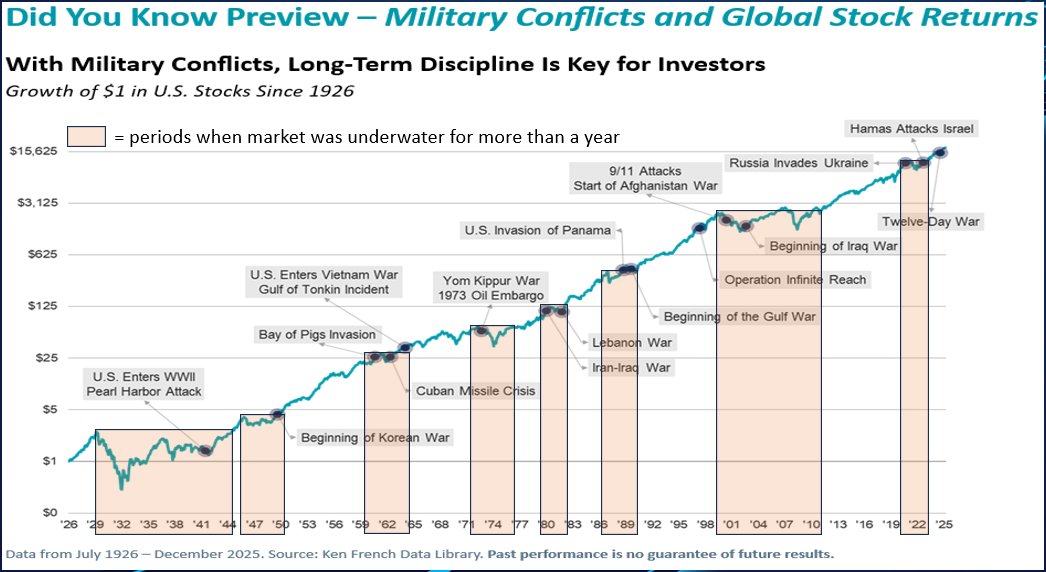
This is where our "bucket" strategy comes into play. Long-term money is able to weather these "underwater" periods to enjoy the benefits of owning stocks for the long-term. The shorter the time the money is needed, the more we have to be cautious of taking on too much risk.
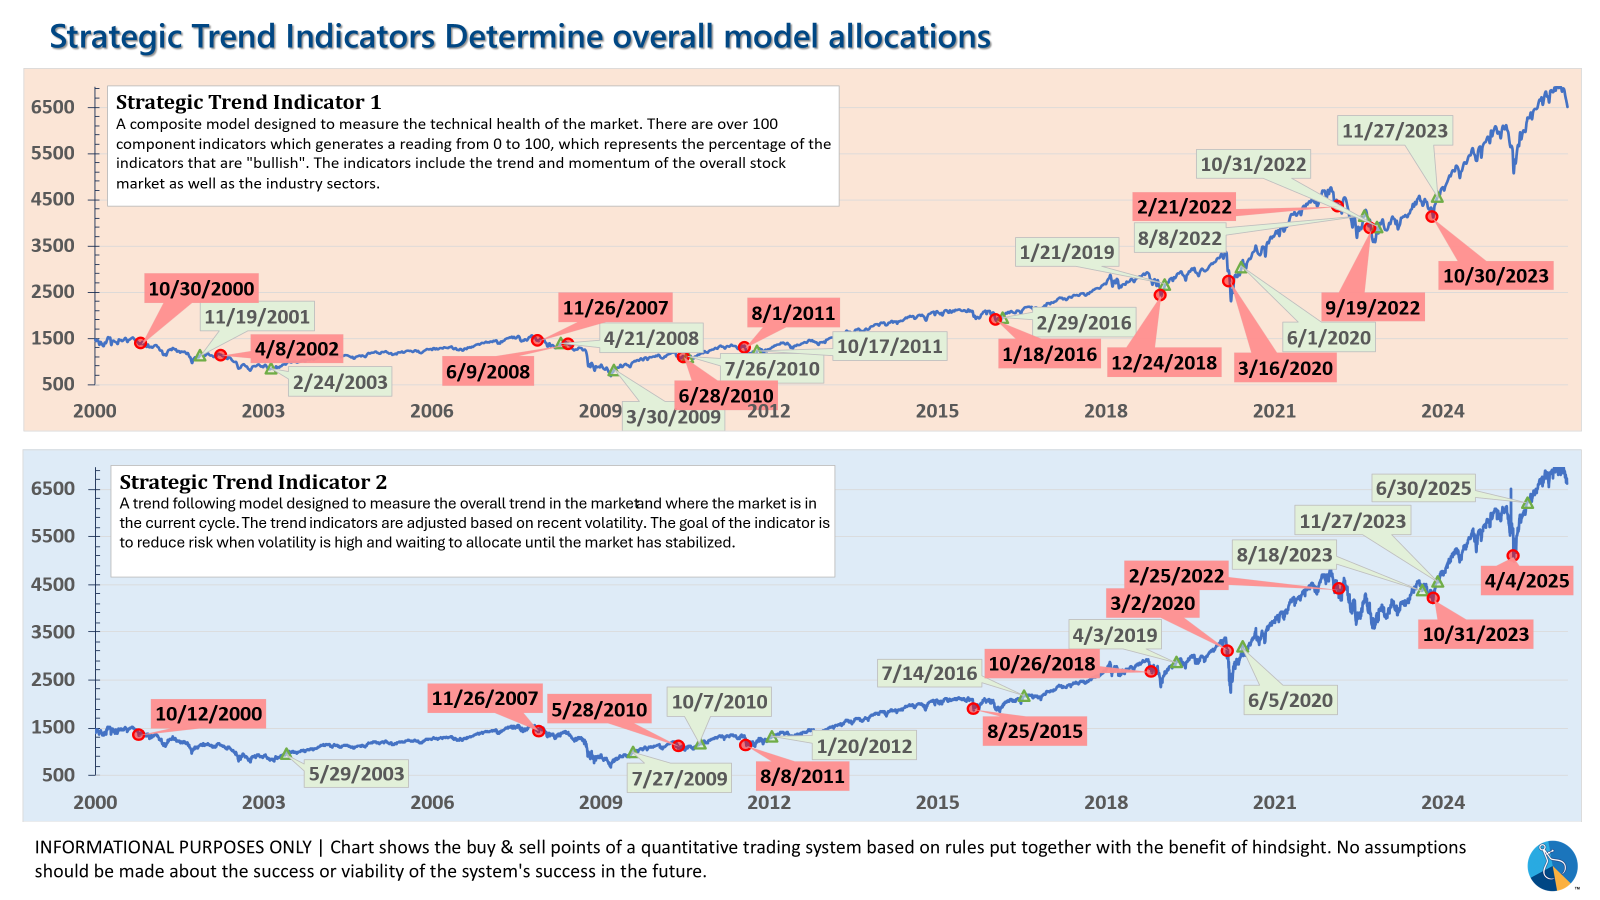
As we mentioned in last week's blog, our lowest risk (and most popular) model, Tactical Bond issued sell signals to bring us out of high yield (junk) bonds for the first time since April 2025. We use this chart to illustrate basically how these systems work.
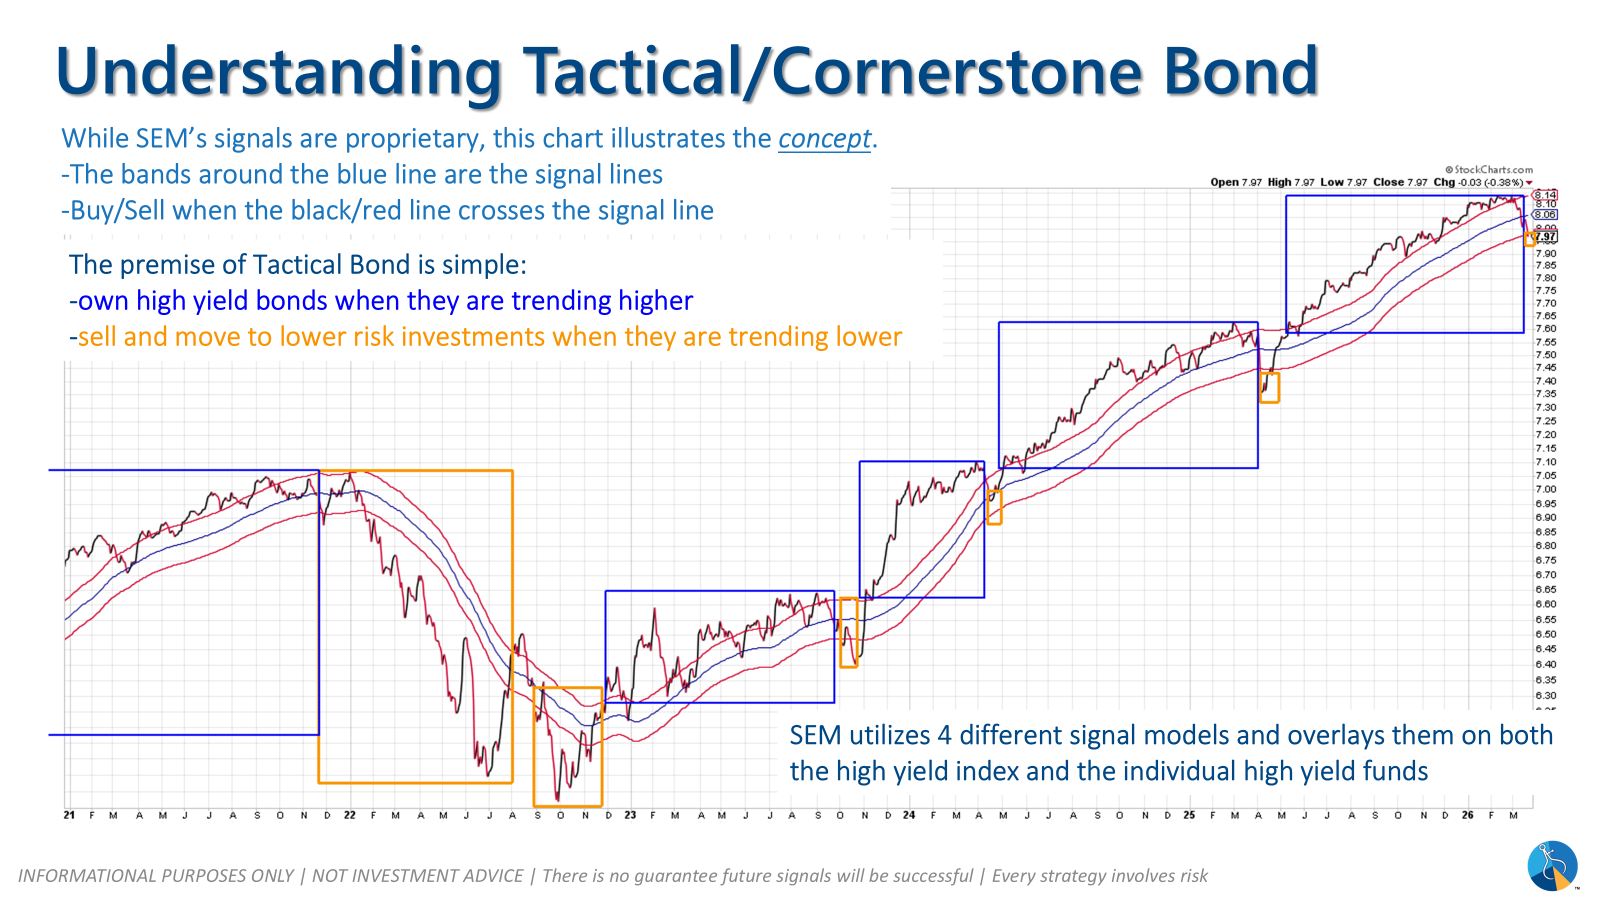
Essentially, we want to use the higher yield of "junk" bonds when they are trending higher. When the trend reverses we retreat to lower risk bonds or as been the case lately, a money market fund. This model will not always be perfect, but since this is designed for shorter-term money, it always errs on the side of caution.
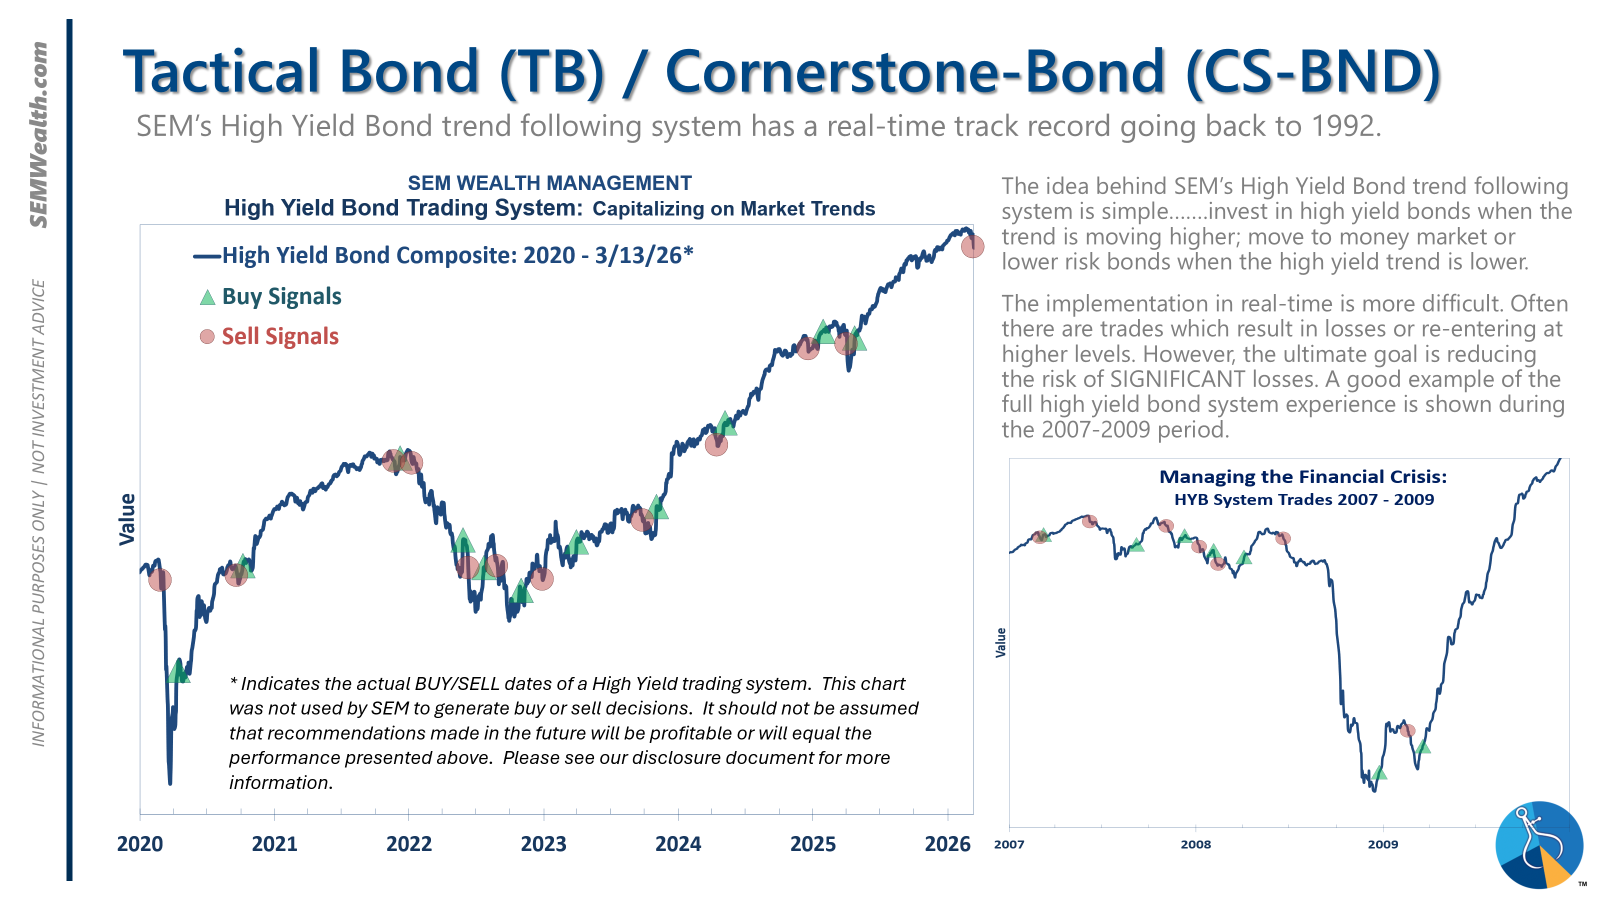
High yield bonds had been holding up surprisingly well, but like we've seen in the past, that can quickly end. One of the pressures on these publicly traded bonds has come from the private credit market. There's an old adage on Wall Street that says during times of crisis you "sell what you can, not what you want". With private credit funds unable to meet the liquidity demands on their products, the next place to sell is in the publicly traded debt markets.
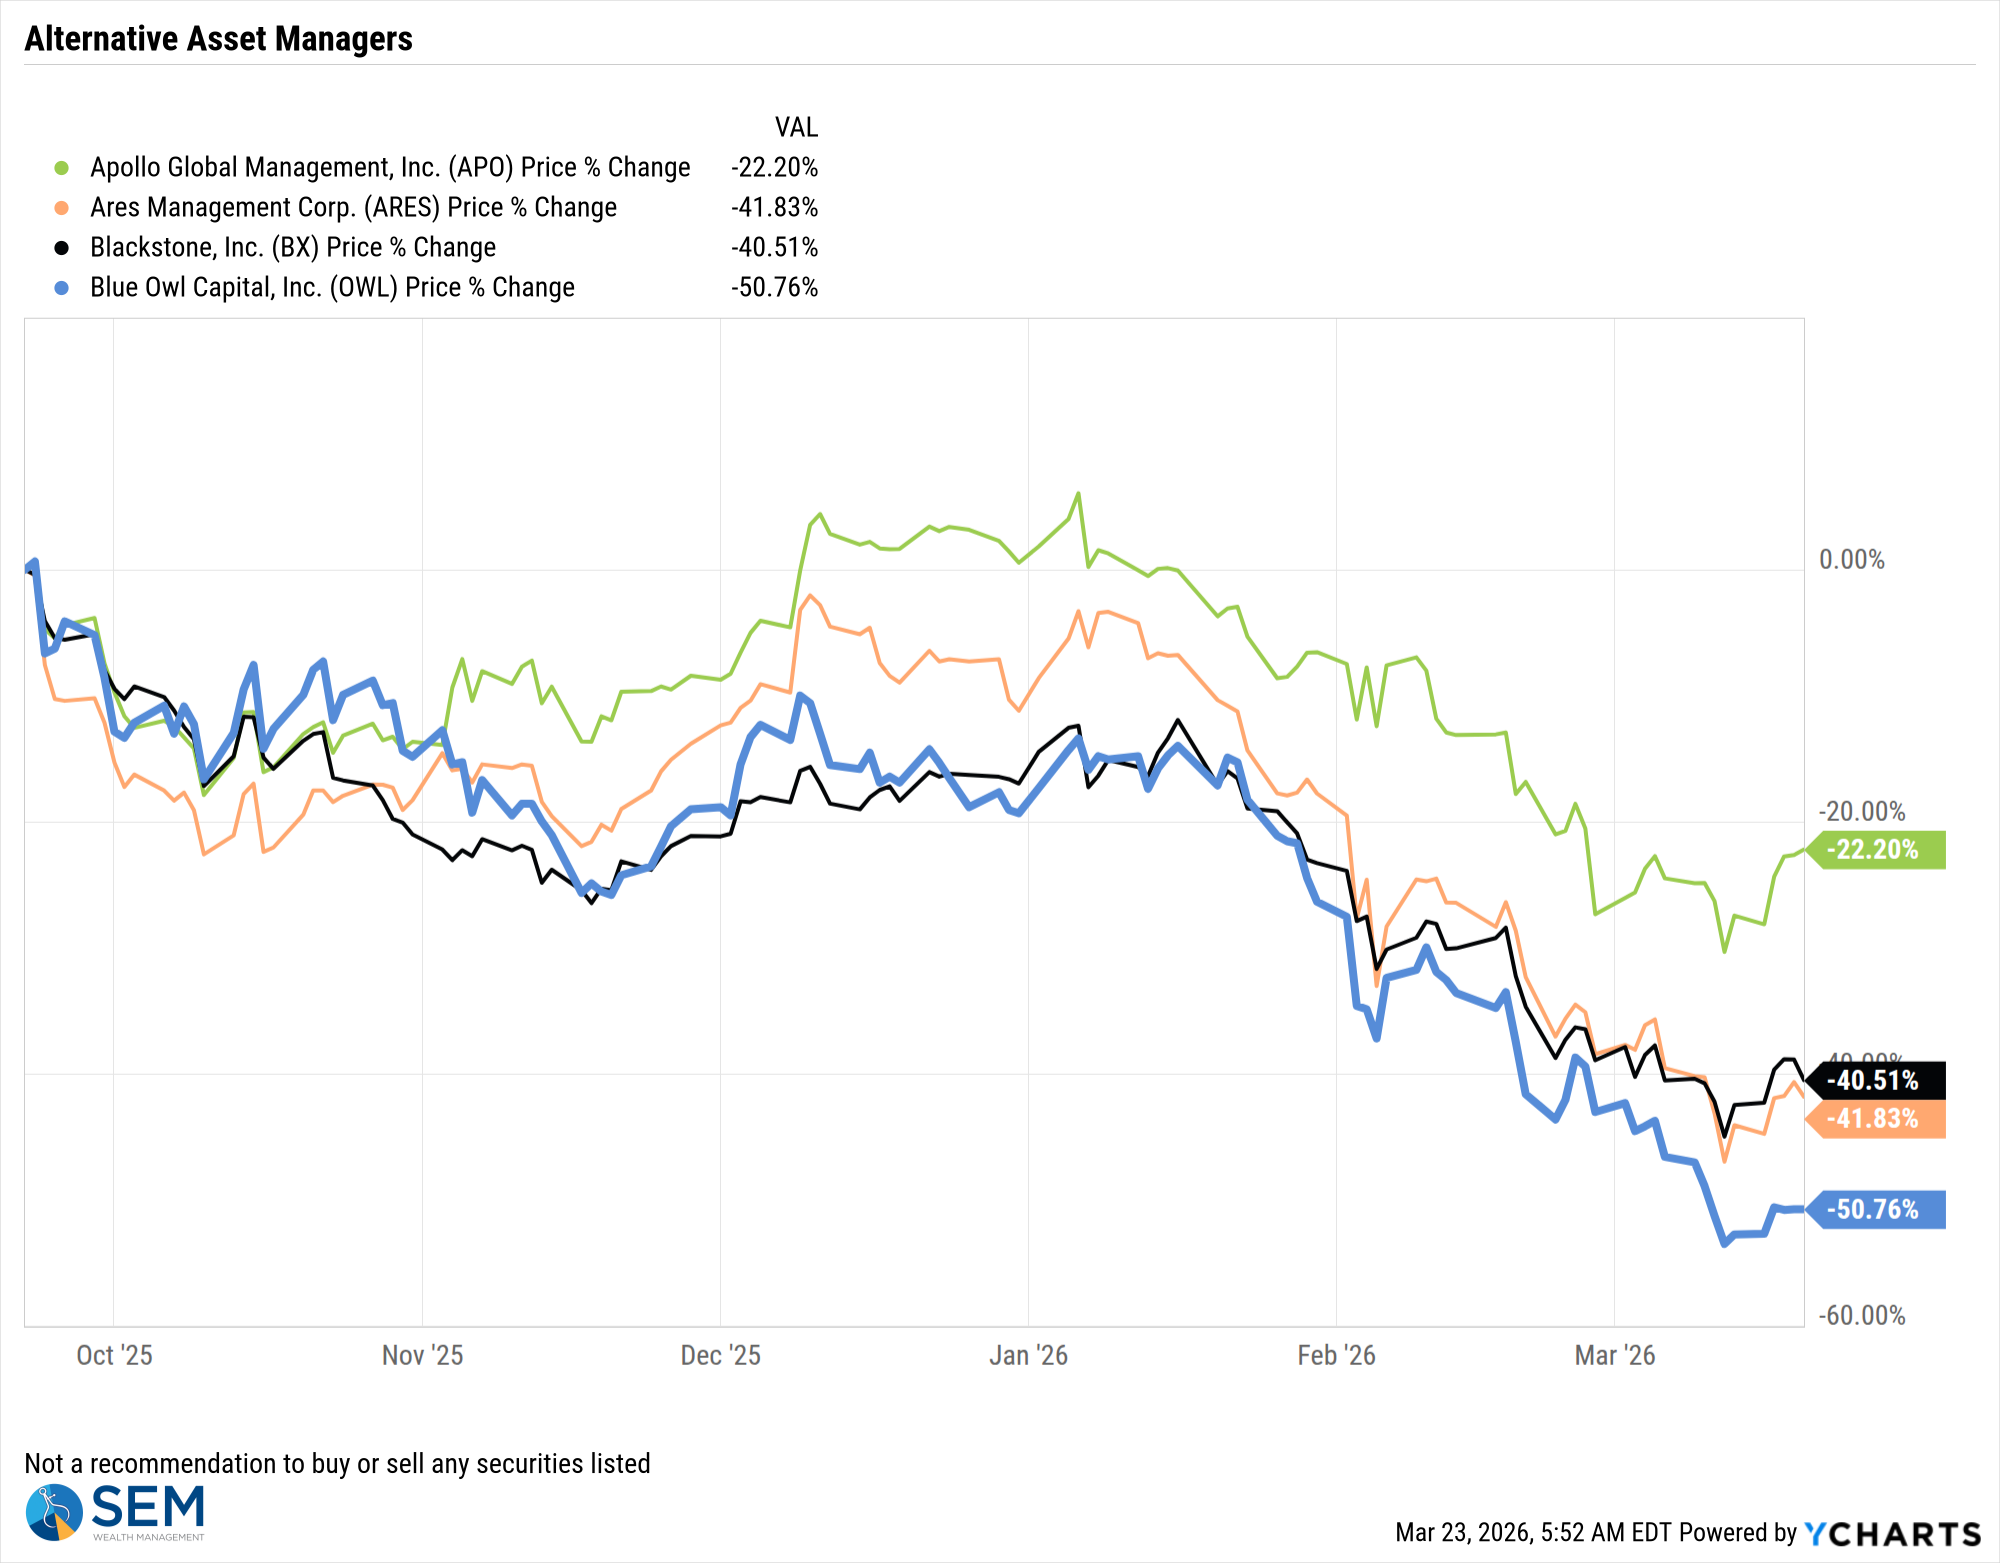
We of course have no index to track private credit. The sales pitch for private investments has been the "low volatility" of the funds and "steady returns". Unlike public securities, private securities are only priced when there is a new pricing transaction. Even then, the private funds are able to override the last transaction if they believe it was below "fair value". The only way we've been able to get somewhat of a feel for the private credit market is by watching the stock prices of the companies most involved in private credit.
Based on the stock prices, it looks like for now, the market believes the worst may be over. My experience tells me this belief can quickly be eroded, so I would tread carefully if you're interested in these types of investments.
The other issue of course is the war in Iran, which has caused a big spike in oil prices.
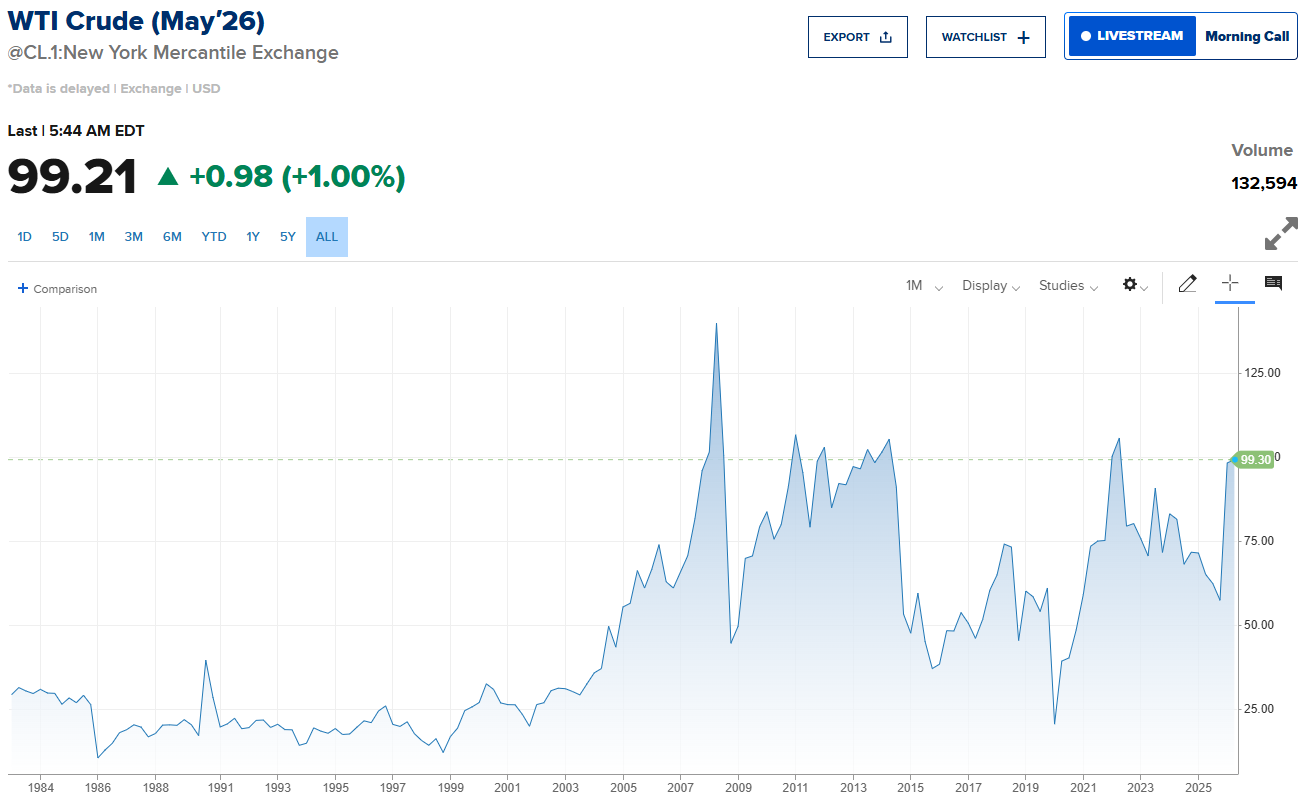
This is starting to cycle through the economy. Utility prices were already high. Gas prices are now at the highest level since fall of 2023. Inflation, which was already shifting higher, will probably move closer (or above) 3% in the coming months. The Fed, which met last week, will be forced to keep rates on hold for the foreseeable future.
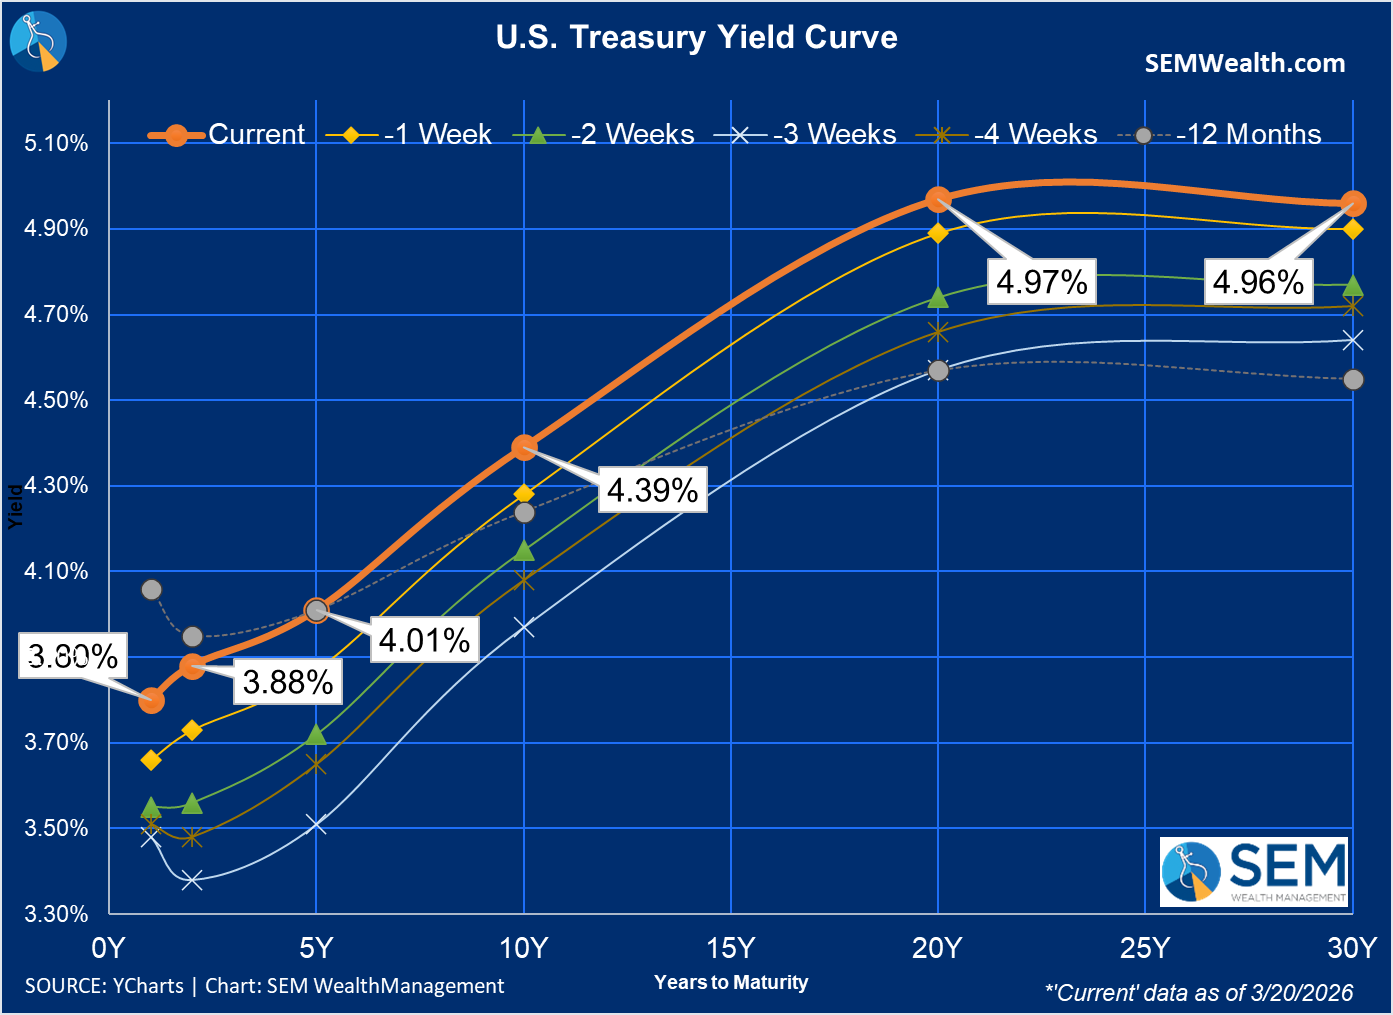
The bond market has clearly not been happy. Yields nearly across the board are all now higher than they were a year ago. Business loans, car loans, and mortgages are all closely tied to the 10-year Treasury Yield, so this will serve as a major headwind to economic growth, especially those on the lower half of our "K-shaped" economy.
The move in the 10-year yield has been sharp.
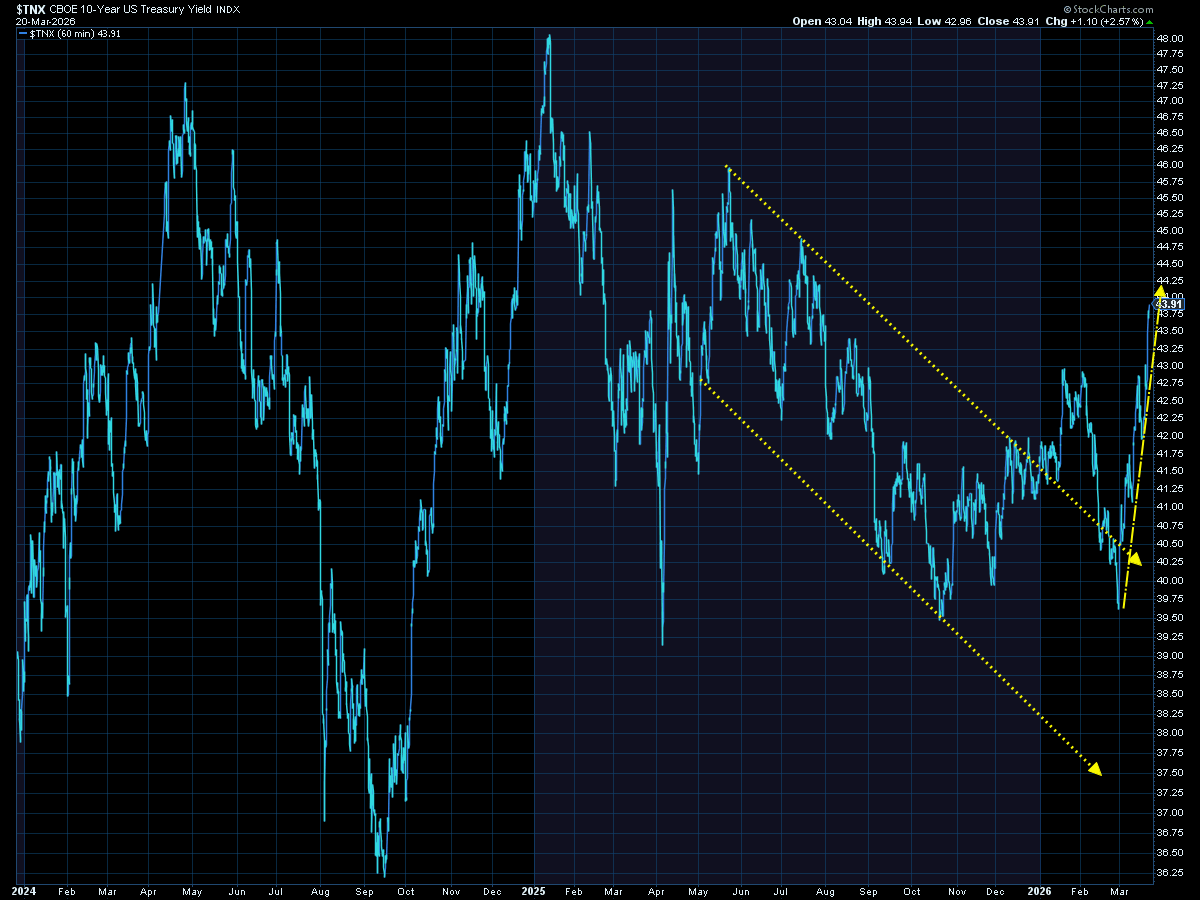
For those shorter-term buckets, the data says caution is warranted as bonds, similar to in 2022, are not providing a "safe haven" in this environment.
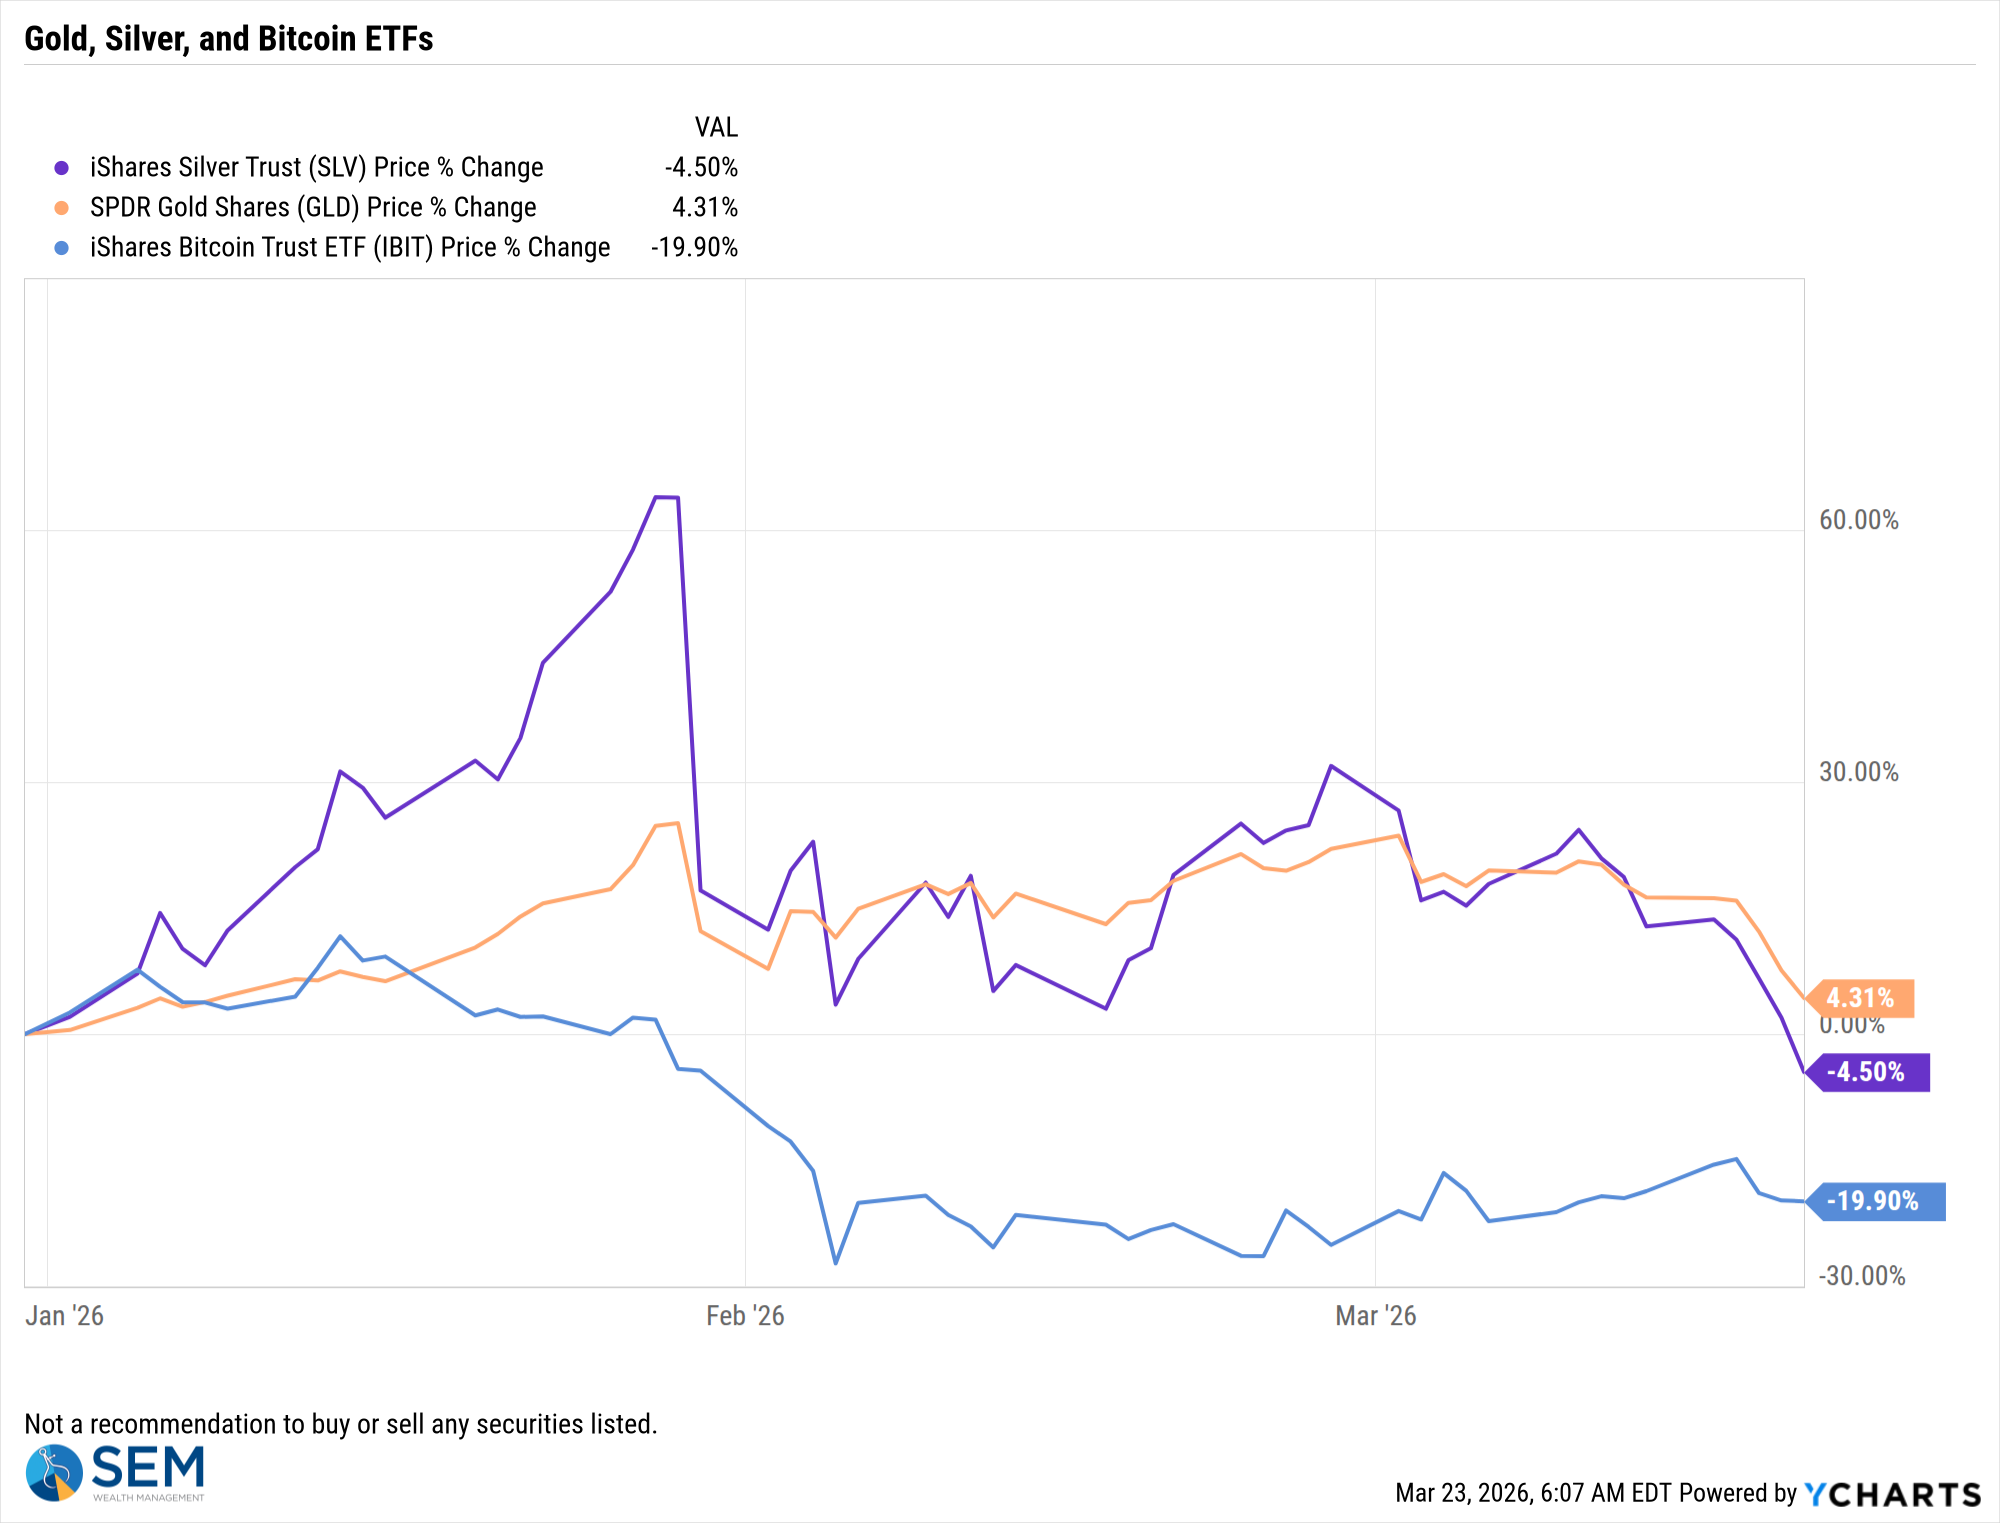
Speaking of "safe havens", the idea of Gold, Silver, and even Bitcoin was supposed to be as a hedge against inflation, a weakening dollar, politics, you name it. That has clearly not been the case recently.
Bitcoin, while down nearly 20% for the year has been holding up better than Gold or Silver since the war in Iran began.
Turning to longer-term investments (stocks) the selling continued last week for the 4th consecutive week.
Once again, stocks attempted to rally early in the week before resuming the slide the last part of the week.
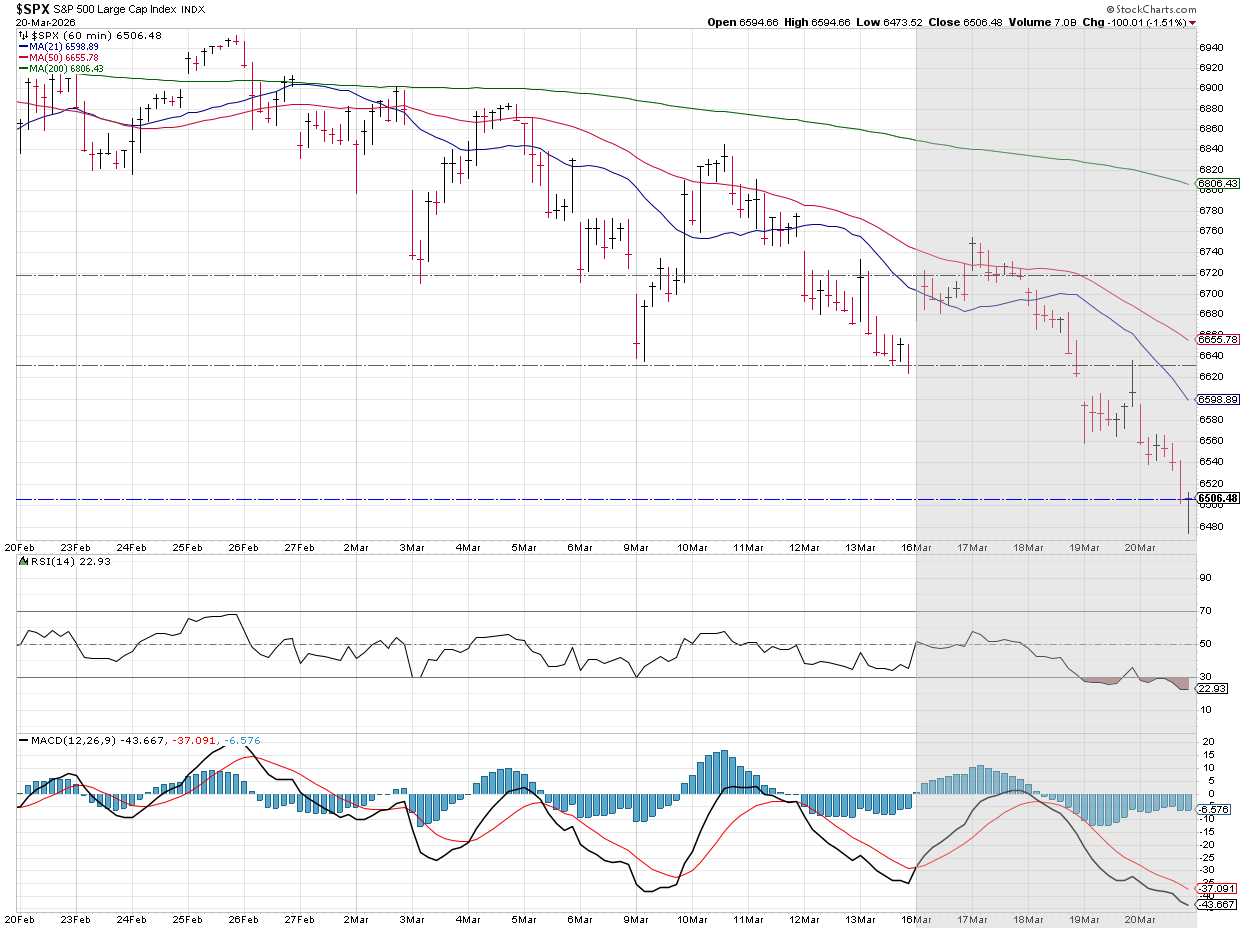
Despite the 7% drop from the record highs, stocks are (for now) holding the level which ended the sell-offs last October and November.
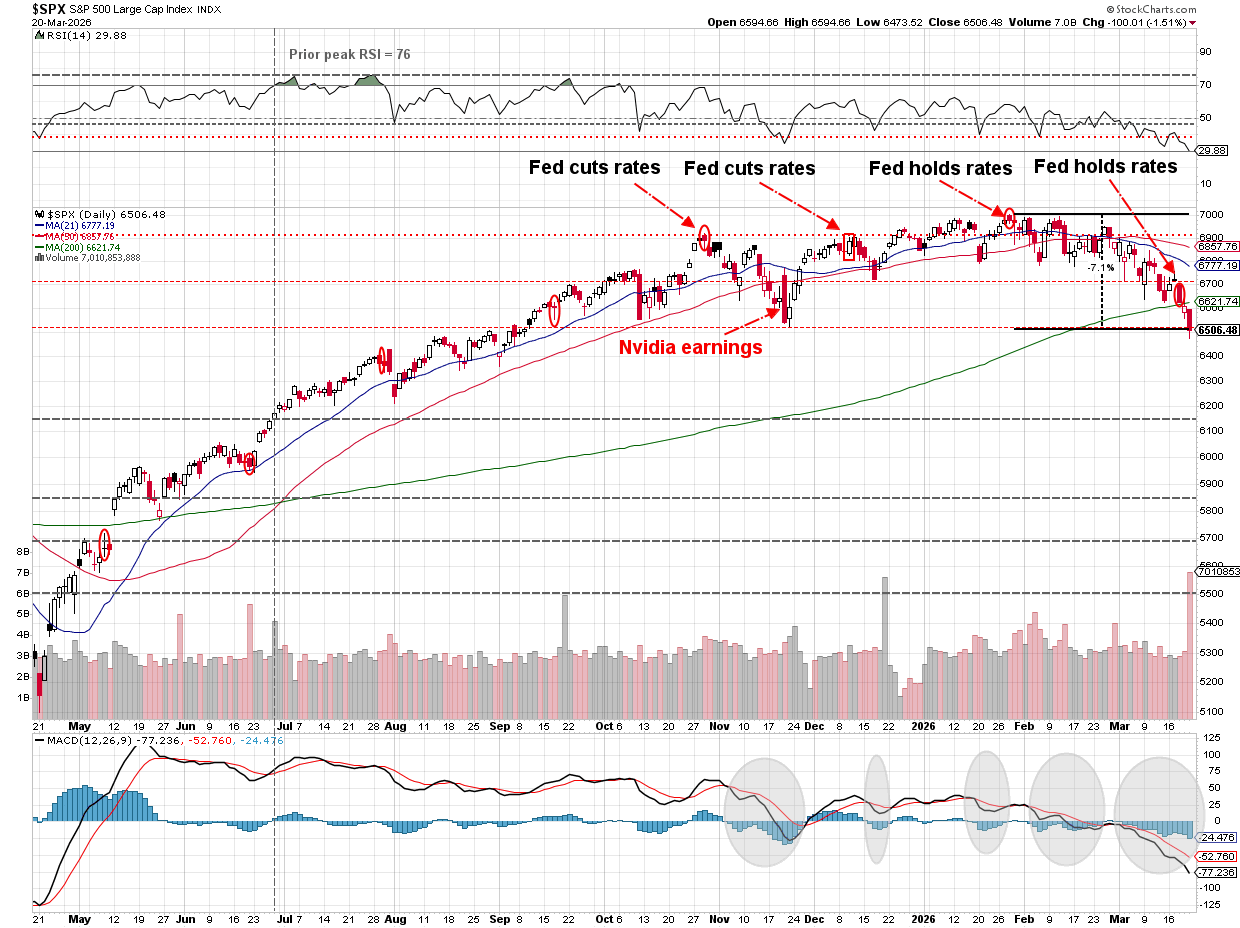
Our more intermediate-term trend models are still on a "buy", but both are approaching levels which could generate a sell signal.
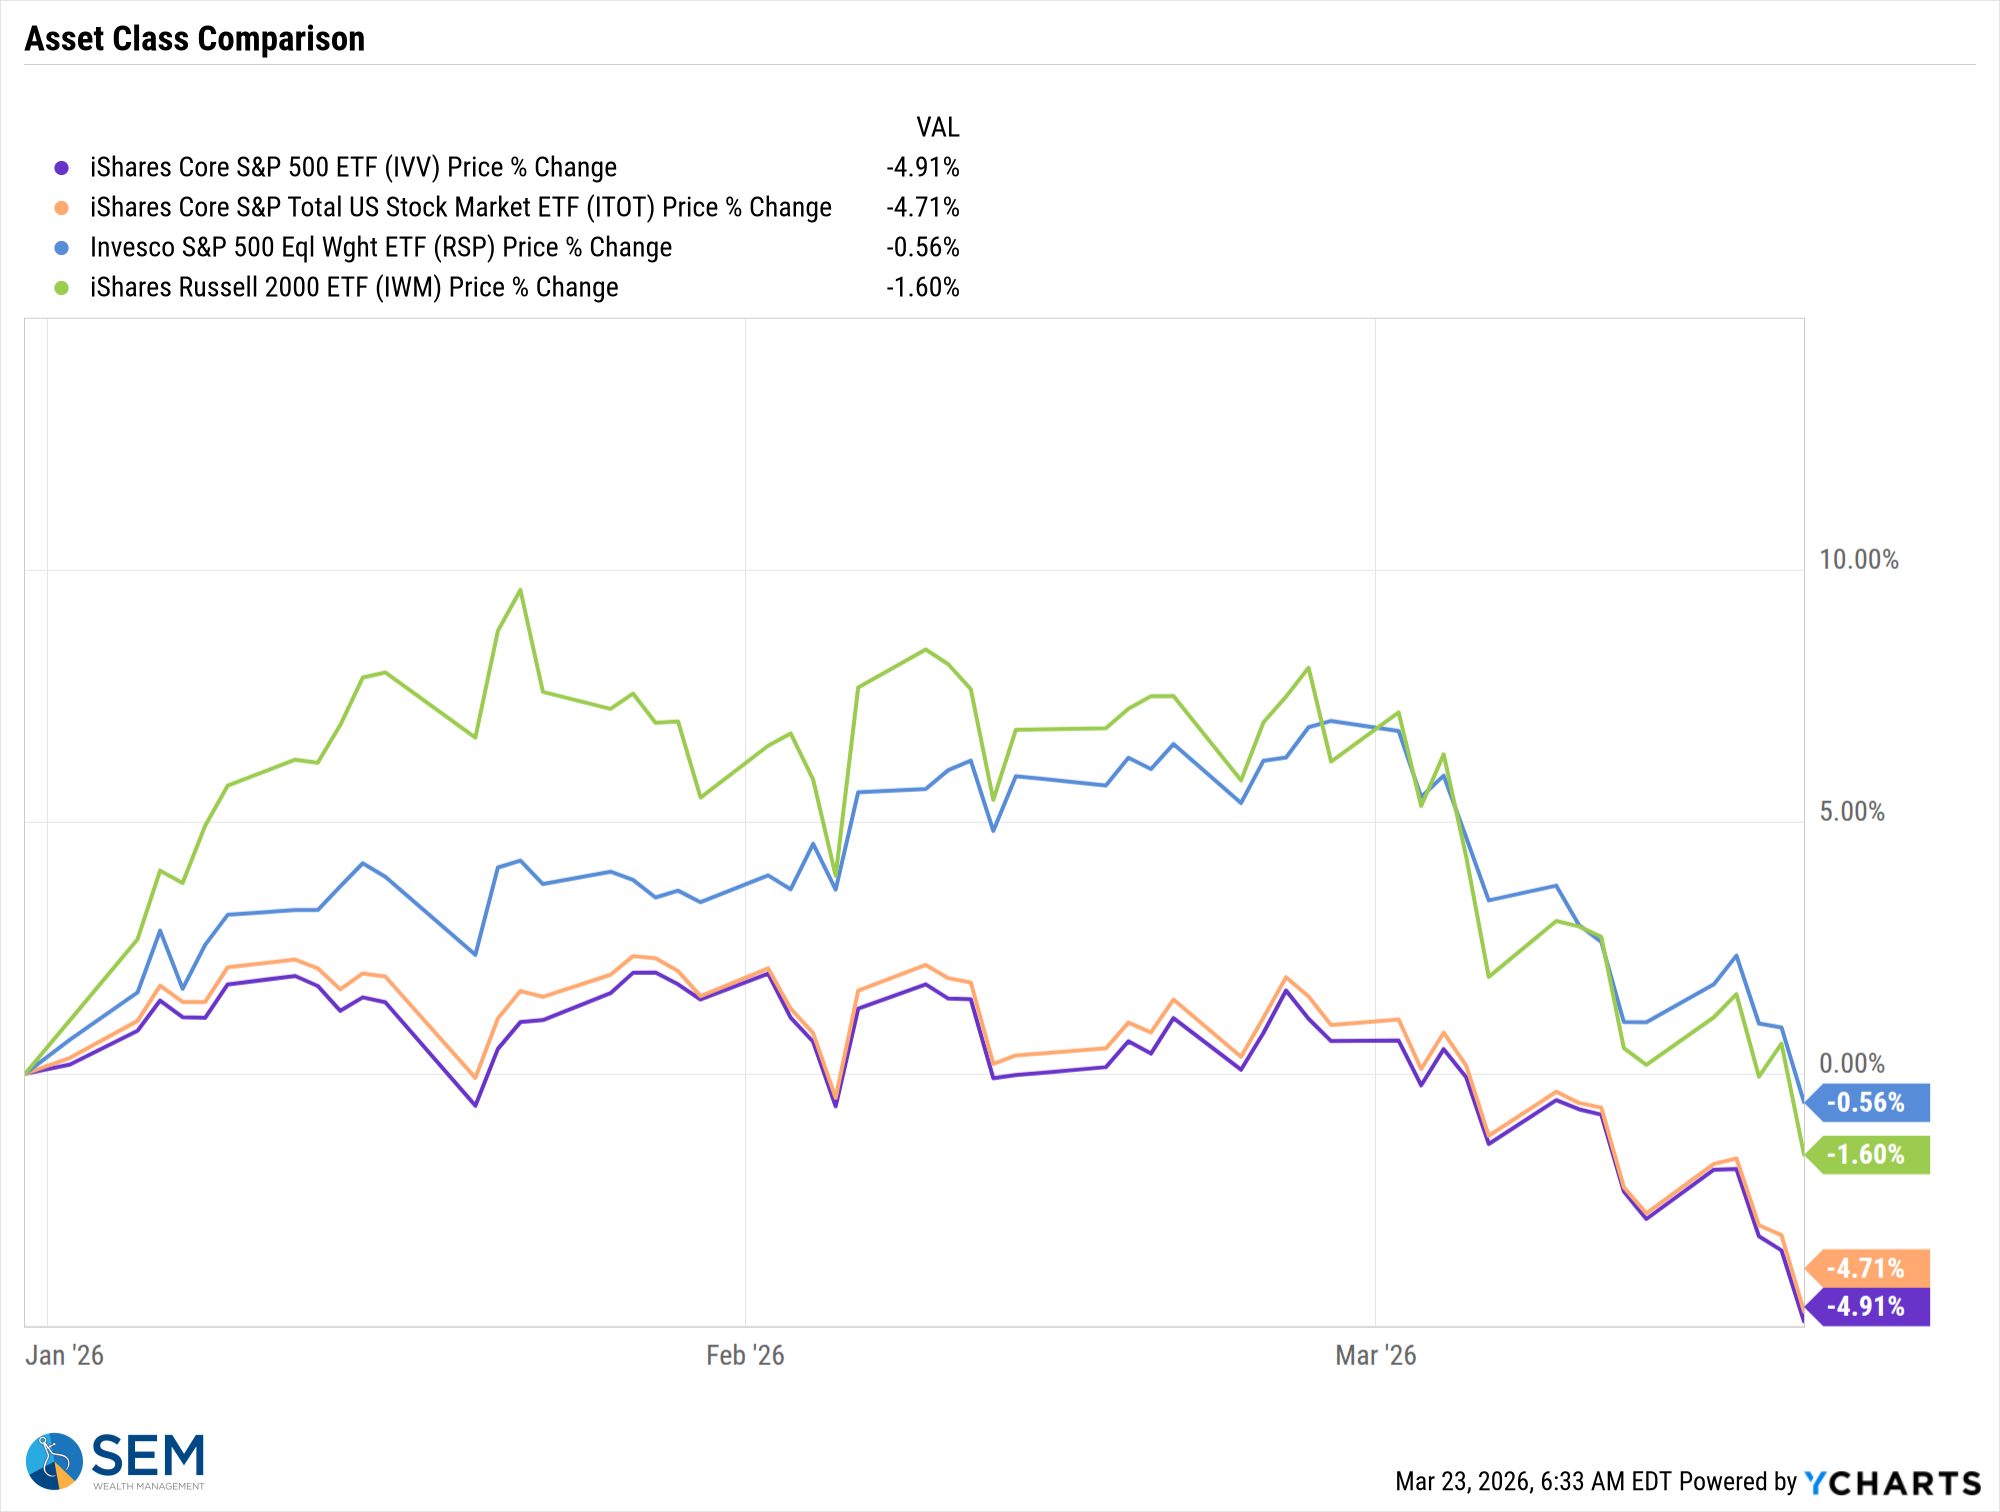
Finally, the "broadening" we've been excited about since the fall of last year is faltering a bit. This makes sense if the concern is the war in Iran will hit the economy with the big increase in both interest rates and energy prices. Small caps are still outperforming, but are now negative for the year.
Here's the key takeaway from SEM's models
- Our lower risk (shorter-term buckets) have shifted to DEFENSE
- Our moderate risk (middle-term buckets) are NEUTRAL
- Our higher risk (long-term buckets) are still on OFFENSE, but close to adding a bit of defense
As always, we will let the data, not our opinions or the headlines determine our next adjustment.


