
The S&P 500 hit 6900 after the Fed cut rates in late October. Since that time the stock market has been stuck in what feels like a prolonged holding pattern. Since late November the S&P has been oscillating between 6700 and 7000 with plenty of headlines but very little net progress. Beneath the surface, however, the crosscurrents couldn’t be stronger—geopolitical shocks, a shifting narrative around AI, and stubborn inflation pressures are all pulling investors in different directions. For now, none have been powerful enough to force a decisive breakout or breakdown, leaving markets frozen in place as investors wait for some clarity. This week we'll briefly look at what is driving the latest tension, what actually matters, and where investors should be focusing while the market treads water.
Attack on Iran
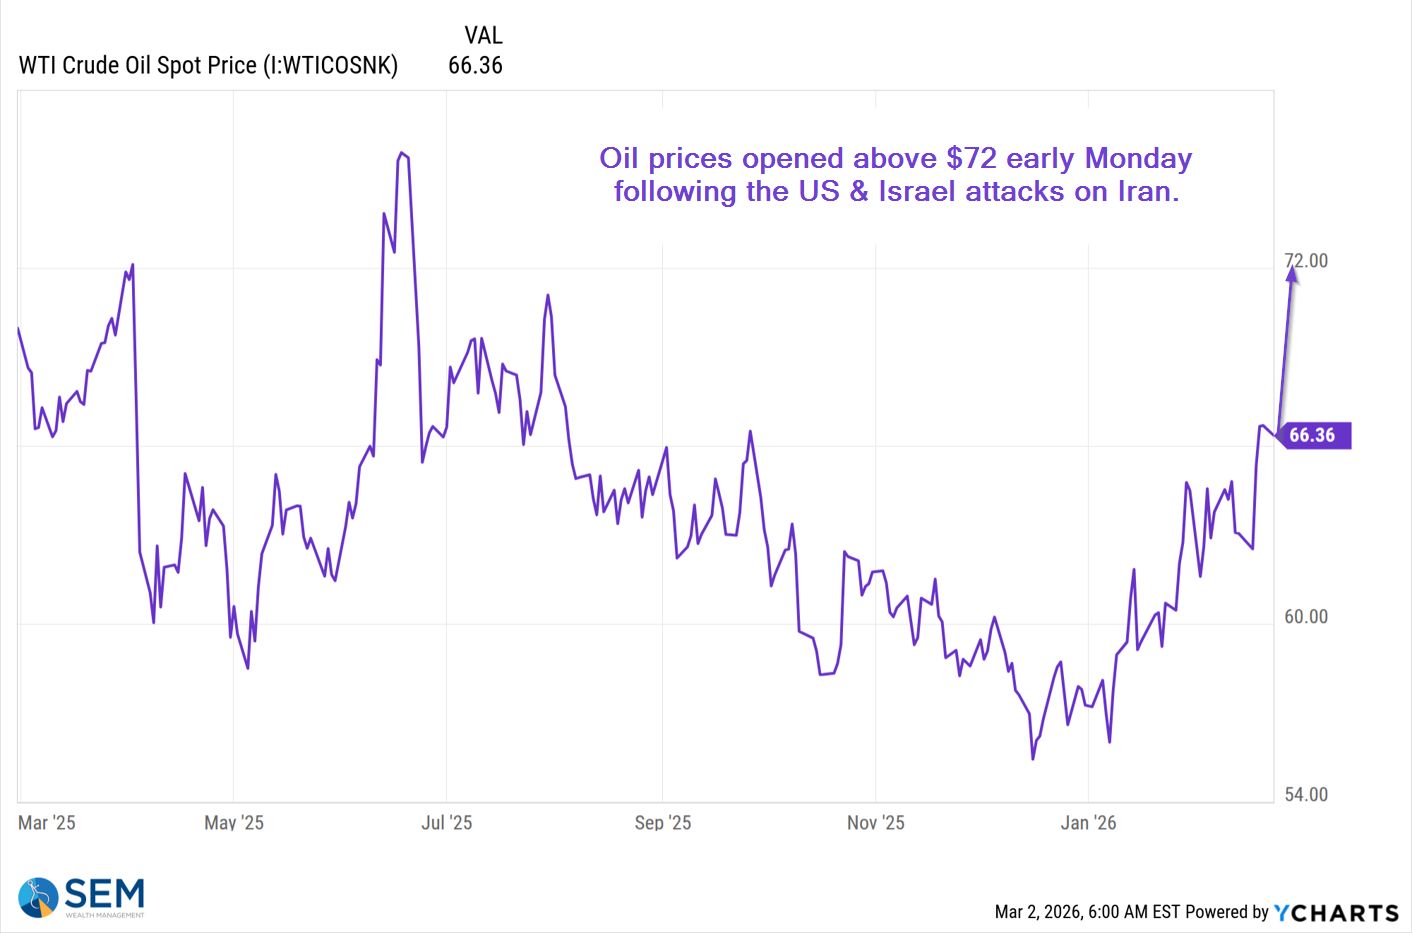
After several months of build-up the US and Israel launched a major attack on Iran, wiping out most of their leadership structure in a single weekend. At this point, trying to speculate about how long this may last and any unforeseen circumstances which may develop is not worth our time. History tells us, unless this turns into World War 3 or there is a major disruption in the energy markets, the market will not pay much attention.
What it may impact though is SEM's Patriot Portfolio. It has been on a tear since the US attacked Iran last summer and has had a phenomenal year so far as the Trump Administration has vowed to increase the $1 Trillion 2026 Defense budget to $1.5 Trillion in 2027. There is no fundamental or technical analysis of this portfolio. It is simply composed of the top 10 US Defense Contractors, rebalanced each summer after the new contract data comes out.
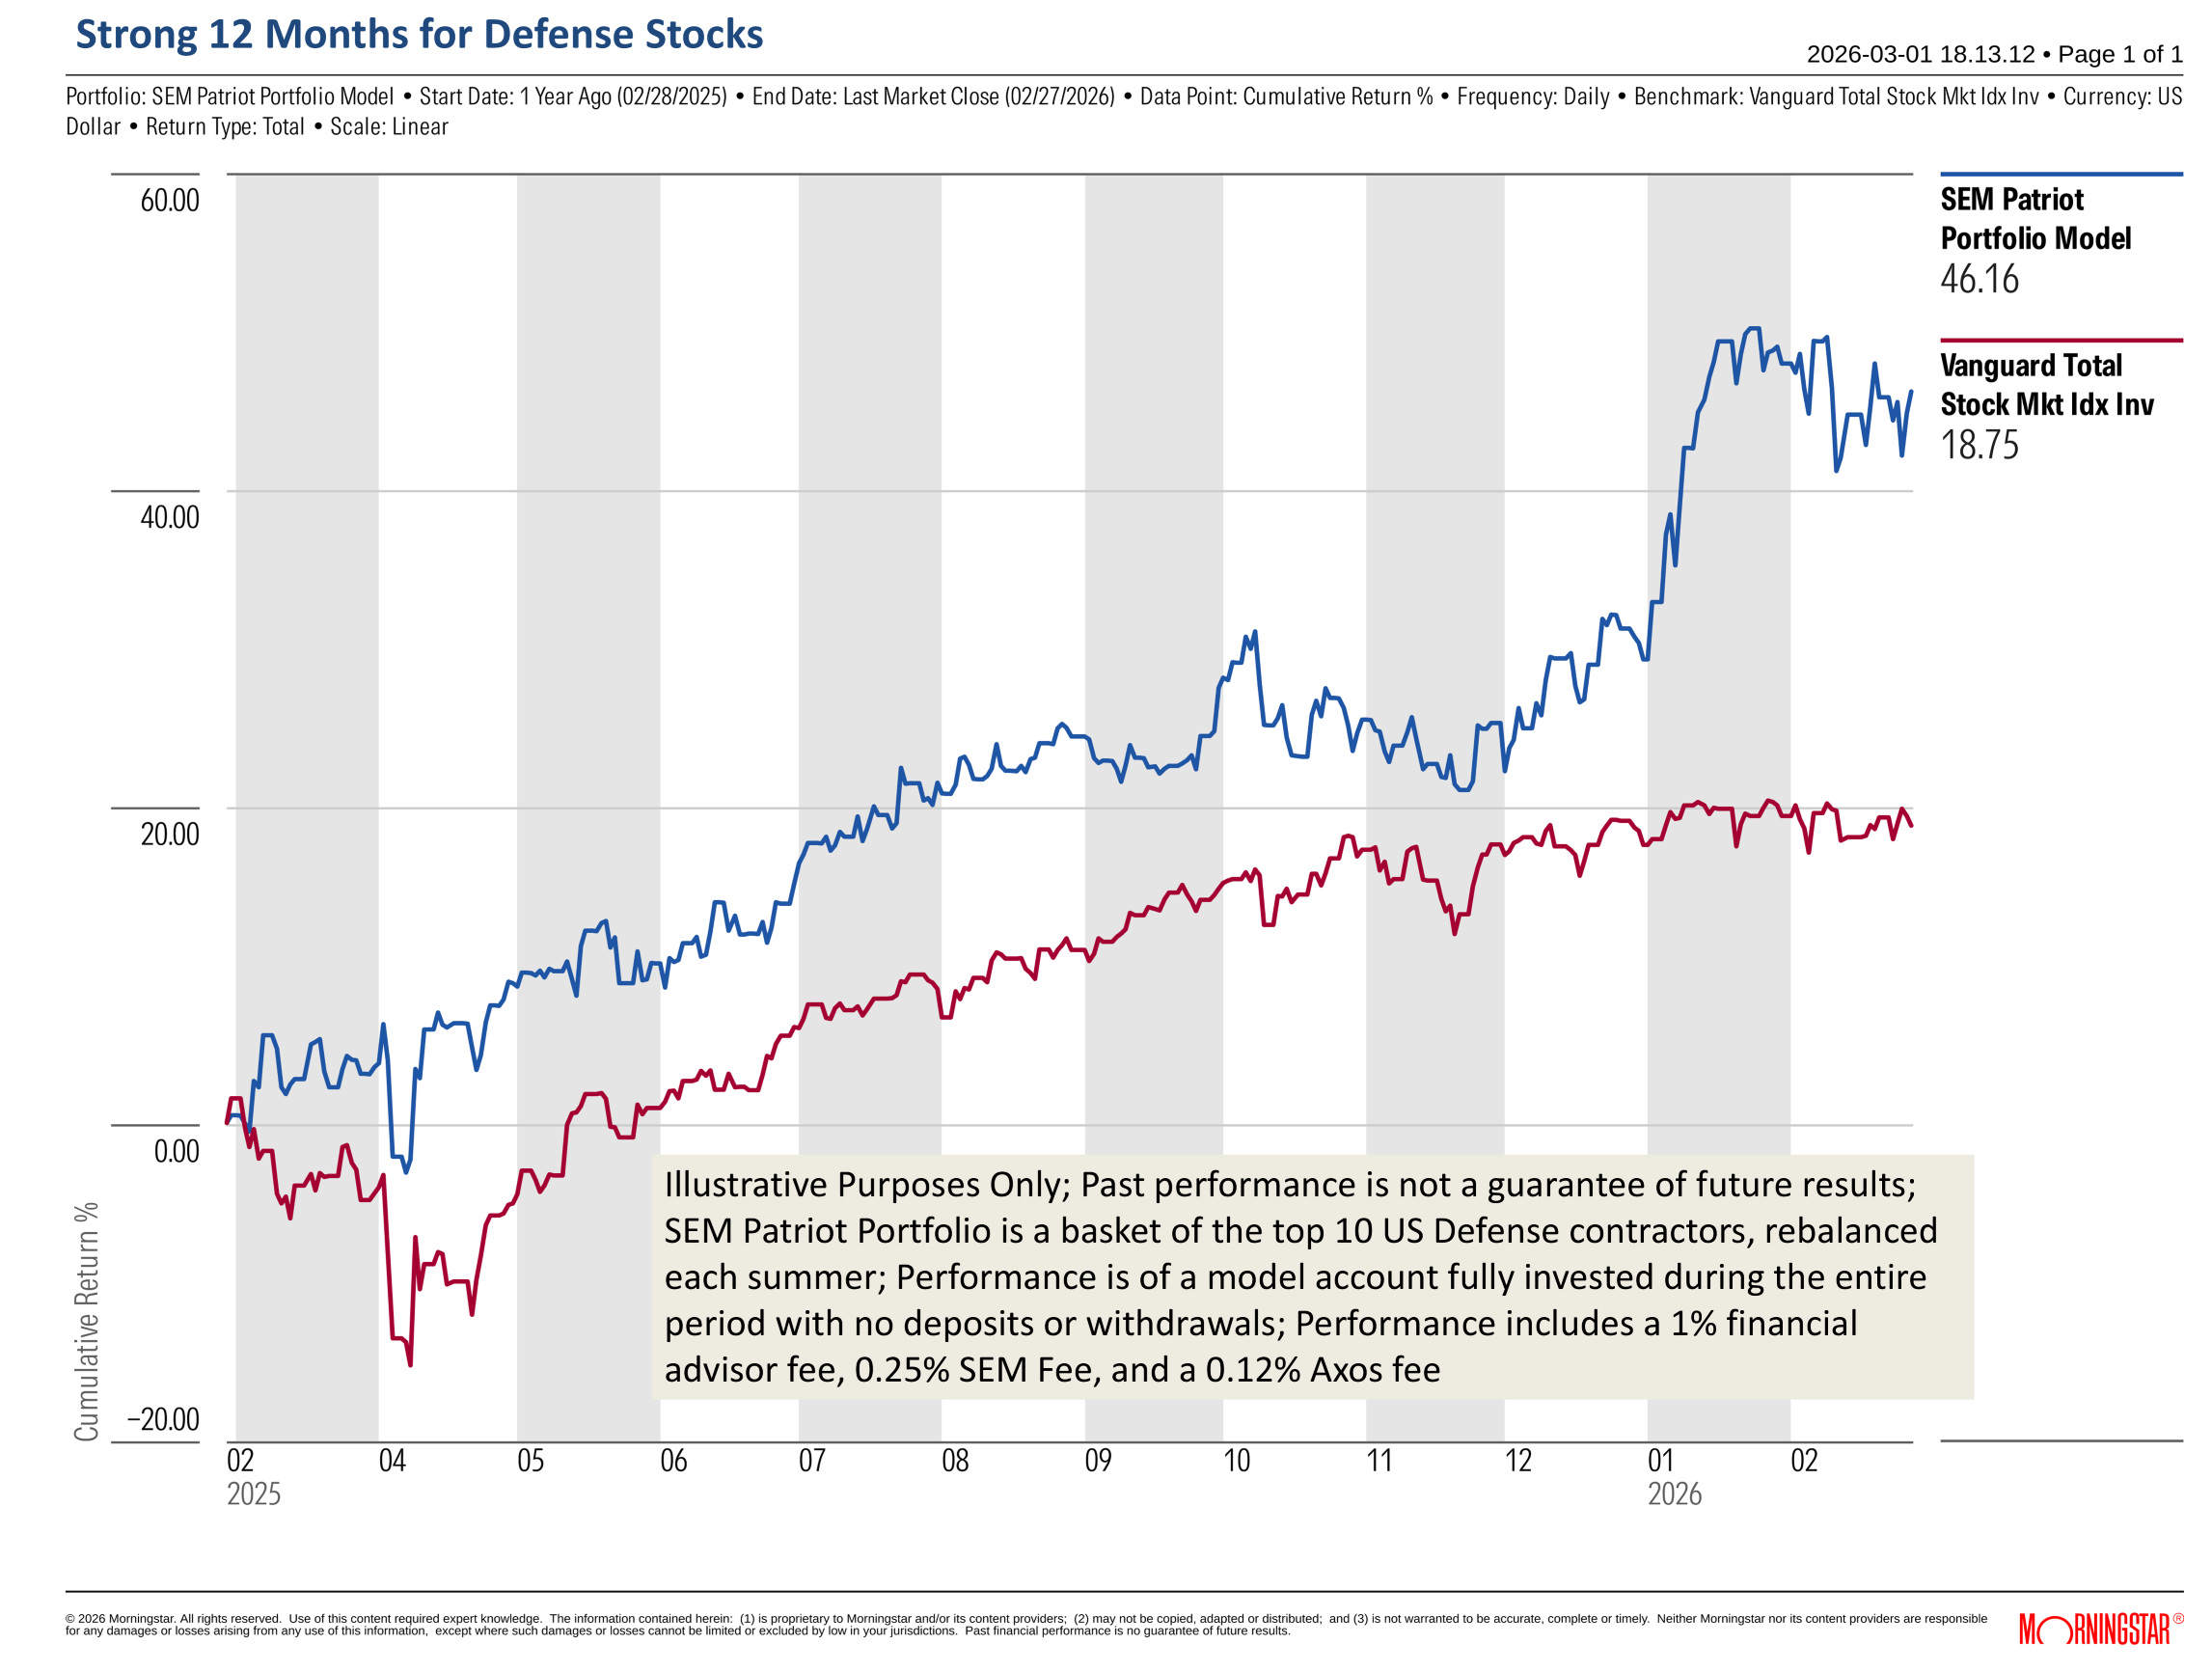
This of course is not without risks as we've seen with some of the stocks in our portfolio. We've also seen how the Trump administration can quickly pull a government contract if a company has a policy the Administration disagrees with, as witnessed by the dispute with Anthropic over AI policies. Add to that the uncertainty of the midterms which could threaten the planned defense spending along with our looming national debt crisis as Social Security and Medicare race towards a 2032-2034 insolvency date (our top 4 spending categories are Social Security, Medicare, Defense, and Interest Expense on our debt).
AI Rollercoaster
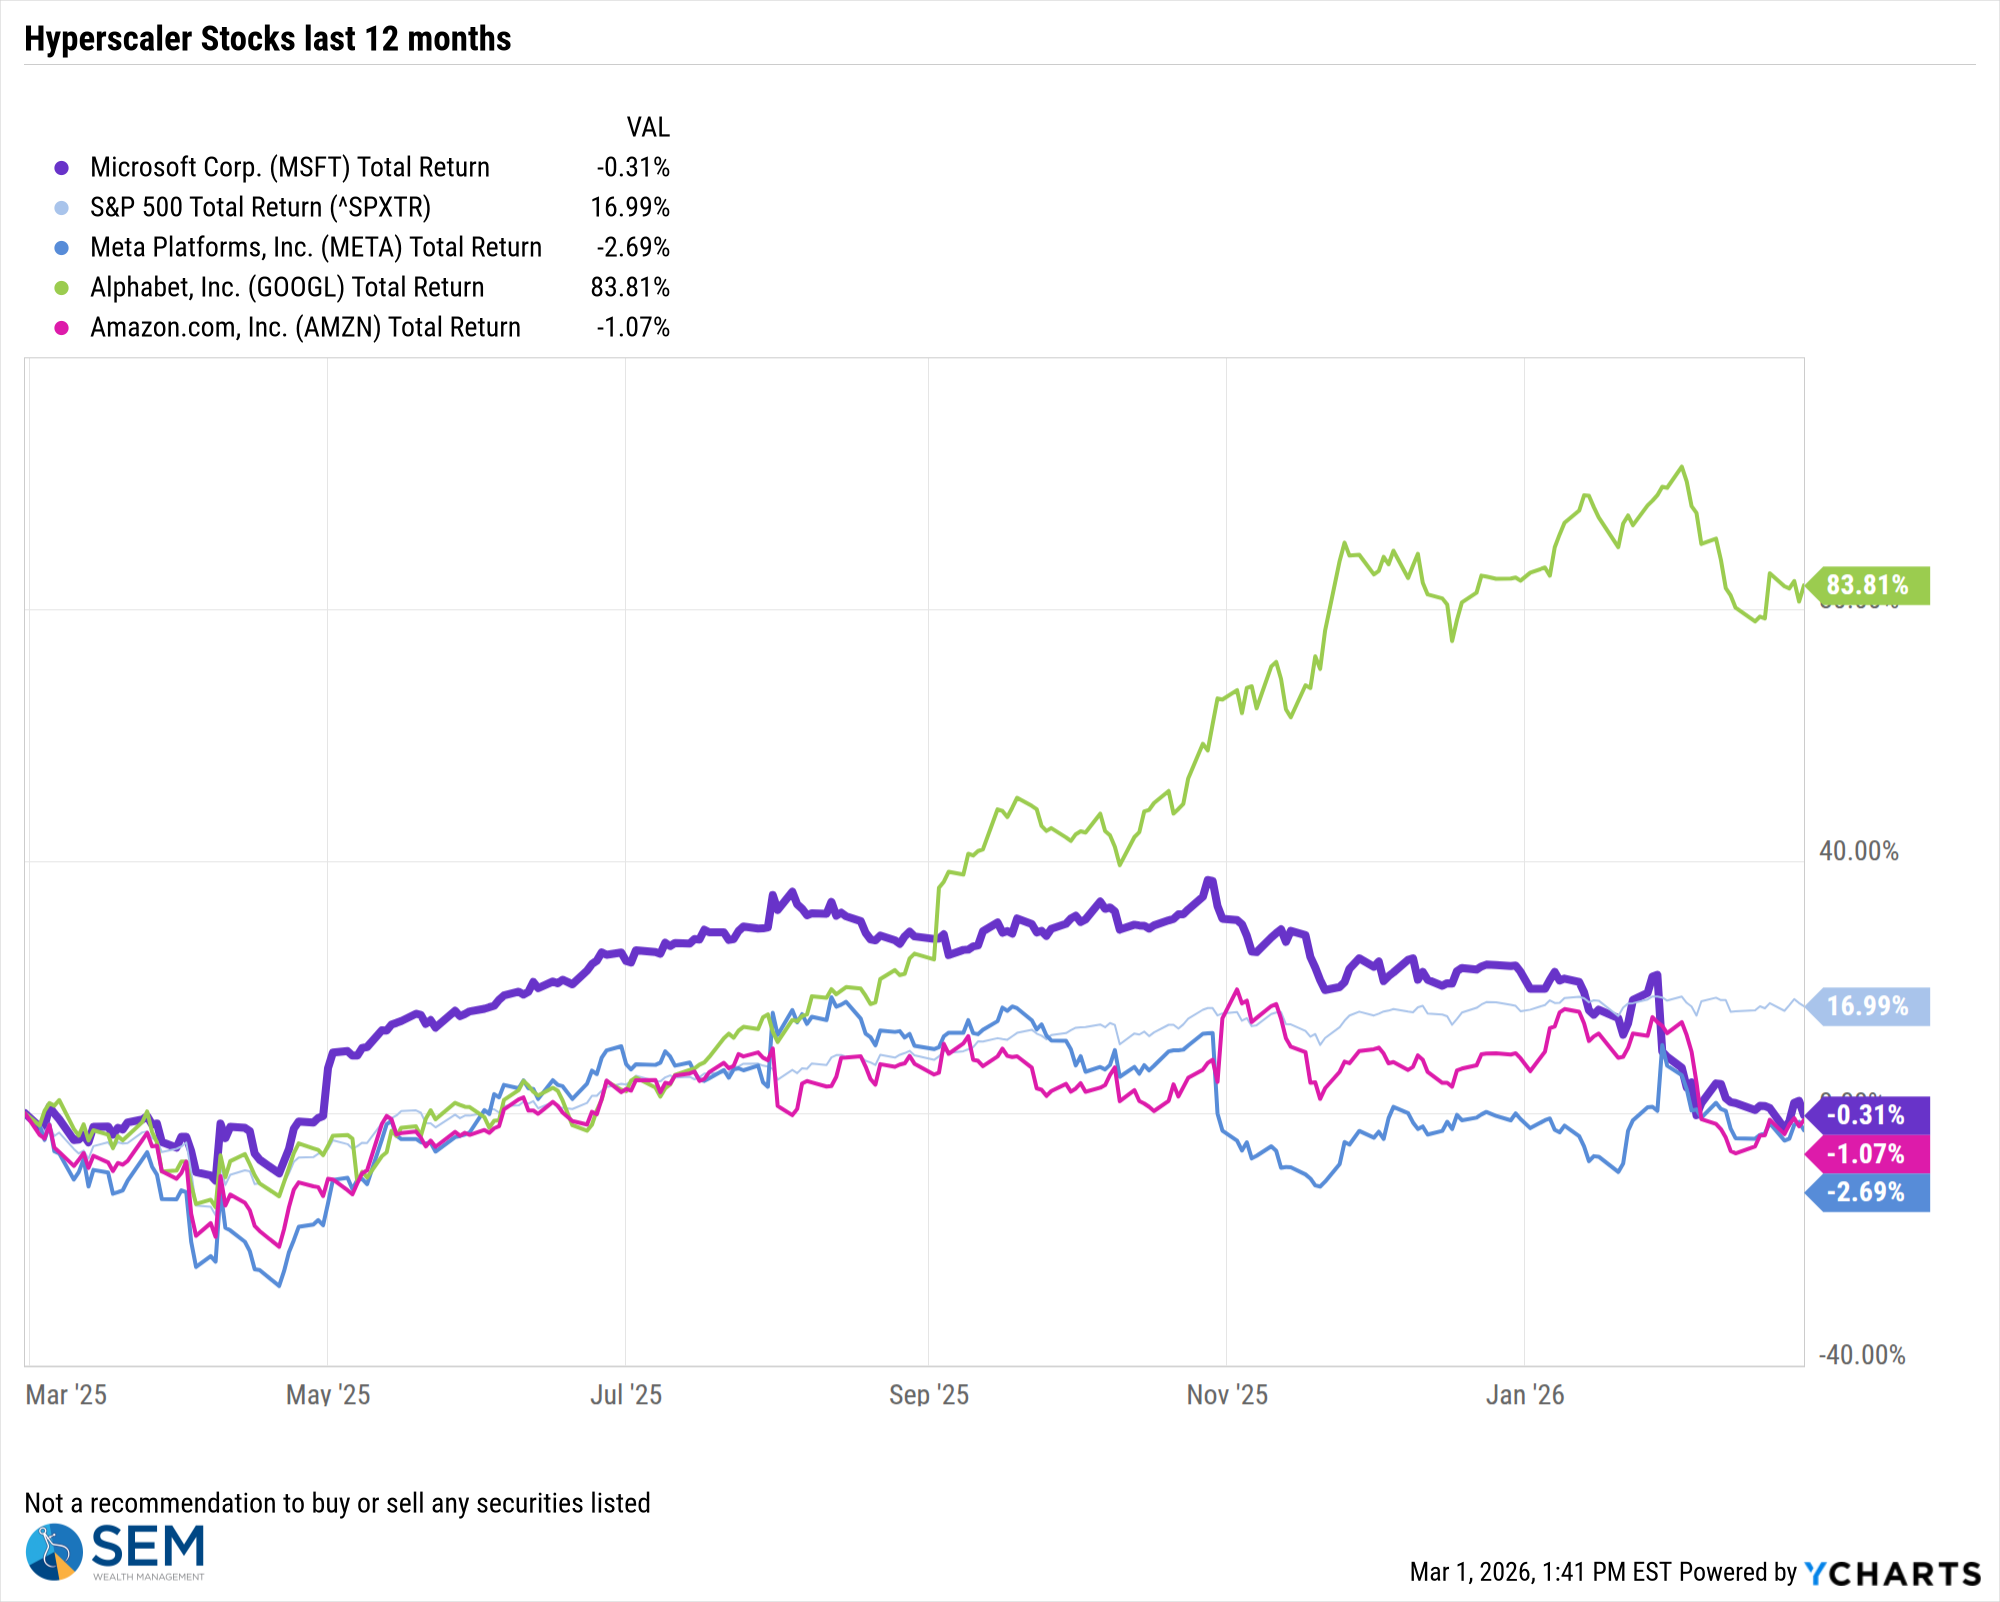
Since Chat GPT was launched in late 2023, the companies spending money on "AI" were rewarded. The thought was the "investment" would pay off with significant revenue increases and decreased costs. The companies spending the most, the so-called "hyperscalers" saw the biggest gains. This led to the top 10 stocks representing more than 40% of the S&P 500 index. Despite strong revenue growth in those segments, investors lately have been questioning the "investment" as free cash flow levels continue to fall and circular and creative financing deals are called into question.
Other than Alphabet (Google), which has not only been developing its own chips AND has its own AI models along with its data centers, it has been a struggle for these companies the last 12 months.
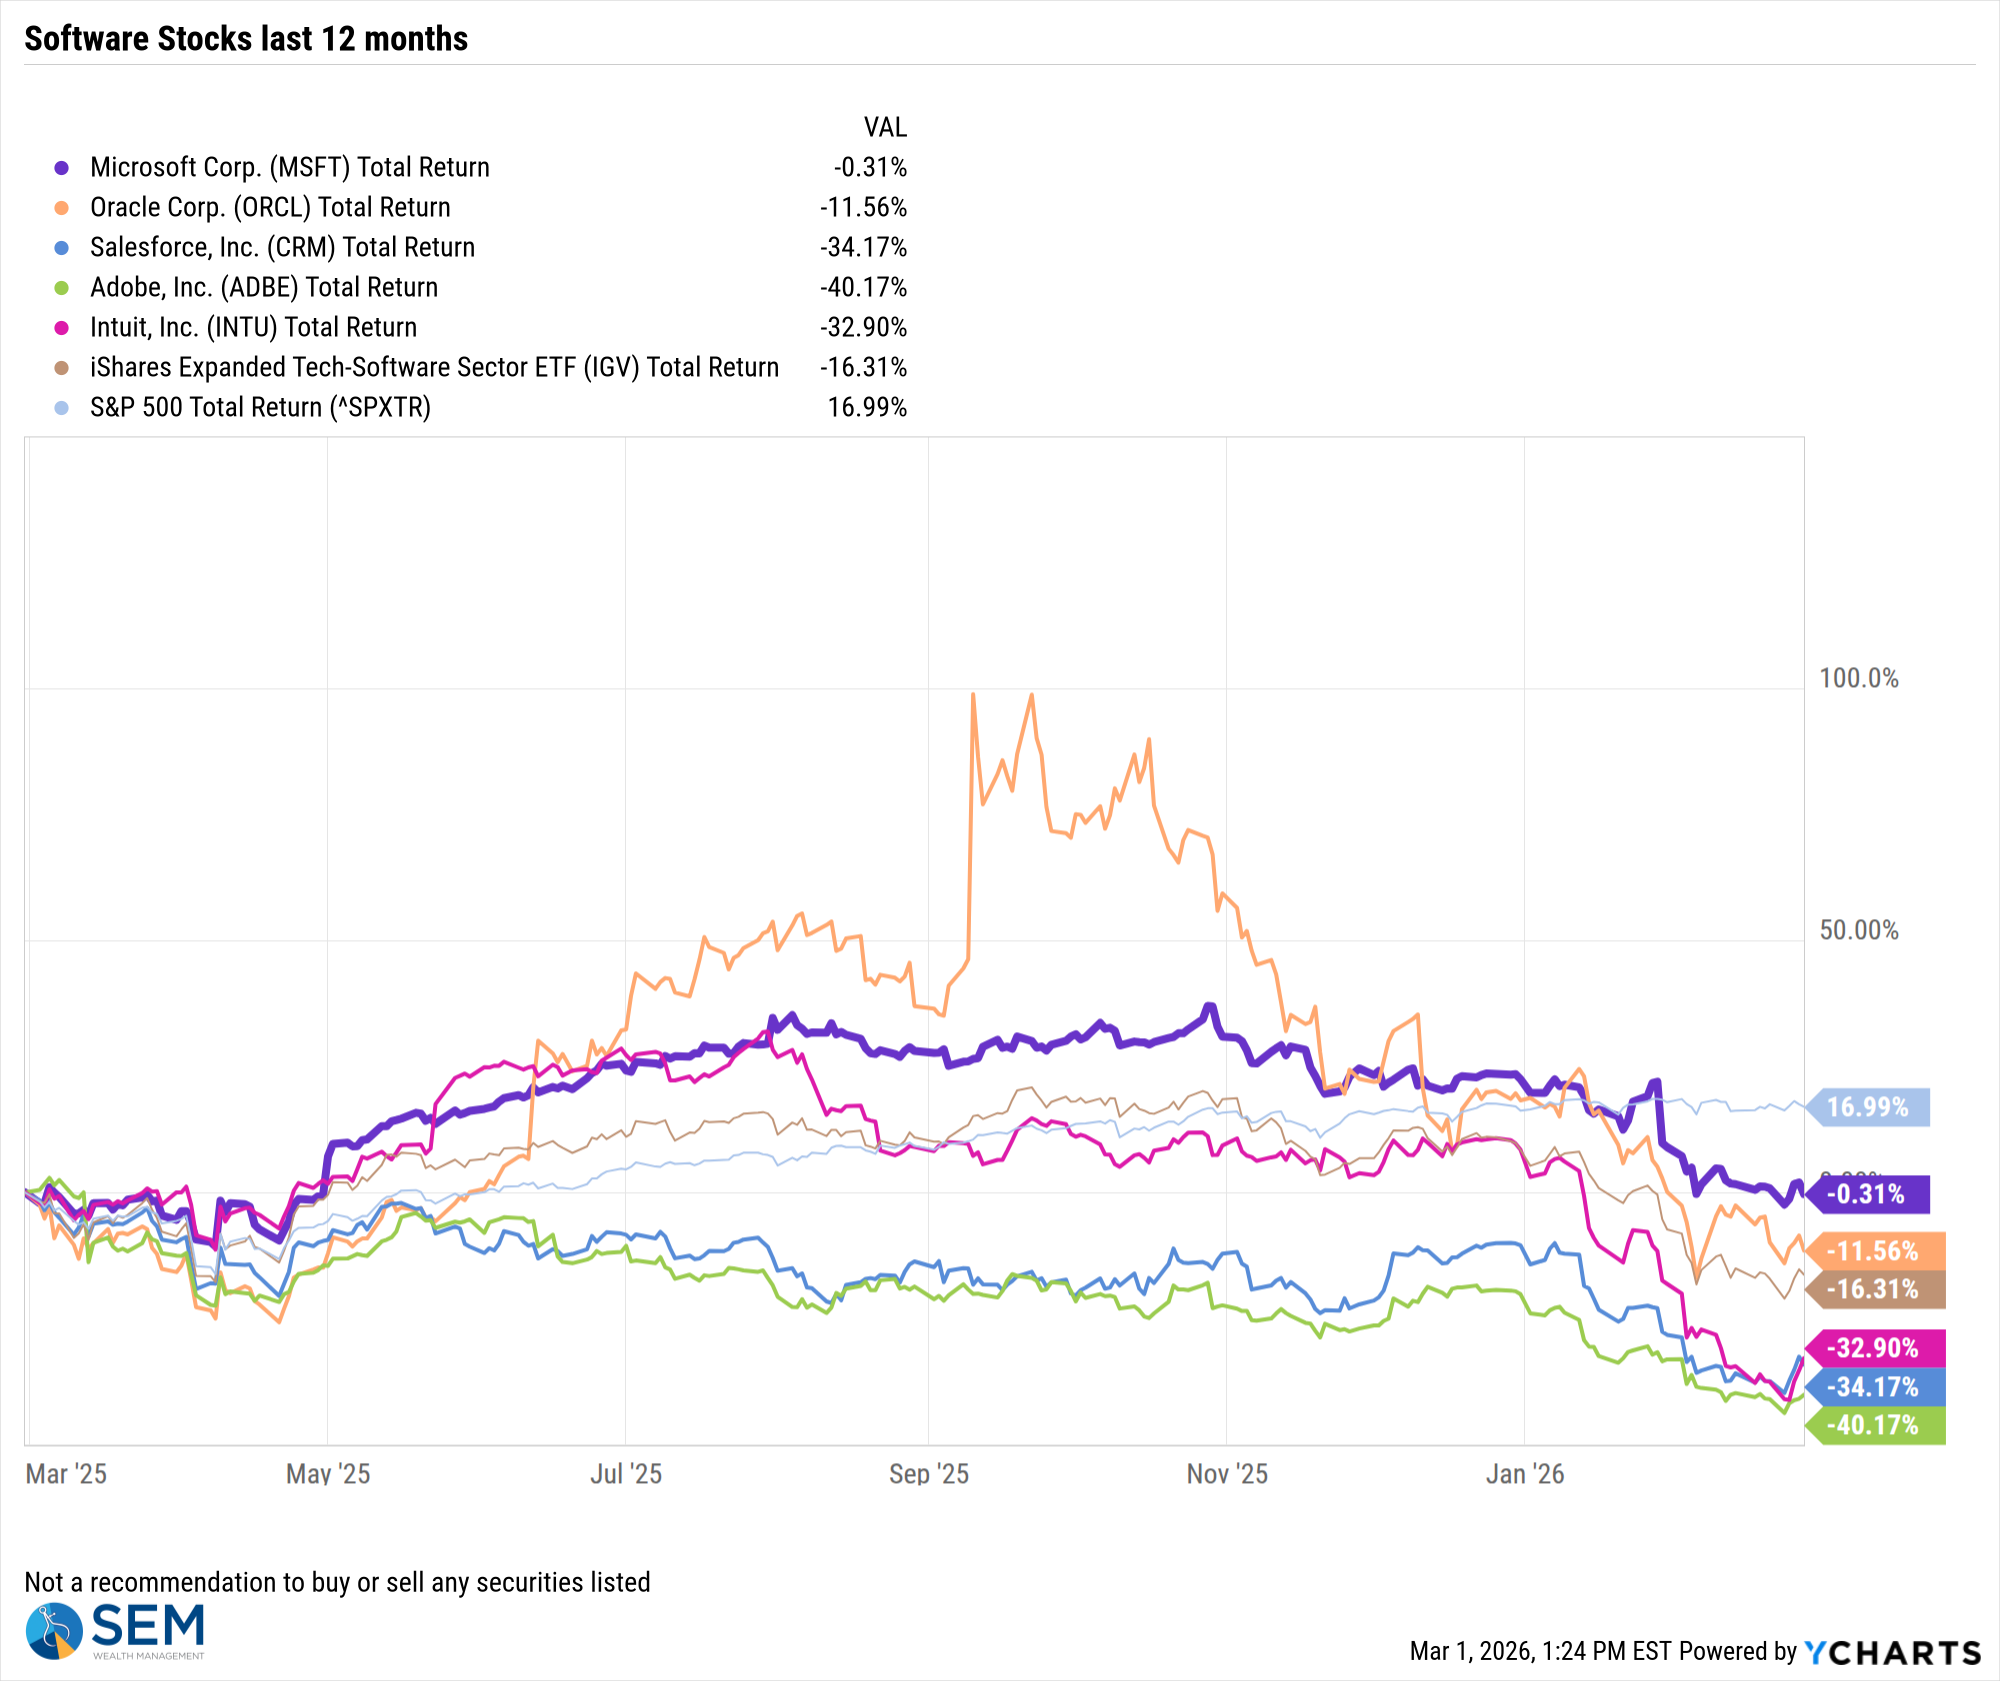
The tables have turned on the "AI" washing as investors stopped rewarding companies for adding AI tools and instead started questioning
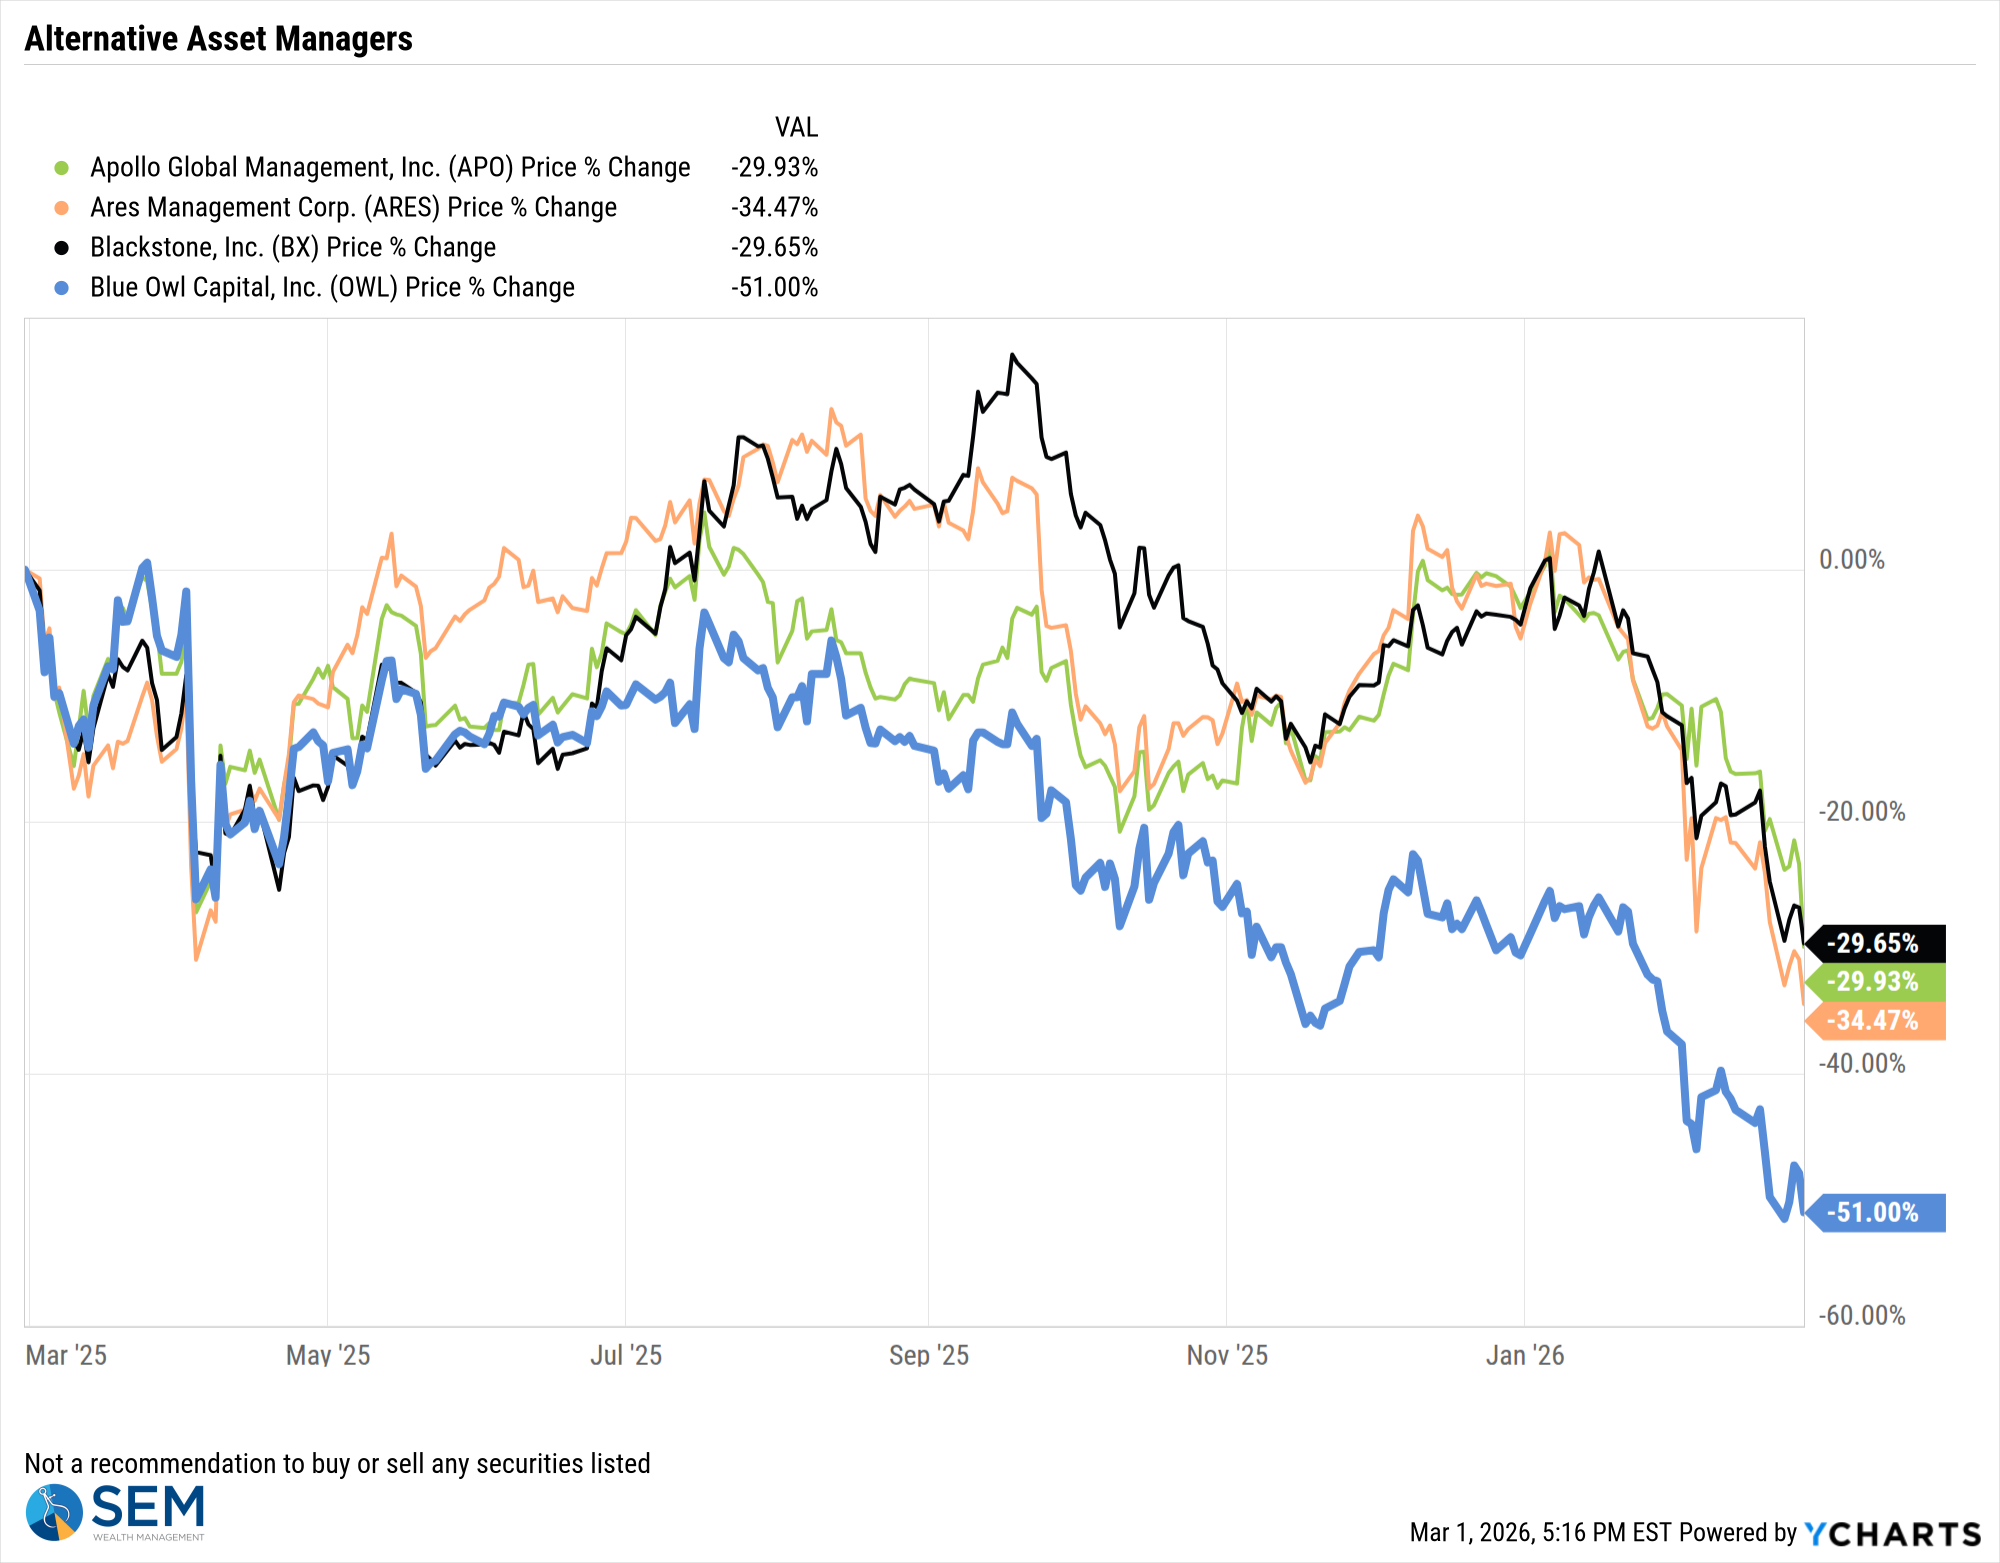
One final thing I think you should keep on your radar is the "private credit" market. As I've been discussing on and off since our "Boom, Bubble or Both" fall newsletter last year, one thing that could bring down the bubble side of the AI "boom" is problems financing the buildout. While we don't have data on the "private" assets being used, several of the private credit providers are publicly traded. Watching their stocks could be a way to track the health of the financing side of the bubble.
It's been a brutal 12 months for these companies.
Inflation Pressure & Tariffs
For the 2nd Friday in a row, investors were reminded inflation is not yet dead. Two Friday's ago it was a higher than expected PCE Price Index (the Fed's preferred measure which was higher for the 3rd straight month). Last Friday it was the Producer Price Index, which was much higher than expected.
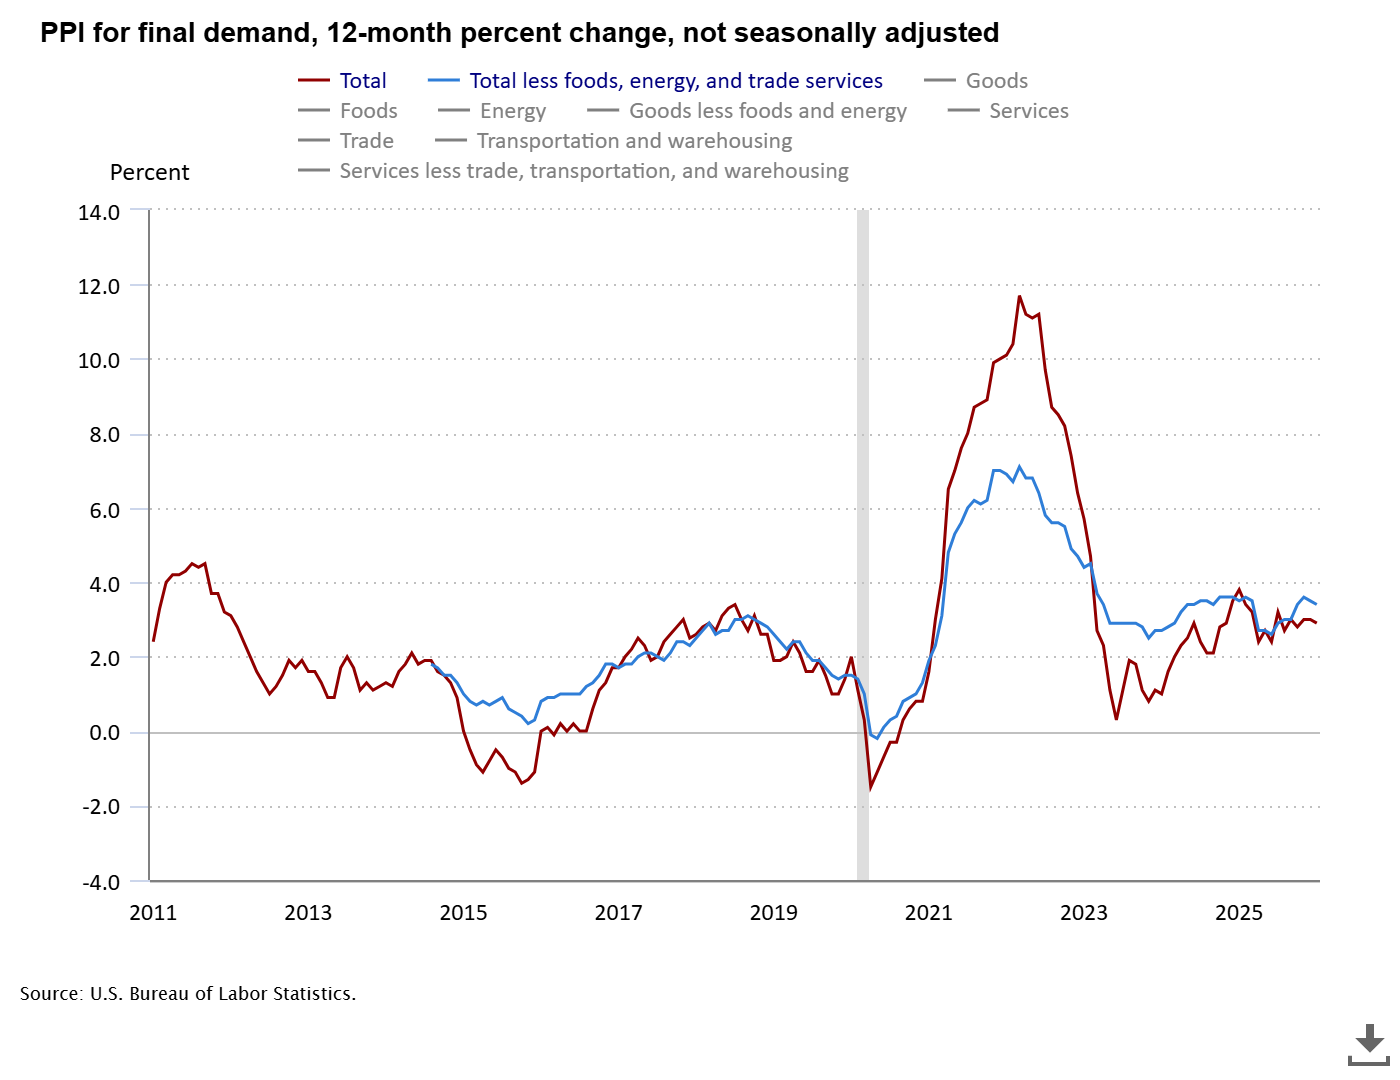
Depending on what the impact the attacks on Iran have on the oil market, this pressure could be problematic, especially when combined with the 15% worldwide tariffs going into effect on all imported goods. The minutes from the Fed's latest meeting and speeches since then indicate increasing concerns about calling and end to their inflation battle too early.
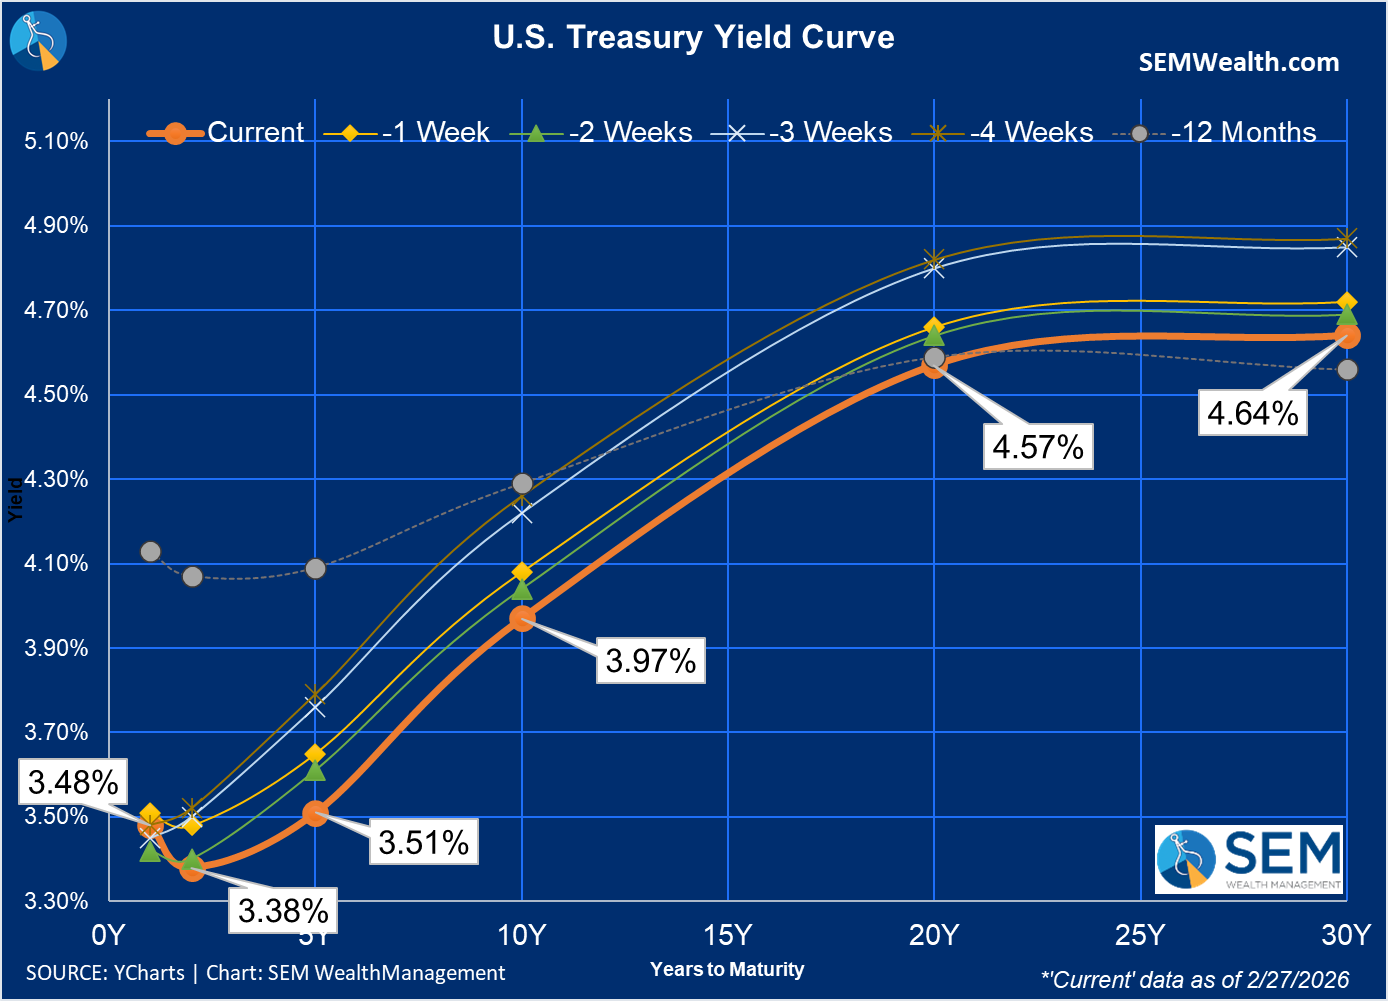
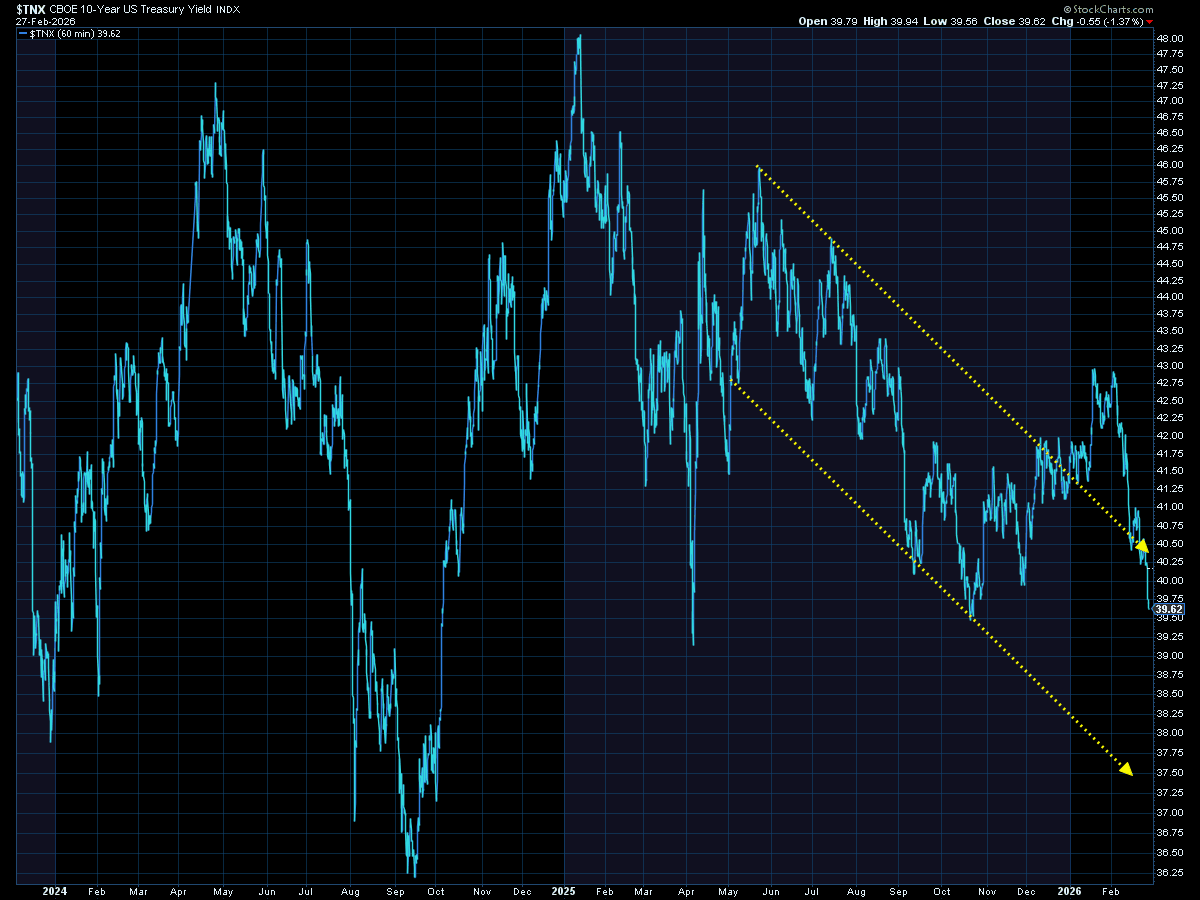
Despite this inflationary pressure, the market still expects a rate cut again in June (after Chair Powell's term expires). Longer-term interest rates also fell for the week, brining the 10-year yield back into our downtrend channel.
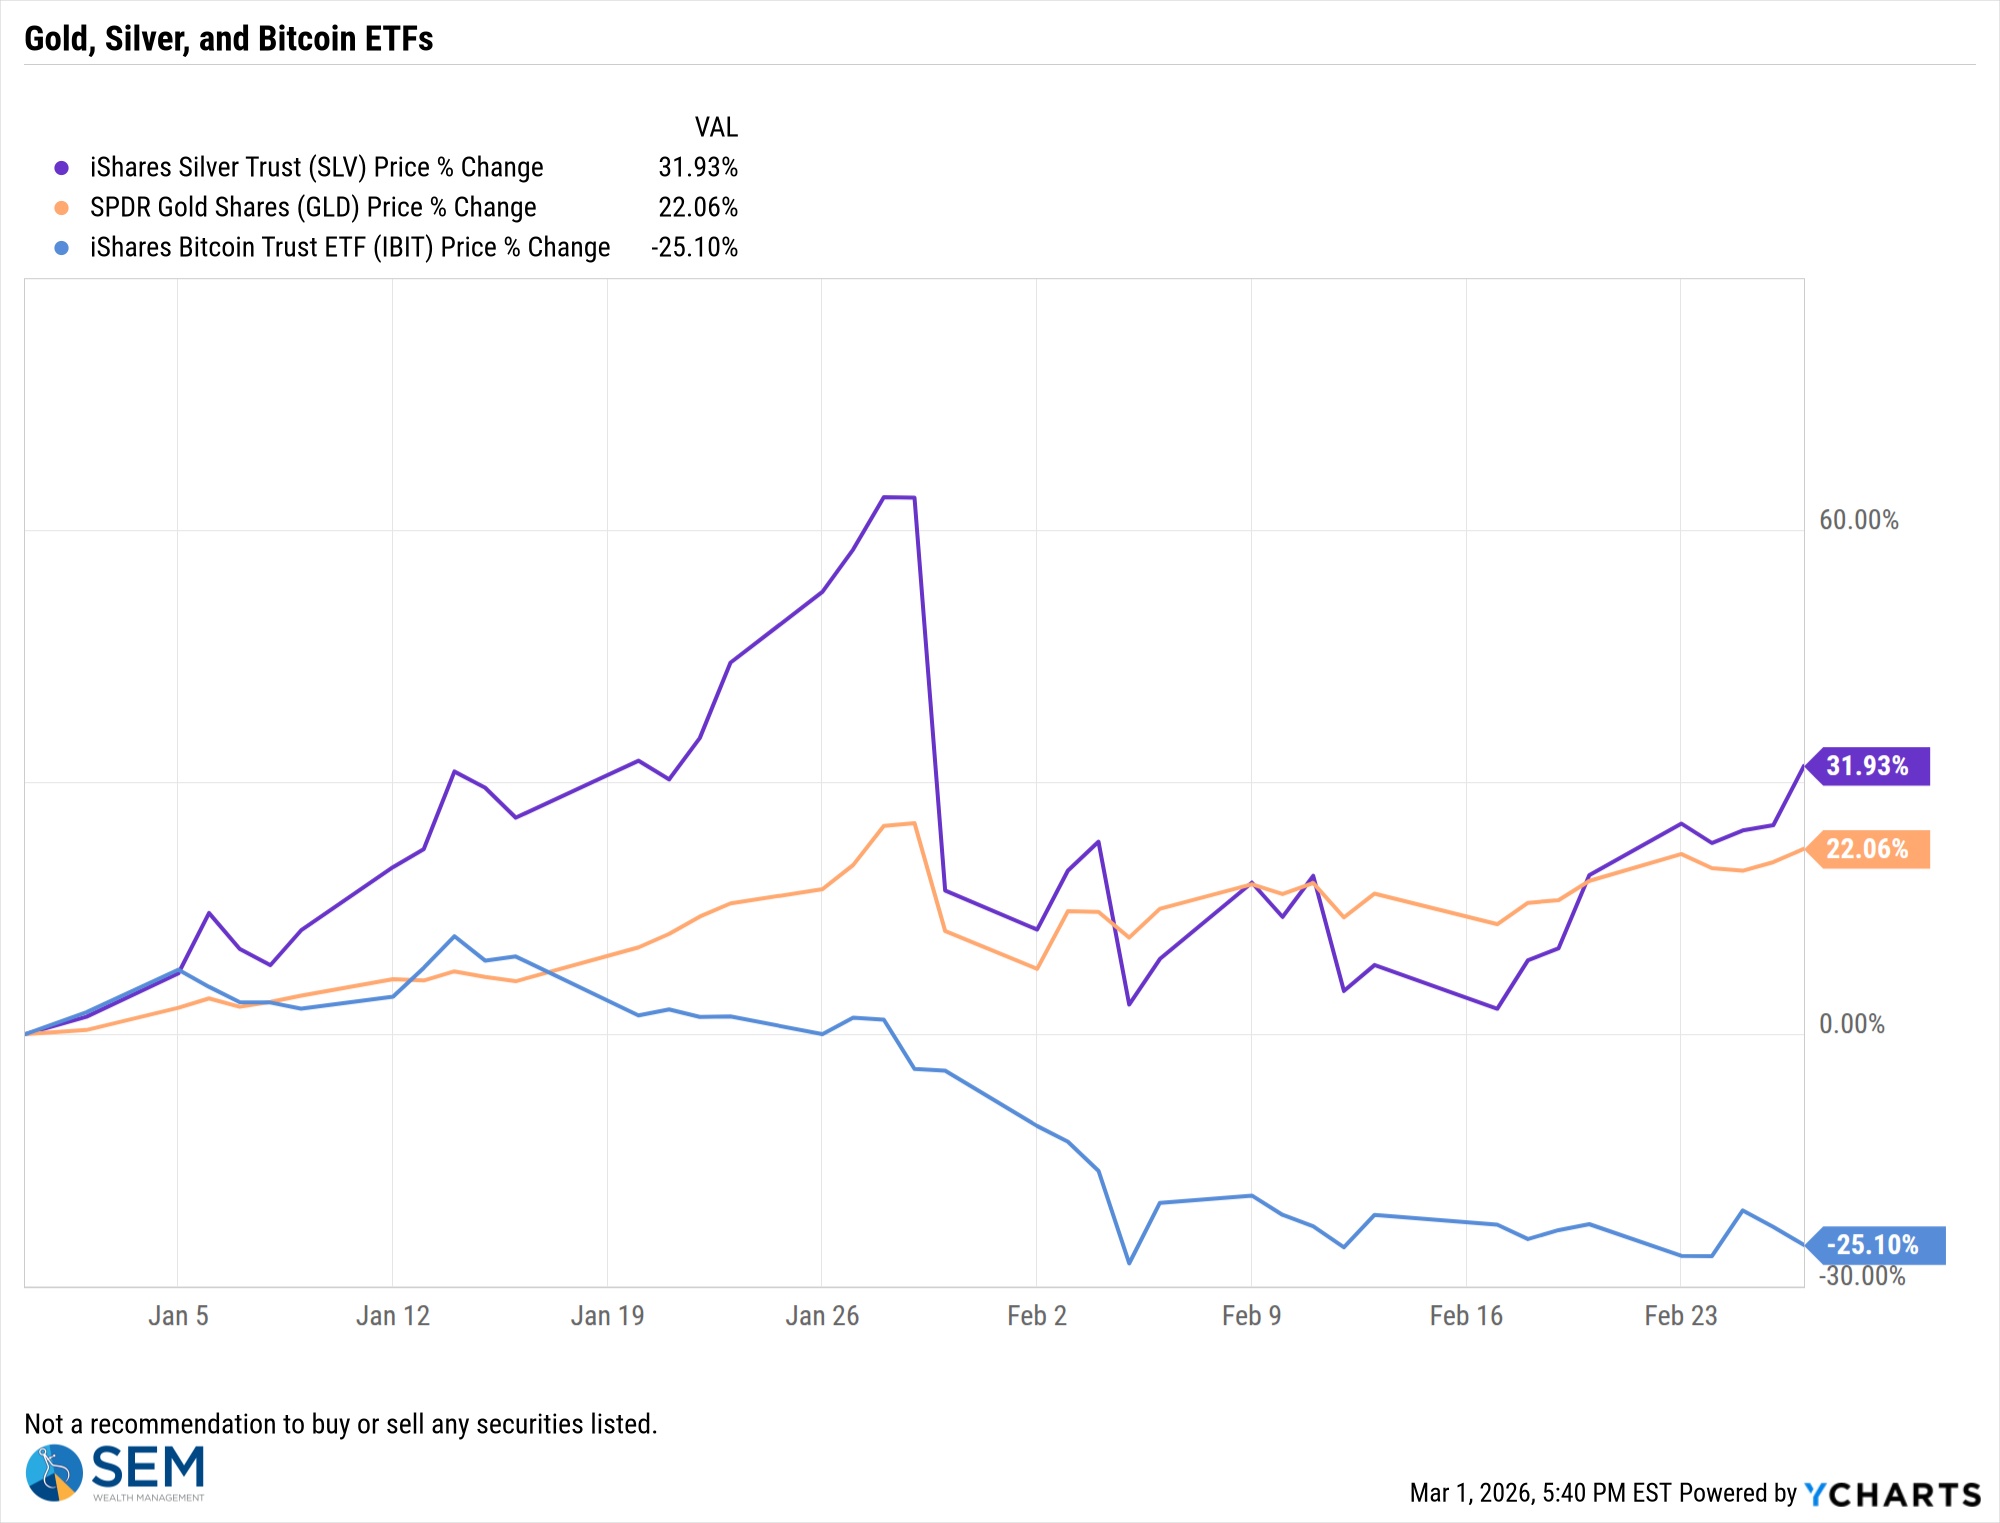
Gold and Silver did react how you would expect, while Bitcoin continues to show it is not the inflation hedge it was made out to be.
Looking ahead
Obviously the attack on Iran will steal most of the headlines this week. We will have several key pieces of economic data that could impact markets, starting with the ISM Manufacturing report on Monday and ending with the February Payrolls report on Friday. Given all that has been happening the past 6 weeks, it is a positive the market is in a holding pattern. The market seems to be waiting for clear signals before making a definitive move. At this point it could go either way.
Toby's Take
A look at our intern's top WSJ stories from last week
2/23/2026 - Tariffs Are a Wild Card for the Economy Again - WSJ
President Trump has had a very eventful term so far, mostly with the swarm of tariffs last year. The tariffs heavily affected our businesses and prices for consumers. However, the tariffs were bringing in large amounts of money to the Federal government helping slow our increasing debt. The questions are will the Federal government still be able to slow down our debt? Will these businesses get their demanded refunds? We will have to continue to watch this issue.
2/24/2026 - Exclusive | Trump to Sell the Economy During State of the Union Address - WSJ
President Trump is expected to speak a lot on how strong our economy is during his State of the Union Address. However, numbers will show a very shaky economy. He is also expected to talk about his policies and Republican policies and how they have positively helped American citizens.
2/25/2026 - Trump Hails an Economic Turnaround Many Voters Don’t See - WSJ
President Trump delivered the record setting 1 hour and 48 minute long State of the Union Address yesterday. In his speech he spoke on how he released a "new age of economic prosperity." He never said that he understands what Americans are feeling on the matter with polls showing that there is much anxiety felt towards the economy. These polls includes many swing voters the GOP will need to hold on to congressional majorities. Is our economy really as strong as he says? If it is so strong, the numbers would show it.
2/26/2026 - Americans Are Leaving the U.S. in Record Numbers - WSJ
The United States has reached its 250th year. We are a land that has been built on immigration with all of our genetics spanning back to almost all cultures. Under President Trump's leadership he promised to crack down on deportation and allowing new visas. He is certainly holding true to that. This is the first time since the Great Depression that America has had negative immigration also known as emigration. There are numbers showing that there are more American's leaving than there are coming in because families are finding lands more affordable and safe. There is no doubt that America offers great salaries compared to other countries, but could that be incentive to come work for a few years and leave? How will these numbers affect our "strong" economy?
2/27/2026 - Paramount Skydance Wins Warner Bros. Discovery Bidding War - WSJ
The bid is over! Netflix dropped out of the race for Warner Discovery after Paramount offered $31 a share. Netflix co-Chief Executives Ted Sarandos and Greg Peters said, "This transaction was always a 'nice to have' at the right price, not a 'must have' at any price." Now that Paramount has won the bid they will own Warner Bros, HBO, CNN, TNT, TBS, and the Food Network. This is a big shift for the entertainment industry. As of writing this Paramount, despite potentially doubling their debt, is up 20%. Will this be the right decision for Paramount? We will see!
Market Charts
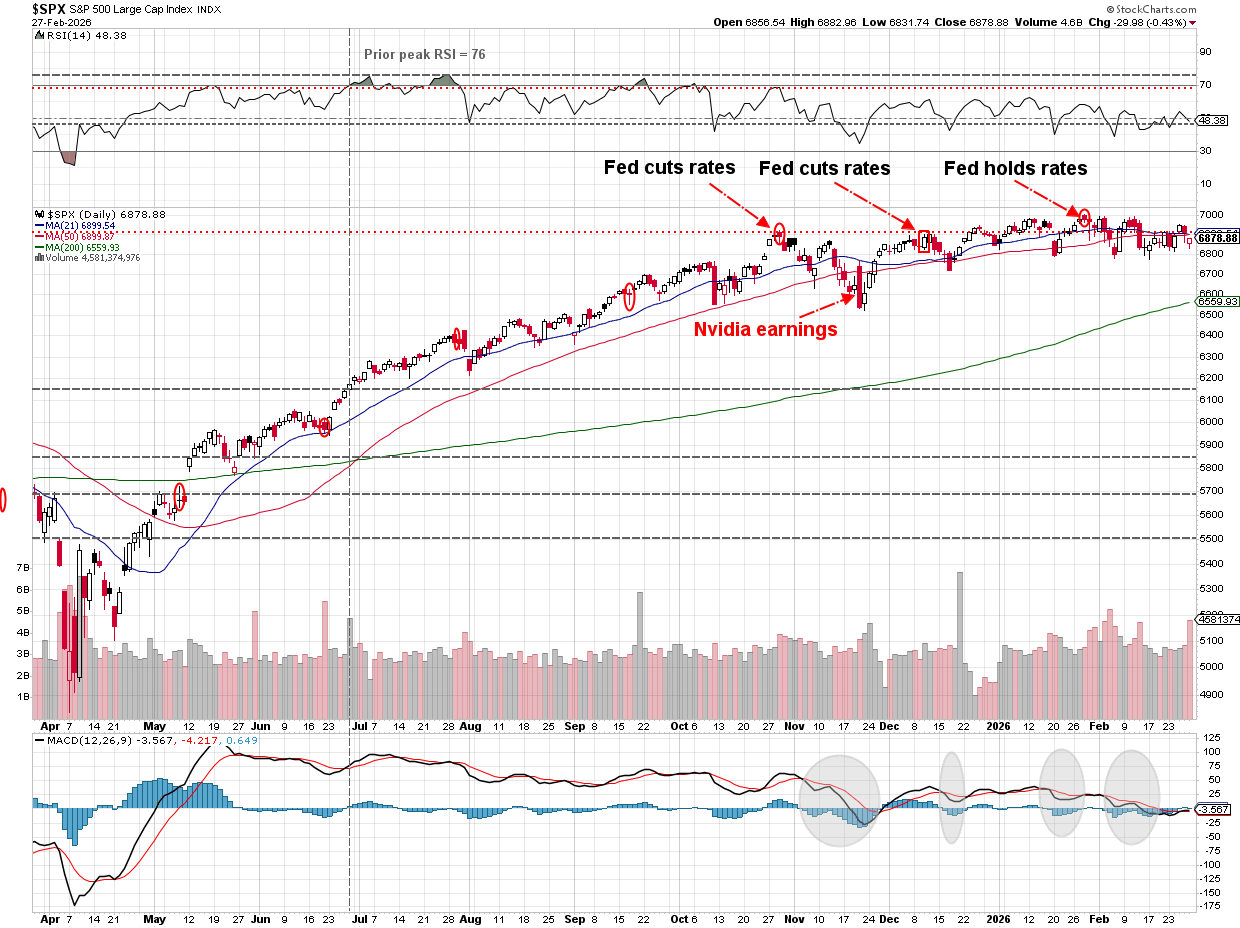
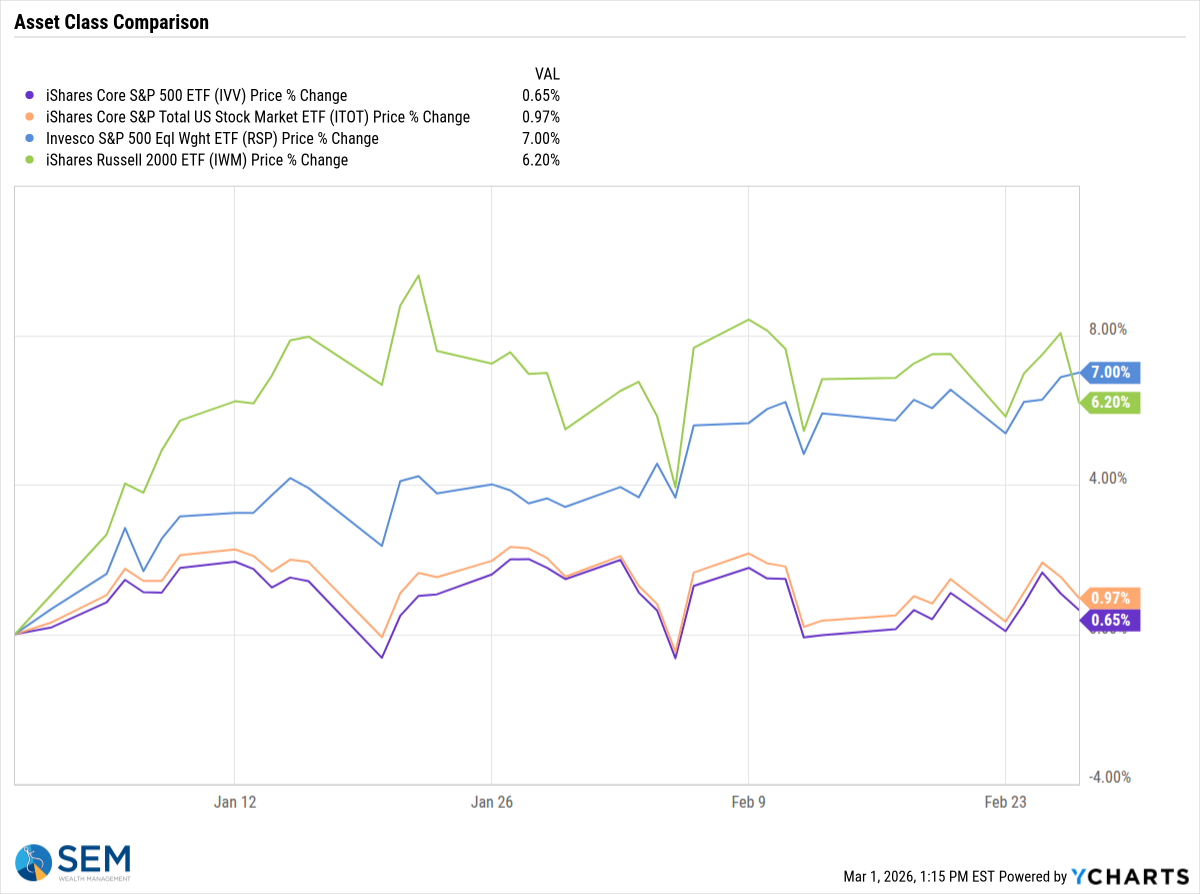
The 'holding pattern" theme is shown in both the short-term and longer-term charts of the S&P 500.
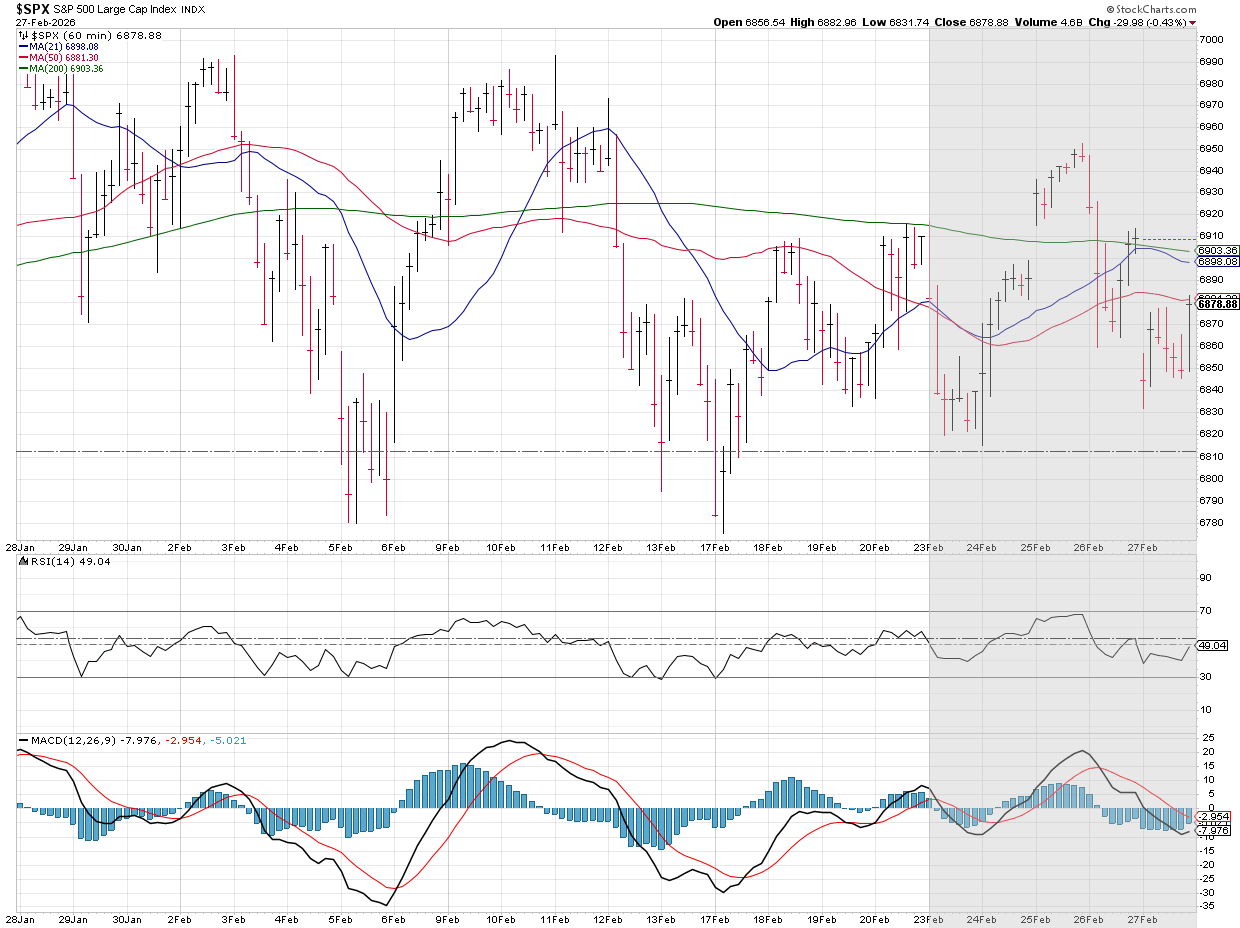
The S&P 500 has been around the 6900 level since the Fed meeting on October 27.
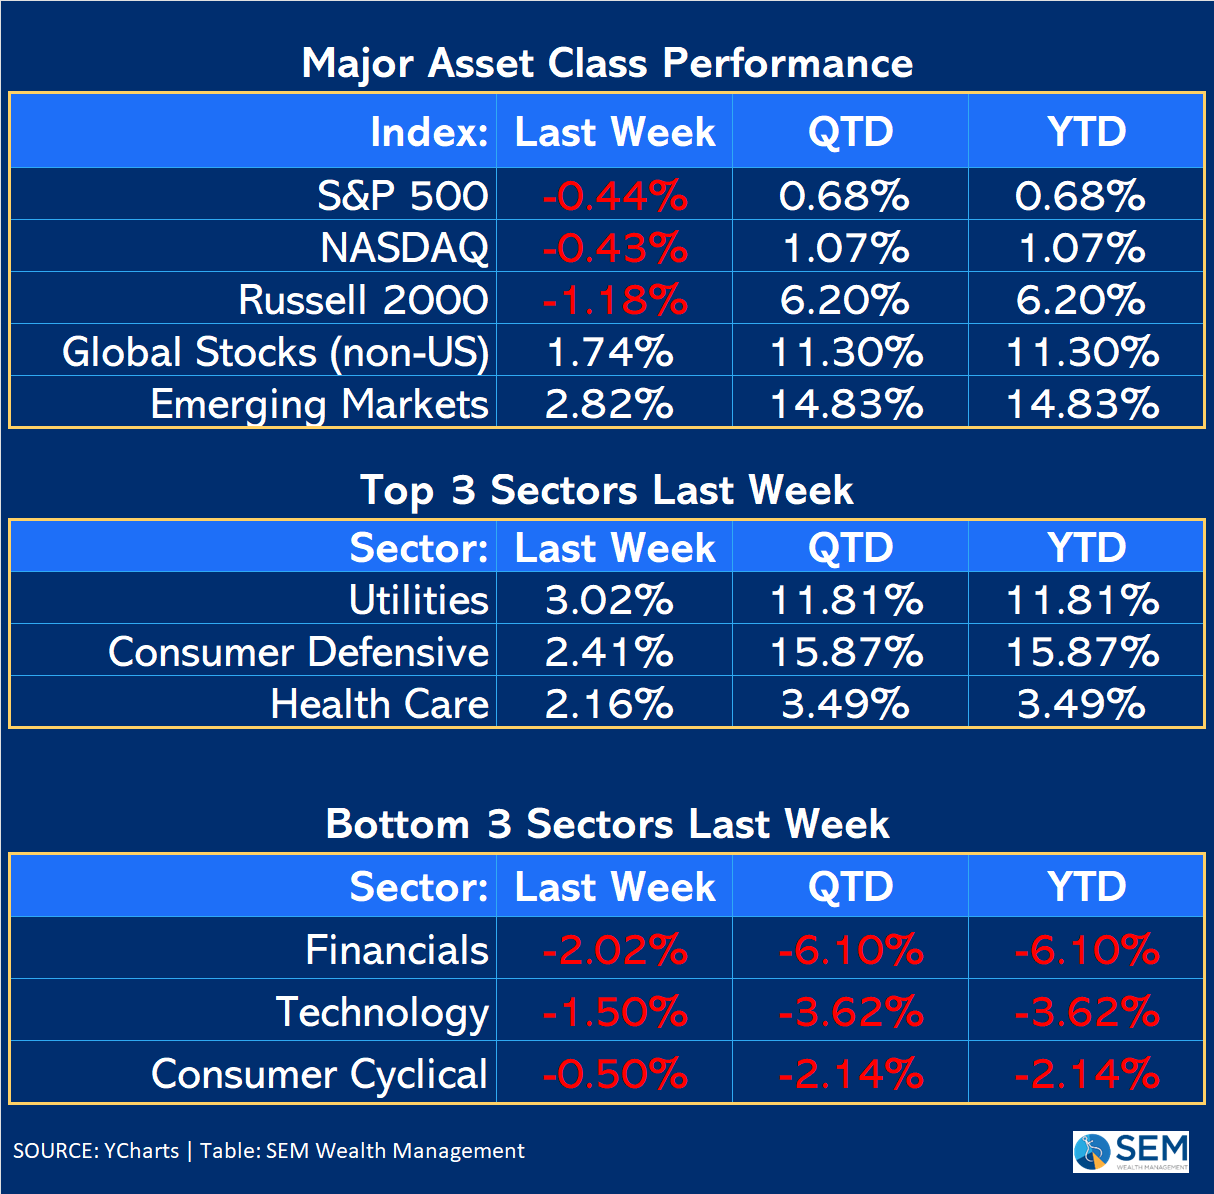
Small caps underperformed a bit last week, but still have a sizable lead on the mega-cap heavy S&P 500.
SEM Market Positioning
| Model Style | Current Stance | Notes |
|---|---|---|
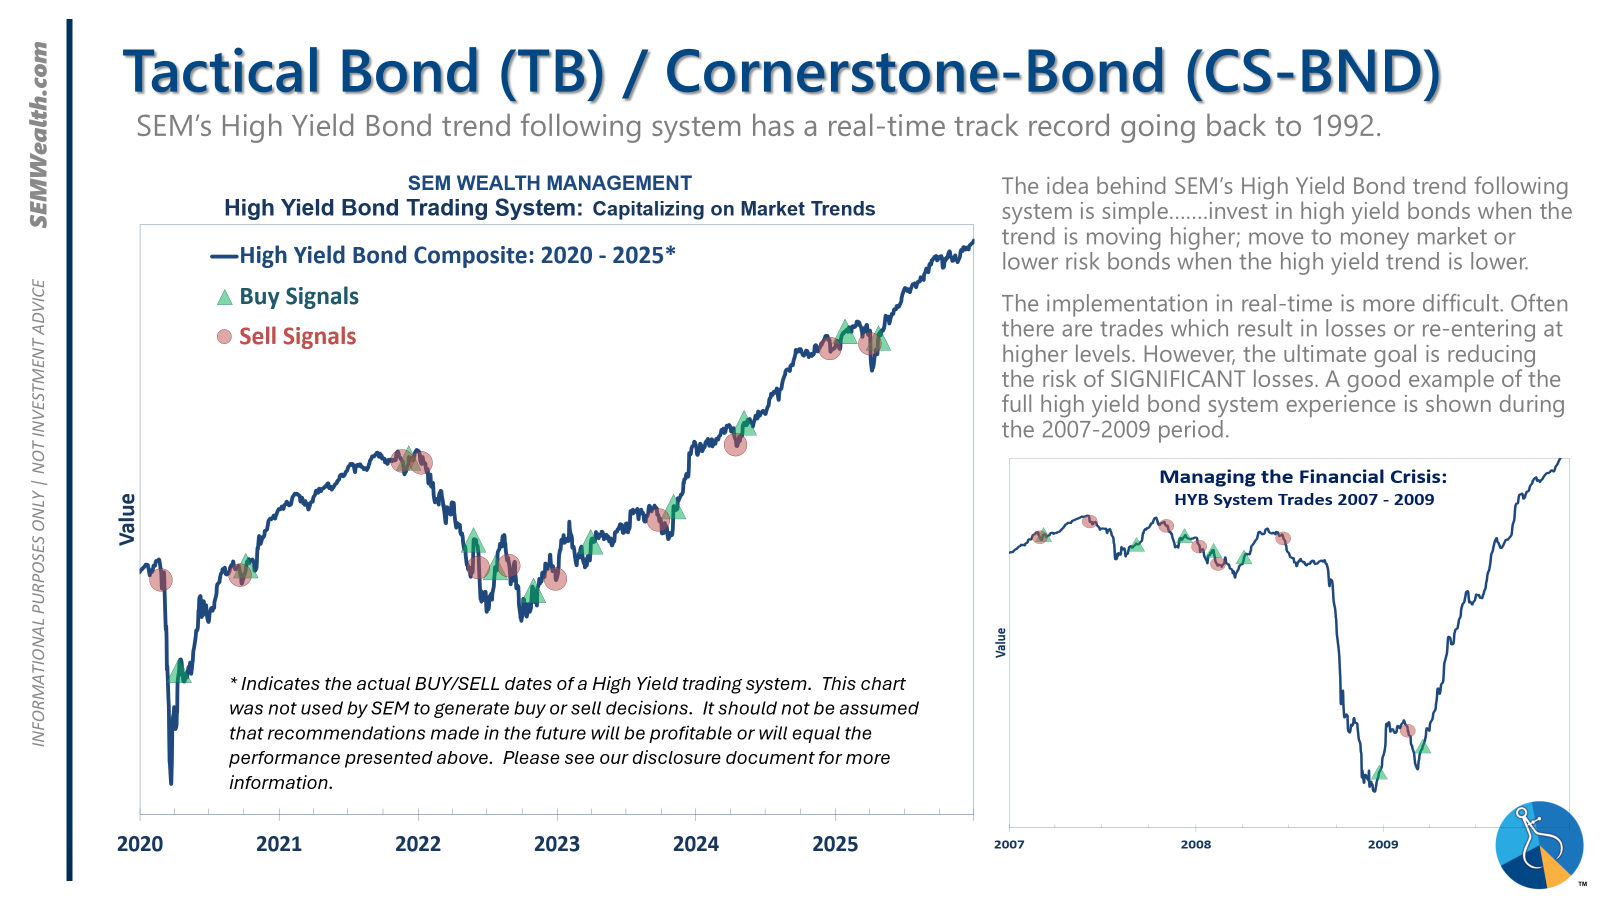
| Tactical | 100% high yield | High-yield spreads holding, but trend is slowing-watching closely |
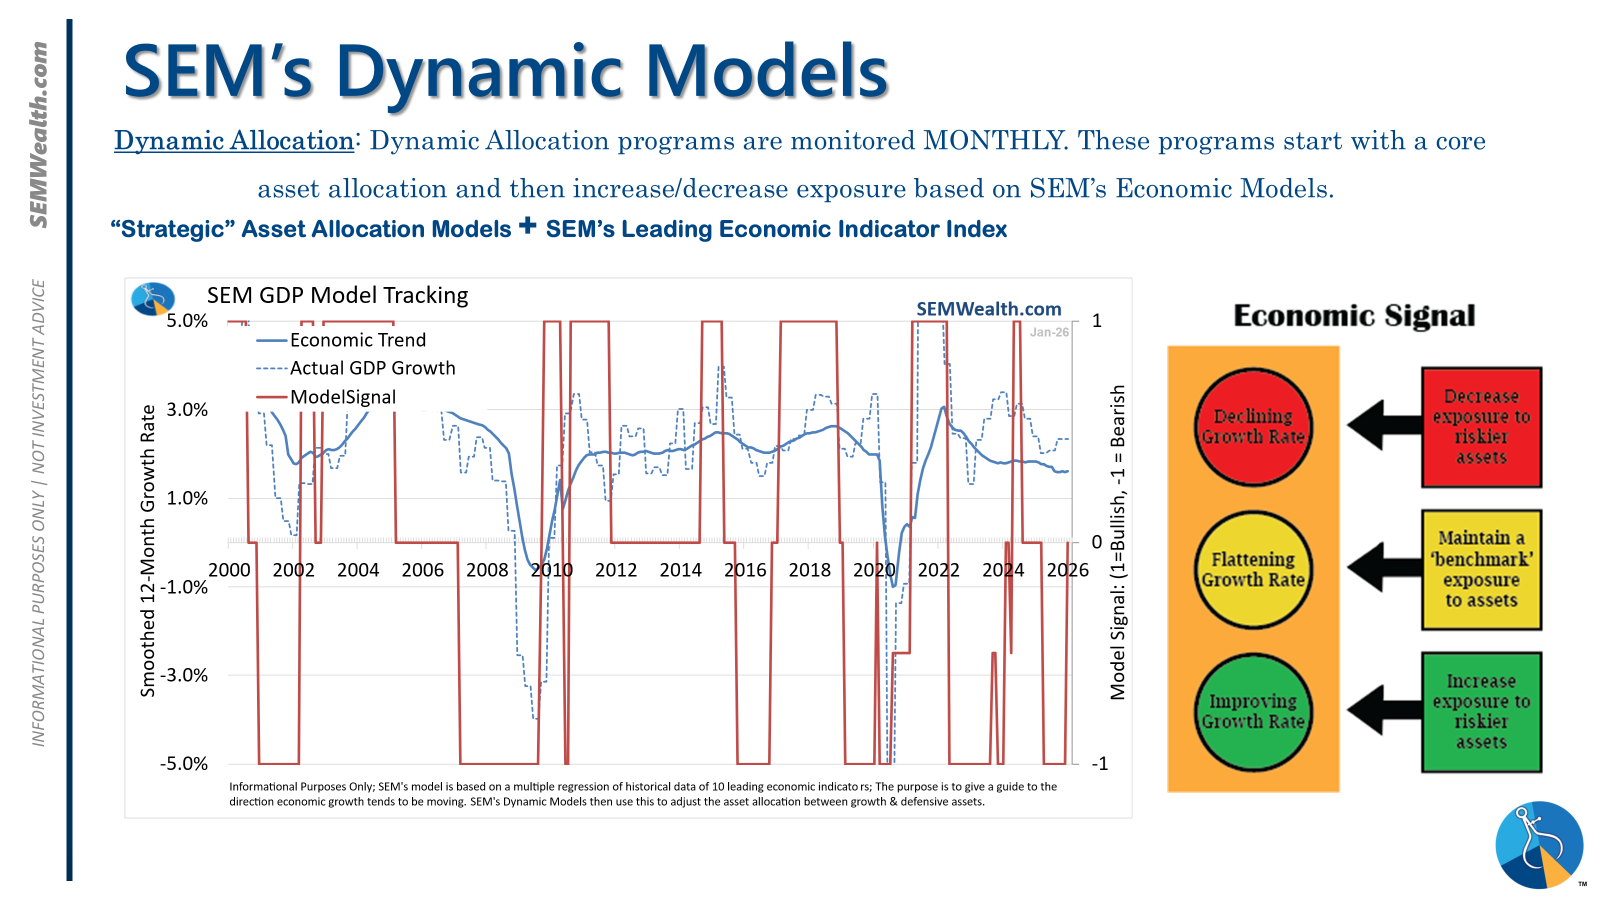
| Dynamic | Neutral | Economic model turned neutral Feb 15 '26' – benchmark weightings |
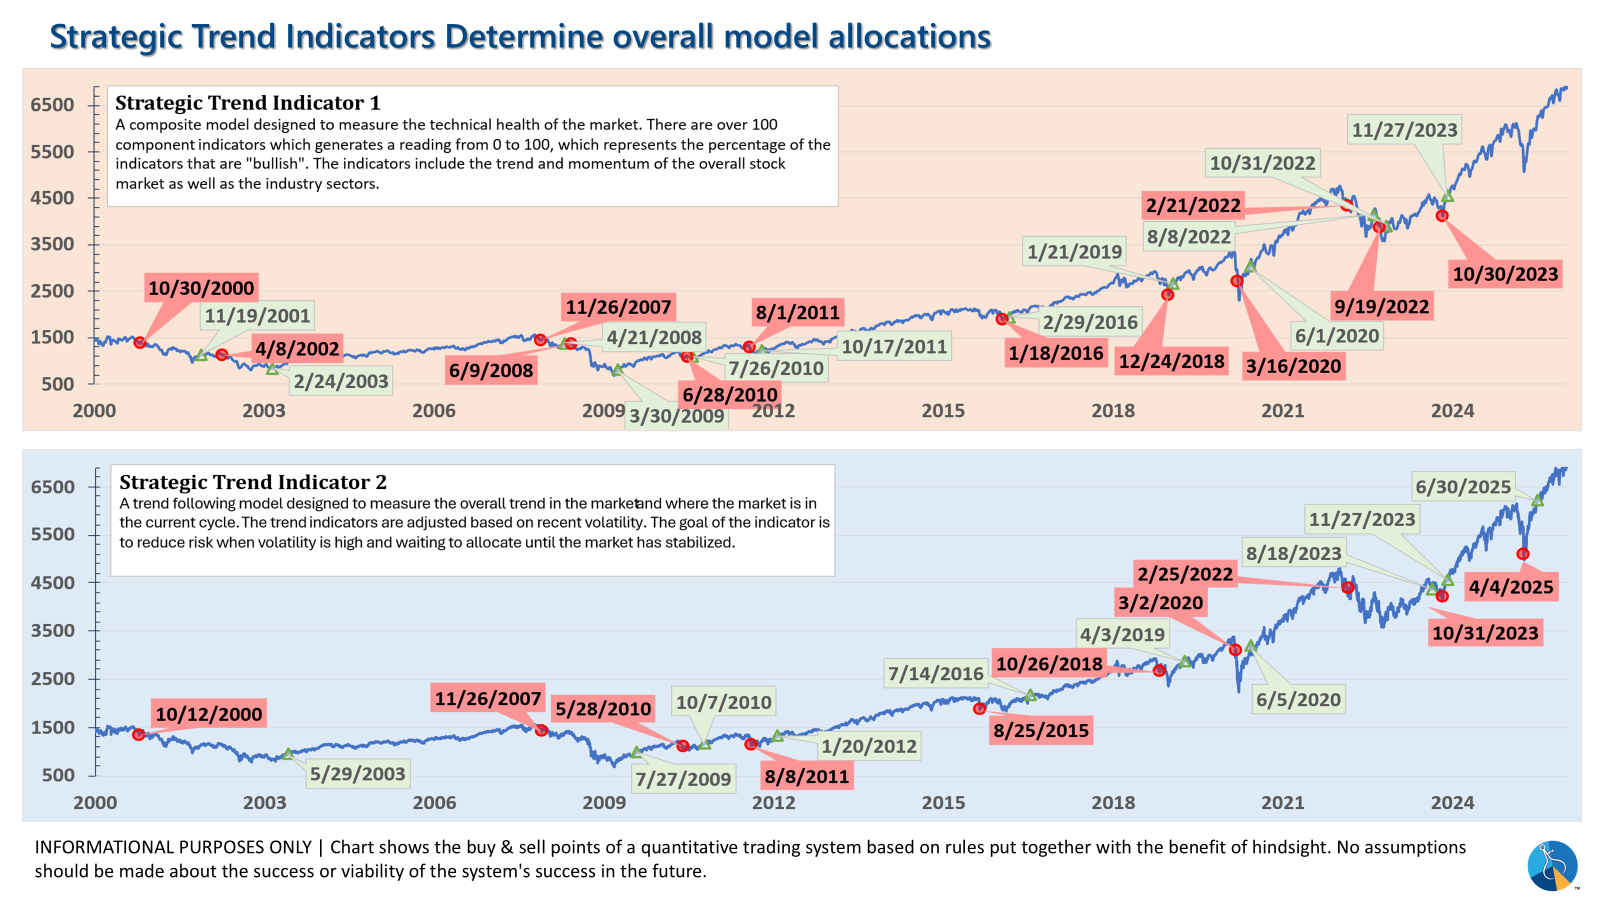
| Strategic | Fully invested | Trend overlay shaved 10 % equity in April -- added back early July |
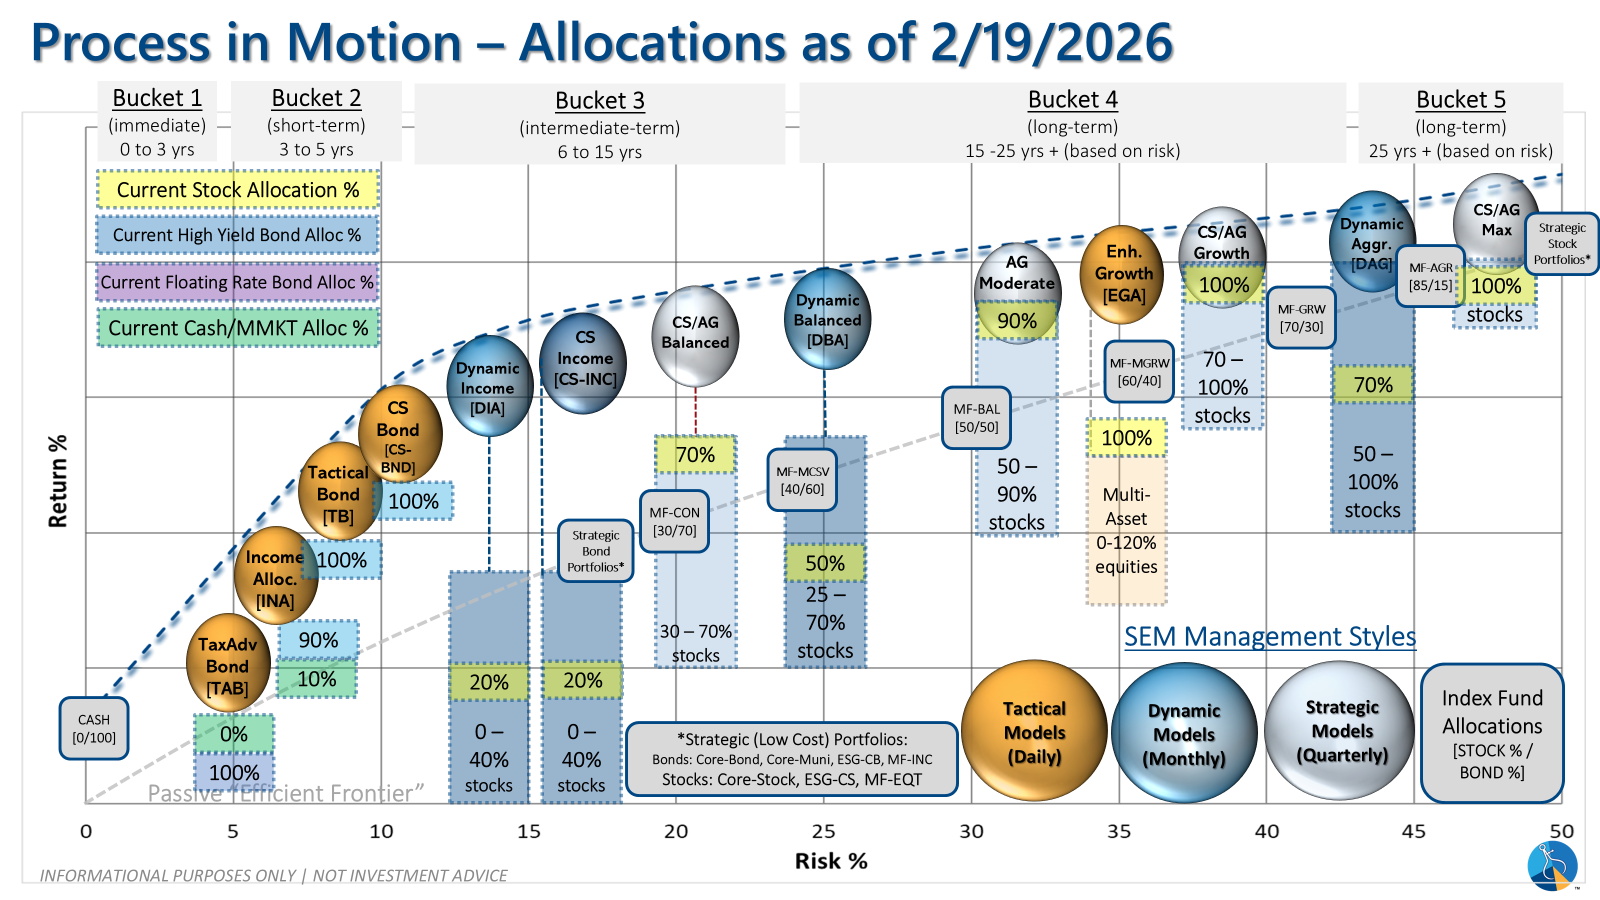
SEM deploys 3 distinct approaches – Tactical, Dynamic, and Strategic. These systems have been described as 'daily, monthly, quarterly' given how often they may make adjustments. Here is where they each stand.
Tactical (daily): The high yield system has been invested since 4/23/25 after a short time out of the market following the sell signal on 4/3/25.
Dynamic (monthly): The economic model went 'bearish' in June 2025 after being 'neutral' for 11 months. This means eliminating risky assets – sell the 20% dividend stocks in Dynamic Income and the 20% small cap stocks in Dynamic Aggressive Growth. The interest rate model is 'bullish' meaning higher duration (Treasury Bond) investments for the bulk of the bonds.
Strategic (quarterly)*: One Trend System sold on 4/4/2025; Re-entered on 6/30/2025
The core rotation is adjusted quarterly. This quarter we saw half of our international positions reduced (we sold developed markets and kept our emerging markets exposure). We also saw the remaining share of mid-cap reduced in favor of more small cap exposure. We remain with a "barbell" core portfolio – about half in large cap and half in small cap as the models expect the market to "broaden".
The * in quarterly is for the trend models. These models are watched daily but they trade infrequently based on readings of where each believe we are in the cycle. The trend systems can be susceptible to "whipsaws" as we saw with the recent sell and buy signals at the end of October and November. The goal of the systems is to miss major downturns in the market. Risks are high when the market has been stampeding higher as it has for most of 2023. This means sometimes selling too soon. As we saw with the recent trade, the systems can quickly reverse if they are wrong.
Overall, this is how our various models stack up based on the last allocation change:
Curious if your current investment allocation aligns with your overall objectives and risk tolerance? Take our risk questionnaire


