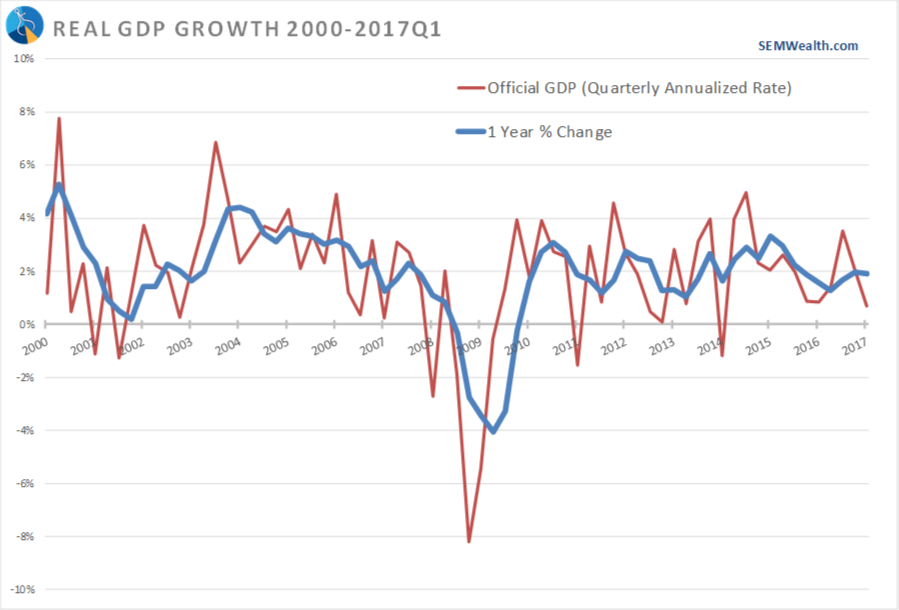
Once again I’m seeing a flood of headlines discussing the “disappointing” or “weak” GDP report released this morning. Pundits are using it to call into question the enthusiasm we’ve seen in so many sentiment indicators since the election of President Trump. The problem is, the “official” GDP report is highly misleading as it does not reflect what actually has been happening in the economy.
The official GDP number is essentially the quarterly change in the economy, adjusted by some statistical “seasonality” factors and then basically multiplied by 4 (it is actually a compounded rate of change). The problem is both in the seasonal factor adjustments as well as using 3 months to calculate what the last year has been. This week’s Chart of the Week shows the difference between the official number (the red line) and a better way to measure economic output — the growth over the last year. This method ignores all seasonal adjustments because every season is included and gives us 12 full months. Notice the volatility of the red line.

While the 1.9% annual change in the economy is disappointing, it is only down 0.4% from the January reading. In other words no alarm bells needed.


