Listening & reading to the “experts” over the weekend further cements my belief SEM’s Behavioral Approach to Investing using Scientifically Engineered Models is the best way to manage money. The wide-range of opinions following some scary drops in the market along with some tremendous rallies feeds into our emotional biases and could lead to some very poor decisions. The question of the weekend was “is the worst over?” Tangents to that question was whether this was a buying opportunity or a warning to lock in the gains from the past 15 months (or 6 years or 9 years depending on the dire outlook of the commentator).
The real answer is “I don’t know.” Anybody with some integrity would also have to answer this way. Of course, this is why I’m never on TV. That doesn’t generate ratings or clicks or advertising. Last week’s Chart of the Week along with the daily blog posts discussed the need to wait to see how things shake out. This COULD be the start of something much bigger — something we’ve warned people wanting to jump into the market at these high valuation levels for a couple of years. It could also be the necessary correction the market needs to return back to a more “normal” trajectory — not the parabolic rise we saw following the election of President Trump.

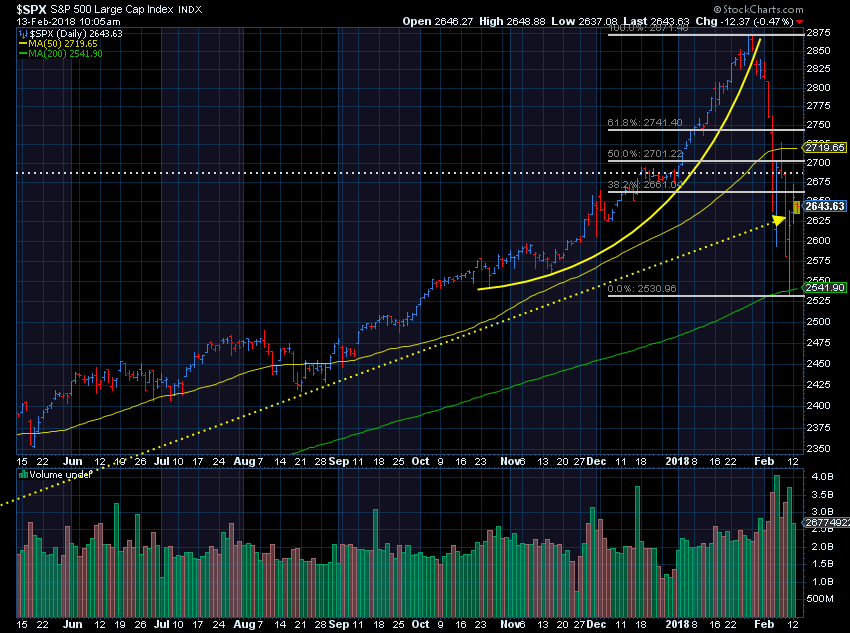
Remember, humans are involved, which means we are at the mercy of the consensus emotions, which can flip depending on how fast the market moves and in which direction. Whenever we see a large drop, I go back to the Fibonacci retracement levels, which are cycles observed throughout nature, including in systems involving human behavior. We don’t have any systems that utilize these numbers, but I always find it interesting to watch. Yesterday closed at the 38% retracement level. Also interesting to note is the bounce off the 200-day moving average, a line often used as a long-term trend line for equity allocations (good entry point, according to these experts).
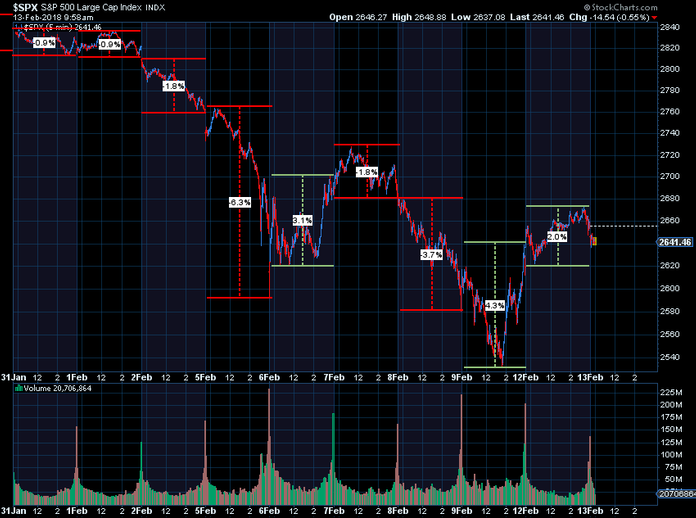
From a shorter-term perspective, Monday was the first back to back positive moves in the market since it hit all-time highs in late January (seems so long ago). This 10-day chart shows the continued wide range the market has been trading in.

Our systems are designed to let the noise play out. The Volatility System that started buying a week ago began exiting yesterday. Our Sector Rotation System also moved a bit to the sidelines as did one of our Momentum Systems. Both of these have been in the market since November 2016 and July 2016 respectively. Offsetting those were moves into the market from our Price Divergence System given the stronger volume on the rallies last week. Overall, EGA reduced its exposure about 20% yesterday.
On the fixed income side, we are as defensive as we’ve been since November 2016 following sell signals last Tuesday & Friday. If wrong, these systems can move back into the market once the volatility has settled down (and thus the risk of another large drop). If right, we will have plenty of powder dry to take advantage of a washout that should have been expected several years ago with valuations still extremely stretched to the upside.
Stay tuned.


