Today is a sad day. For me, at least. Today is the first day in 17 days that we will not be giving out medals to the best athletes in the world, who worked mostly quietly on their craft for 5 years for this moment of peak physical showcasing. As a sports fan, I could not get enough of the Olympics, all of them. I watched too much rowing and canoeing. Japan picked a handful of events to be apart of the Olympics for the first time, and I am now a fan of sport climbing. They even threw in a 3-on-3 half-court basketball tournament for a medal, in case you were wondering if your weekend trip to open gym could lead you to win the same award that the fastest and strongest among humankind are winning. It was glorious, and now it’s over. But we only have 3 years to wait for Paris!
If we had to pick one American who represents us for the Olympics, for the past few Olympics, it would probably be swimmer Katie Ledecky. She came into Tokyo with 5 golds from London and Rio and was expected to come in and do the same this time around. Her first medal event went disastrously, as she ONLY got a silver. The world might have stopped for a bit, but it wasn’t a bad swim by any means. It was faster than her previous world record at the event she set in 2014. Our expectations just ruined what should have been an extremely impressive event. And it’s a shame we did that, because she then went out and won the very first 1500m women’s gold, and won the gold in the 800m. My absolute favorite part of the Olympics was a chart that showed the 23 fastest times swam by women in the 800m, and all 23 were Ledecky.

When we can’t offer the right levels of perspective to amazing things, we don’t realize that the things happening are amazing. To segue back to the markets, what should our expectations be?
The good news is we have a long history of the market and have some ideas as to what “normal” expectations should be. If things beat the normal expectations, that’s great. But, if we start expecting the normal expectations to be beaten, then we don’t have normal expectations anymore. We as humans love to find patterns and make tweaks as patterns appear to arise. Of course, at SEM we rely on what the actual data is telling us instead of simply trying to find patterns that might not actually be there.
In terms of the health of the market currently, we did get some excellent news, when the economy added more jobs than expected. The most jobs added since August 2020 is certainly a great thing, especially since we need jobs to have the economy working correctly. If we use that data and draw a chart it would be easy to project that jobs will continue to increase, the economy will continue to grow, and the market will continue to offer us gains. However, there are a few other charts that will hopefully keep our expectations level. This first chart shows us that while we still are below February 2020 hours worked, we are very close to being back to pre-pandemic levels.
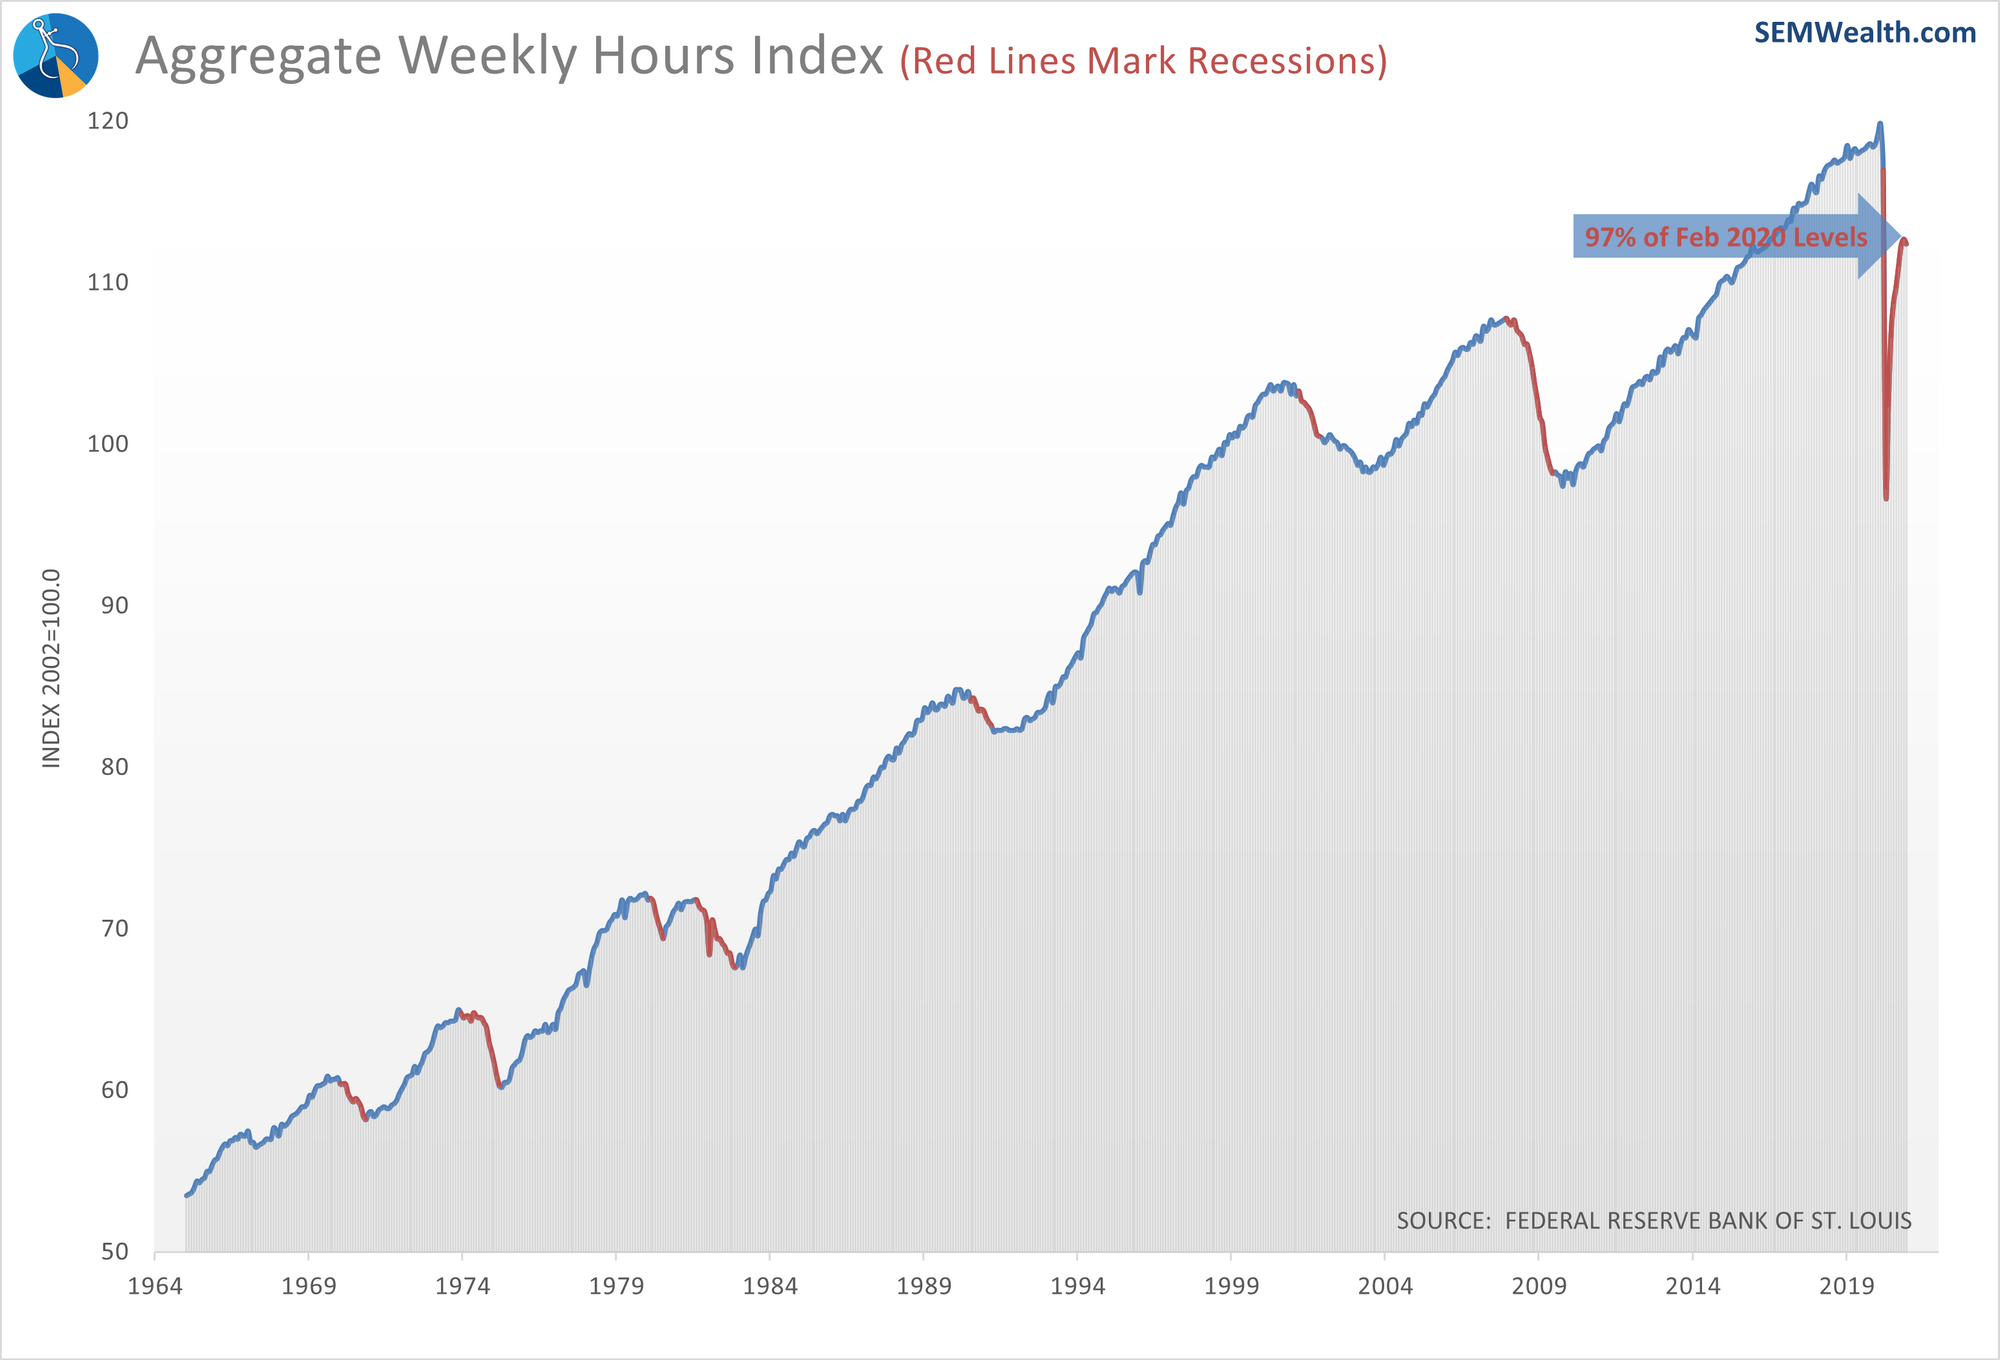
That of course was preceded by an entire decade of increasing hours, so that February 2020 threshold is already high. The timeframe of how long it took to get back to those levels (or near those levels) was also much faster than the previous two recessions, which took years to recover payrolls.
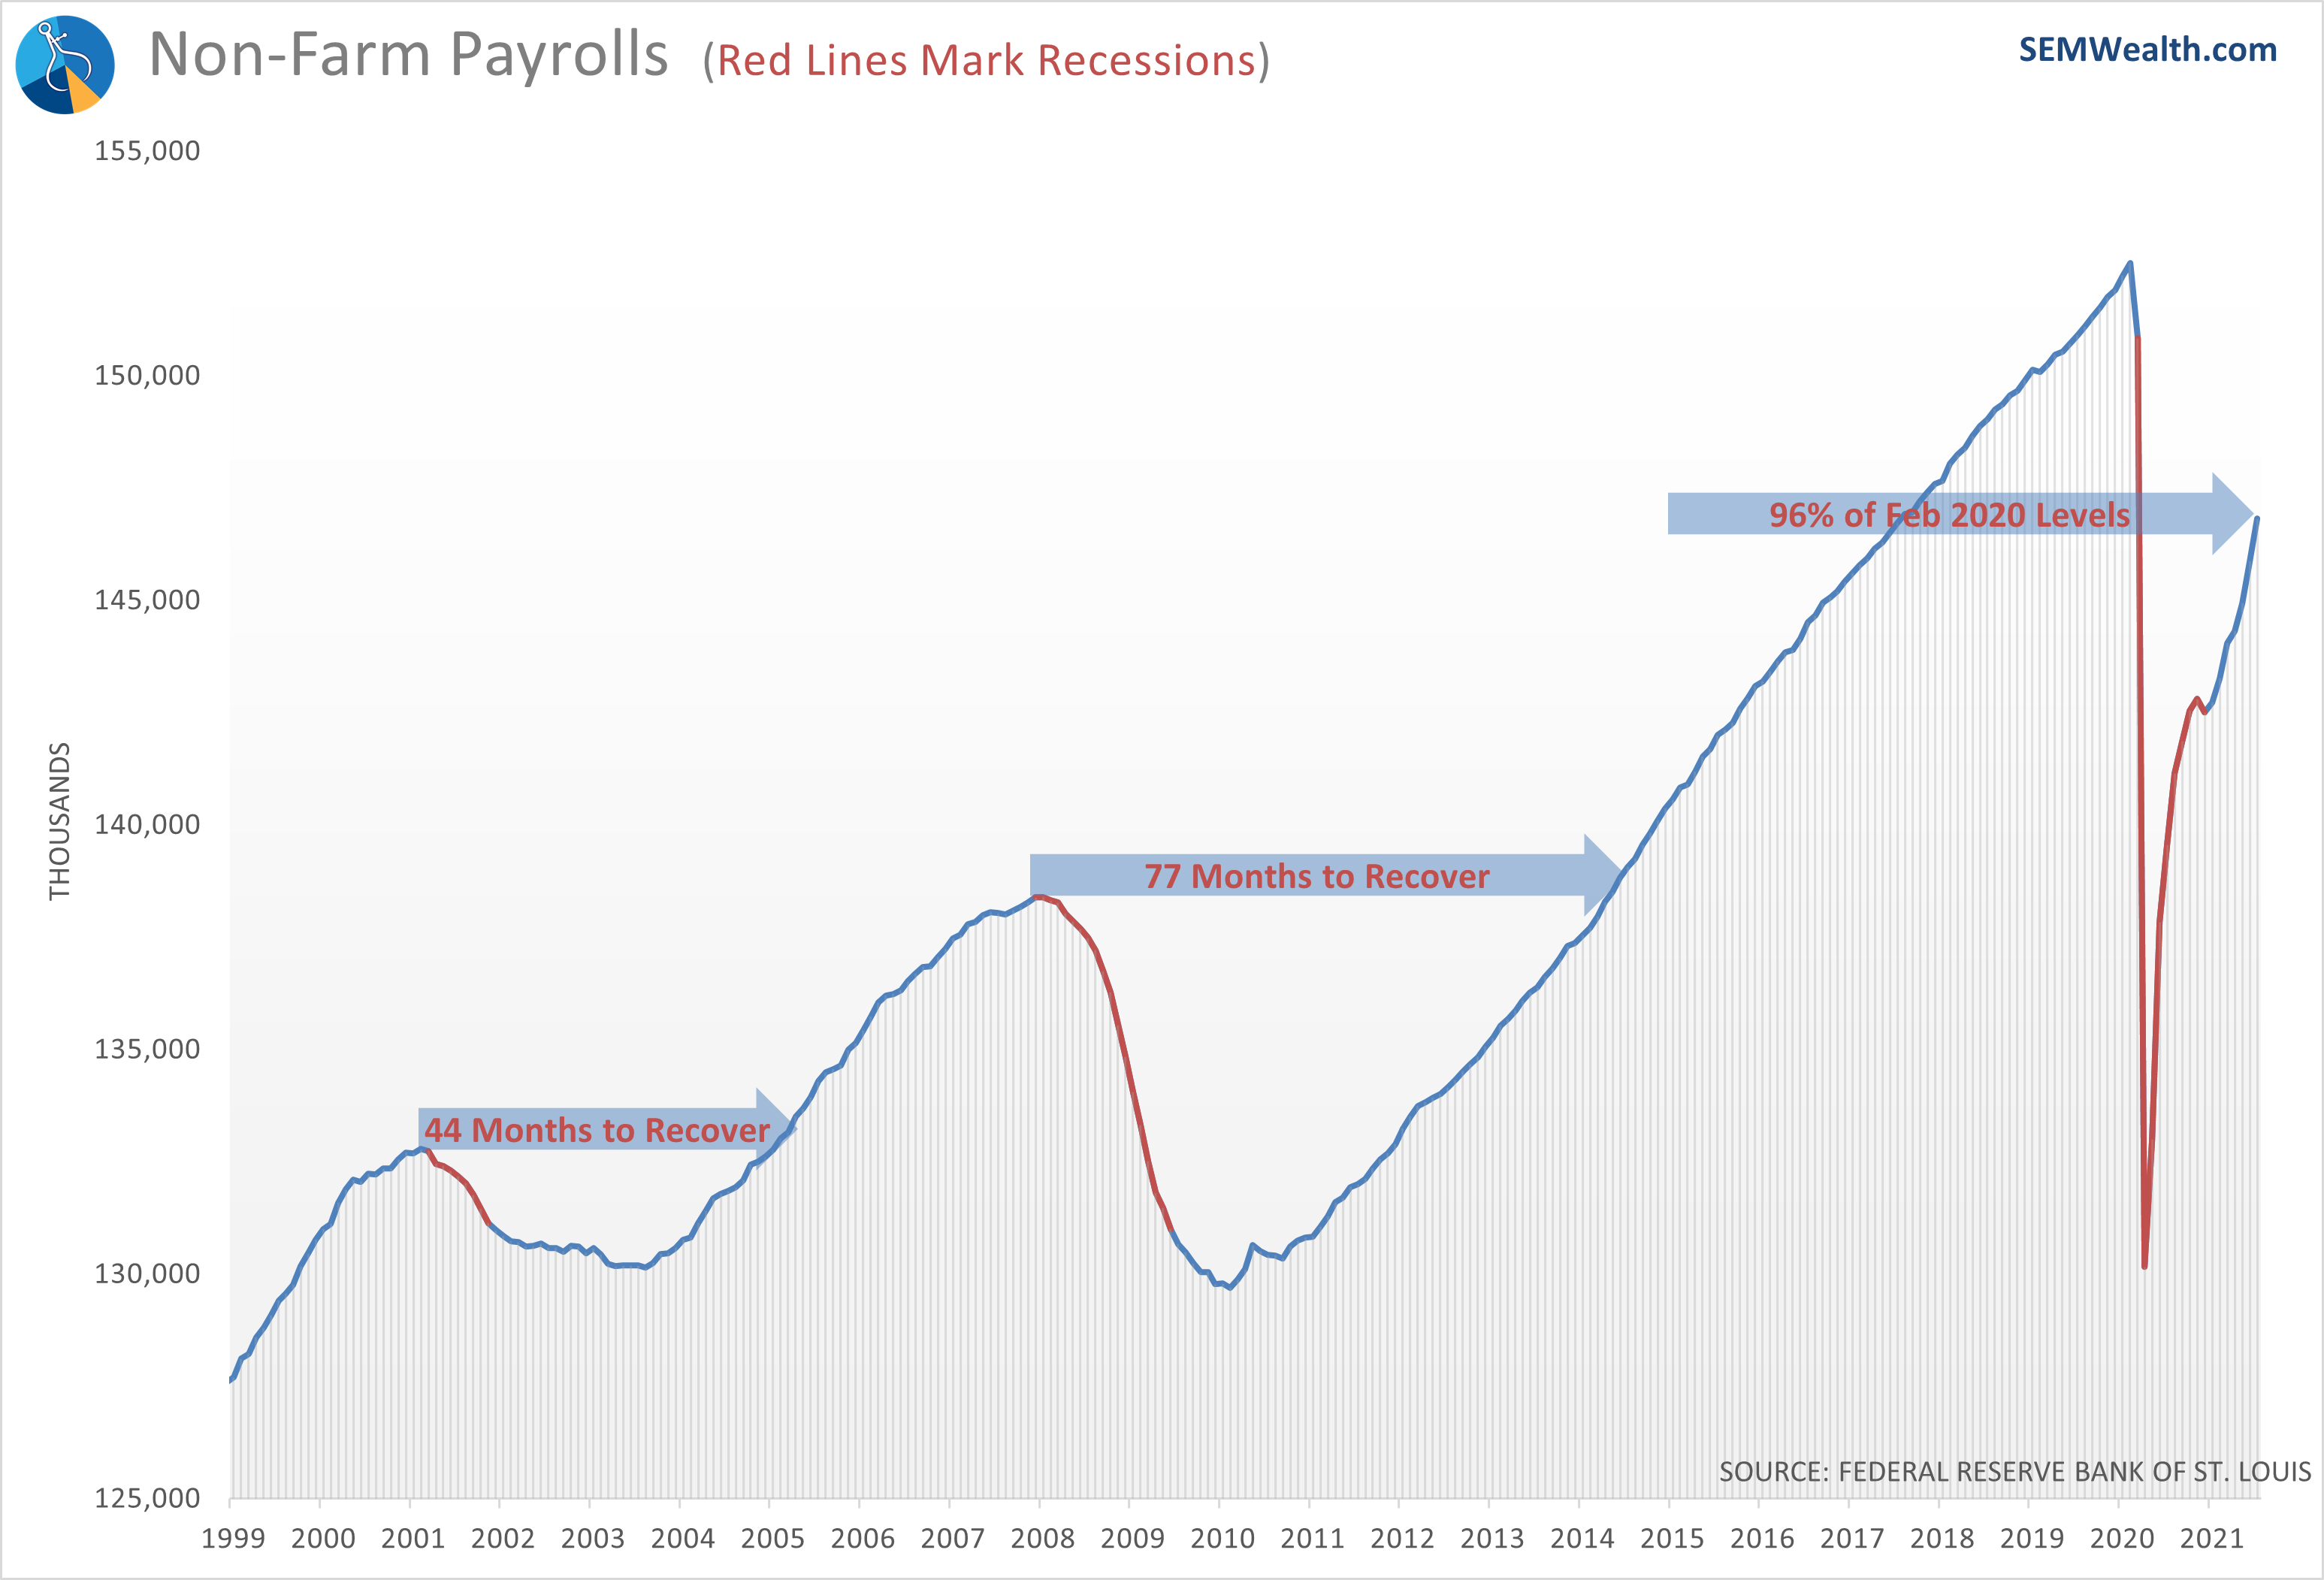
Another thing to keep in mind is the CHANGE of the payrolls. While the overall number of jobs increased higher than it has in the past year, the RATE at which the jobs added is slowing slightly. Jobs growing is good, but if we don’t temper our expectations and keep expecting more and more and more jobs to be added month after month then eventually we will find ourselves disappointed by good jobs numbers. While these numbers are almost entirely positive, be aware of where this can end up if we aren’t careful.
All of this being said, we can look at the economic data, and SEM’s models still point us to being bullish. This data is not set through our own biases or what we think the market is going to do, but instead combine actual data to help guide educated investment decisions for the next month. Just because it’s bullish now doesn’t mean it will remain that way, but the beauty of these economic numbers is we can update our models based on what new data comes out. For the time being, based on what our models are showing us we can expect some more upward trends in the market, and that is a good thing.
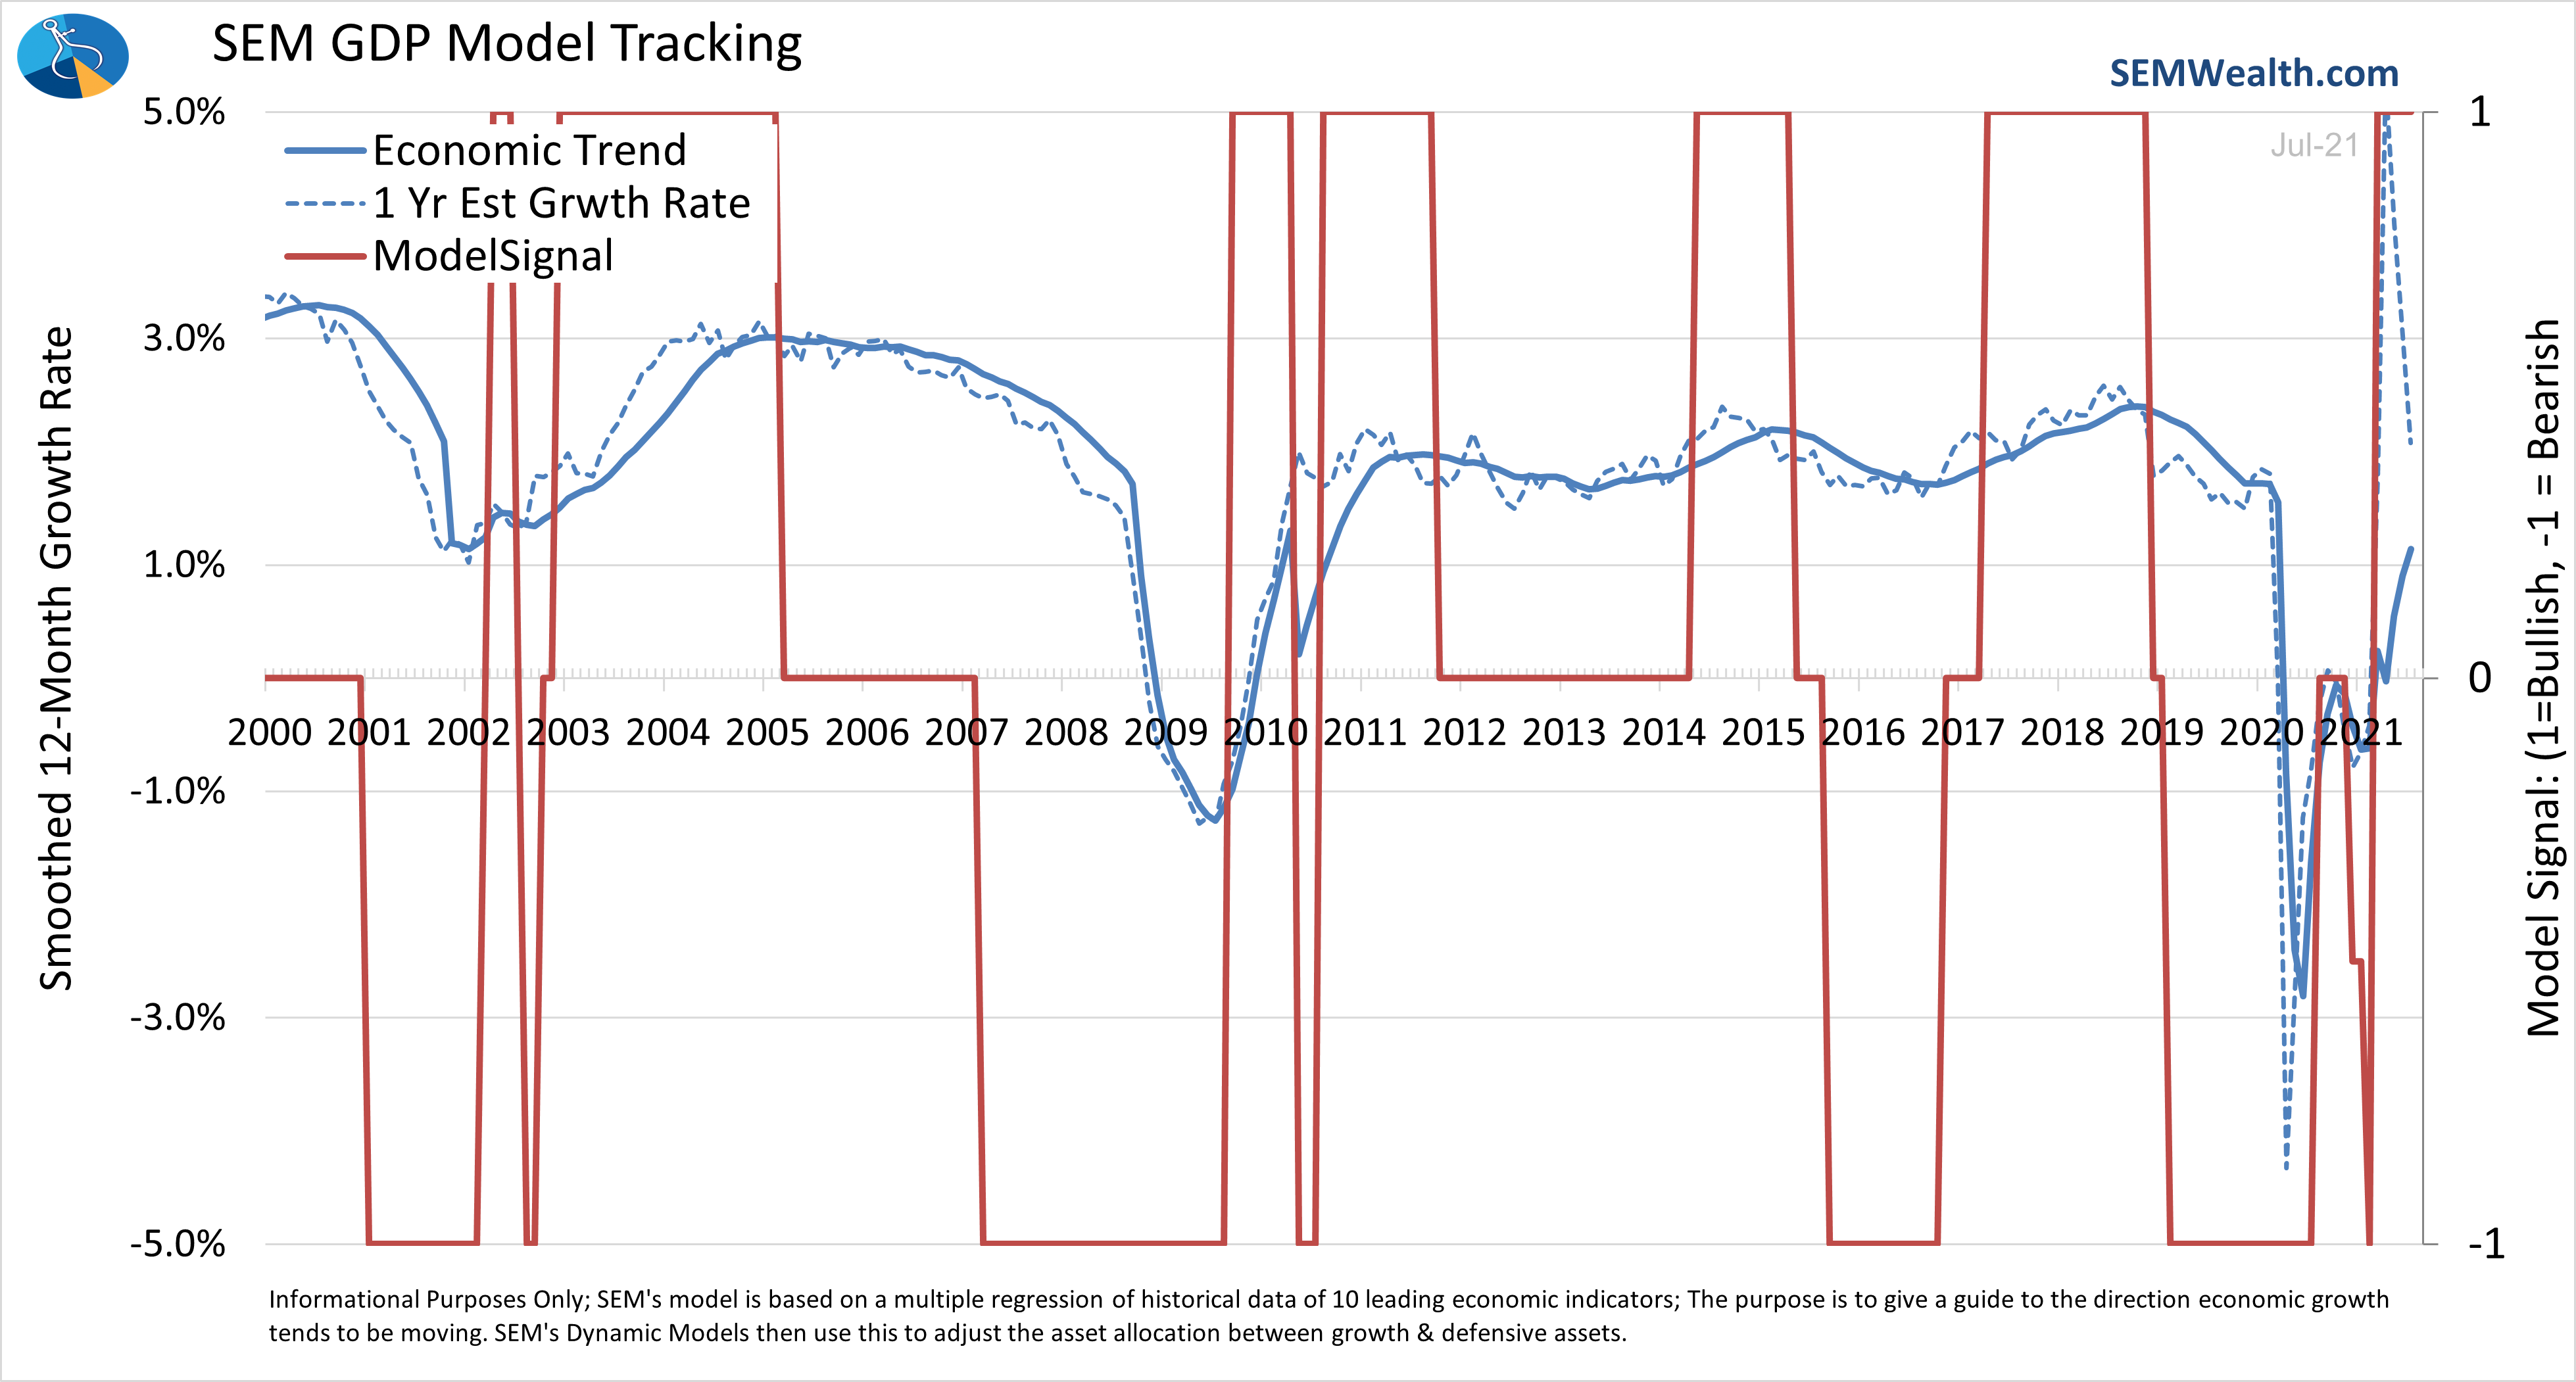
Wanting to participate in these gains is a natural thing, but as an investor it’s important to know that you can’t just participate in the gains part of the market, you have to participate in the entire market, which is not always going to be gains. Based on this, the decision of whether to “buy in” now should NOT be based on what the market is doing or what our economic data is showing us. Instead, you should remember what your investments are trying to do for your finances. Your financial situation will determine whether you CAN or SHOULD participate in the market. From there, SEM’s models will be able to manage what the market is telling us to maximize market participation based on your own financial situation, and the various programs that we have to offer are designed to work around your own situation.
Like the future Olympians quietly preparing for Paris, our models are working hard behind the scenes, ignoring all the noise with a laser focus on the ultimate goal, helping you meet your investment needs. This should give you the peace of mind that regardless of what bullish or bearish indicators are out there currently, SEM will not veer away based on constantly changing, nearing impossible expectations surrounding the market.
Jeff's Random Musings
It is easy to get lost in short-term economic data points. The market seemingly never goes down and when it does it seems to be back to all-time highs in a few days or at most a few weeks. On Friday everyone was celebrating the “better than expected” payroll report. While adding back and jobs is welcome, the number I’m watching closely is the Labor Force Participation rate.
Here is a long-term chart with the trends I see. We are back to 1970s levels. Yes some of that is caused by the pandemic, but this was happening pre-COVID.
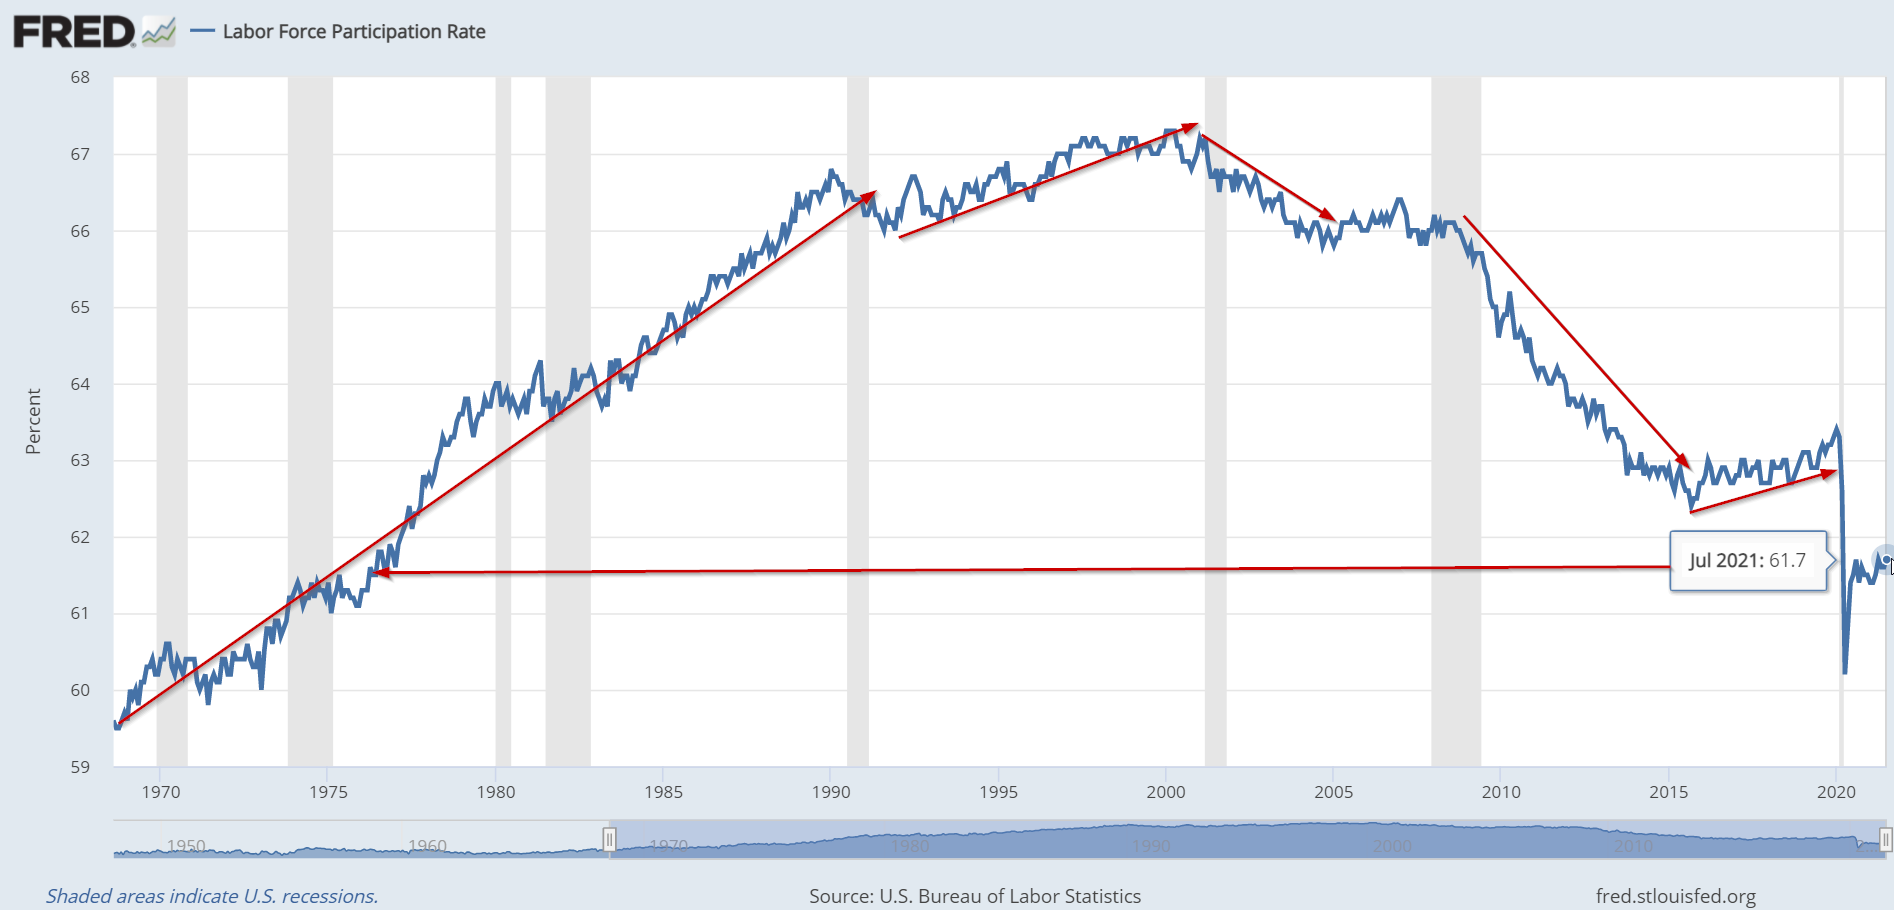
The reason I focus on this is the Potential GDP Equation, which states that over the long run the market cannot grow faster than the sum of the labor force and productivity. It really is quite simple – how many people are working and how much are they producing. All economic activity comes down to this equation.
When you expand this to the stock market, the long-term value of the market cannot exceed GDP + Inflation + Dividends. Over shorter periods of time you will see disconnects which are eventually corrected.
I won’t go into all the details today, but with all the talk of ‘infrastructure’ spending, extended unemployment benefits, inflation, government debt, taxes, and the future direction of our country I’ve been thinking about the Potential GDP Equation a lot lately.
Here is the 10-year chart:
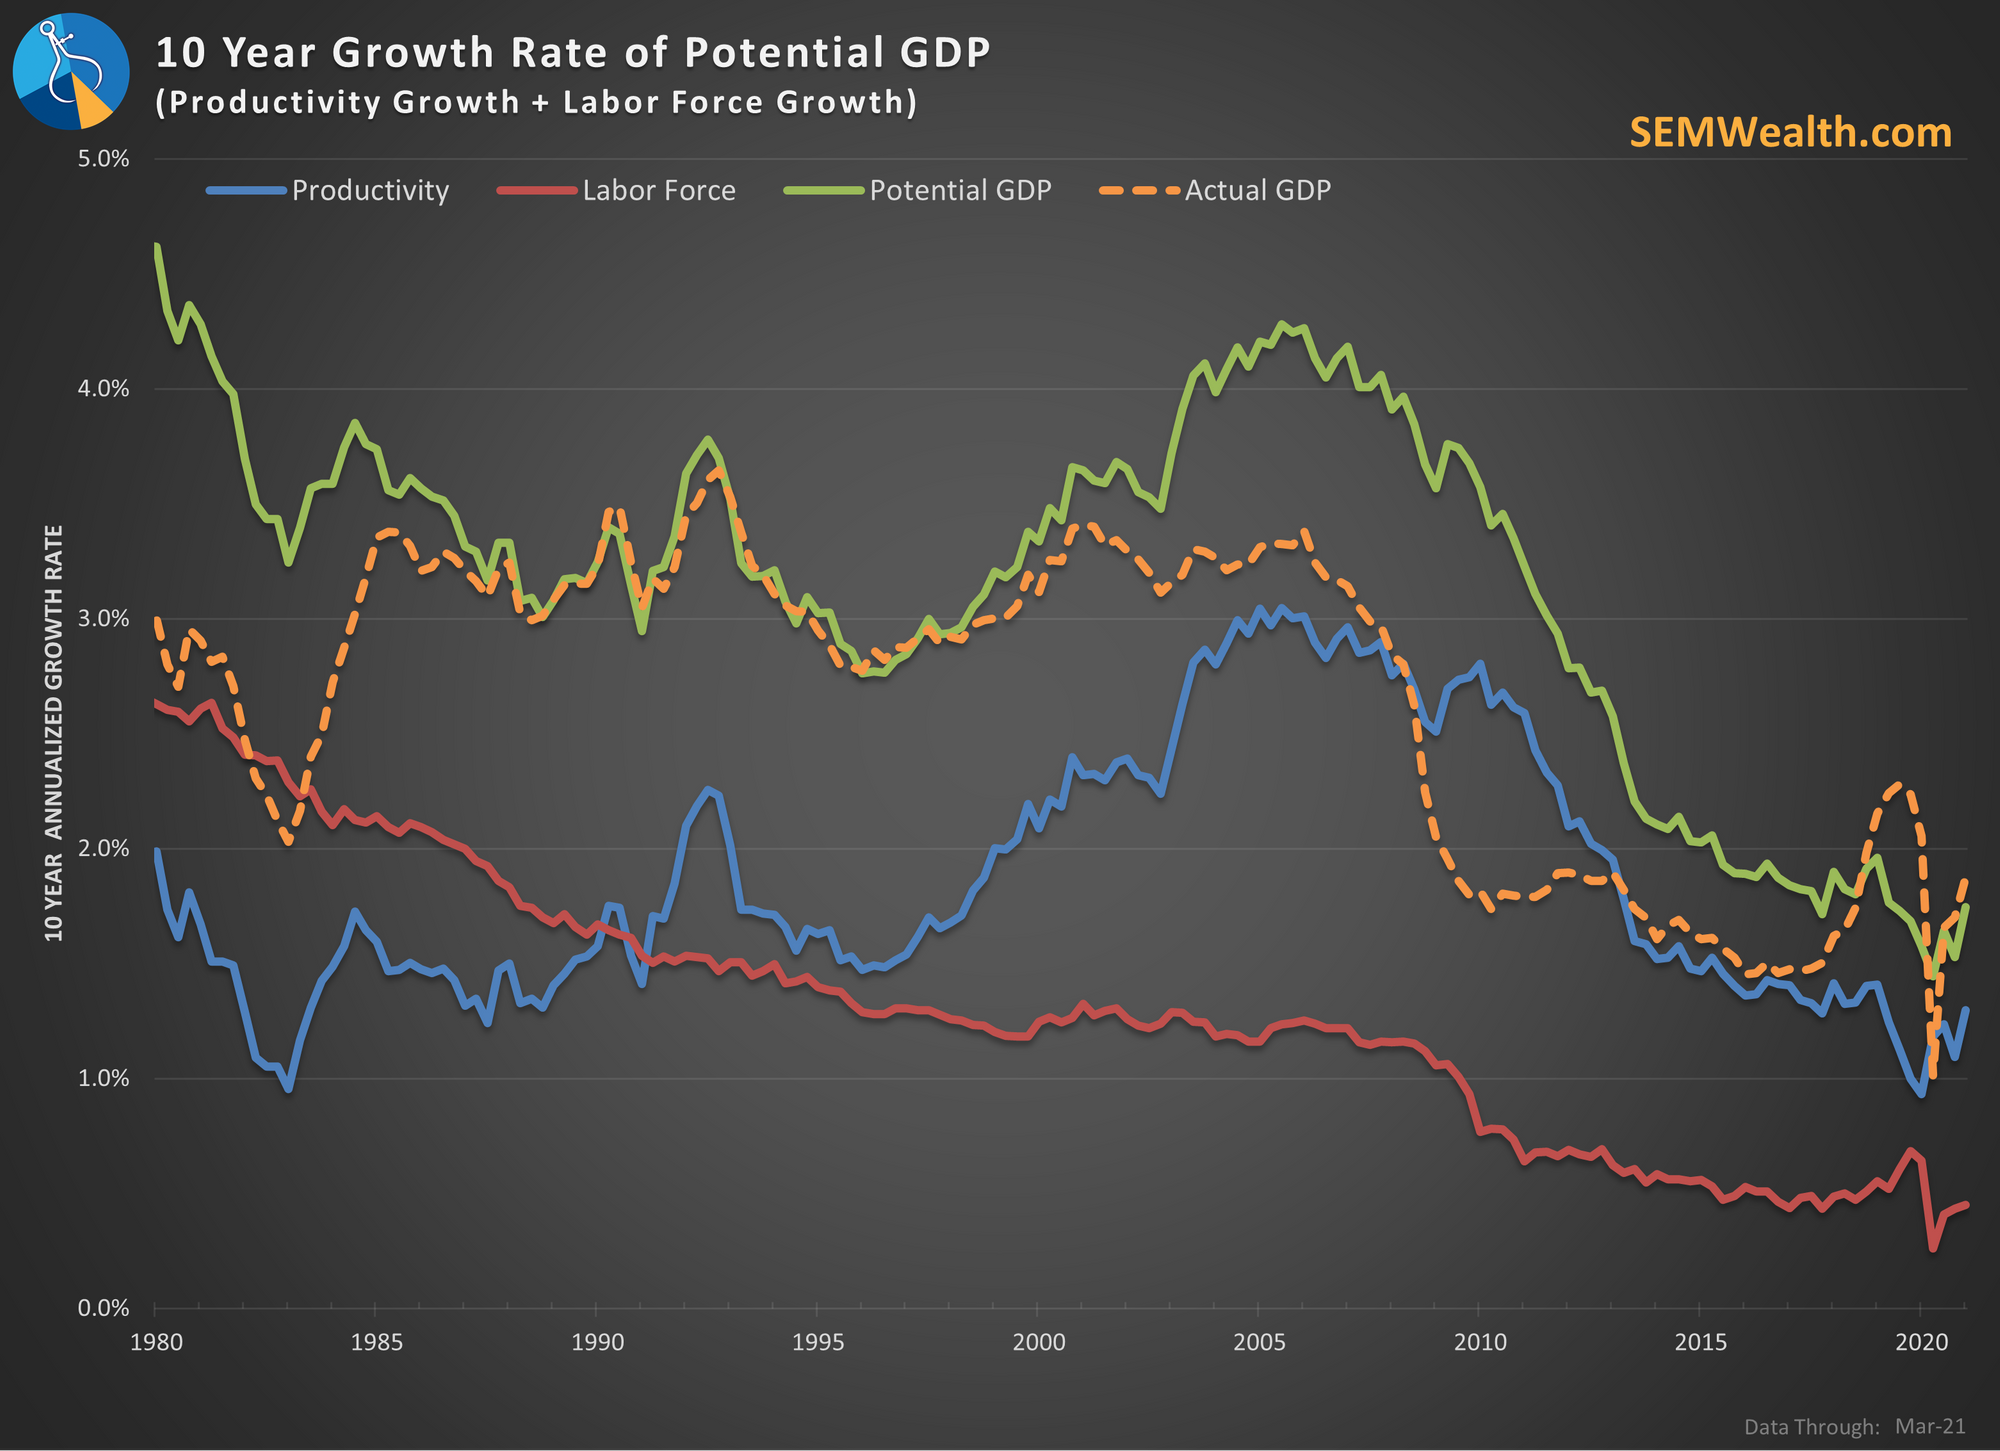
GDP growth rates have continued to decline over the long-term. You can see why in the chart. Productivity growth has not come anywhere near the levels we would need to see to combat our rapidly shrinking labor force.
Update: I've been pleasantly surprised about the jump in productivity the last year as that can help offset a shrinking Labor Force. Unfortunately on Tuesday we learned Productivity came in much lower than expected in the 2nd Quarter. We should have expected Productivity to slow as people return to in-person work, but if this trend continues, Productivity will again be too low to help support the economy.
Last week I touched on some of the concerns former Fed Governor Richard Fisher had about the future. One of them was demography. With the retirement of the Baby Boom generation and smaller account sizes with each subsequent generation, we simply do not have enough workers. As I’ve said throughout the last decade – we need to look at every political policy and ask, “does it increase our workforce and/or increase productivity?” If it doesn’t it is wasteful spending.


