The financial media likes to throw around a lot of Wall Street jargon as it makes it easier to tell the story of what they see happening in the markets. We've talked many times about the way they use a 20% threshold to determine whether or not we are in a bear or a bull market. While I take issue with that because the experience of a 20% drop or rally varies greatly based on the underlying economic environment, at least it is an easy way to define it.
What is not so easy is identifying a "bubble" in the market. This term is used because we've had two relatively recent bubbles which caused the S&P 500 to lose over half of its value twice in 8 years. With hindsight we all can say, "oh that was clearly a bubble," but people forget at the time the arguments being made to justify the stock market rising at an annualized rate 2-4 times its normal long-term pace. It was easy to get sucked in because the arguments made sense.
As one of the early adopters and benefactors of the technology revolution of the 1990s we can clearly say the developments of the 90s were indeed the game changers everyone thought they would be. The problem is most of the leaders of today were not even around in 1999. Here is a comparison of the top 10 S&P 500 stocks at the start of 2000 and today.
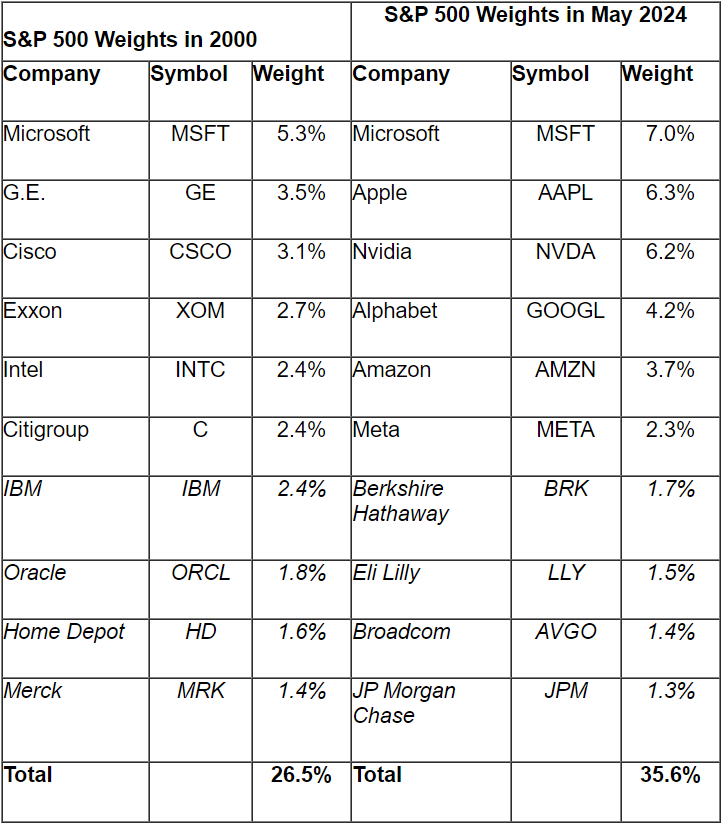
First, note the concentration of the top 10 today is nearly 10% higher than it was during the tech bubble. More importantly the top 6 stocks were 19% of the S&P 500 in 2000, but today are an astounding 30% of the overall index. You are not gaining any diversification in your portfolio if you have 30% of your money in just 6 stocks.
Microsoft is the only company to appear on both lists. While Microsoft has made an astounding recovery, investors in Microsoft at the start of 2000 would have been underwater on that investment for 15 years! Here's a look at the top technology stocks from 2000 and how they performed after the tech bubble burst.
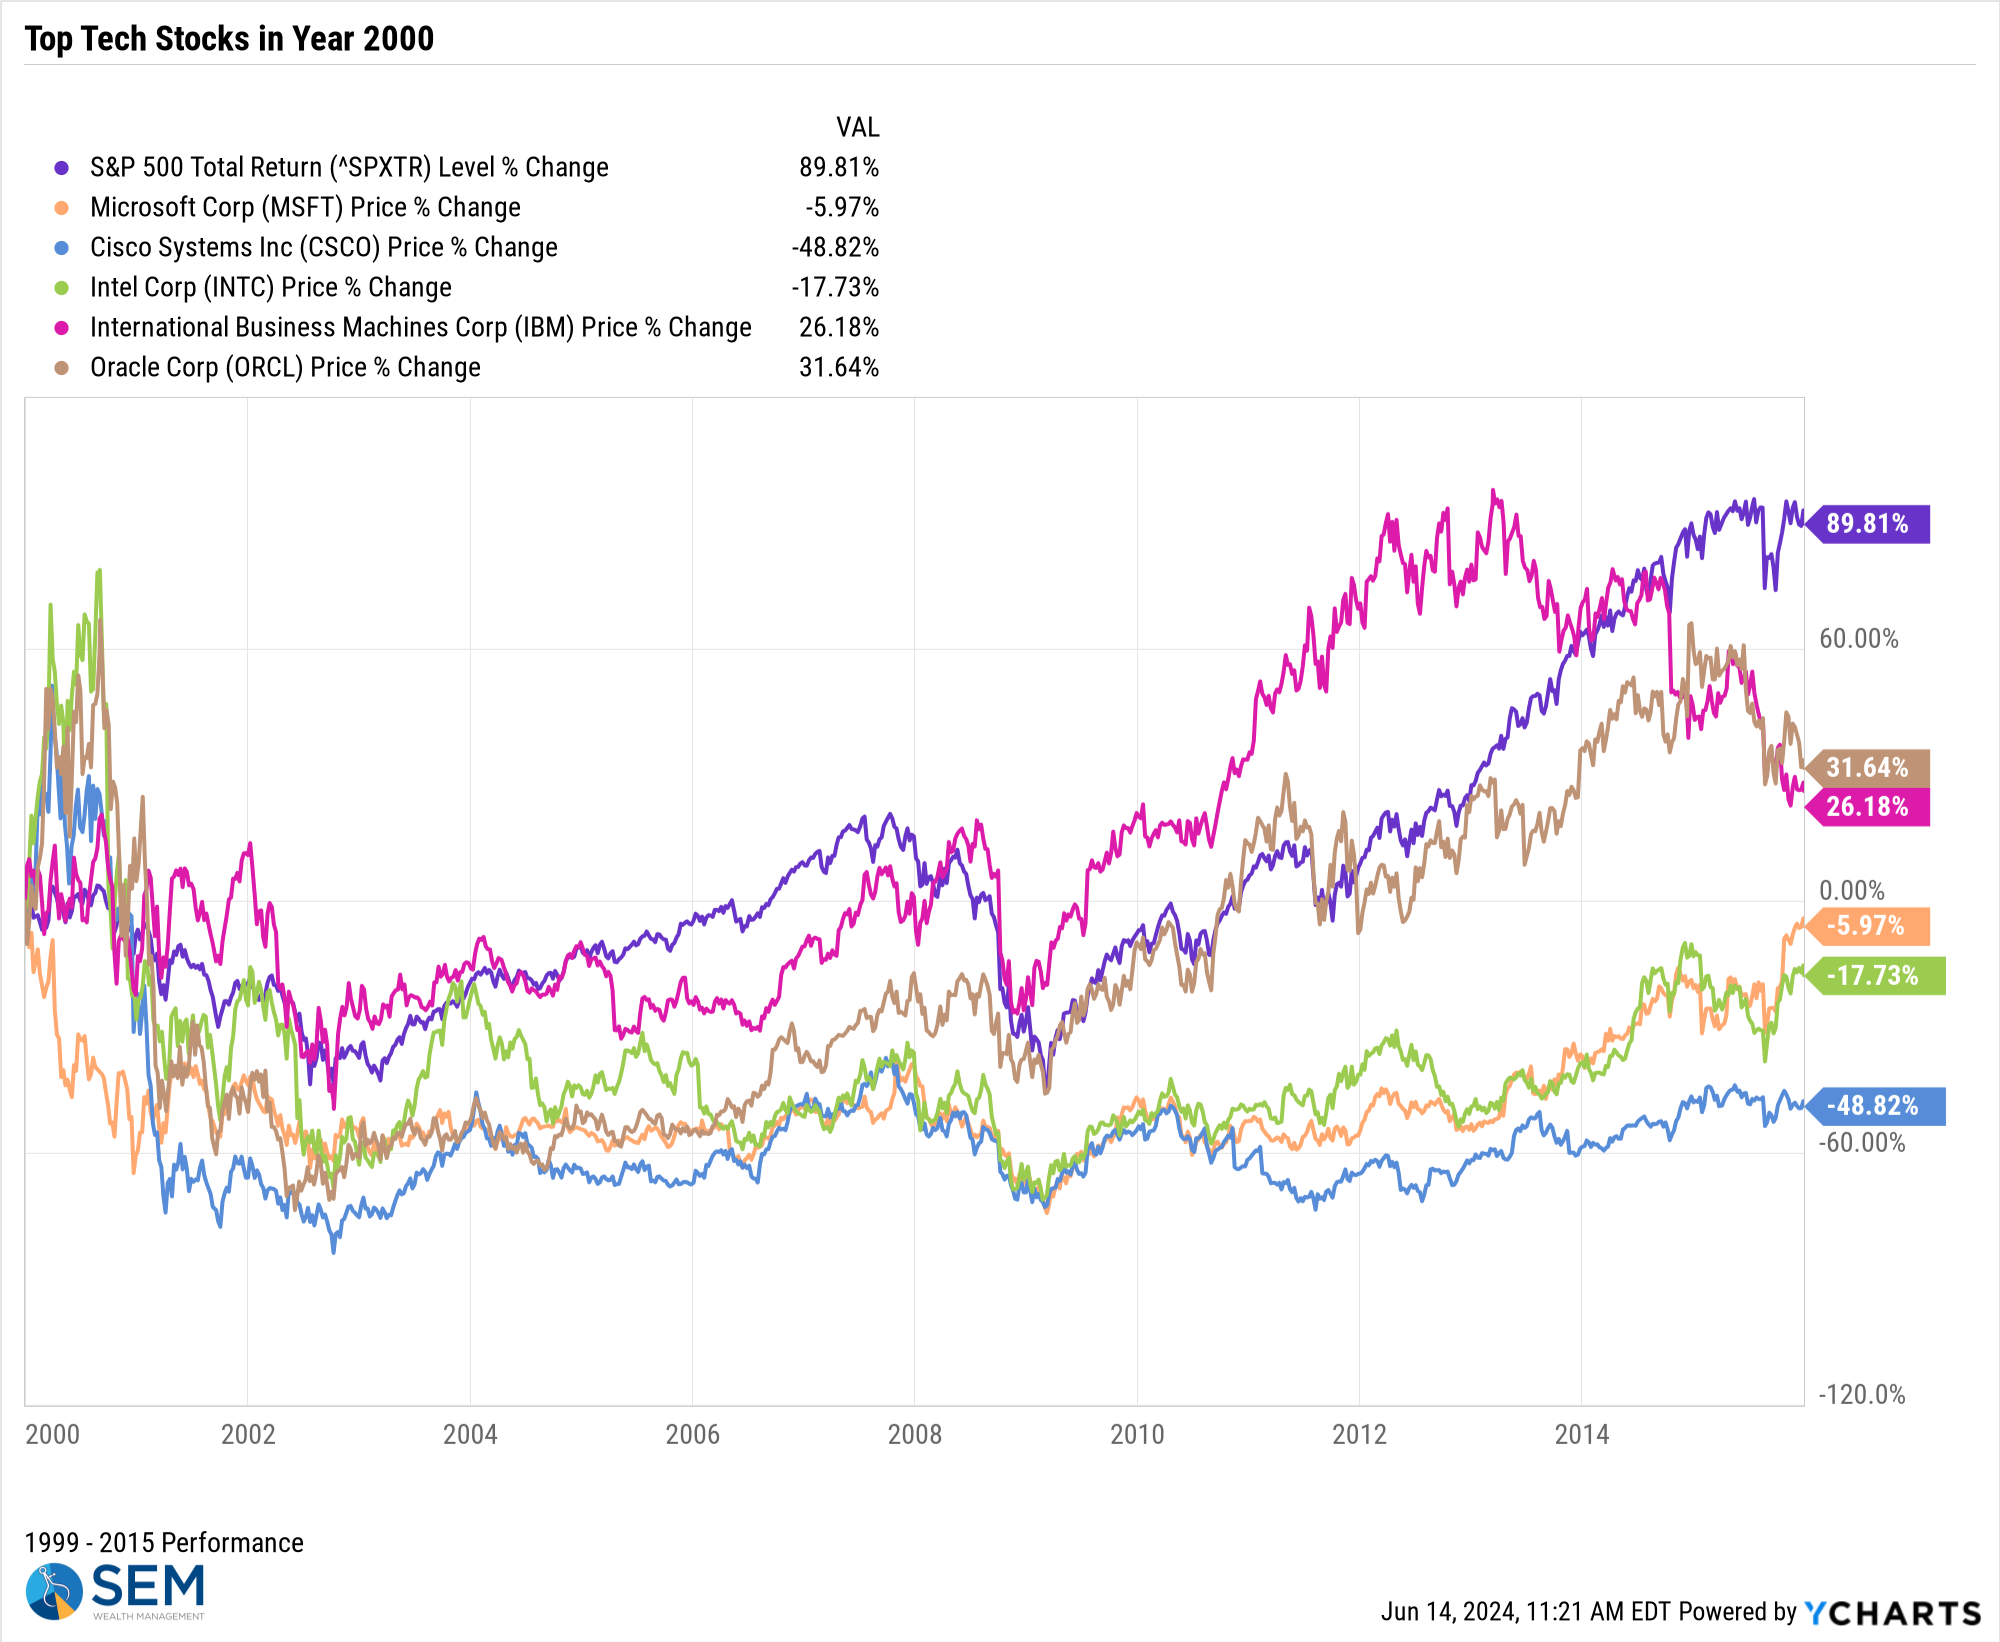
Oracle and IBM were the best performers, but still lagged the S&P 500 greatly. The most important takeaways from studying these names are:
1.) Today's leaders will not likely be tomorrow's winners
2.) In order to survive a company must be able to evolve
3.) The future doesn't work out like most of us expect it to
Point #2 is probably the most important – look at today's current leaders.
- Microsoft took 15 years to re-structure its business into the subscription services that power their profits today
- Apple's success story started with the announcement of the iPhone in 2004 to pivot from a very expensive computer seller to what it is today
- Nvidia was a fledging upstart graphics card manufacturer
- Alphabet (Google) was running from a garage in Menlo Park, California
- Amazon was an online book seller
- Meta founder Mark Zuckerberg was still in high school
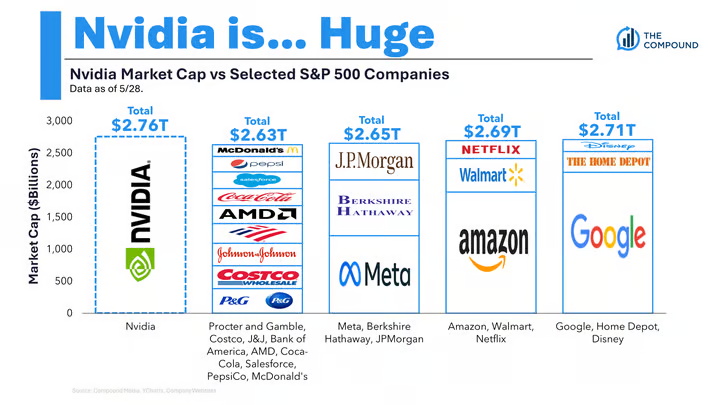
Here are some charts to help put today's market in perspective. I've seen various versions of this chart to put in perspective how much the market is valuing Nvidia. Nvidia currently has over 98% of the chip business for AI related equipment. They are essentially as valuable as all of their customers which means we have to assume:
1.) They will not lose market share
2.) Their customers will continue to increase their chip spending every year
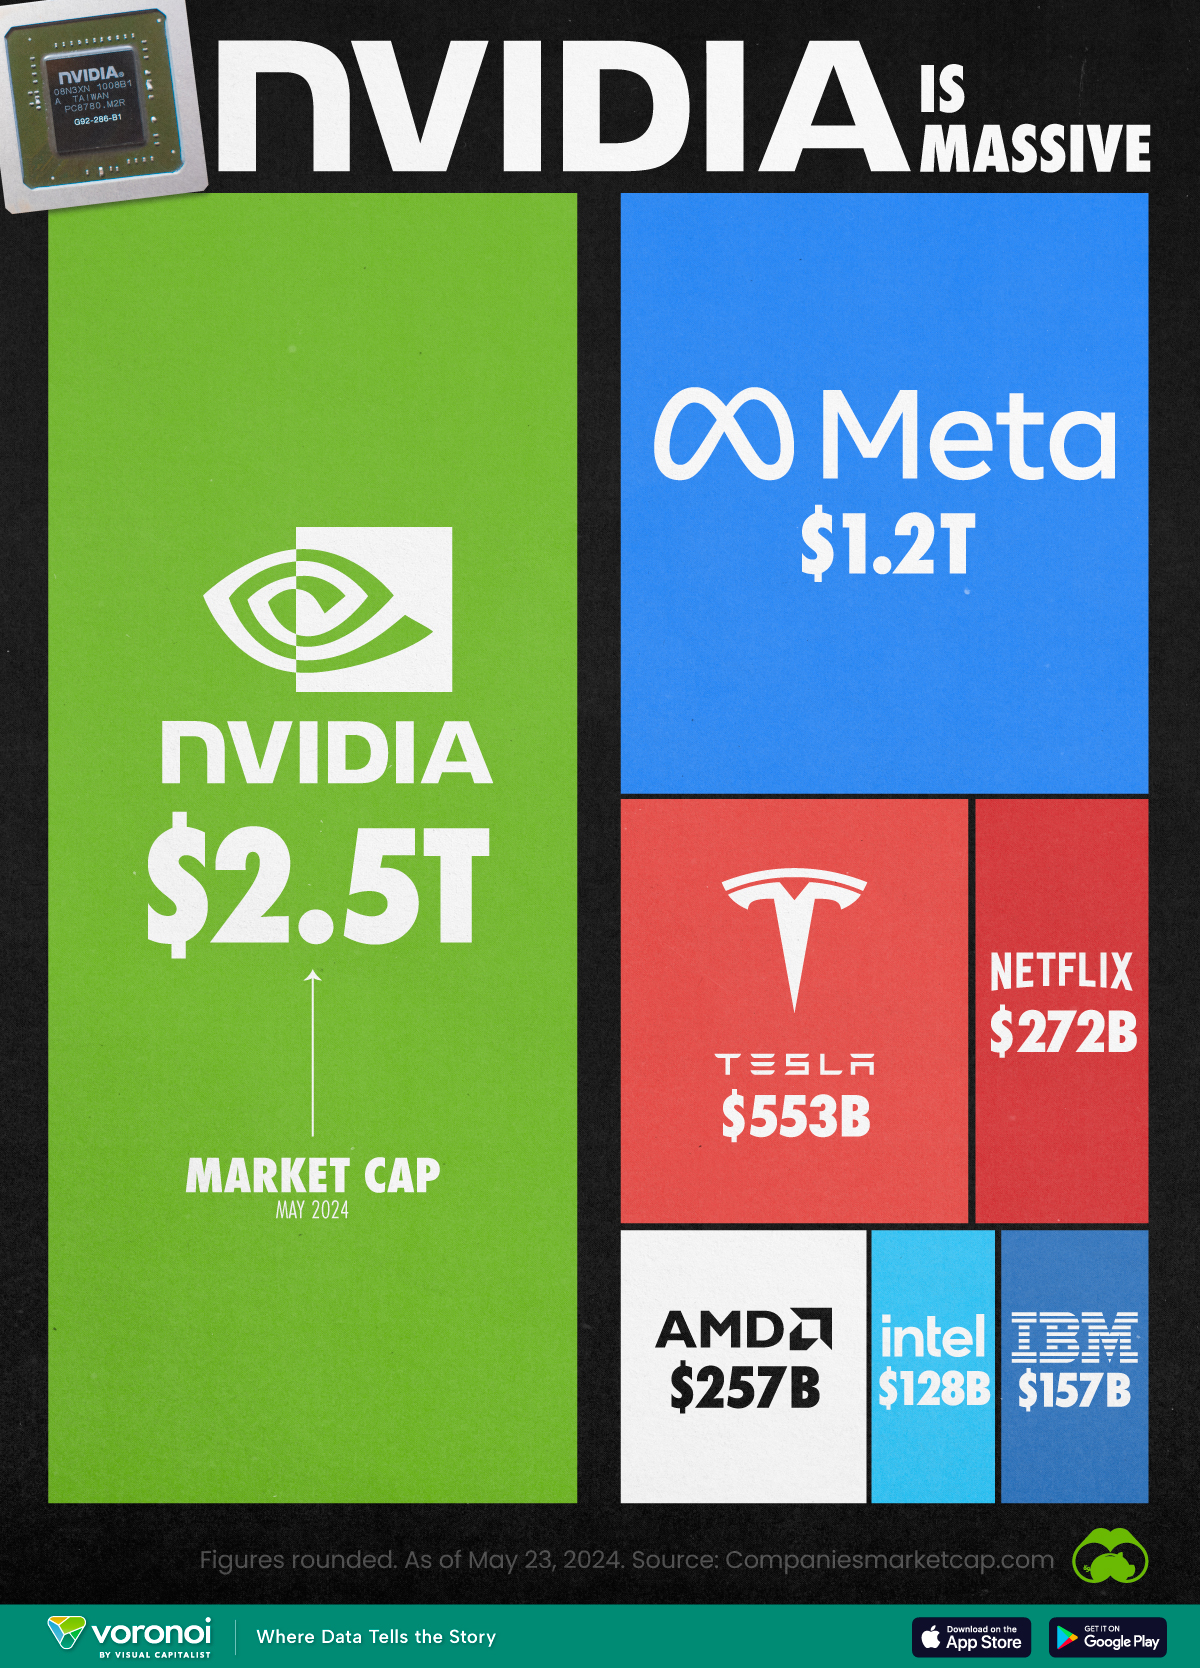
Here's another one:
I think Nvidia is a fantastic success story and I also believe the AI related technology they are powering will be a game changer for all of us. My question is how do we possibly support the assumed growth to justify one stock being worth this much. The lessons learned from the top 6 tech stocks of 2000 should be at the forefront of anybody who is increasing their allocation to AI related stocks.
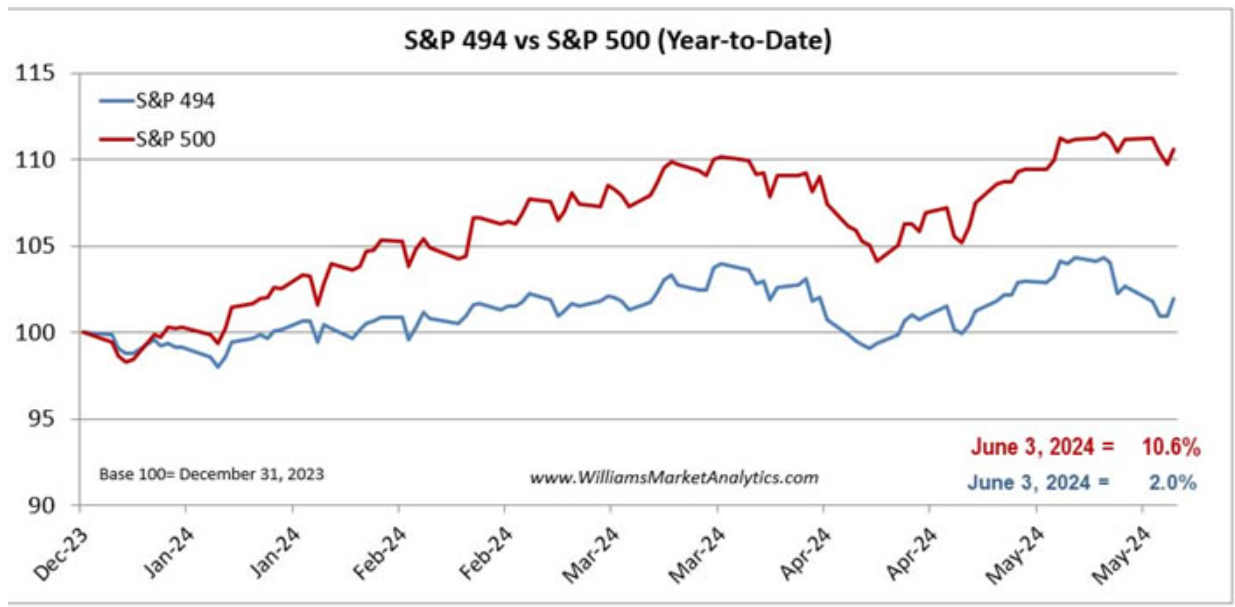
I saw some charts shared on Twitter (or I guess we're supposed to call it X now) and thought it was worth sharing. They compare the Top 6 tech stocks in the S&P to the other 494 stocks. While we are all celebrating and enjoying the seemingly daily all-time high closes for the S&P 500, the S&P 494 continues to lag below the peak of 2021.
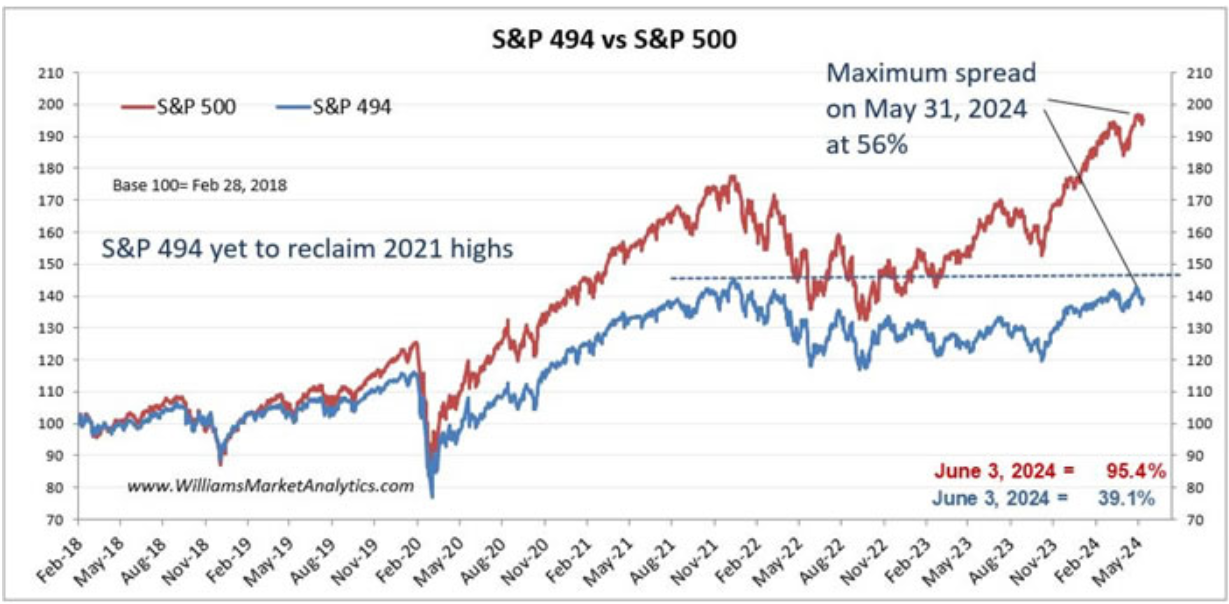
In 2024 the top 6 tech stocks account for an astounding 81% of the year-to-date gains.
Let's look at the chart of the top 6 tech stocks in the year 2000 again.
- Did the promises of technology end up changing our economy for the better? Yes
- Did the companies who were leaders in the 90s survive the bubble bursting? Yes
- Did investors pay the price when economic growth could no longer justify their valuations? Yes
I'll add two more points from my intro above:
4.) The S&P 500 index ended up correcting itself and proved to be the better performer than any of the top 6 tech companies.
5.) The over-concentration of the S&P 500 brought 50%+ declines when economic growth could no longer support the unrealistic expectations that led to the bubble.
I think that is important for today's market. Long-term investors, so long as they are not chasing technology individual stocks or allocating additional money to the technology sector should end up not being hurt.....over the long-term.
The trick is:
a.) Not being sucked into the latest tech mania (AI)
b.) Ensuring your financial plan and cash flow strategy along with your investment personality can withstand a 50% decline in the stock market.
As we do each week, we discuss the current market environment in the sections below. The key is we are enjoying this market rally as much as possible with a close eye on the exit strategy. Bubbles are fun and can go on longer than any sane person believes is possible, but they also can end abruptly on what at the time seems to be insignificant data.
Market Charts
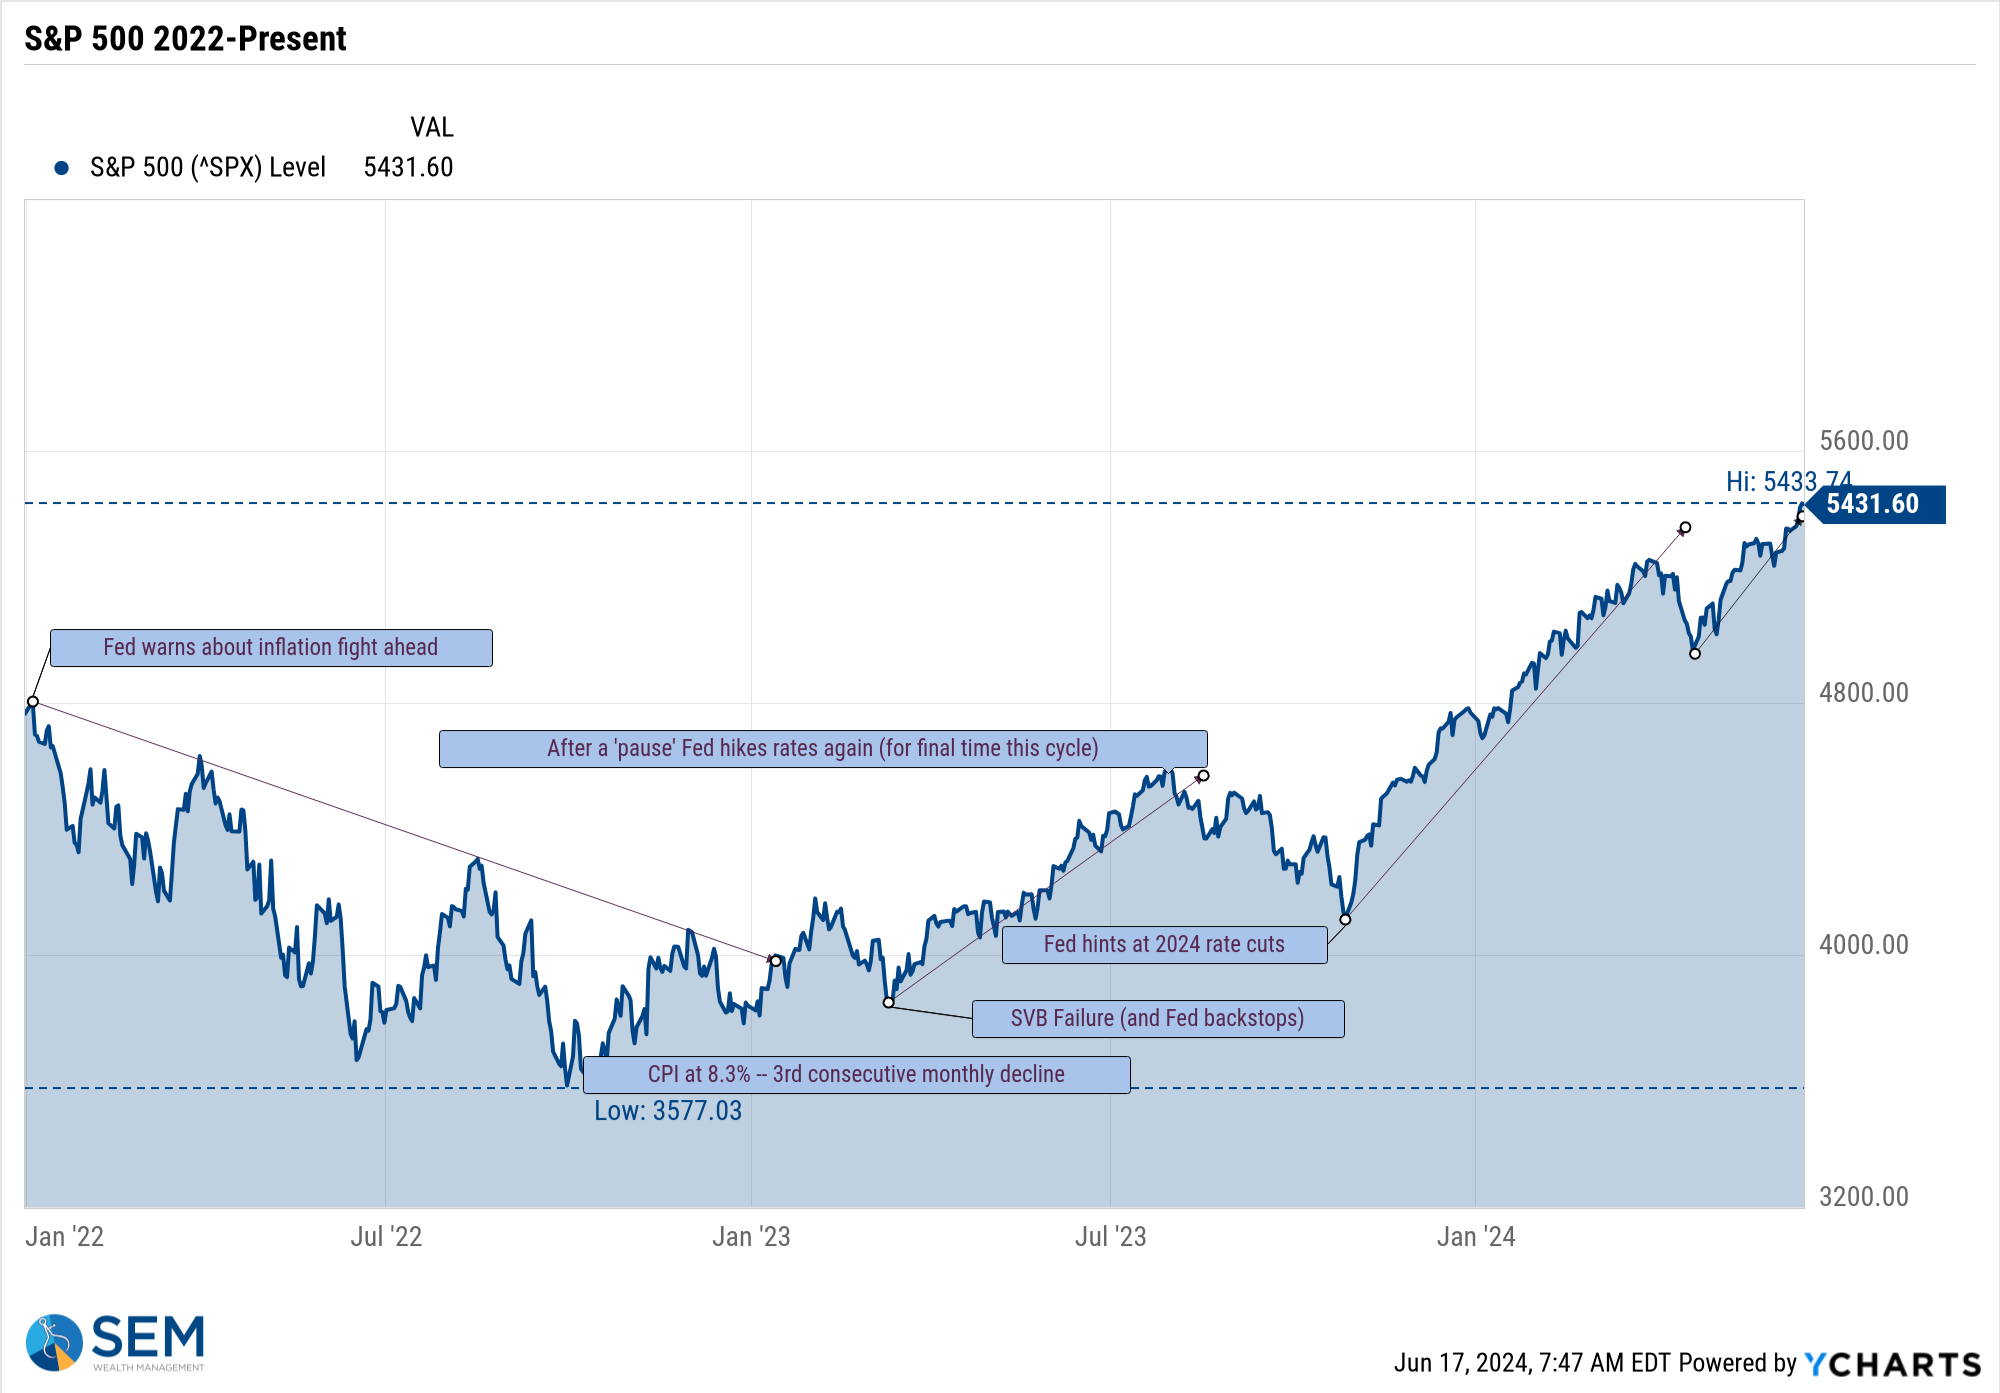
Despite the above concerns, I'll sound like a broken record – all-time highs tend to lead to new all-time highs.....................until something changes the trend. Human behavioral biases take over when the headlines talk about fresh all-time highs which leads to more money coming in from the sidelines. However, because this is fresh money which was chasing stocks higher and did not enjoy the long run-up this money is more prone to exit quickly when the market stops making all-time highs. At the same time you have people who have ridden the market up worried about losing their gains so selling can come quickly.
This is why I prefer our quantitative approach. There is no guessing. We won't get out at the top, but we have pre-planned, battle tested mechanisms designed to exit when the trend ends. As noted in the "SEM Model Positioning" we are enjoying this rally...........for now.
Mega cap tech stocks continue to drive the S&P 500 higher.
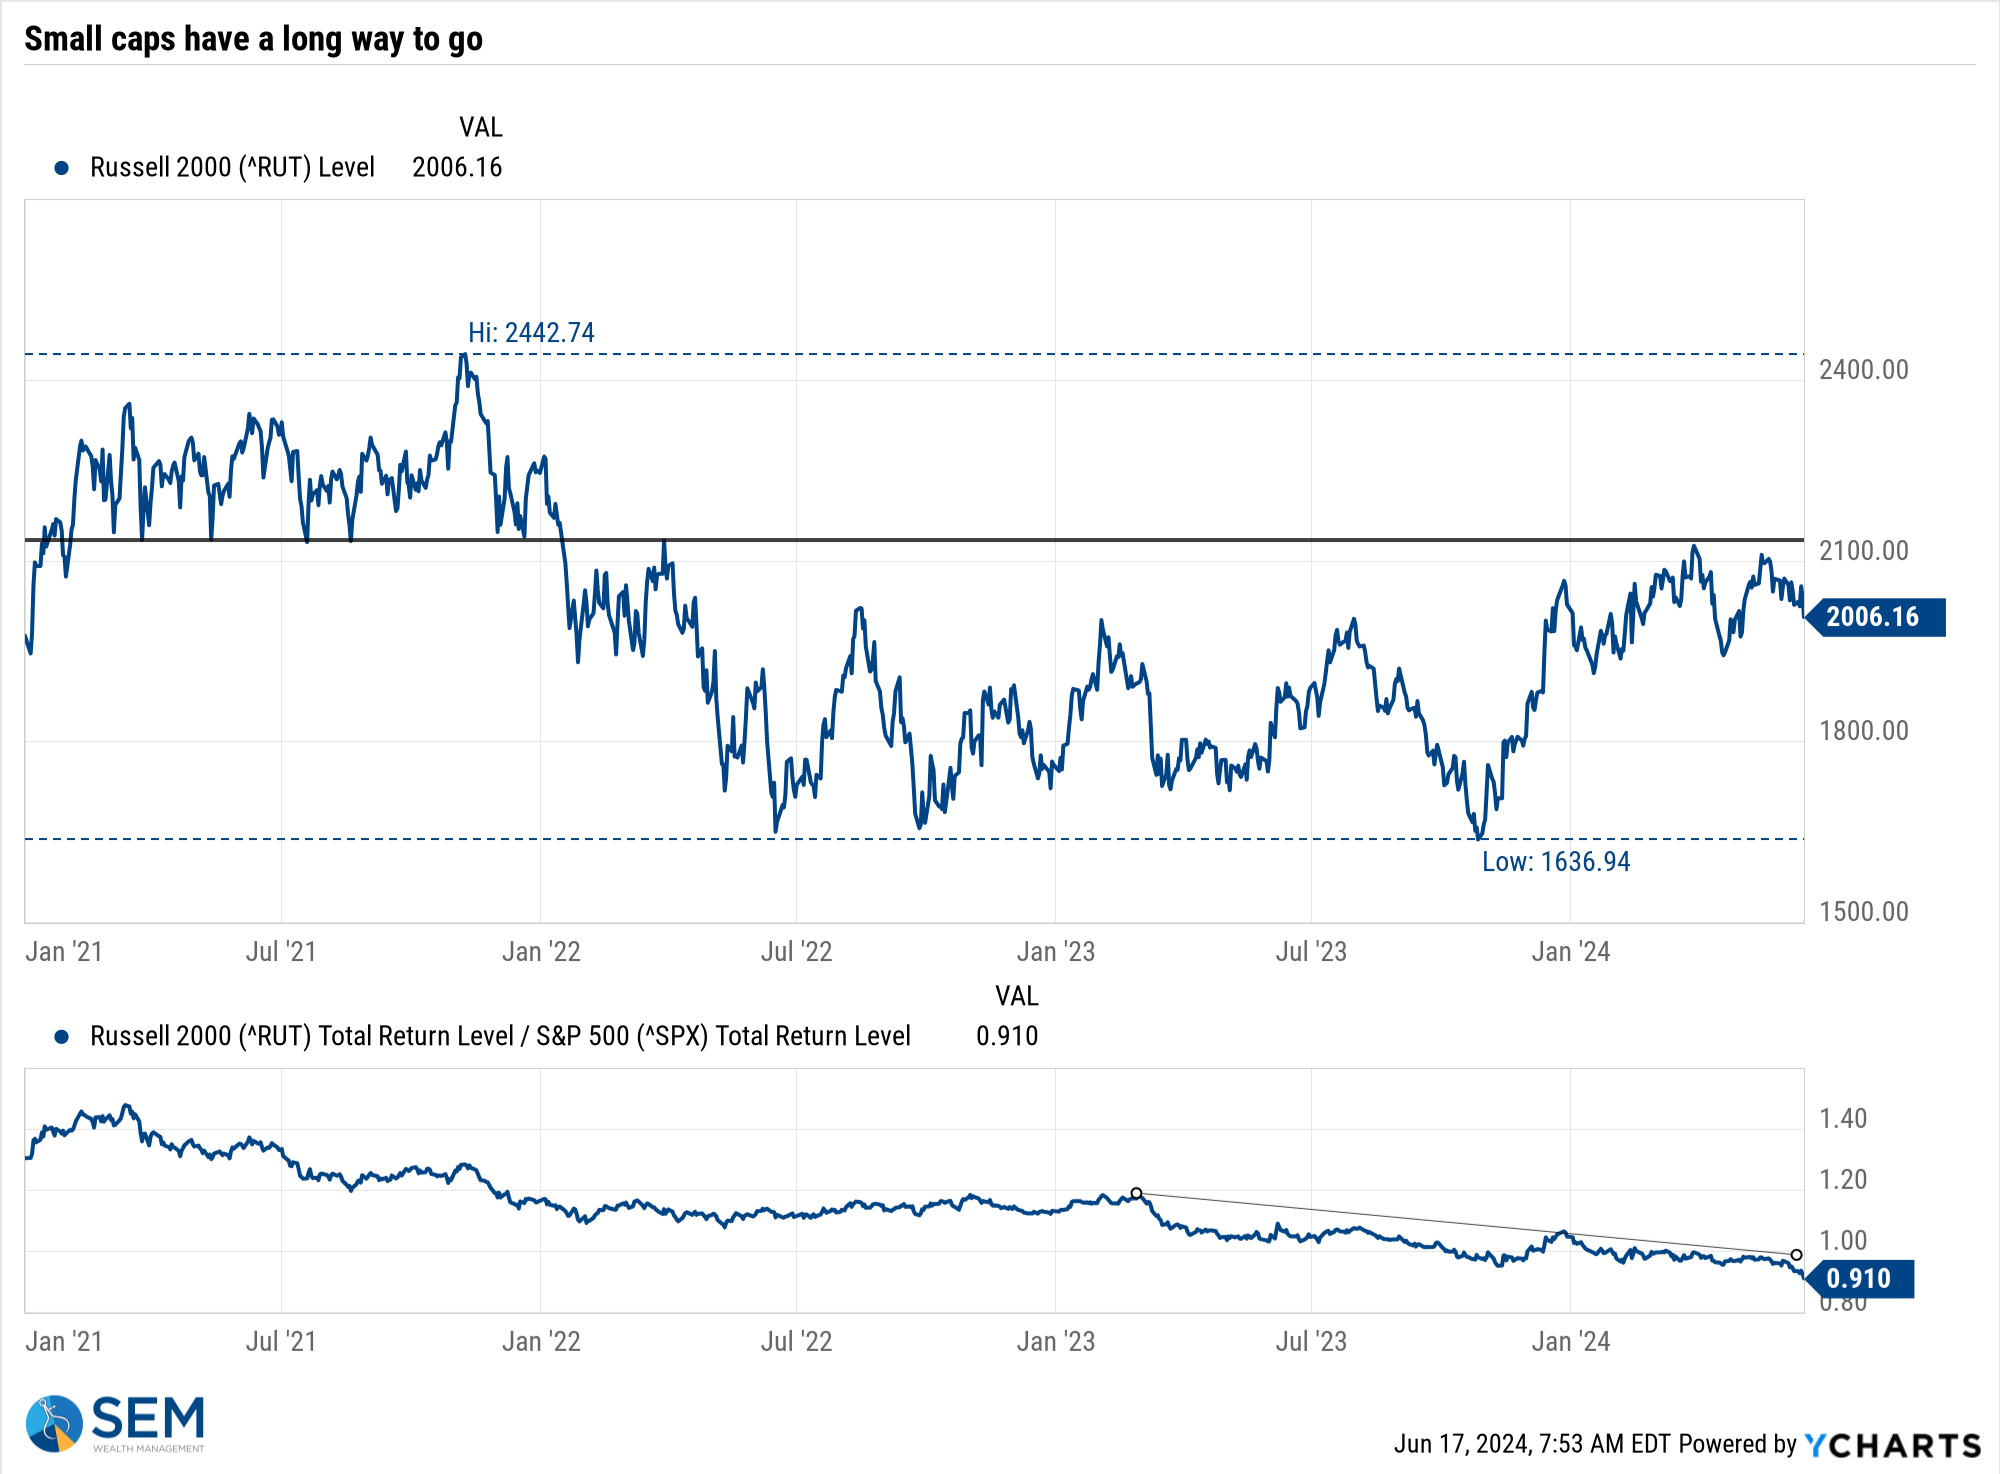
Small caps, however continue to lag, which is not an endorsement for the economy nor is it a healthy LONG-TERM investment environment. We need innovation and NEW ideas which can generate strong growth. It is mathematically impossible for the "Power 6" which has been driving stocks higher the past 18 months to generate the type of growth to justify their current valuations. Until we see small caps start to outperform large caps (bottom section of the chart below), this rally is a TRADING opportunity, not an INVESTMENT opportunity.
At the end of May I mentioned some polls showing how nearly half of Americans believed the stock market was DOWN for the year (with the S&P 500 up 11%).

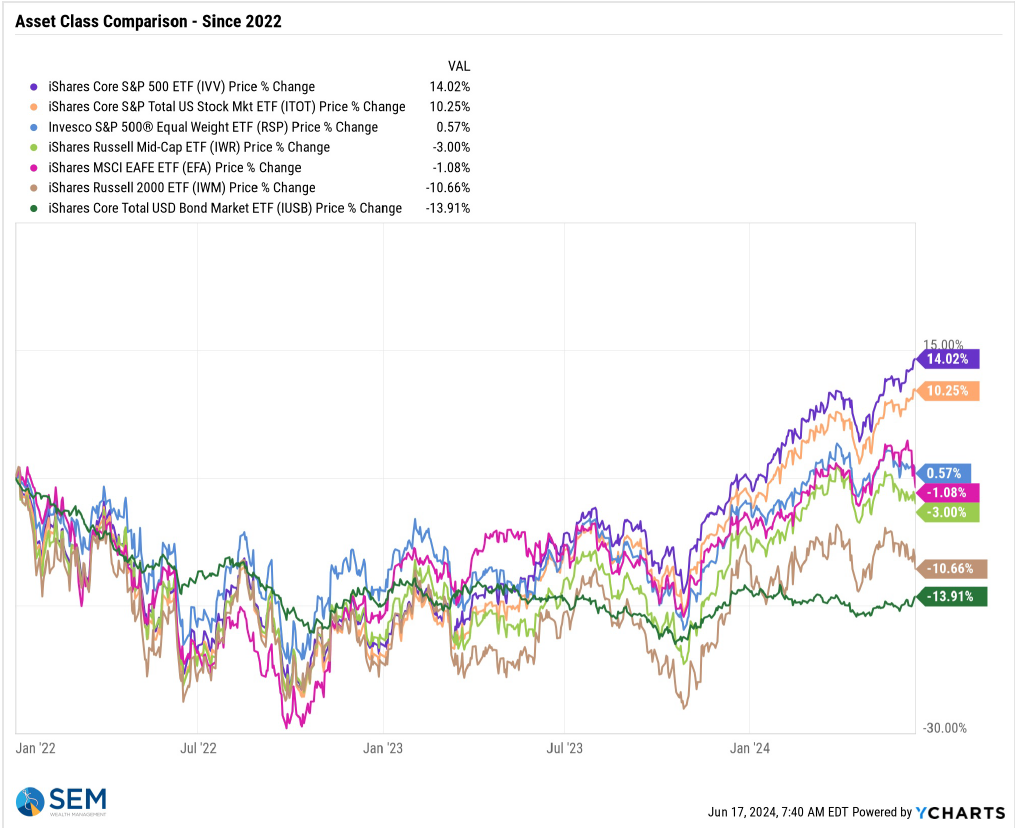
As I discussed this the past few weeks with advisors and clients, it occurred to me this is likely because most Americans who have investments are actually diversified, owning more than just Mega-cap Tech stocks/S&P 500. Mid & small caps continue to be underwater from their 2021 highs. Bonds are still down 14% from their highs. So a prudent investment strategy, one which involves not risking most of your money in a handful of stocks means you're not doing as well as the headlines. Again, this is a problem from an INVESTMENT standpoint and a knock on the economy.
By the way, we'll be discussing this in our next SEM University coming up on June 26. Click here for the details.

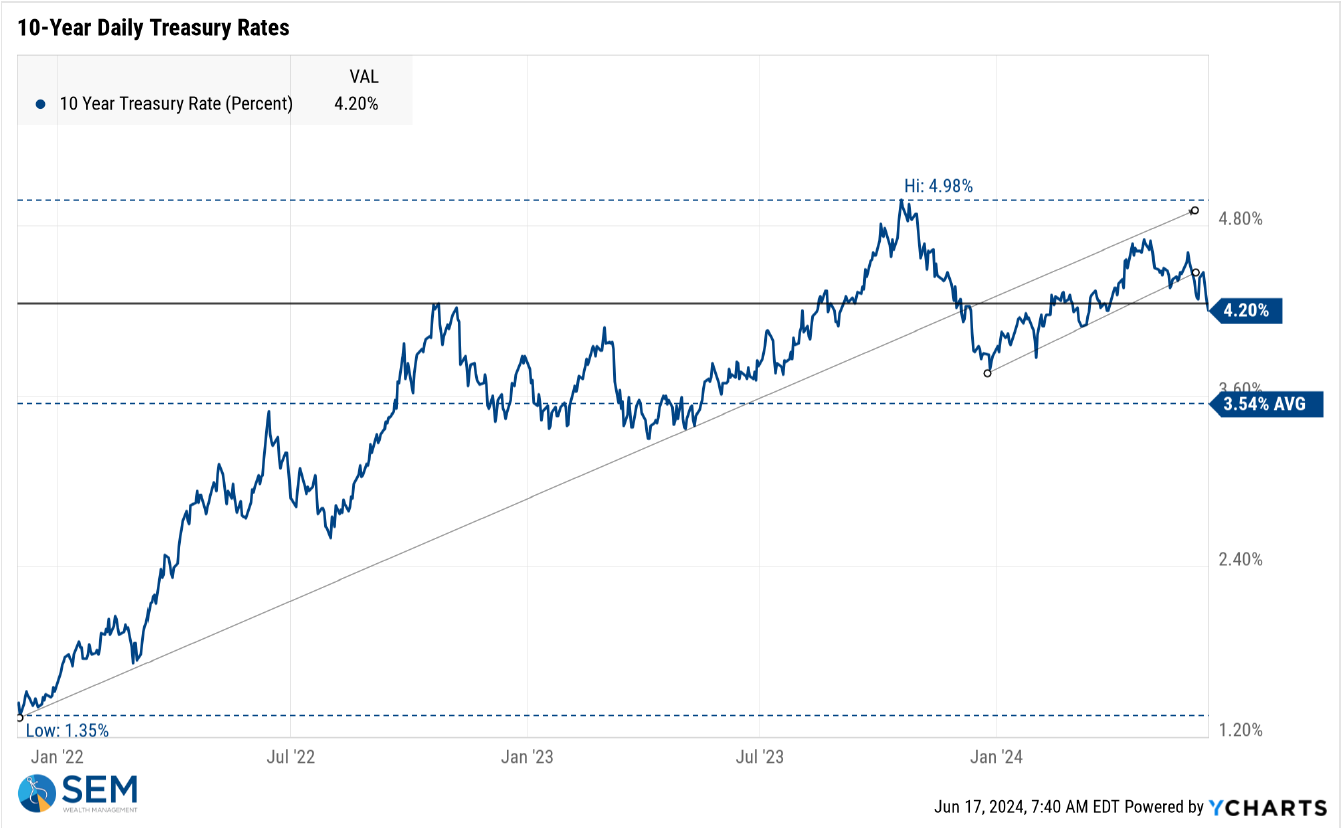
On the plus side, the bond market lowered long-term interest rates last week, clearly breaking the uptrend in rates. Our dynamic models had moved to a 'neutral' positioning on interest rates at the start of June. A new downtrend in long-term rates would be a welcome sign and could be helpful for the economy overall.
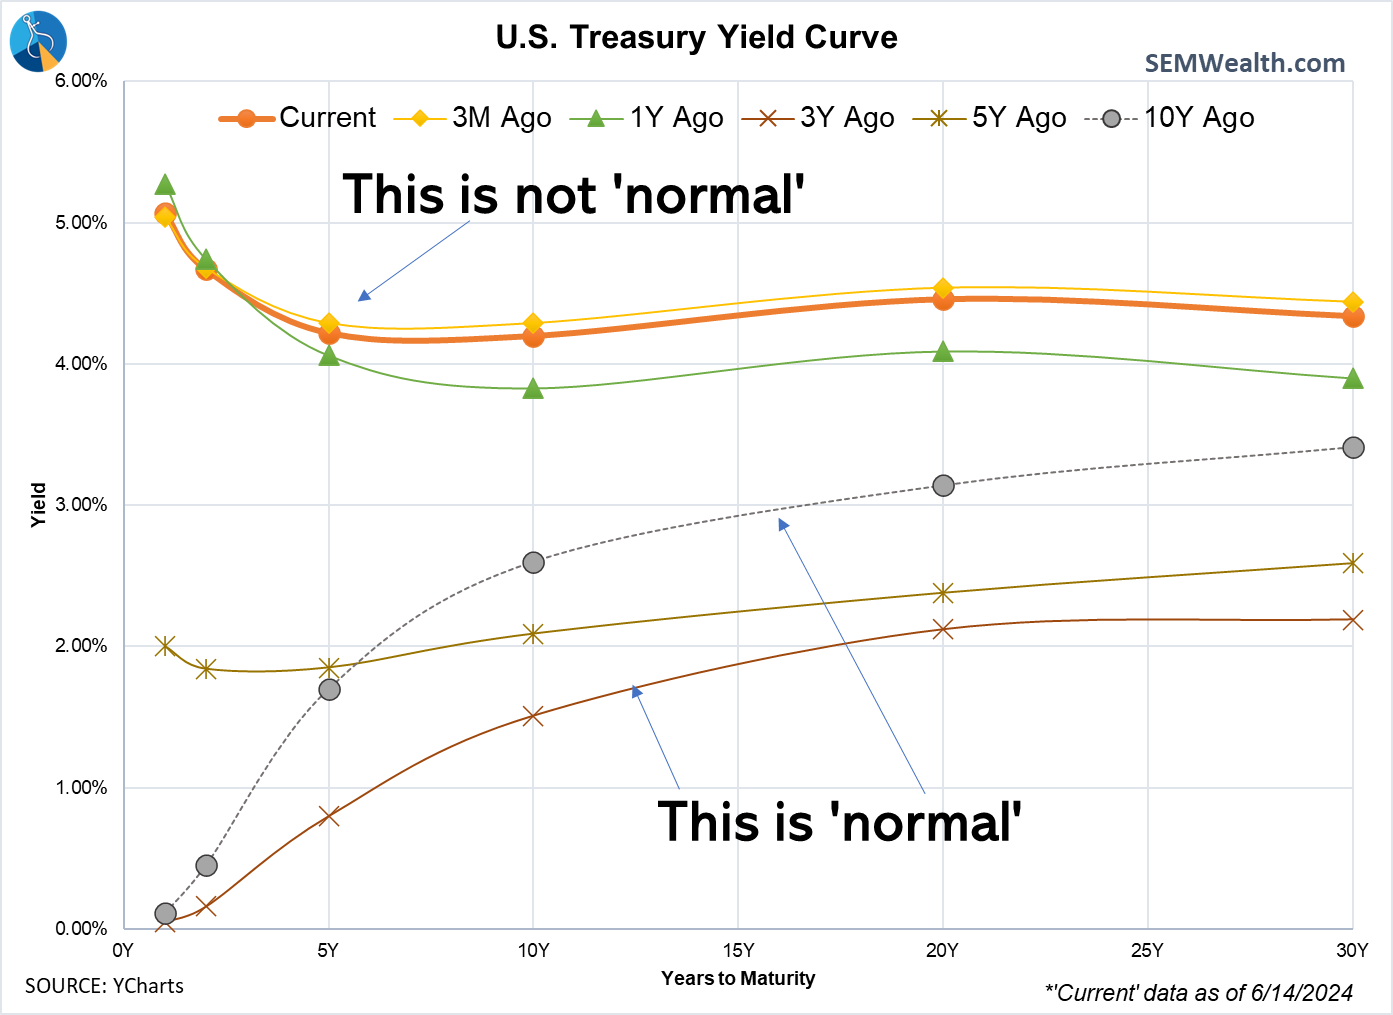
Most people forget this one key point: The Fed controls SHORT-TERM interest rates. The 'free' market controls the rest of the duration curve. What the bond market says is more important than what the Fed says. Here is a look at the various interest rate durations this year.
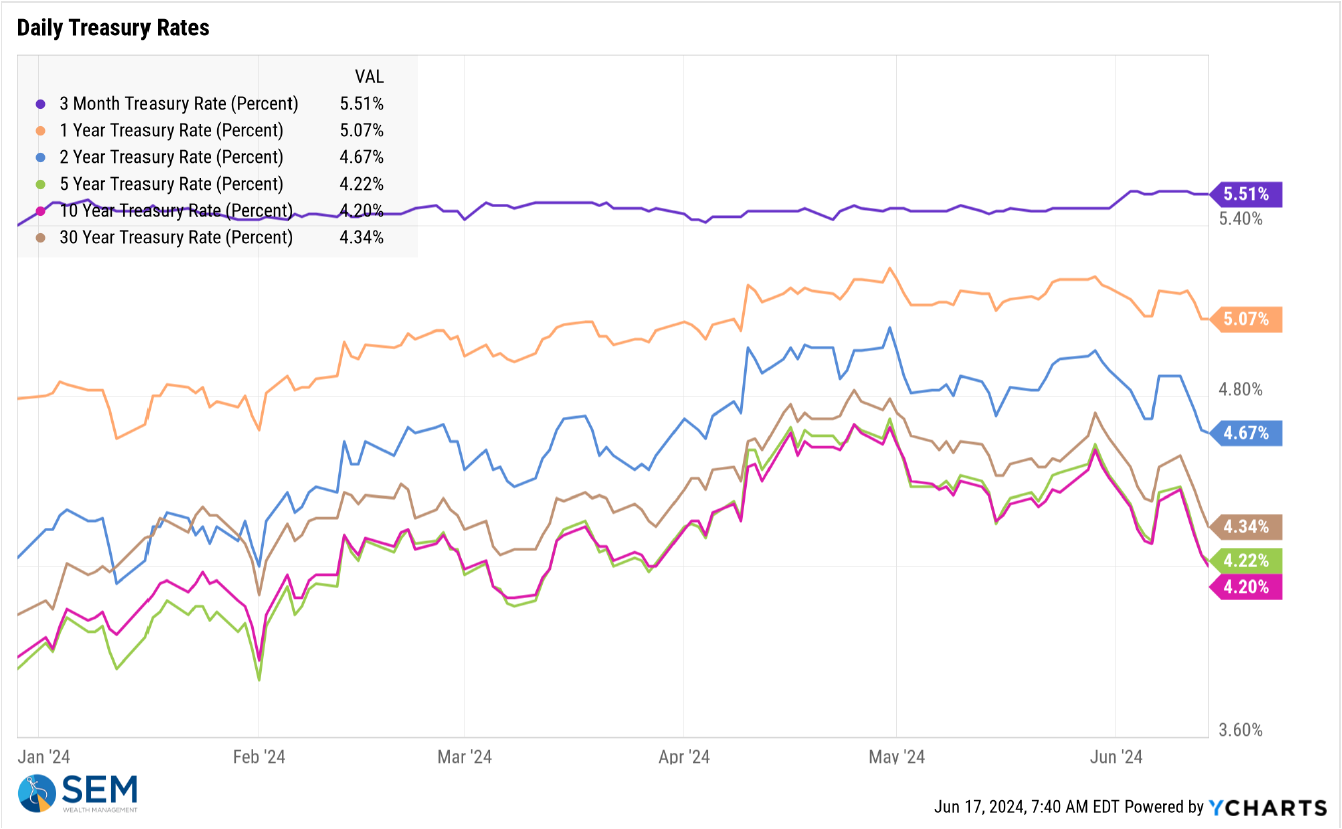
While the yield curve is still not 'normal', it has shifted slightly below where we were 3 months ago. Note rates are still above where we were a year ago. Until rates normalize, bonds are likely to remain volatile.
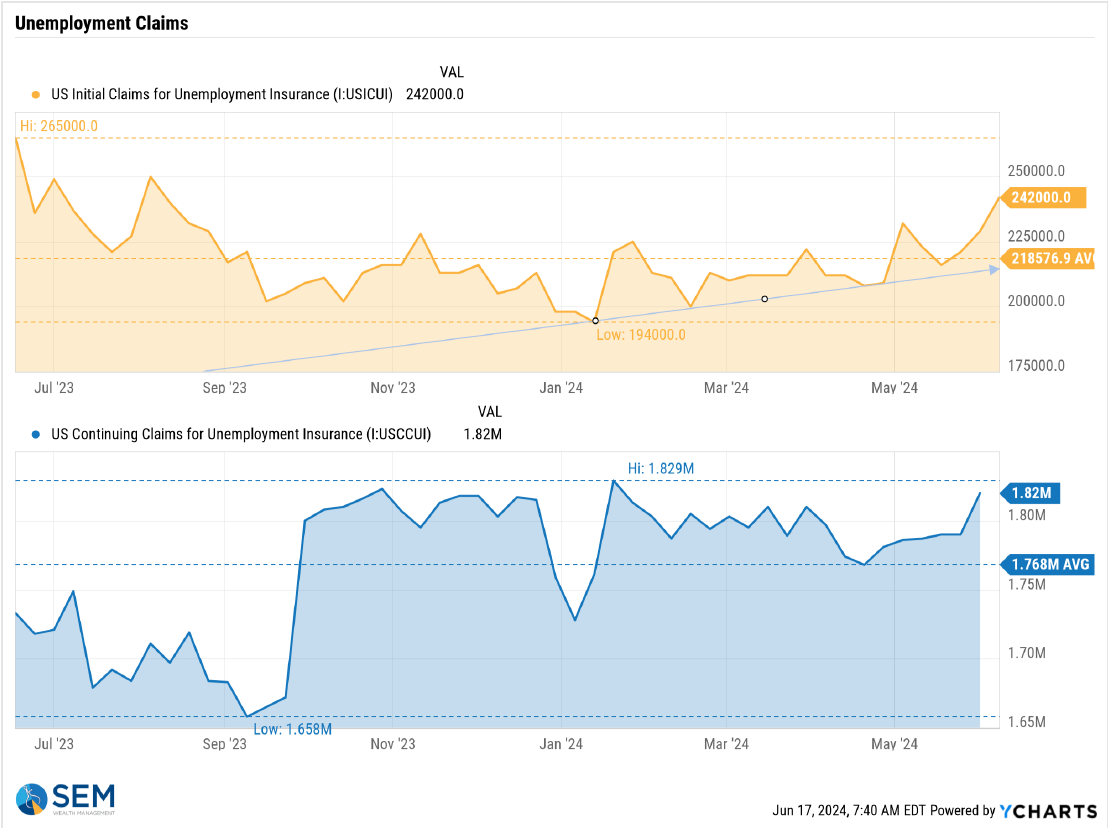
One point of concern is the fact 'bad' news for the economy may not necessarily be 'good' news for the markets. As we should have learned by now, the Fed is not capable to identify problems in the economy soon enough to prevent a recession. If we see a decline in the labor market, the bottom could fall out on the economy and thus the earnings growth of the "power 6" stocks driving the S&P 500 higher. I continue to watch this indicator closely every Thursday when it is released.
SEM Model Positioning
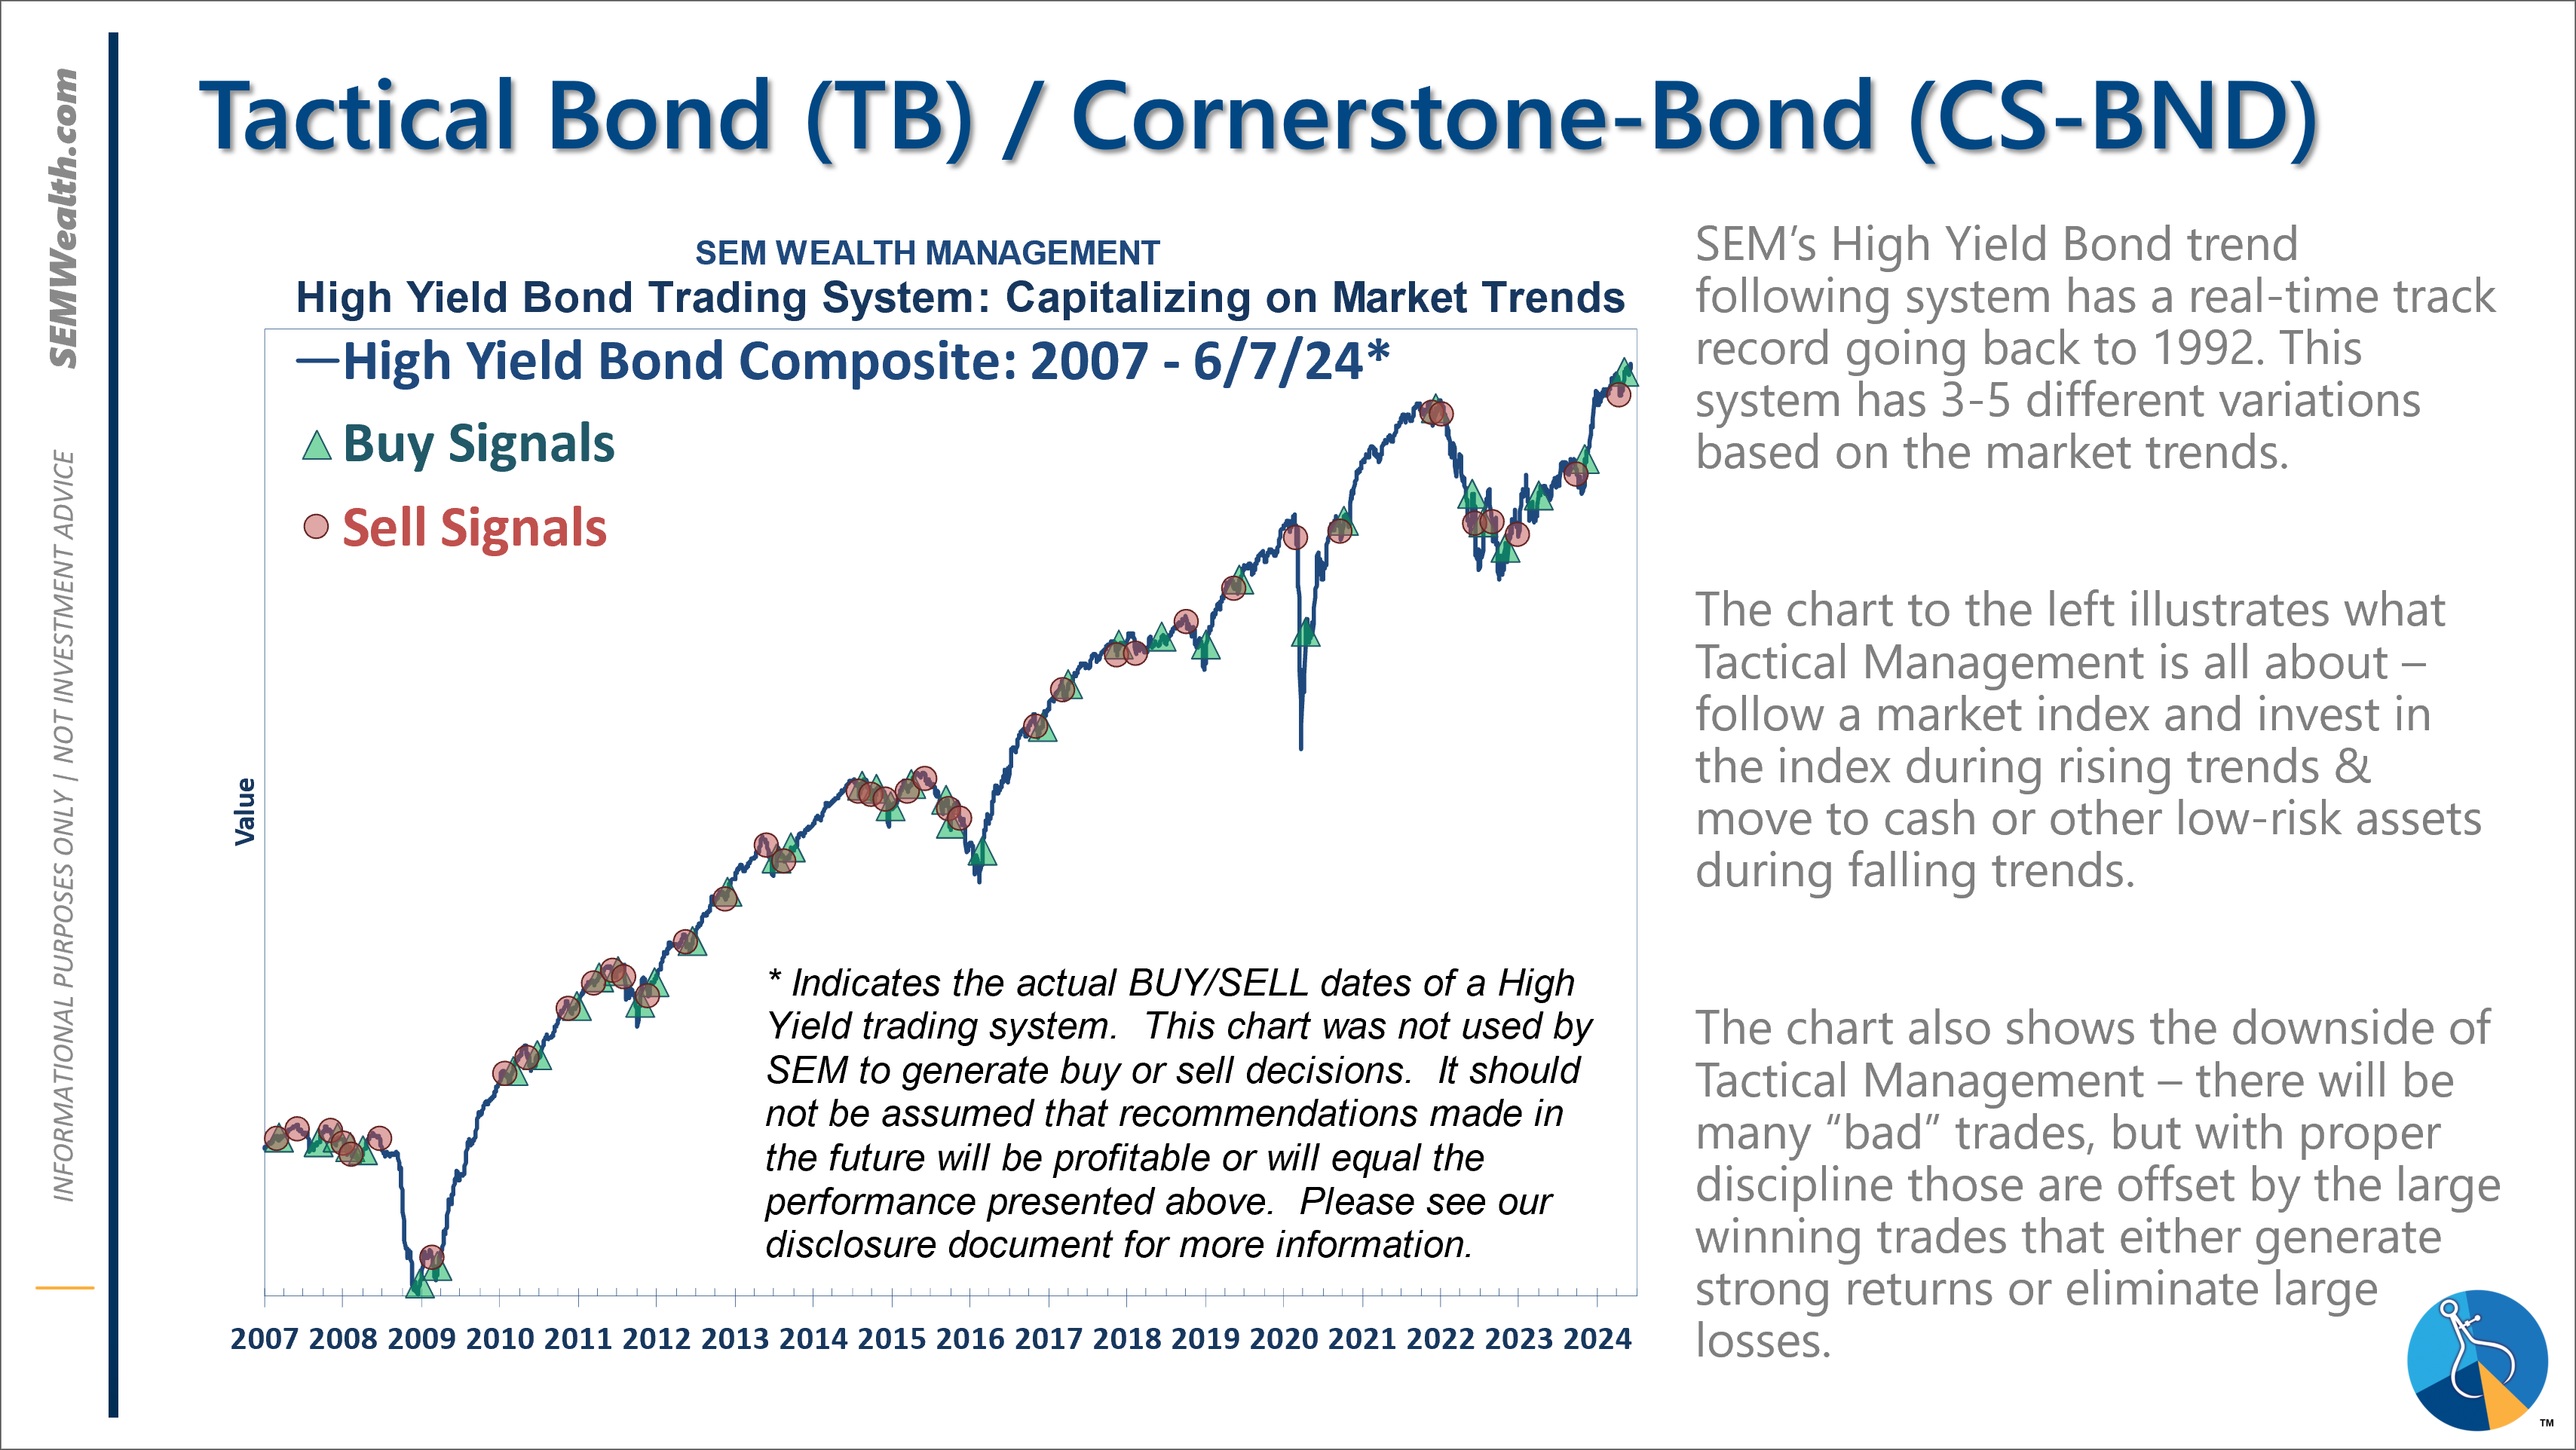
-Tactical High Yield had a partial buy signal on 5/6/24, reversing some of the sells on 4/16 & 17/2024 - the other portion of the signal remains on a sell as high yields continue to oscillate.
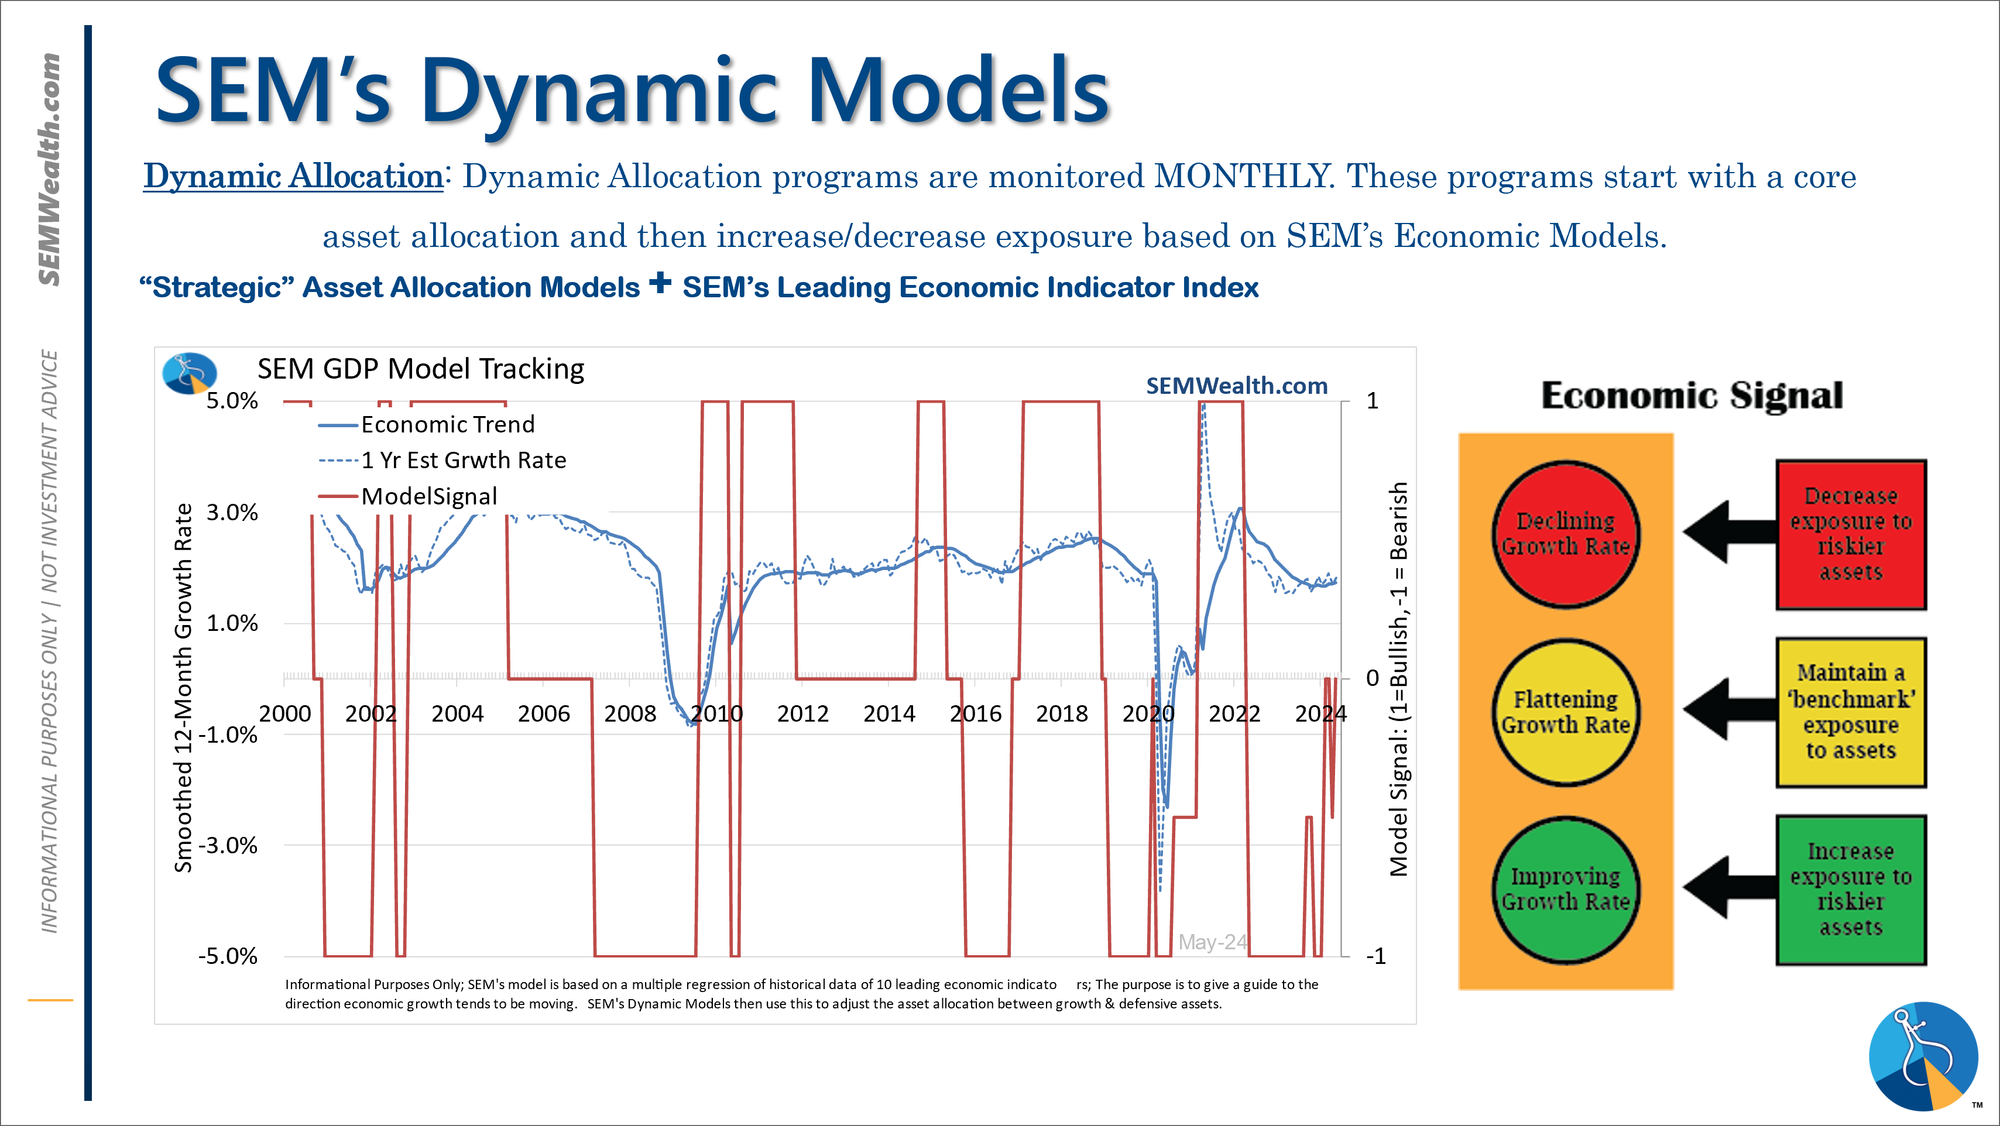
-*NEW* Dynamic Models are 'neutral' as of 6/7/24, reversing the half 'bearish' signal from 5/3/2024
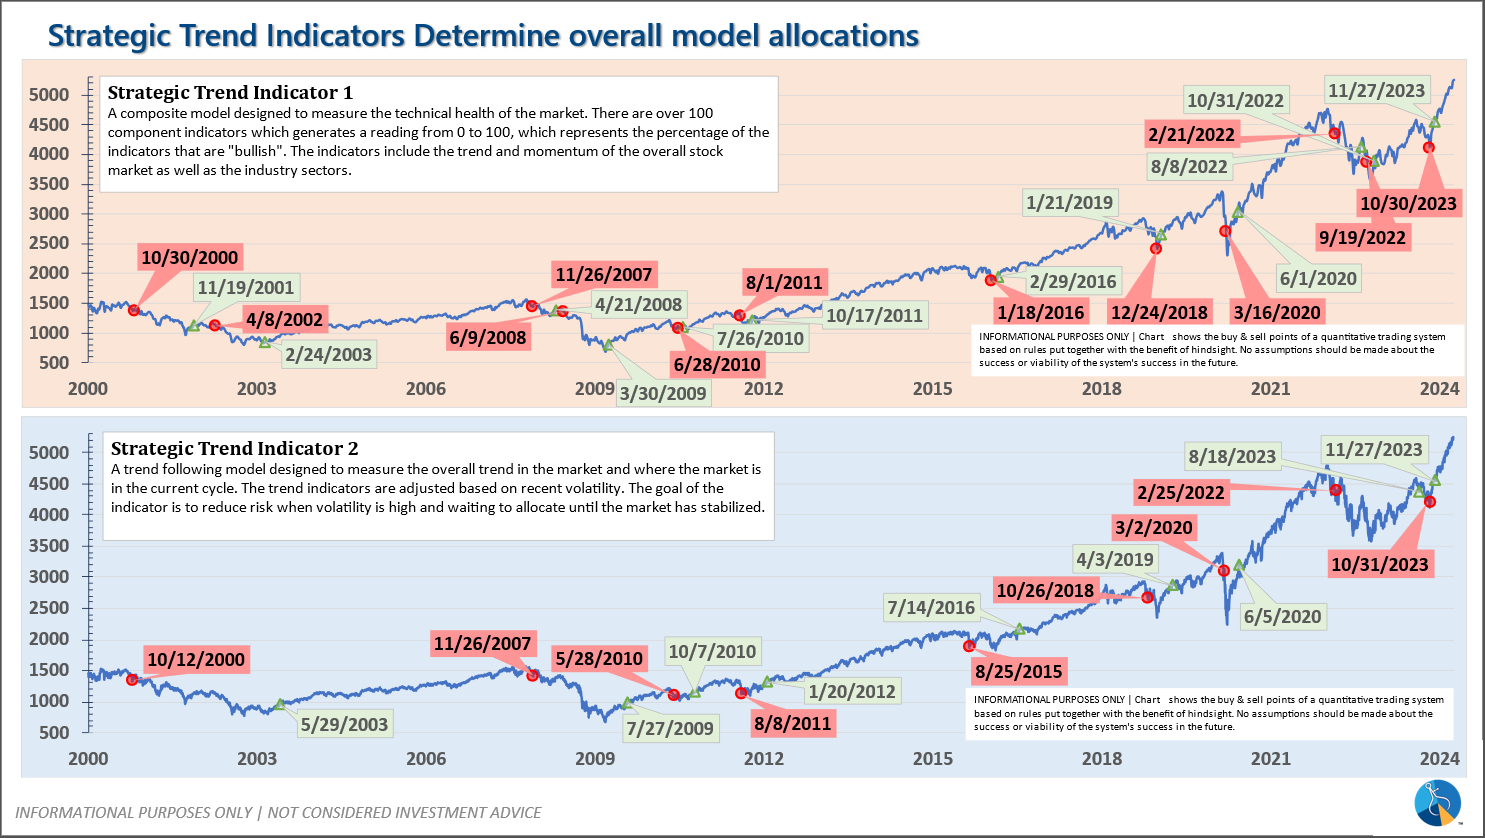
-Strategic Trend Models went on a buy 11/27/2023
SEM deploys 3 distinct approaches – Tactical, Dynamic, and Strategic. These systems have been described as 'daily, monthly, quarterly' given how often they may make adjustments. Here is where they each stand.
Tactical (daily): On 5/6/24 about half of the signals in our high yield models switched to a buy. The other half remains in money market funds. The money market funds we are currently invested in are yielding between 4.8-5.3% annually.
Dynamic (monthly): The economic model was 'neutral' since February. In early May the model moved slightly negative, but reversed back to 'neutral' in June. This means 'benchmark' positions – 20% dividend stocks in Dynamic Income and 20% small cap stocks in Dynamic Aggressive Growth.
Strategic (quarterly)*:
BOTH Trend Systems reversed back to a buy on 11/27/2023
The core rotation is adjusted quarterly. On August 17 it rotated out of mid-cap growth and into small cap value. It also sold some large cap value to buy some large cap blend and growth. The large cap purchases were in actively managed funds with more diversification than the S&P 500 (banking on the market broadening out beyond the top 5-10 stocks.) On January 8 it rotated completely out of small cap value and mid-cap growth to purchase another broad (more diversified) large cap blend fund along with a Dividend Growth fund.
The * in quarterly is for the trend models. These models are watched daily but they trade infrequently based on readings of where each believe we are in the cycle. The trend systems can be susceptible to "whipsaws" as we saw with the recent sell and buy signals at the end of October and November. The goal of the systems is to miss major downturns in the market. Risks are high when the market has been stampeding higher as it has for most of 2023. This means sometimes selling too soon. As we saw with the recent trade, the systems can quickly reverse if they are wrong.
Overall, this is how our various models stack up based on the last allocation change: