With summer unofficially starting this past weekend, election season is heating up. Every election always seems to be more important than any other, which leads to a wide range of emotions. Our role at SEM is not to sway anyone's opinions or worse, to guess what the outcome of the election will be, but instead to focus on the data.
I enjoyed the downtime over the weekend as it gave me time to catch up the articles I've been accumulating in my reading folder. Several of those discussed the negative sentiment towards the economy and stock market. One of those was this survey from the Guardian:
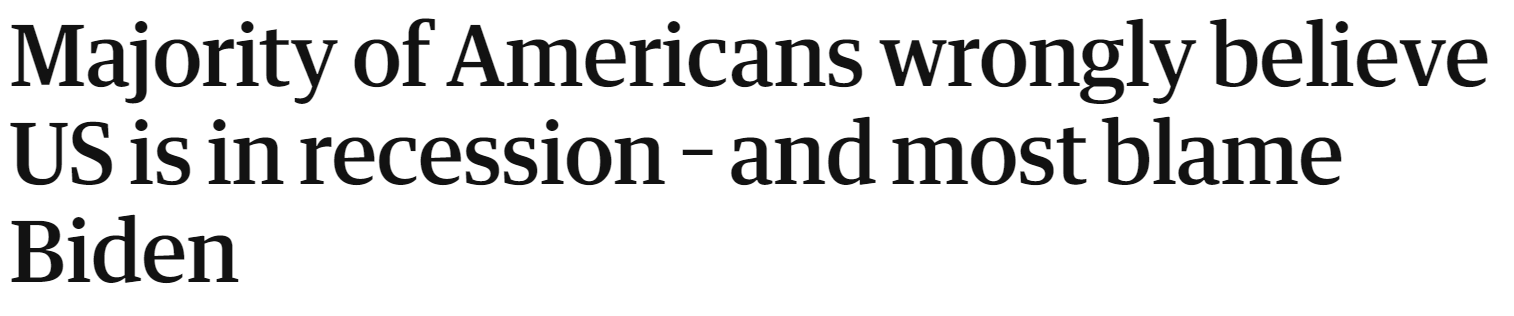
I'm not at all defending the overall policies or campaign pledges from President Biden, but the data does not back-up what Americans believe is happening.
1.) Is the US Economy currently experiencing a recession?
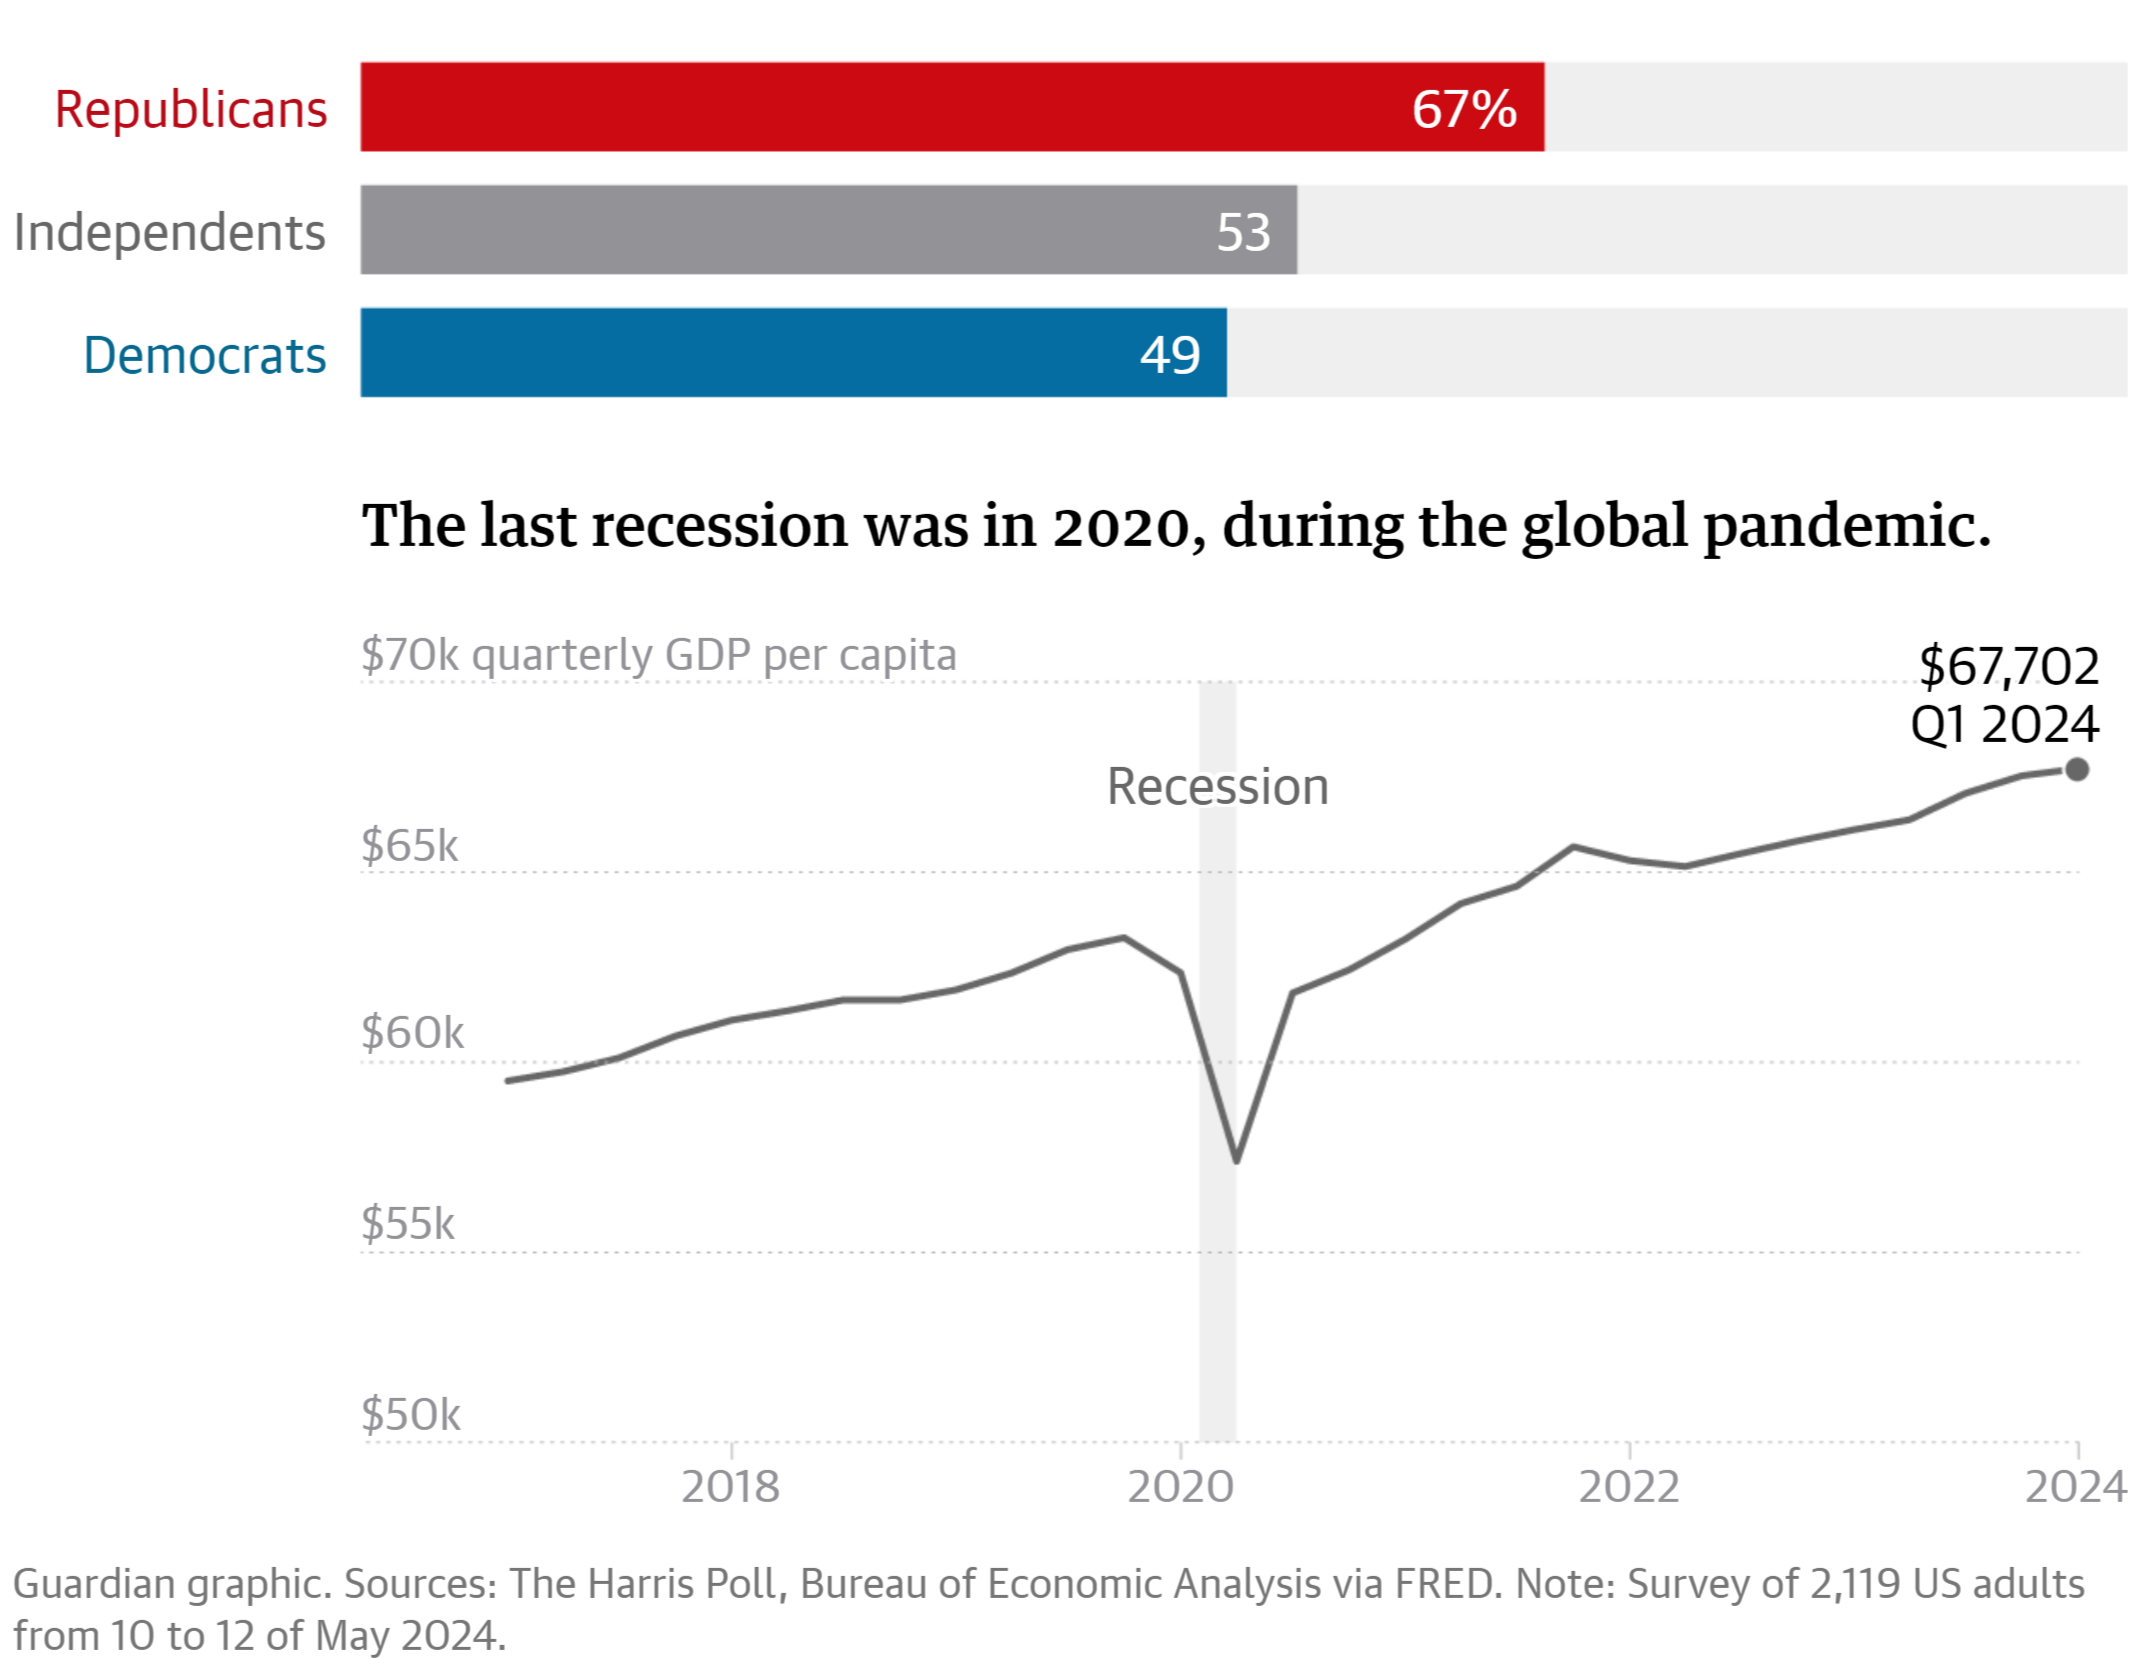
Hopefully readers of this blog will know we are not in a recession. Granted, our economic model indicates the economy is slowing down, but growth is still positive.

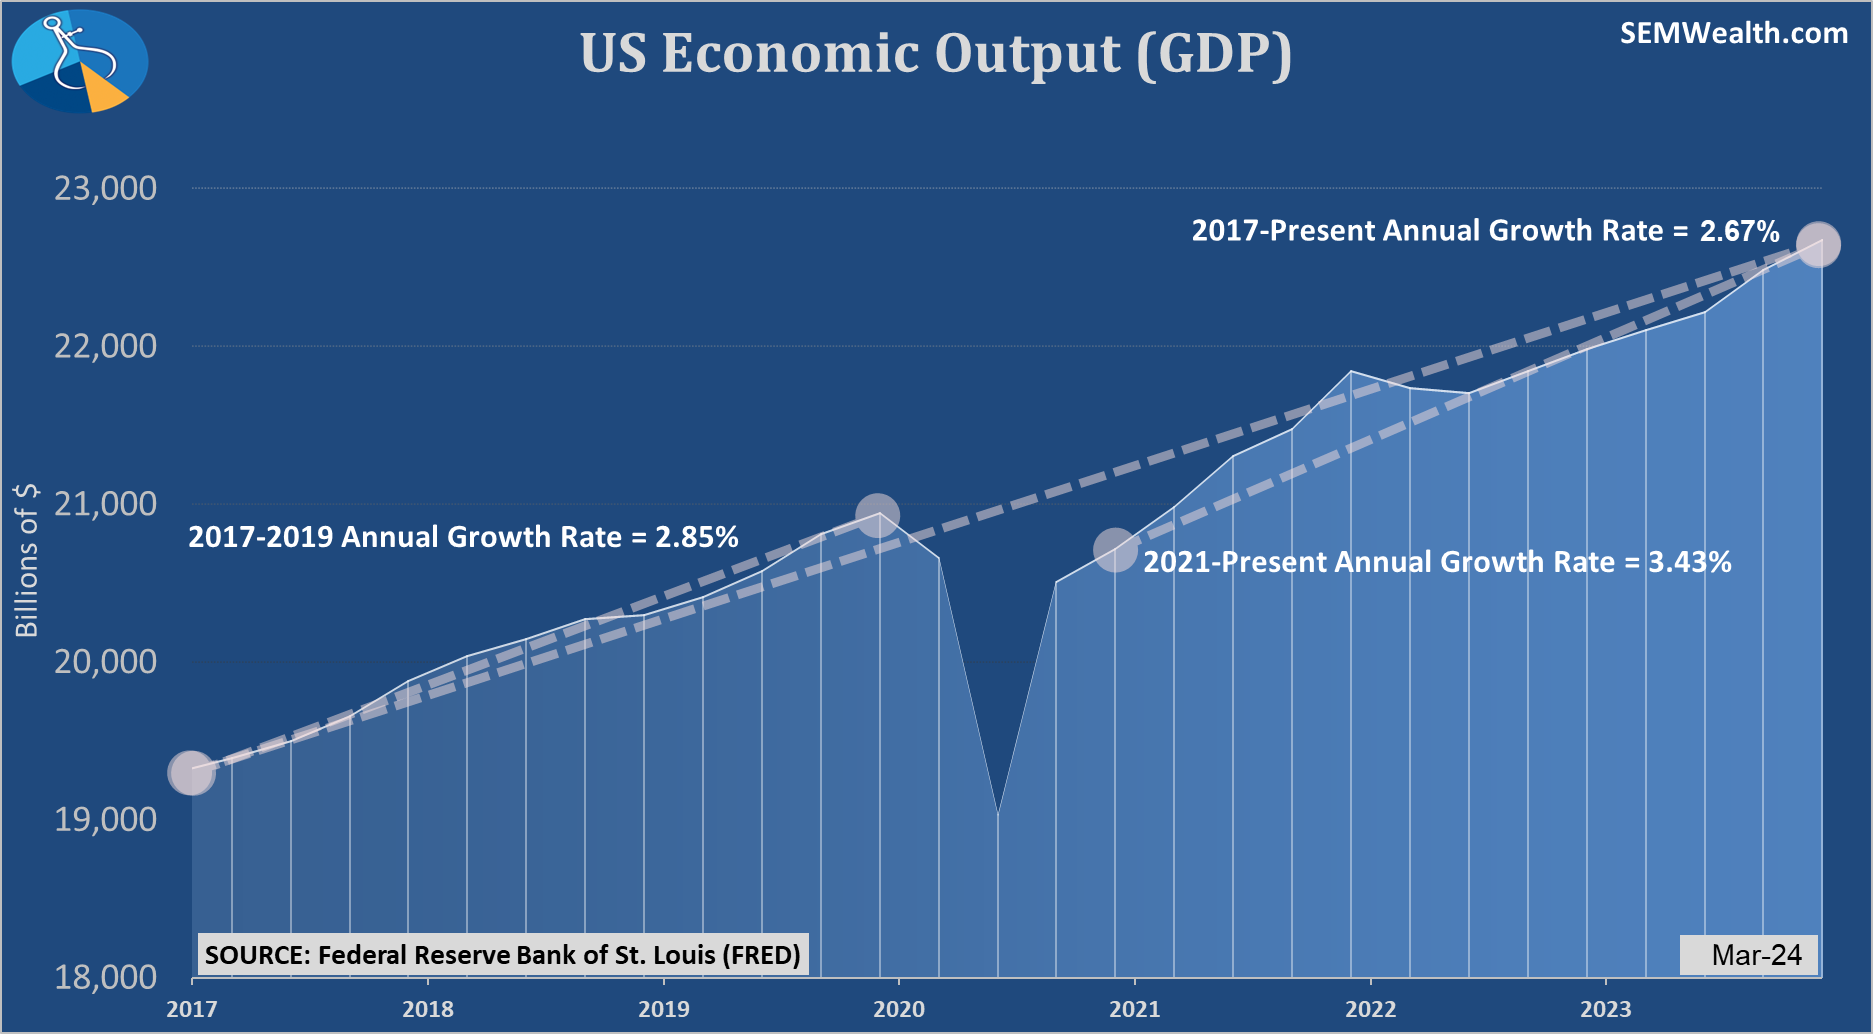
Here is a chart of GDP since 2016. Note the 3.4% annualized growth rate since 2021.
2.) How has the stock market performed in 2024?
49% of Americans answered 'down'
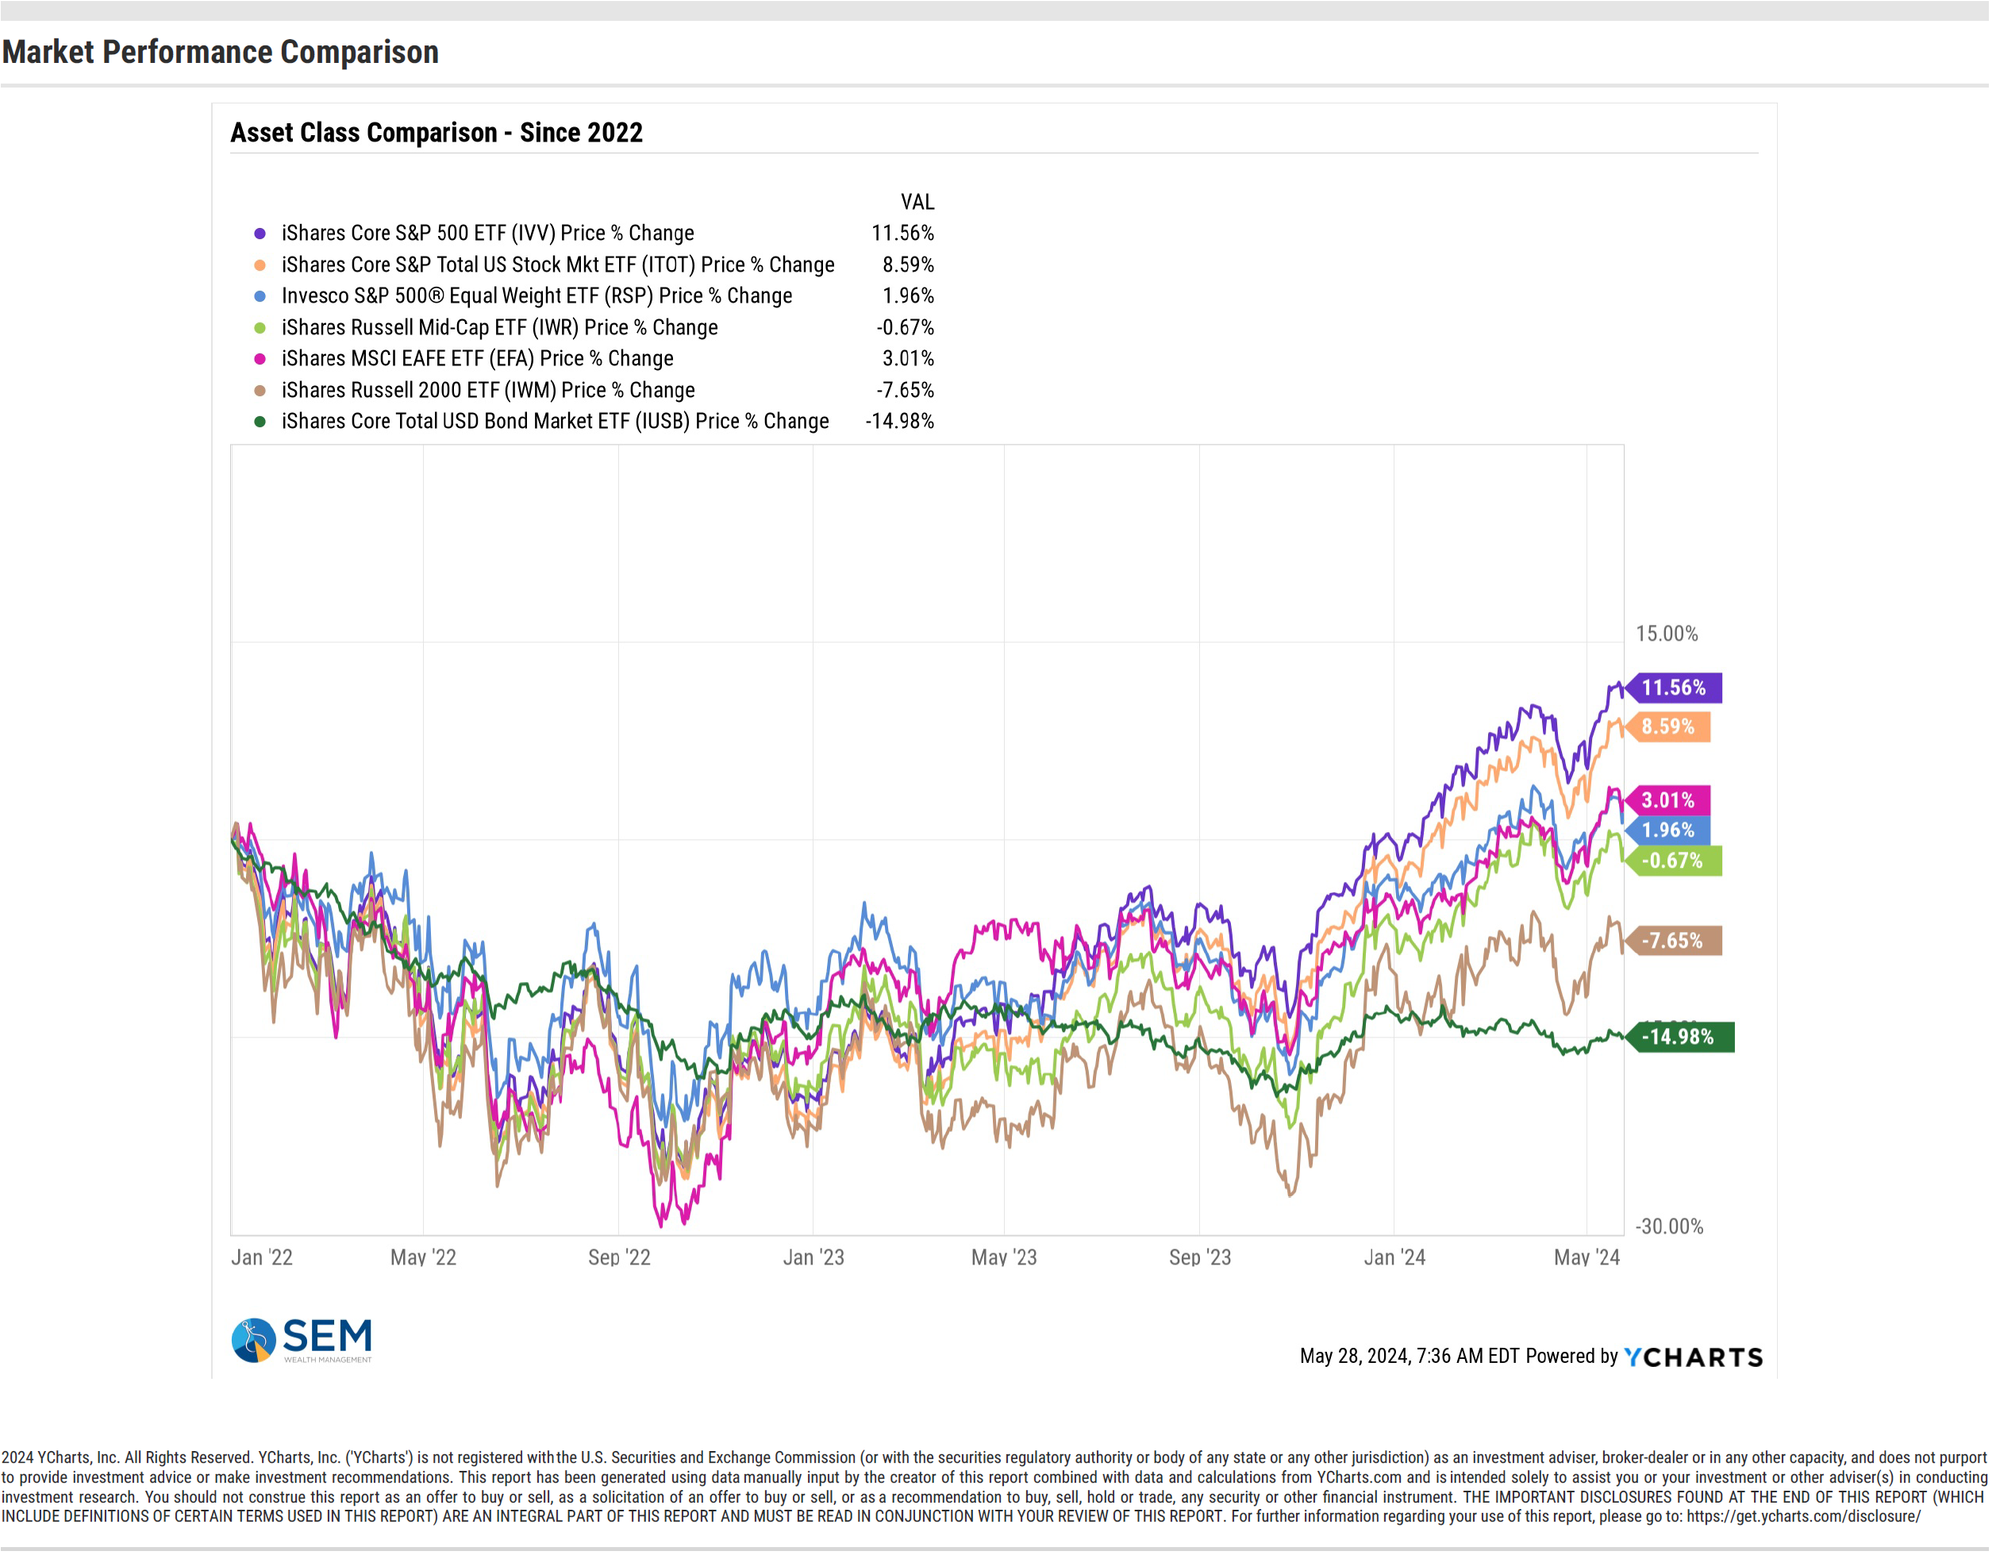
Here's a year-to-date chart of various index ETFs. The only one not up is the bond market.

3.) How does the current unemployment rate compare to prior periods?
49% of Americans answered "near a 50-year high". Here is a 50-year chart of the unemployment rate. Note we are 0.5% above the 50-year low.
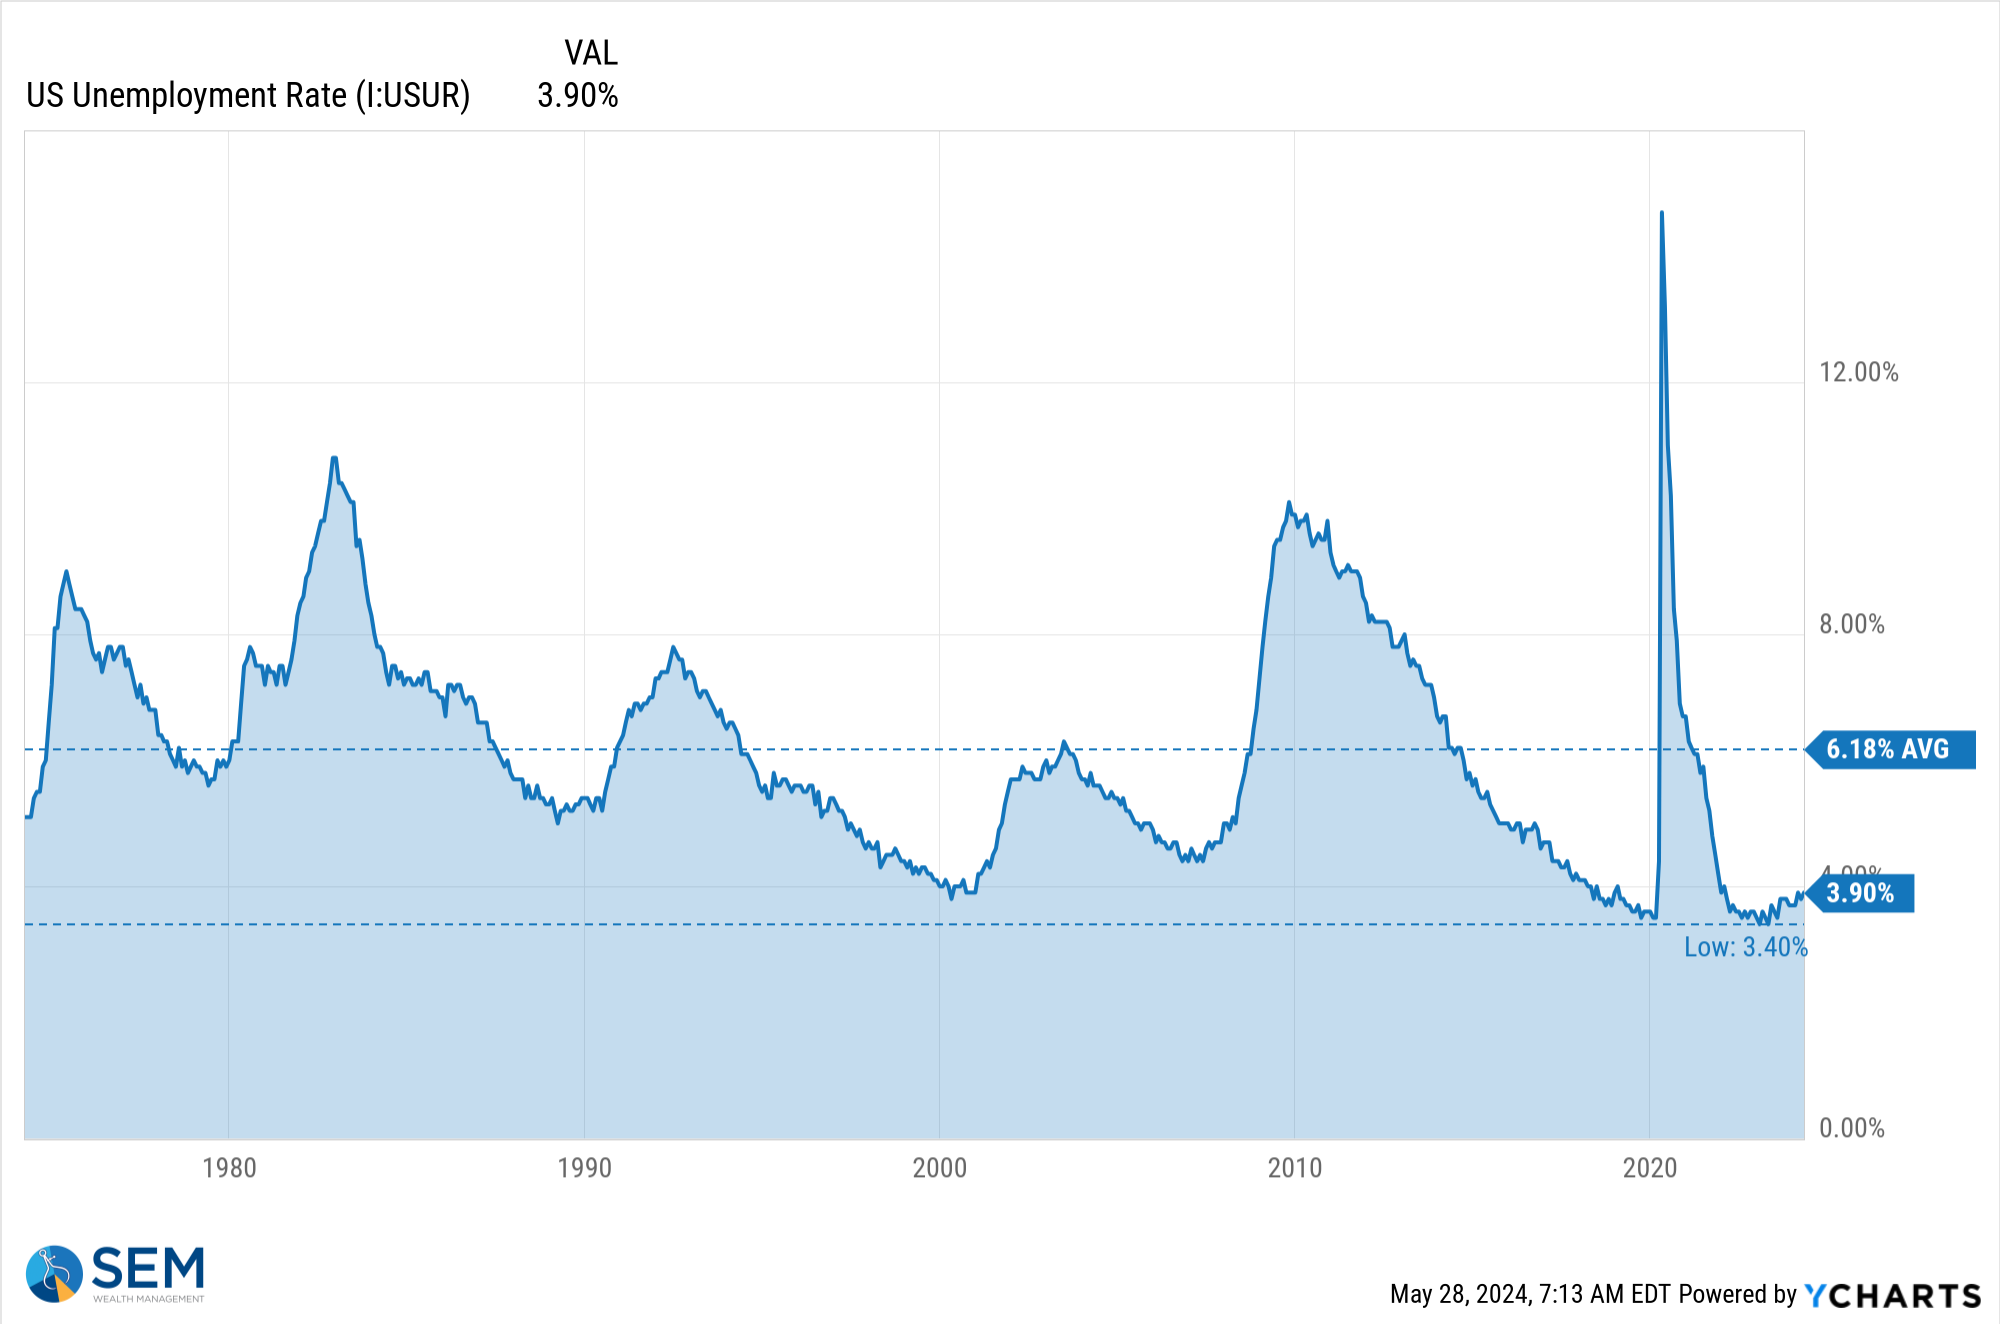
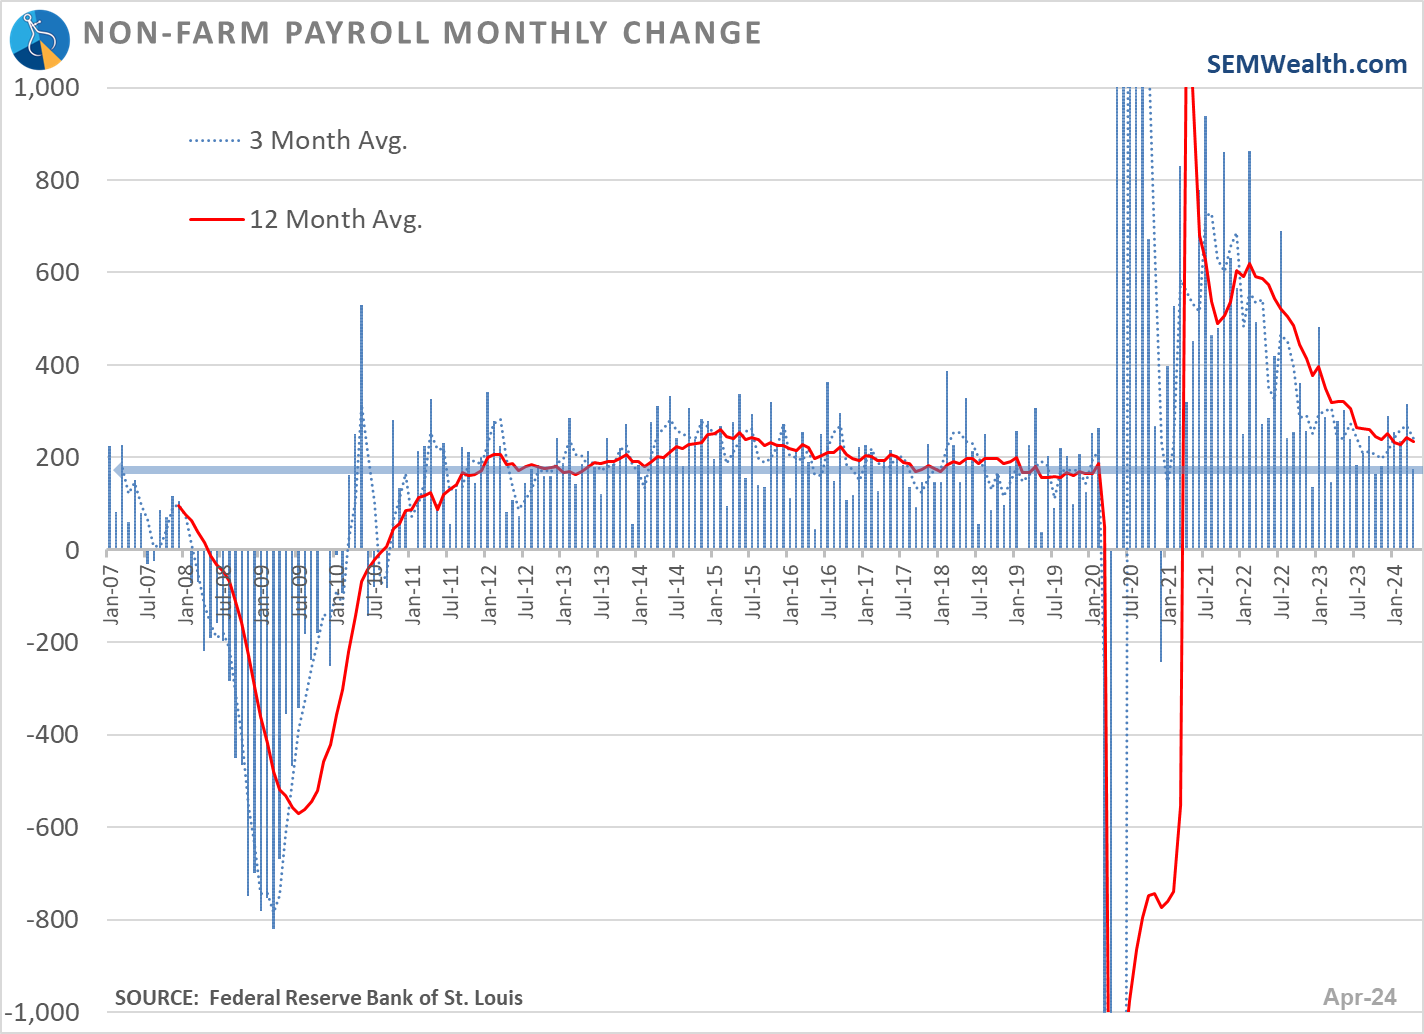
The number of jobs also continues to increase at a steady rate.
4.) Is the inflation rate increasing or decreasing?
The overwhelming majority of Americans said 'increasing' regardless of political affiliation.
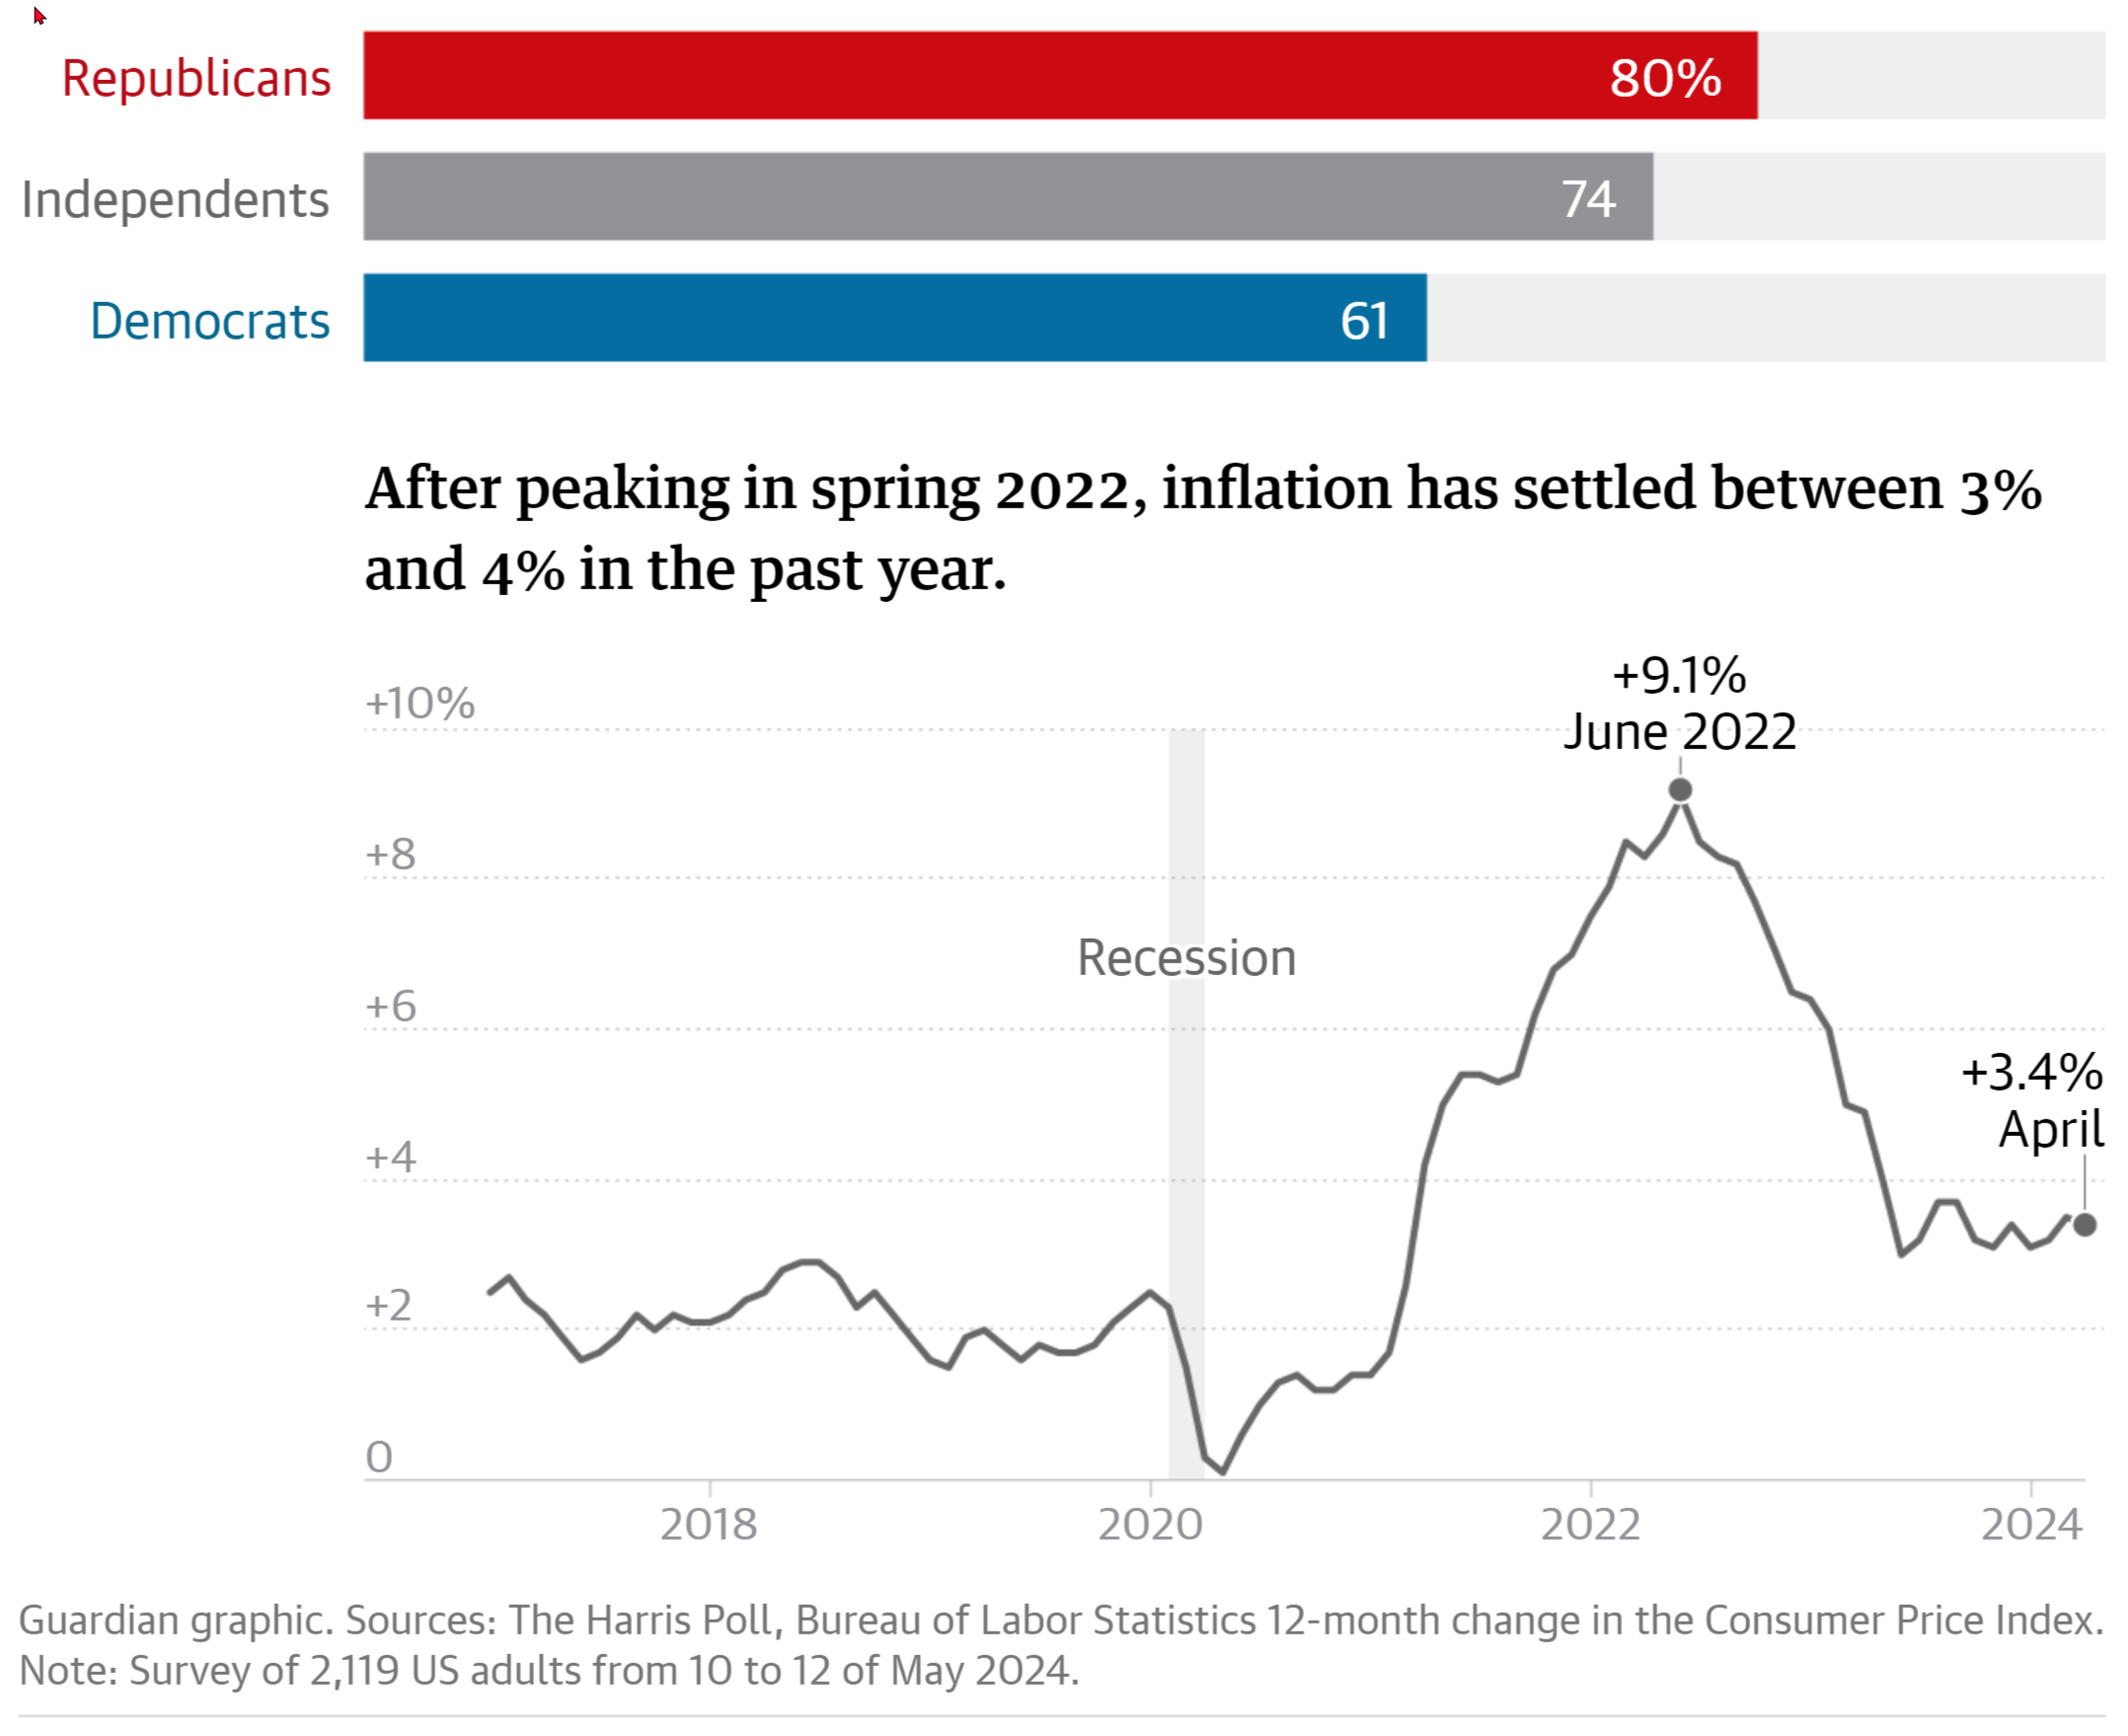
Overall the inflation rate is falling, although as we mentioned in our monthly economic update, it's not falling fast enough and may start increasing again.
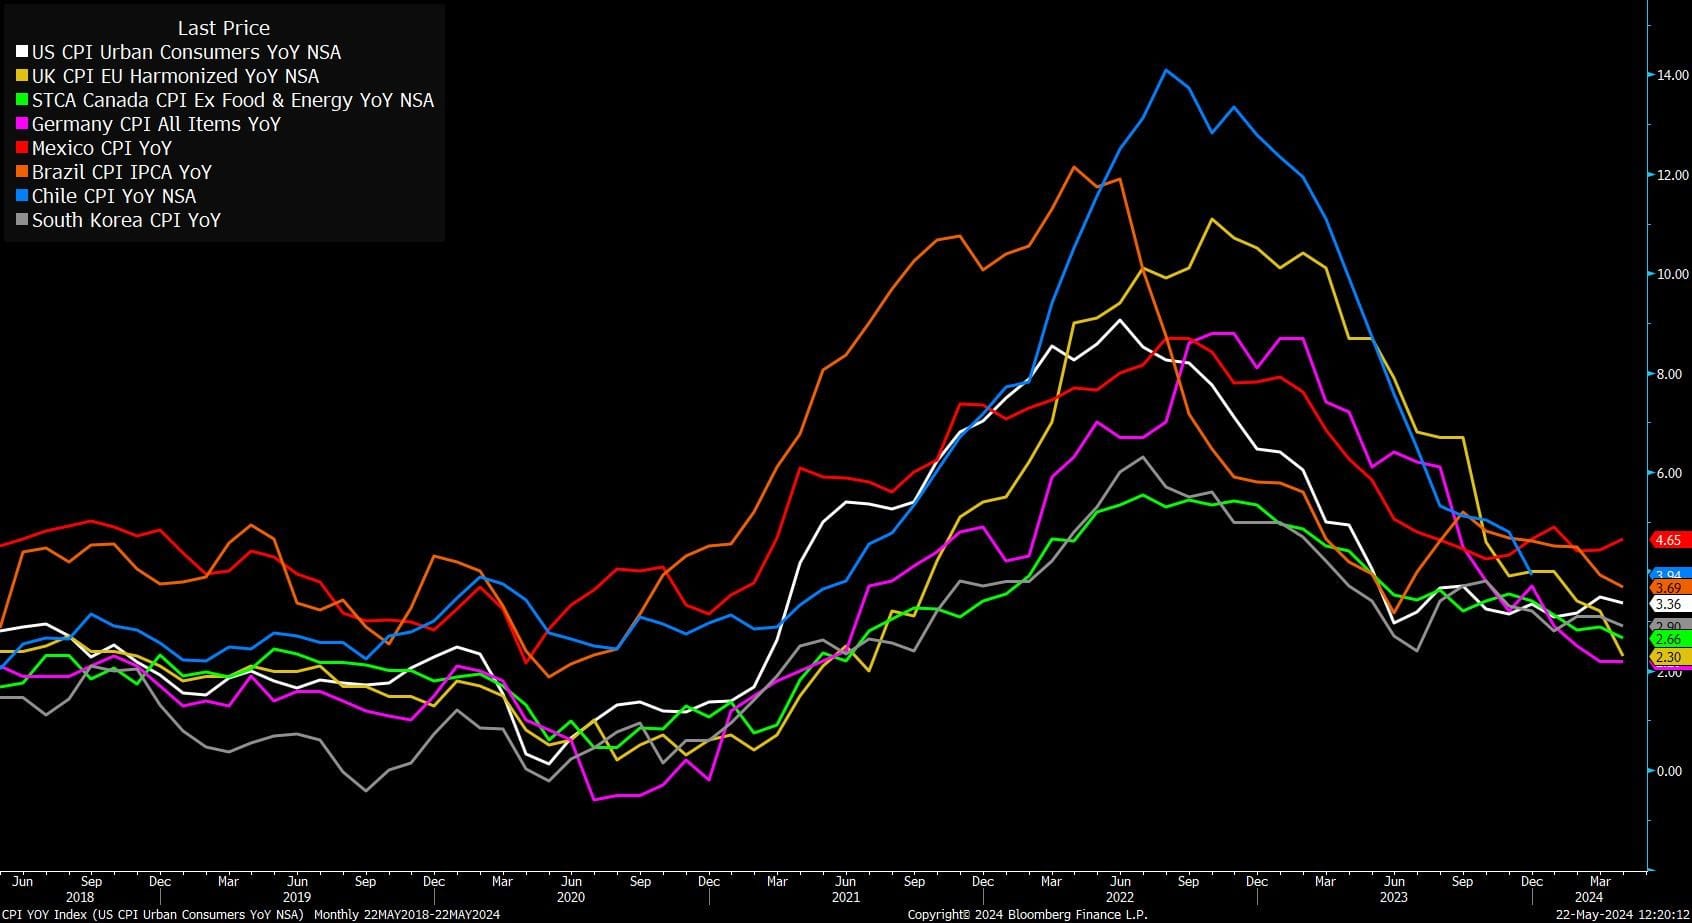
Across the globe, the inflation rate is falling (except in Mexico which saw a recent uptick). This also illustrates how high inflation was a problem across the world, not just in the US and not the fault of any one individual.
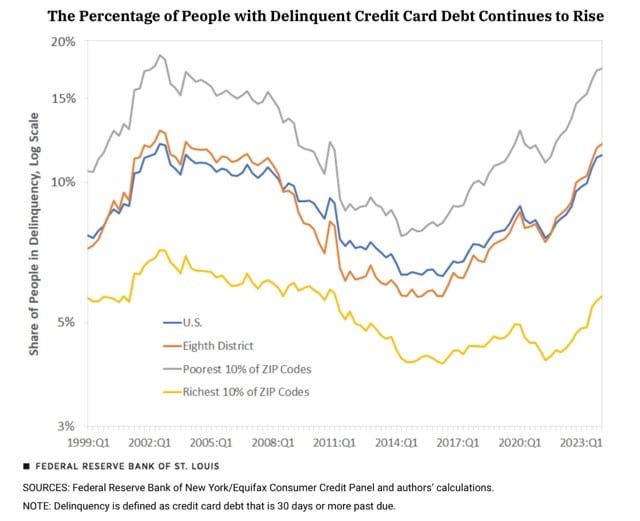
The cause of inflation was multiple events, decisions, and overreactions from many different parties and entities across both political parties. We discussed this in our "broken economy" series 2-years ago. The top 40% of Americans received 65% of the stimulus money. They didn't need it so they spent it. That spending at a time when the economy was shut down broke everything. The bottom 60% is feeling the brunt of that, which is why most Americans have such a negative opinion of the economy.
That stress is showing up in credit card delinquencies. Note the poorest 10% are approaching the 2002 level of delinquencies. This is at a time where credit card debt levels are also at an all-time high. Overall, the US is near the highs of the financial crisis.
I'm not endorsing either political party or trying to sway opinions on the health of the economy. As my friend and colleague Joe says, "our clients' perception is our reality." The same could be said about voters and the current leadership in Washington. If Americans believe the economy is terrible, then it is. There is a reason we feel that way yet BOTH PARTIES keep talking about the same tired policies they've been using the past 20 years.
This is the third in what will be an occasional series throughout the rest of the year. Here are the first two:


In both of those previous posts, I mentioned the key piece of advice I coined during the 2008 election:
"Do not let your political opinions influence your investment decisions."
Things are not always going to be as bad (or good) as you think and they do not usually work out the way we all think they will. Stick to the data and more importantly your long-term financial plan.
Shorter-term there may be cause for concern. For more on that and how SEM is positioned, see the next two sections.
Market Charts
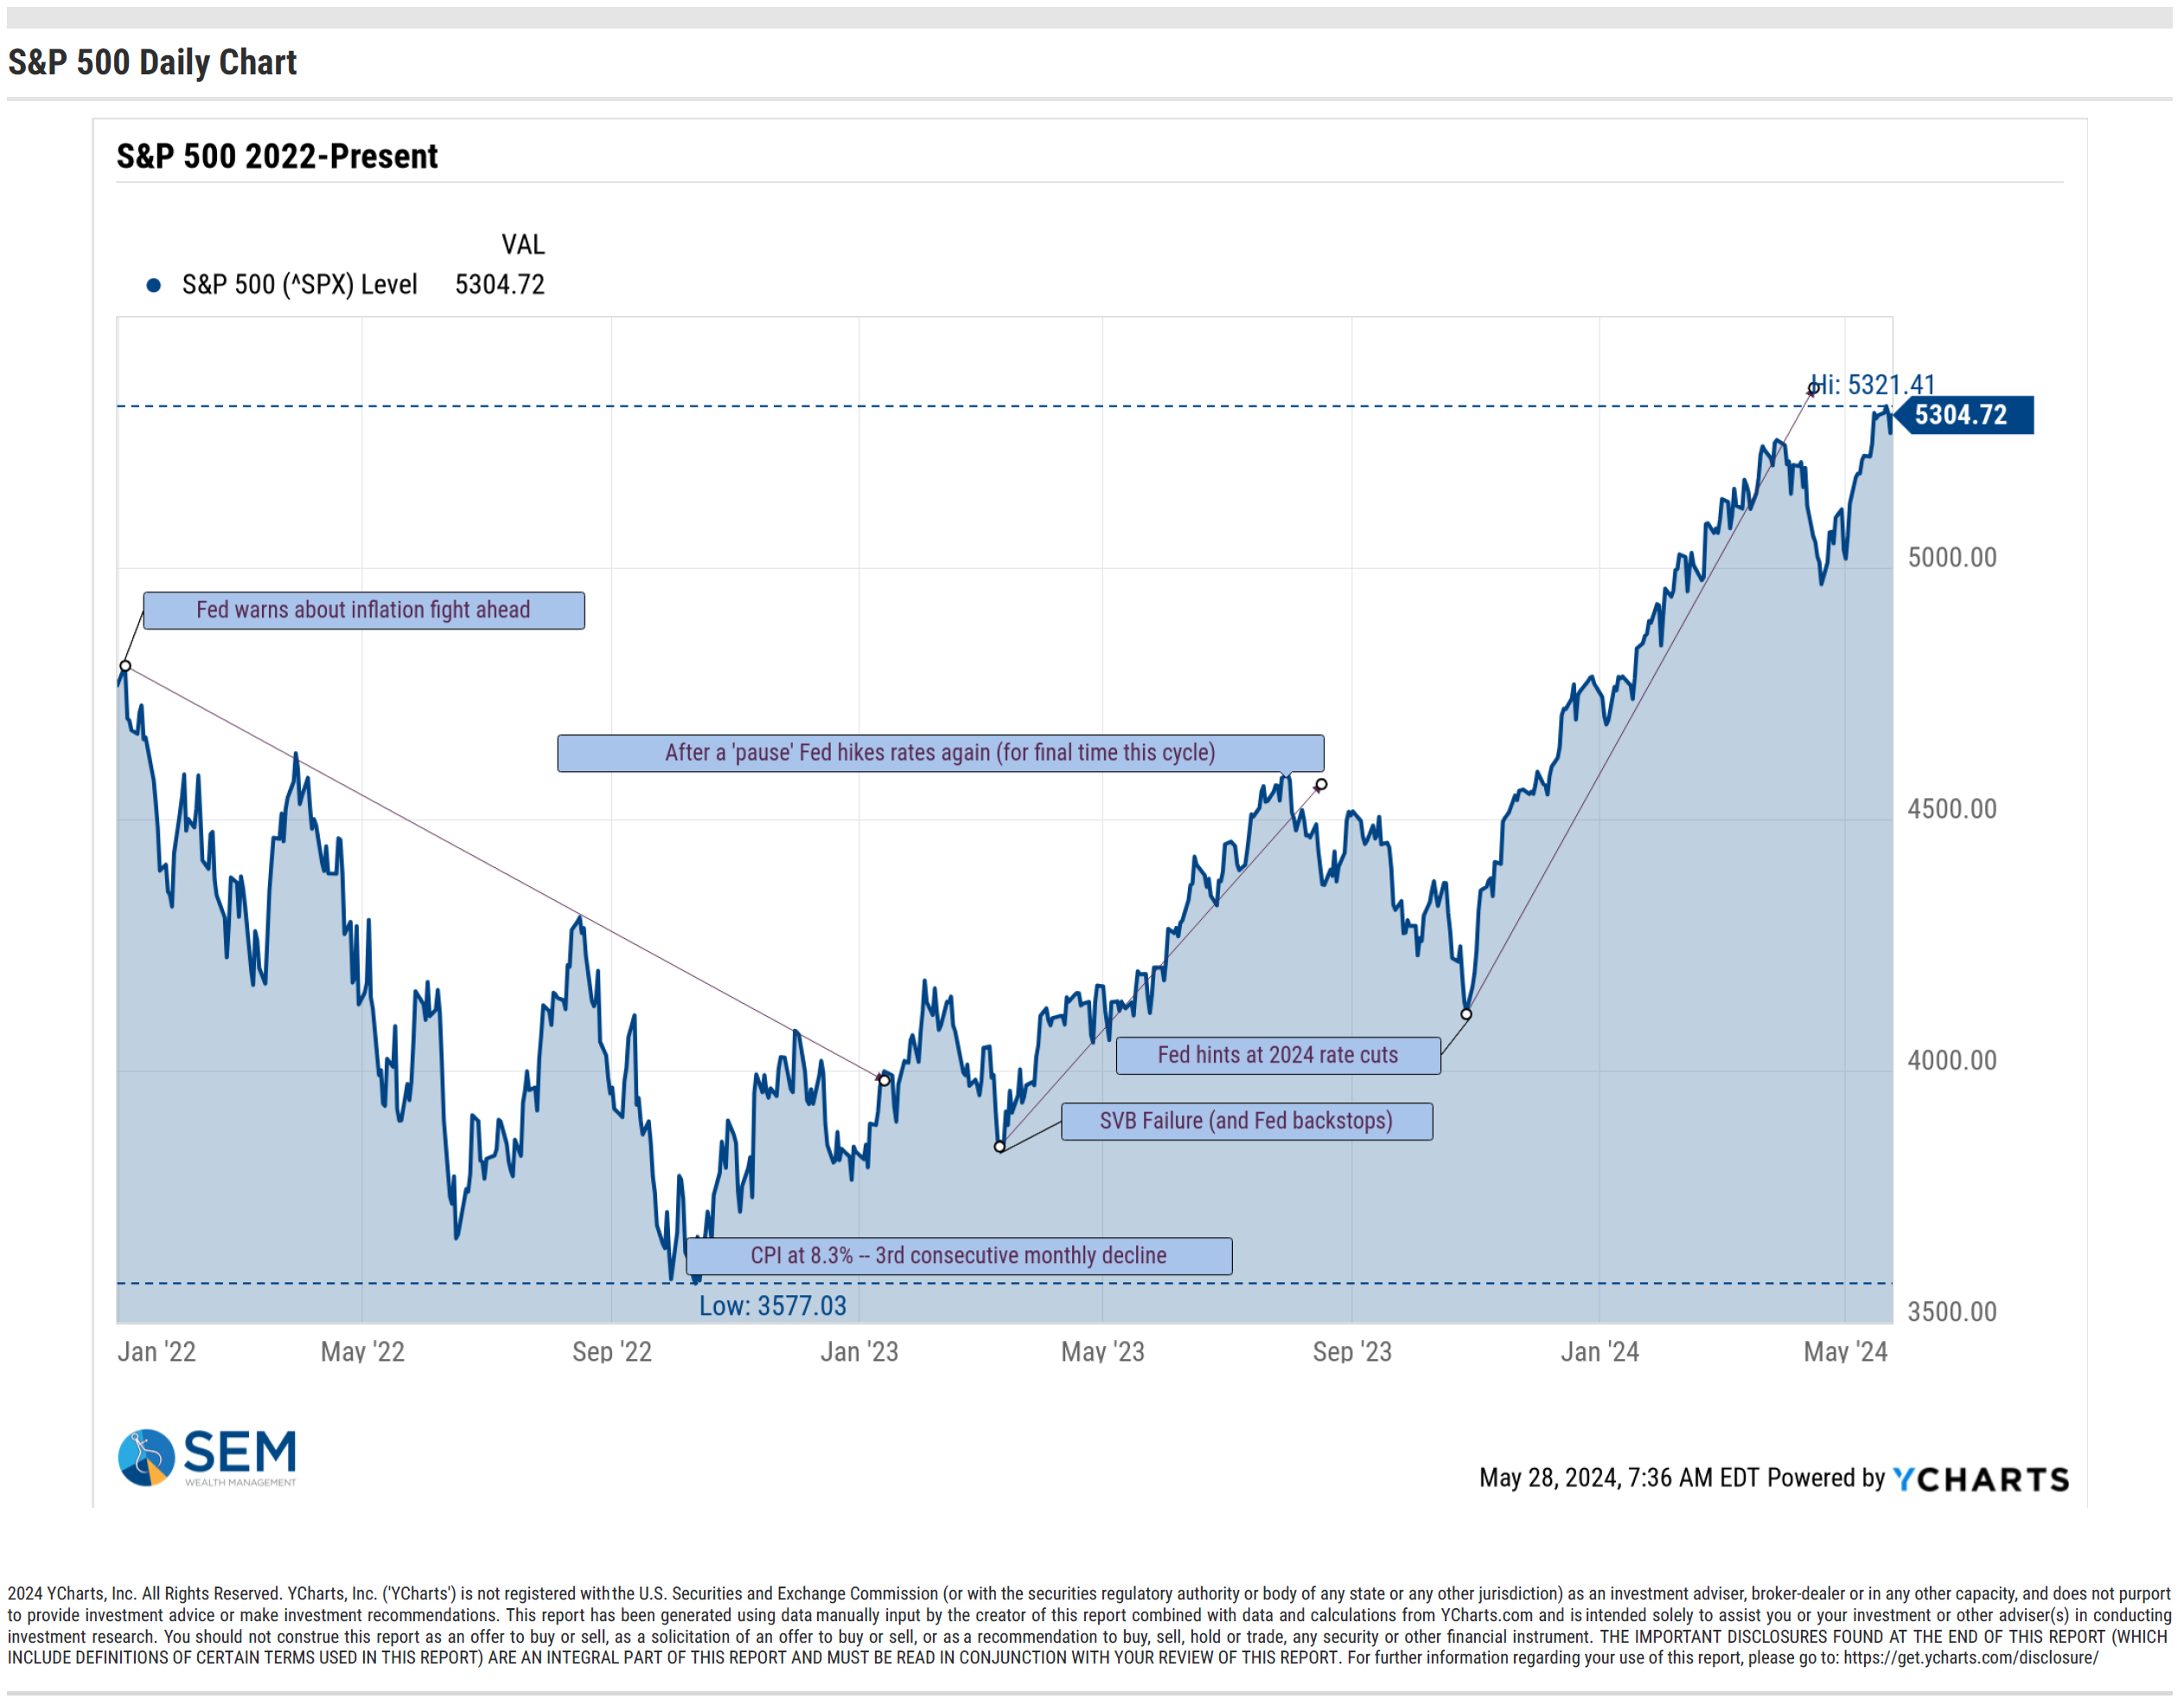
The S&P 500 is just off of its all-time high following the quick 5% correction in April.
Small caps remain down 12% from their high and bonds are nearly 11% off their highs (perhaps why Americans may feel like the "market" is down.)
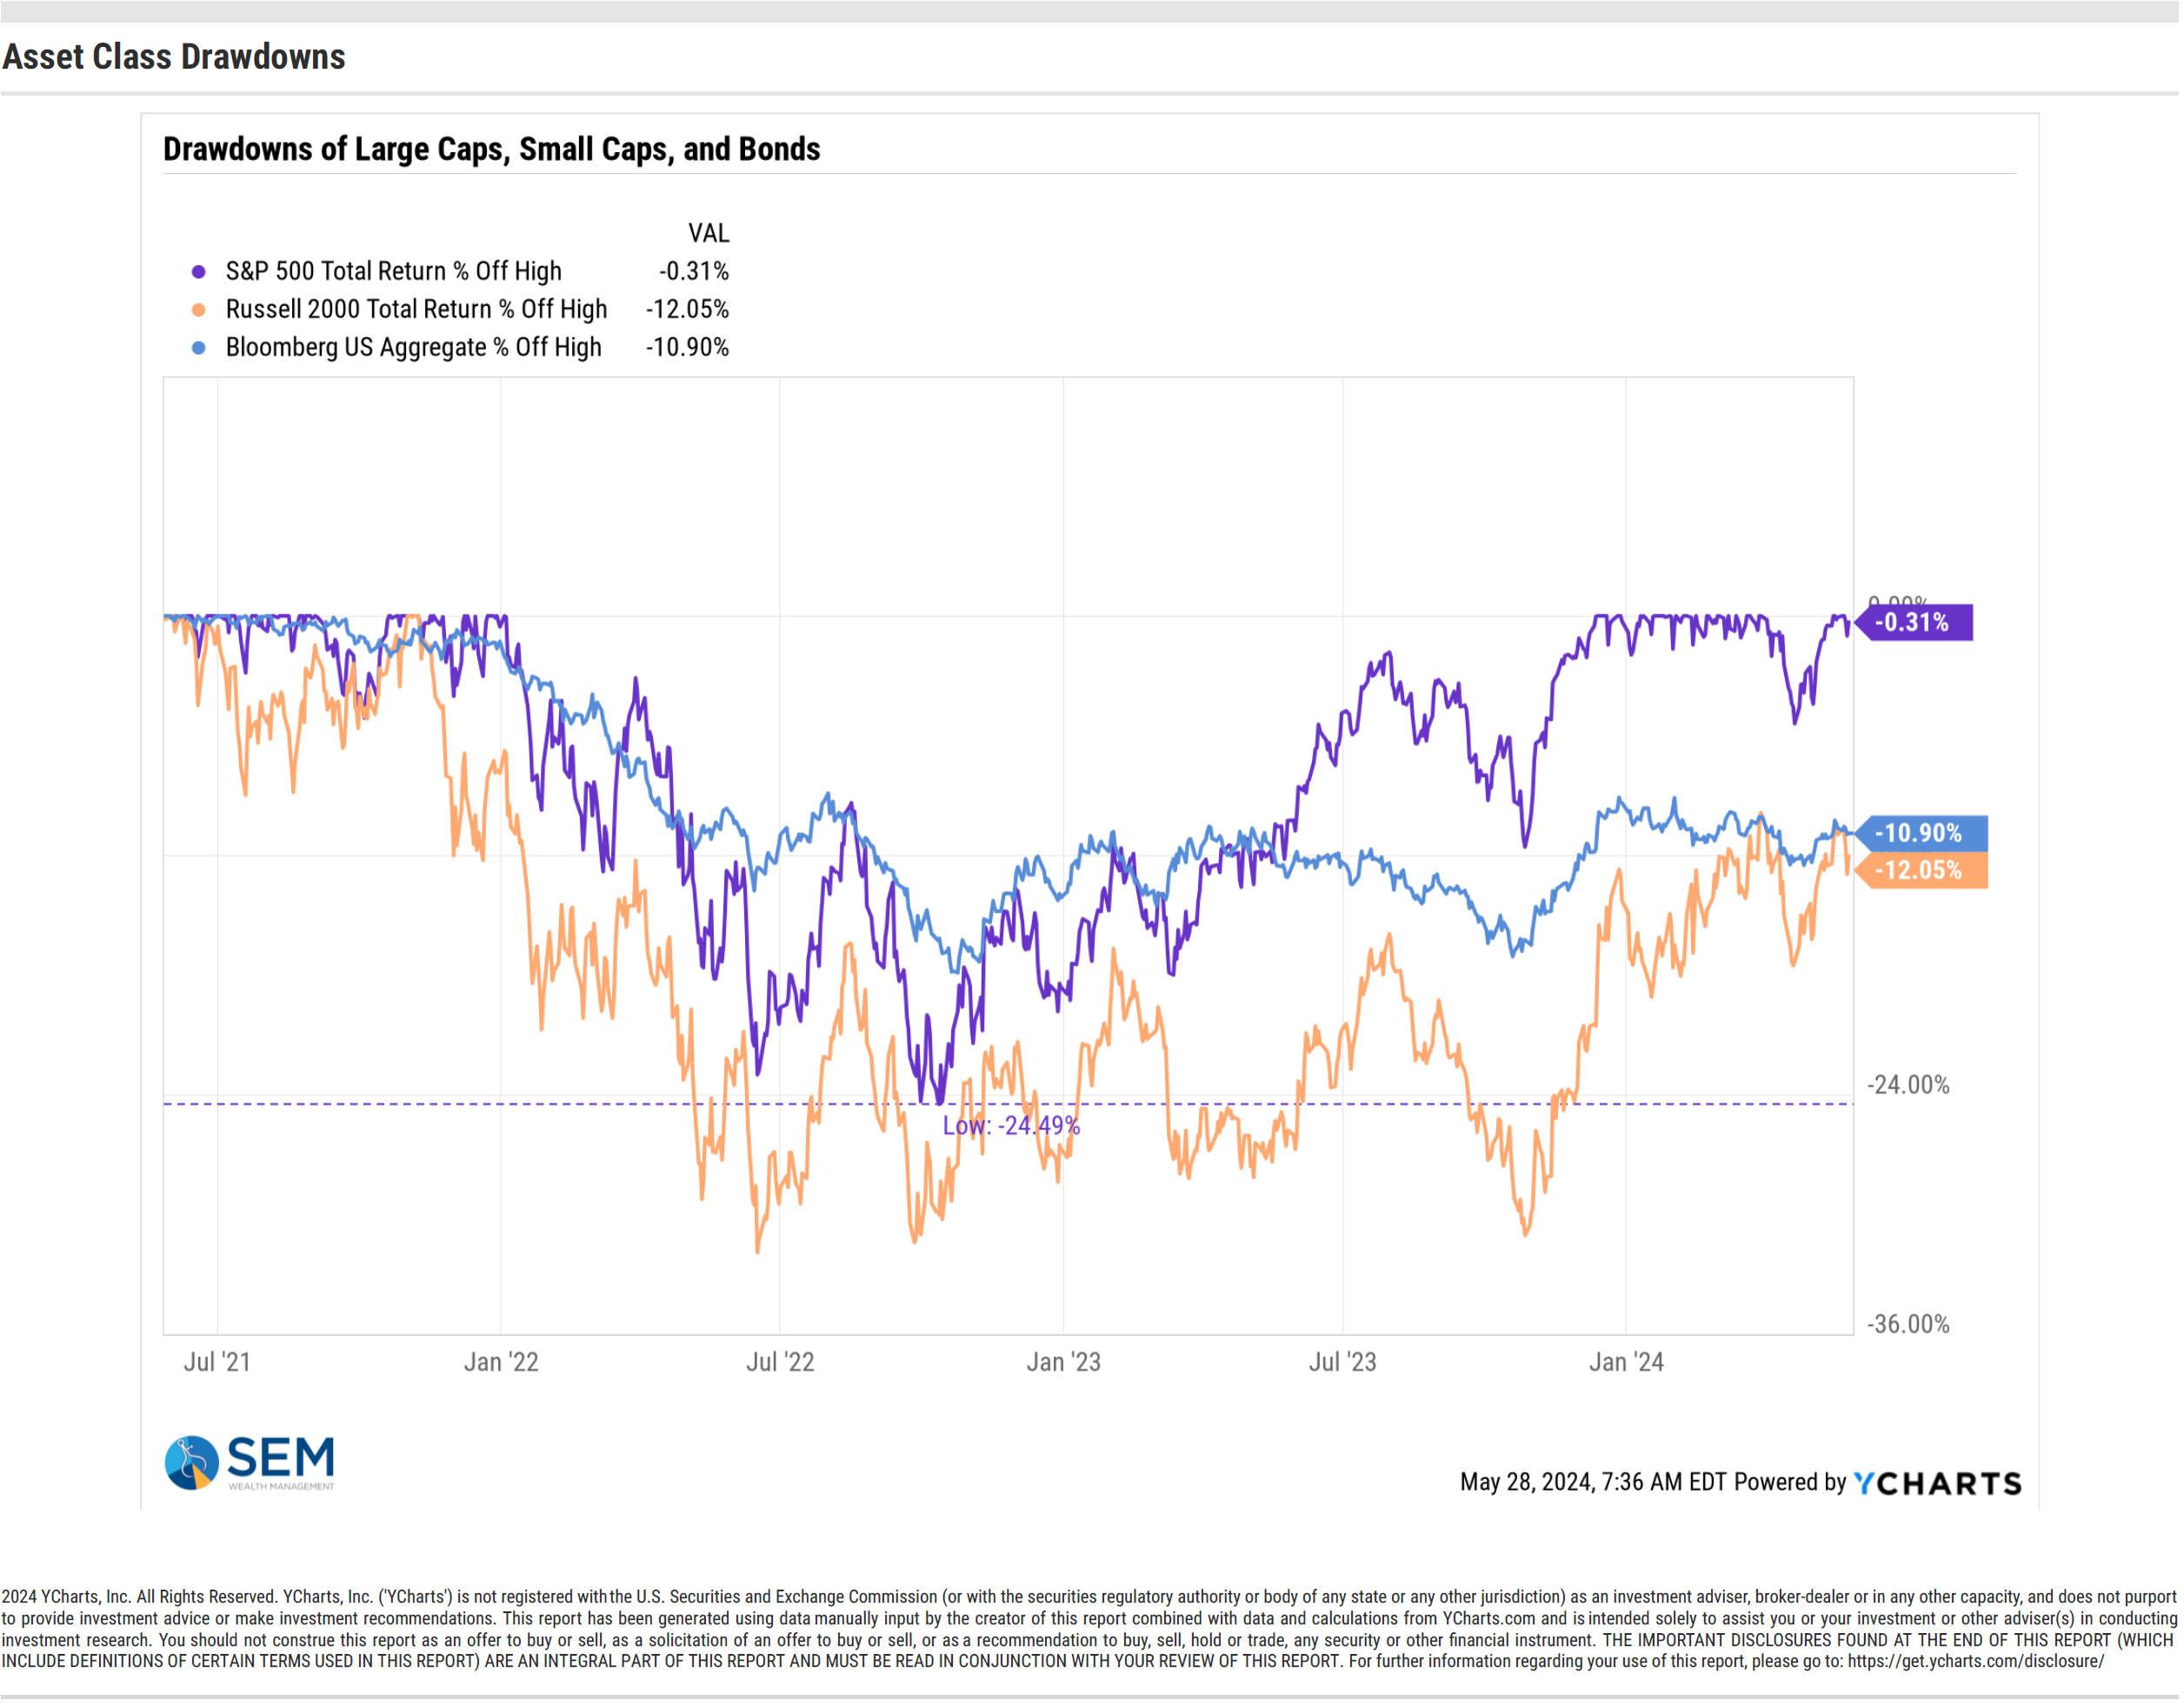
Since the peak in 2022, large cap stocks have driven the "market" higher, but again small caps and bonds, which are a part of most diversified portfolios are still negative.
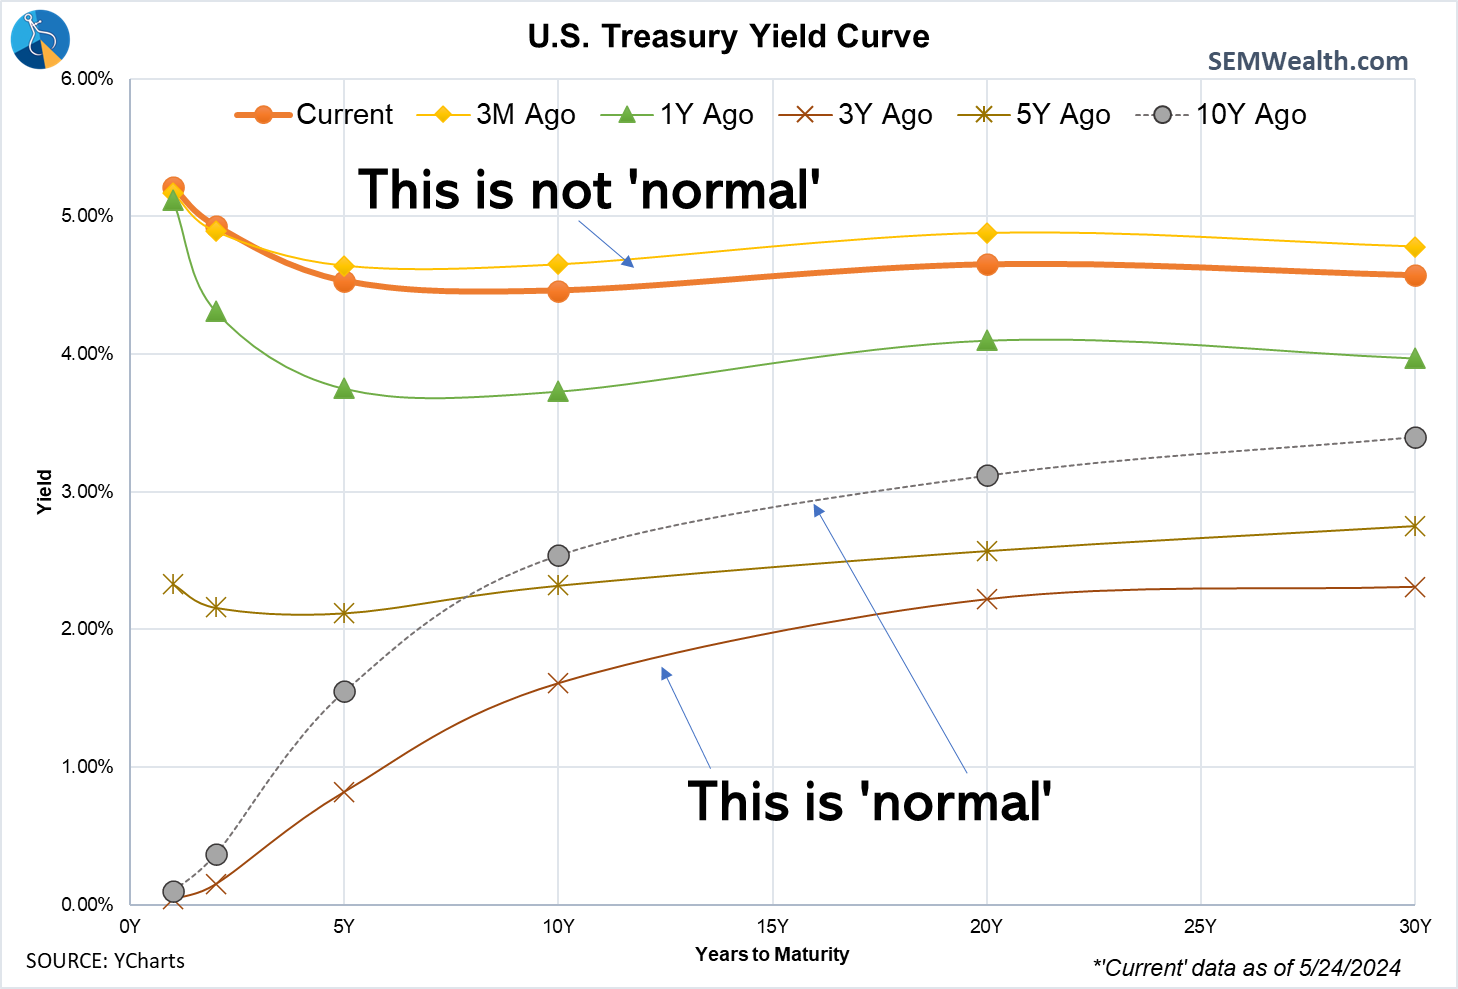
While not a problem for stocks or the economy (yet) interest rates are the likely culprit along with inflation for the negative sentiment in our economy. Remember, the 'free' market sets long-term rates, not the Fed. The market is saying inflation is still a problem, so long-term rates remain high. Mortgages, car loans, and many other types of debt are tied to these market rates, not the rates the Fed sets.
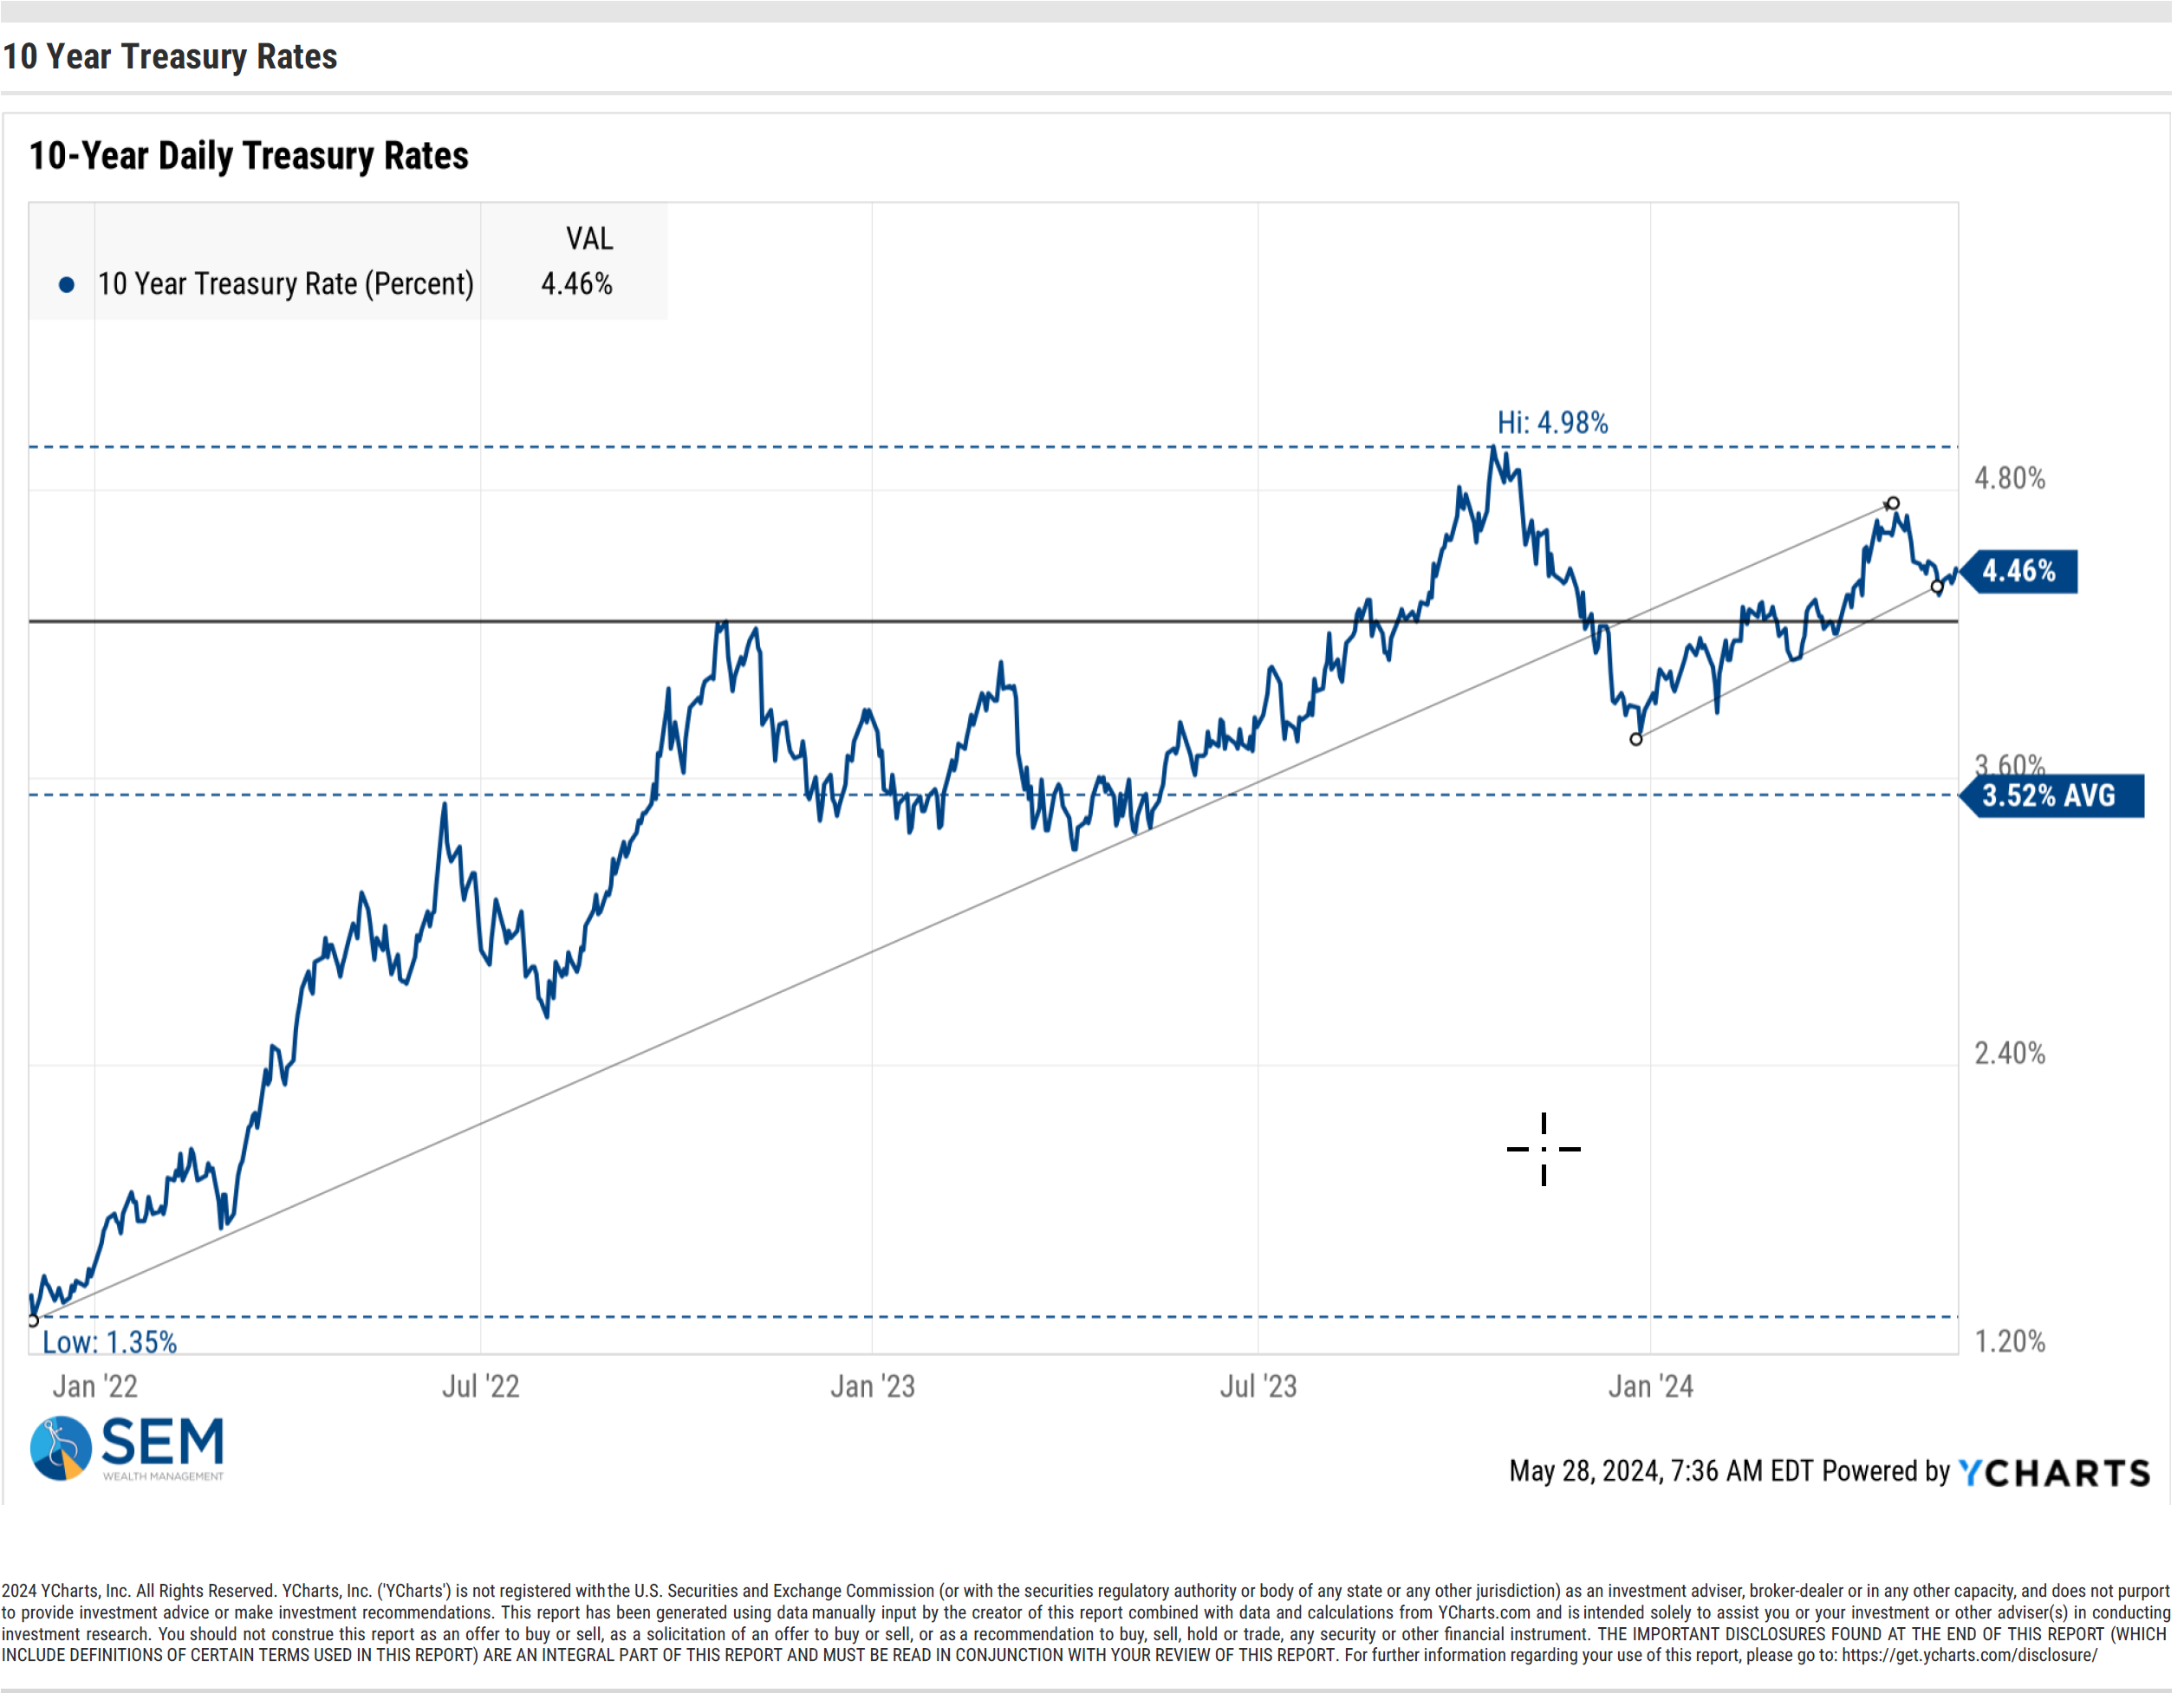
Things are certainly not normal with interest rates, so we should expect abnormal behavior.
We've heard a lot about the inverted yield curve and the success rate of it in predicting a looming recession. While the recession has not come as expected (if you don't count the 2-quarters of negative GDP in summer 2022), it is still a concern with the yield curve inverts (or moves to a more inverted state.) Here is the 10-year chart of the difference between 10-year and 2-year Treasury rates.
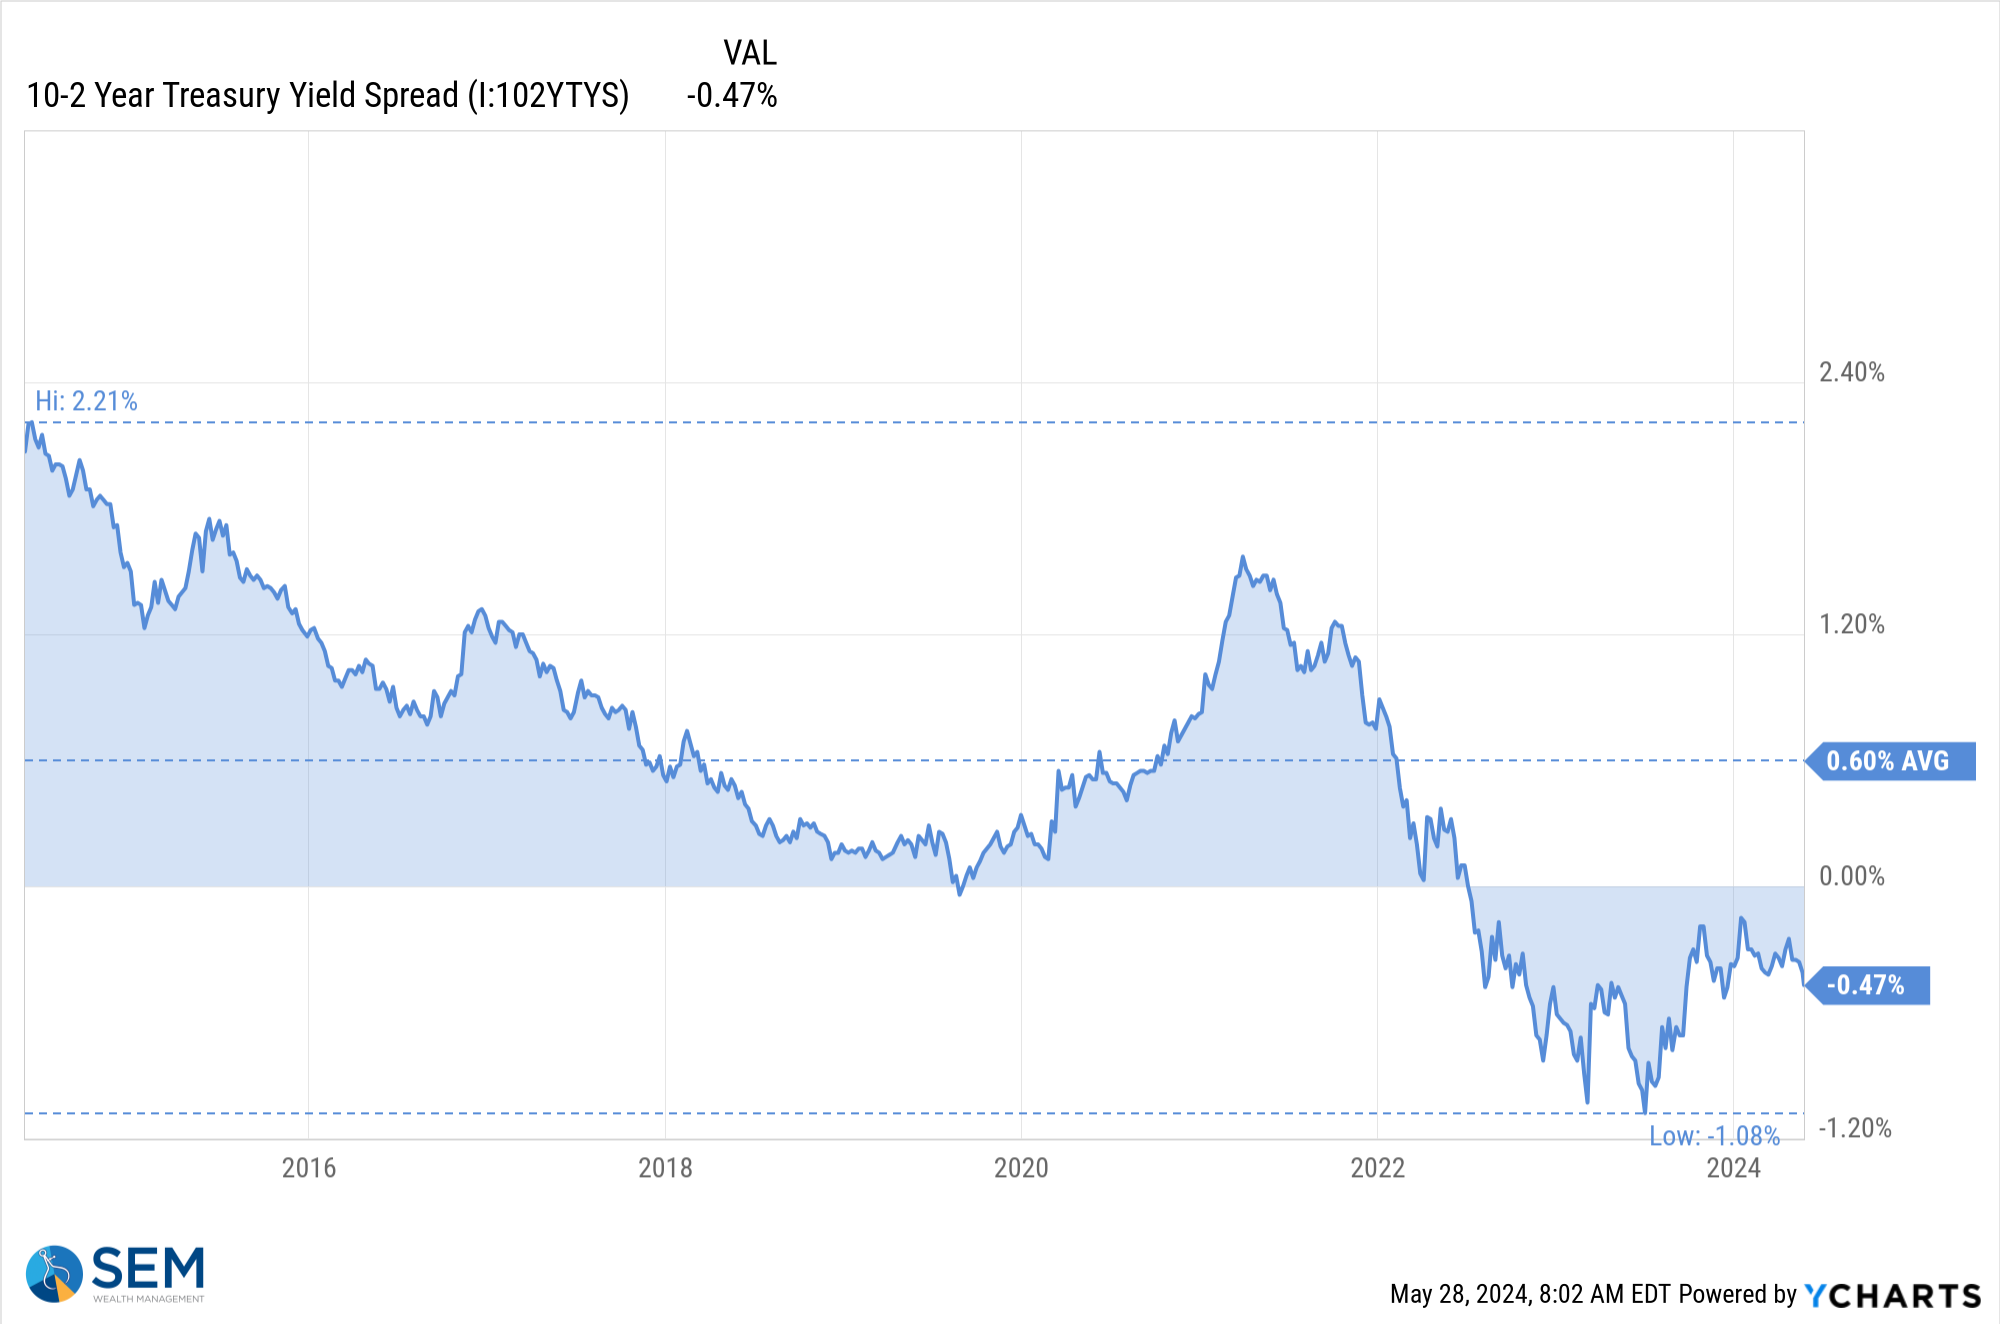
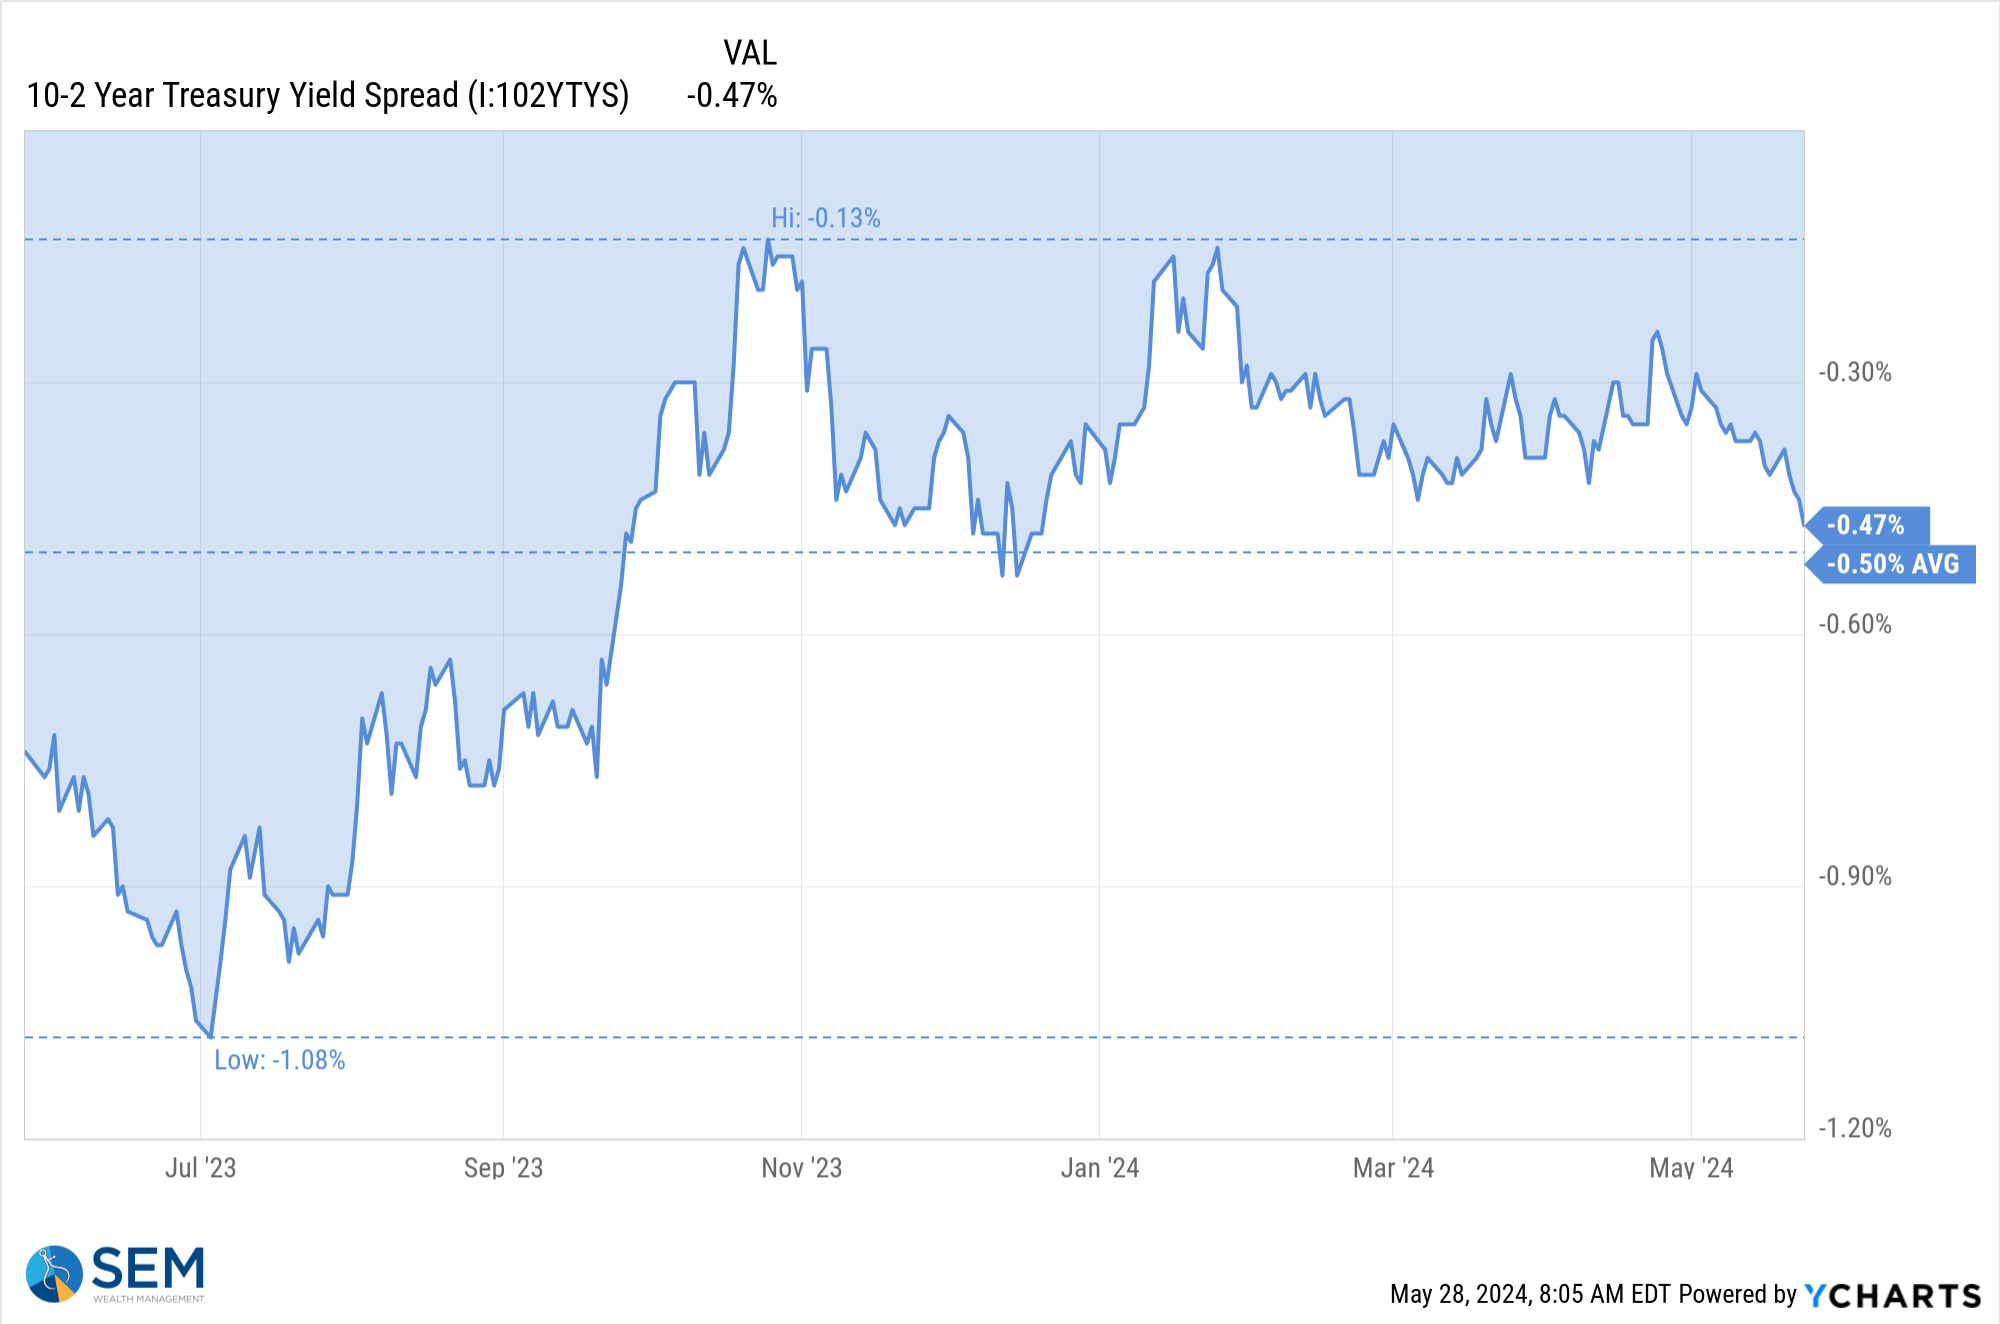
The healthier the economy the higher the spread tends to be. Zooming in, we can see the bond market has become more concerned about the health of economy (or the stickiness of inflation) and has pushed the spread to its most negative reading since late 2023.
There are plenty of cross-currents to be concerned about. Politics may play a role in the sentiment of the market as we move into summer, but again, your political opinions should not influence your investment decisions. Our various models are split in terms of their own sentiment, which makes sense given the wide variation in the data right now.
SEM Model Positioning
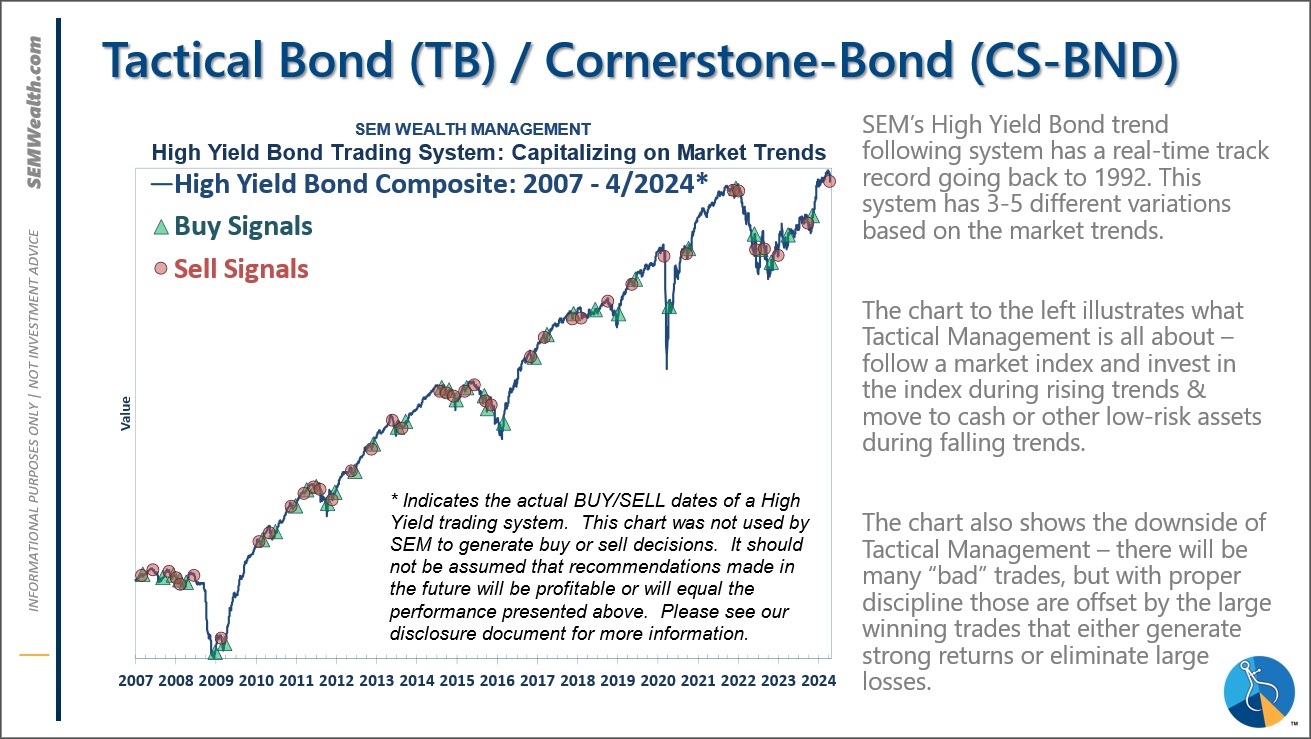
-Tactical High Yield had a partial buy signal on 5/6/24, reversing some of the sells on 4/16 & 17/2024
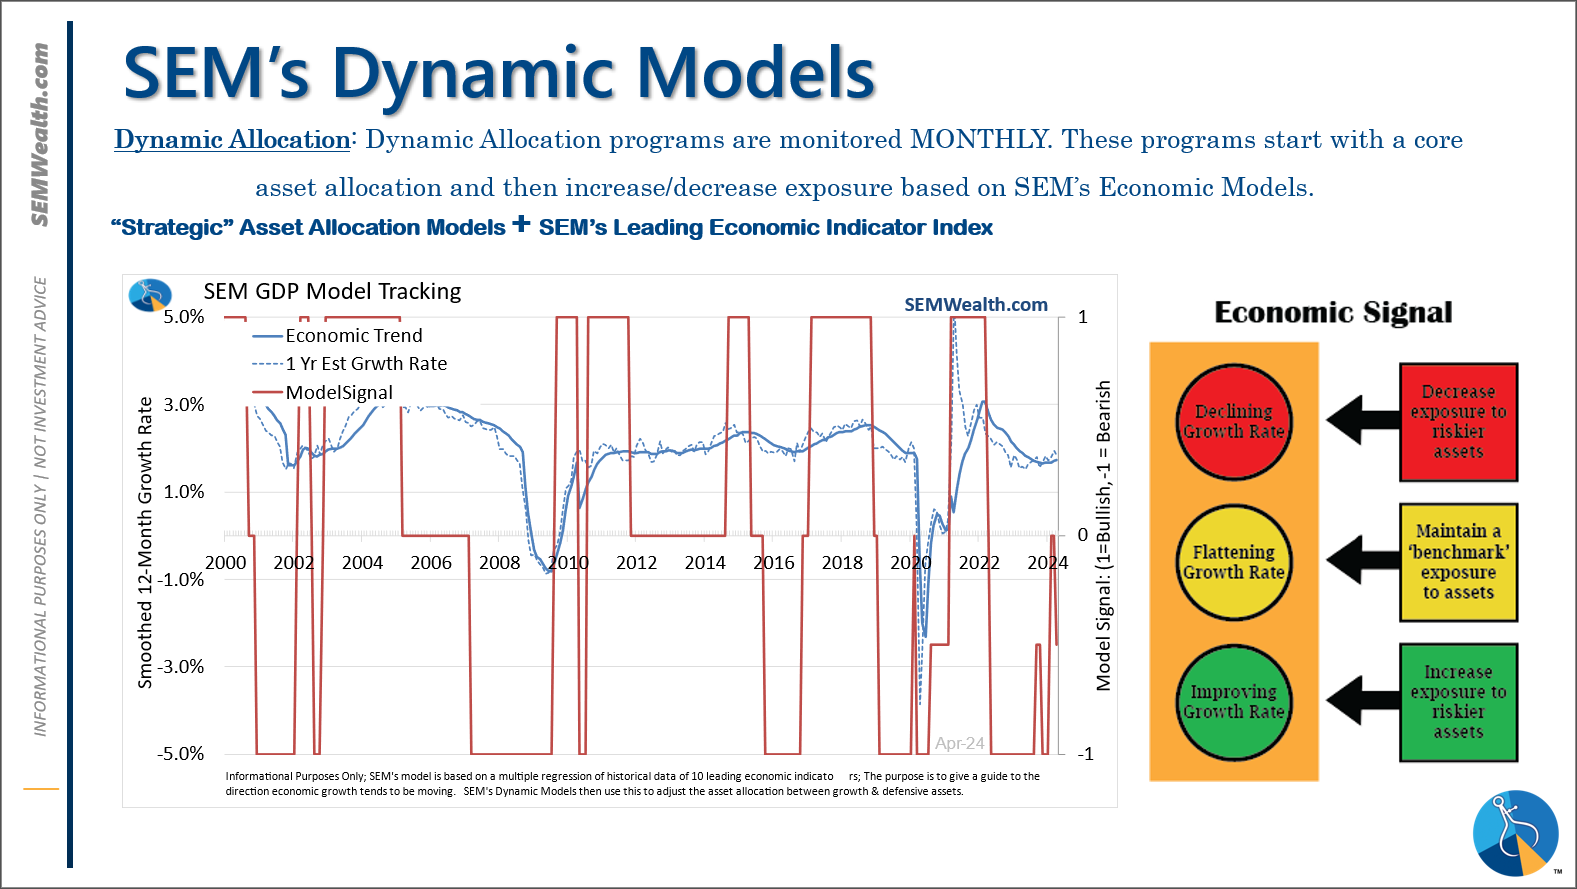
-Dynamic Models went half 'bearish' 5/3/2024
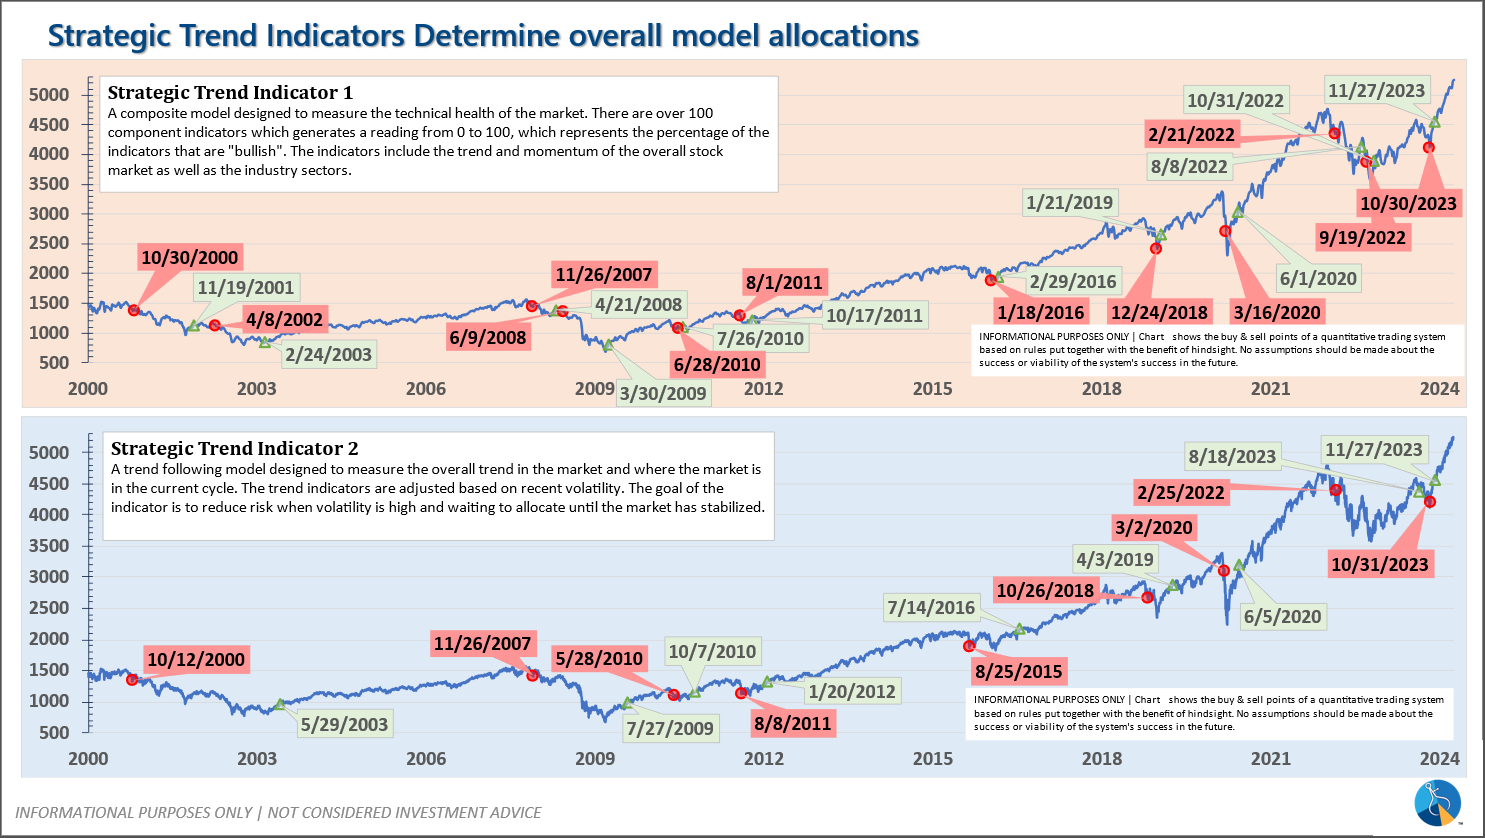
-Strategic Trend Models went on a buy 11/27/2023
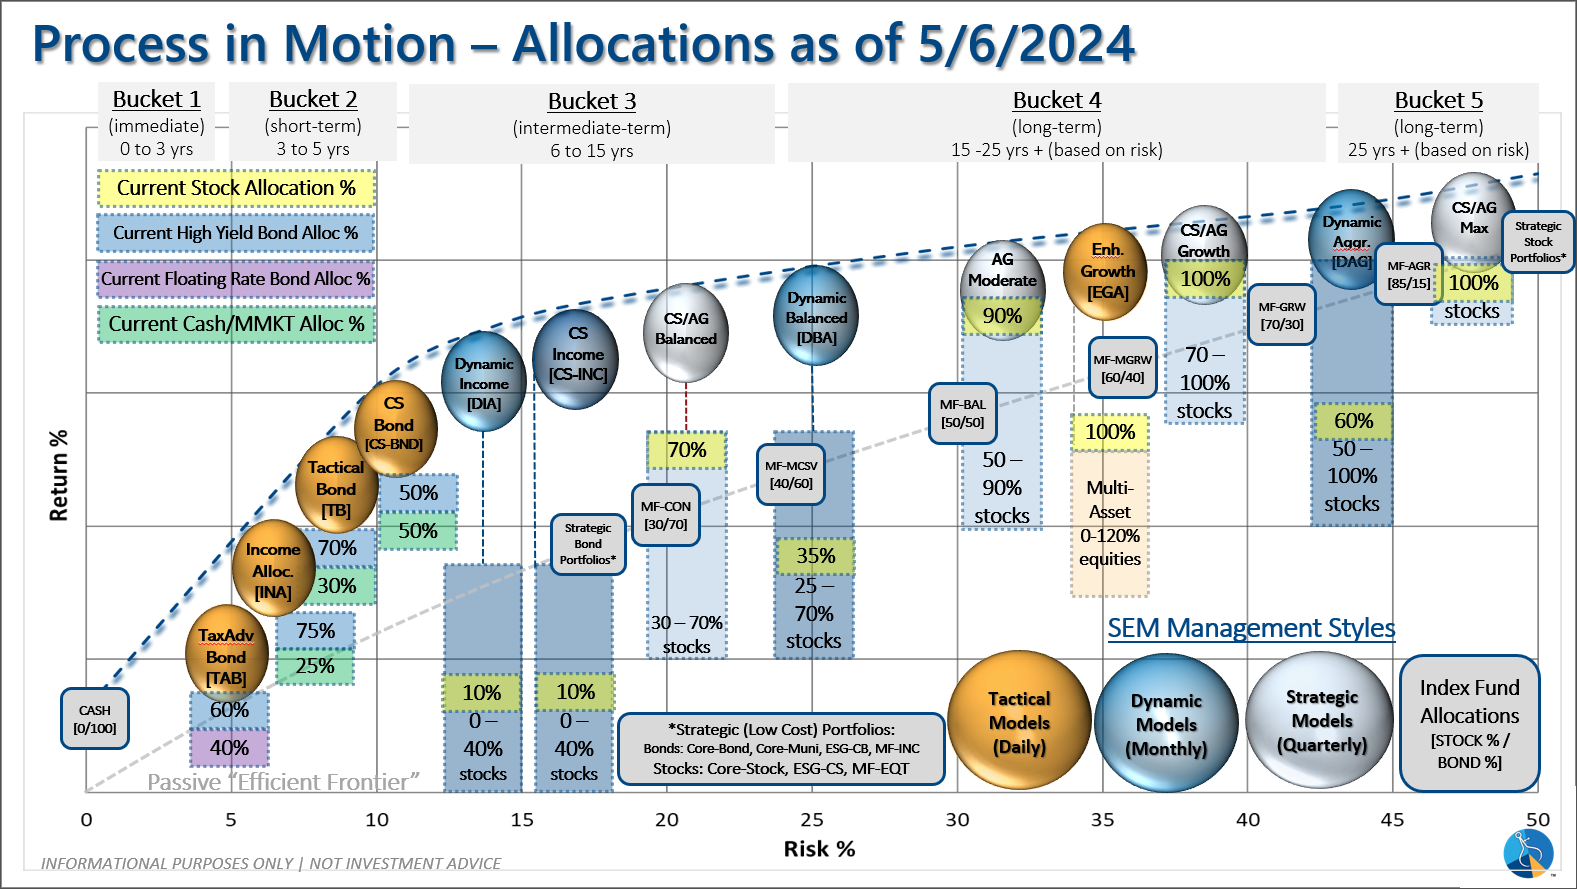
SEM deploys 3 distinct approaches – Tactical, Dynamic, and Strategic. These systems have been described as 'daily, monthly, quarterly' given how often they may make adjustments. Here is where they each stand.
Tactical (daily): On 5/6/24 about half of the signals in our high yield models switched to a buy. The other half remains in money market funds. The money market funds we are currently invested in are yielding between 4.8-5.3% annually.
Dynamic (monthly): The economic model was 'neutral' since February. In early May the model moved slightly negative. This means slightly less than benchmark positions – 10% dividend stocks in Dynamic Income and 10% small cap stocks in Dynamic Aggressive Growth.
Strategic (quarterly)*:
BOTH Trend Systems reversed back to a buy on 11/27/2023
The core rotation is adjusted quarterly. On August 17 it rotated out of mid-cap growth and into small cap value. It also sold some large cap value to buy some large cap blend and growth. The large cap purchases were in actively managed funds with more diversification than the S&P 500 (banking on the market broadening out beyond the top 5-10 stocks.) On January 8 it rotated completely out of small cap value and mid-cap growth to purchase another broad (more diversified) large cap blend fund along with a Dividend Growth fund.
The * in quarterly is for the trend models. These models are watched daily but they trade infrequently based on readings of where each believe we are in the cycle. The trend systems can be susceptible to "whipsaws" as we saw with the recent sell and buy signals at the end of October and November. The goal of the systems is to miss major downturns in the market. Risks are high when the market has been stampeding higher as it has for most of 2023. This means sometimes selling too soon. As we saw with the recent trade, the systems can quickly reverse if they are wrong.
Overall, this is how our various models stack up based on the last allocation change: