Throughout the 2023-2024 rally we've had two competing sides. The bulls have argued the gains have been justified because earnings, especially in technology companies have been accelerating. The bears have countered that even with the technology earnings increases, overall market valuations are hitting levels only seen during the end of the 1999 & 2007 bubbles.
I've not spent much time trying to support either side because ultimately the market goes up when more people buy than sell and drops when more people sell than buy. When the mood is positive all data will be seen as a 'great' and when the mood is negative most data is viewed as 'worrisome'. These moods move in cycles. Investors become overly optimistic, raising expectations to levels that simply cannot be sustained. This is followed by an overly pessimistic cycle where the expectations are so negative it becomes easy to "surprise" to the upside.
We've clearly been in an overly optimistic cycle for quite some time, which started on the heels of the overly pessimistic expectations amid the Fed's inflation fight of 2022. Going into the year the market was pricing in 6-8 Fed rate cuts totaling a 1.5-2% drop in rates this year. This was despite the expectation the economy would grow at a 3% clip (which is the long-term average). They were also expecting earnings to grow at an impressive 15% rate, well above the 9-10% long-term average.
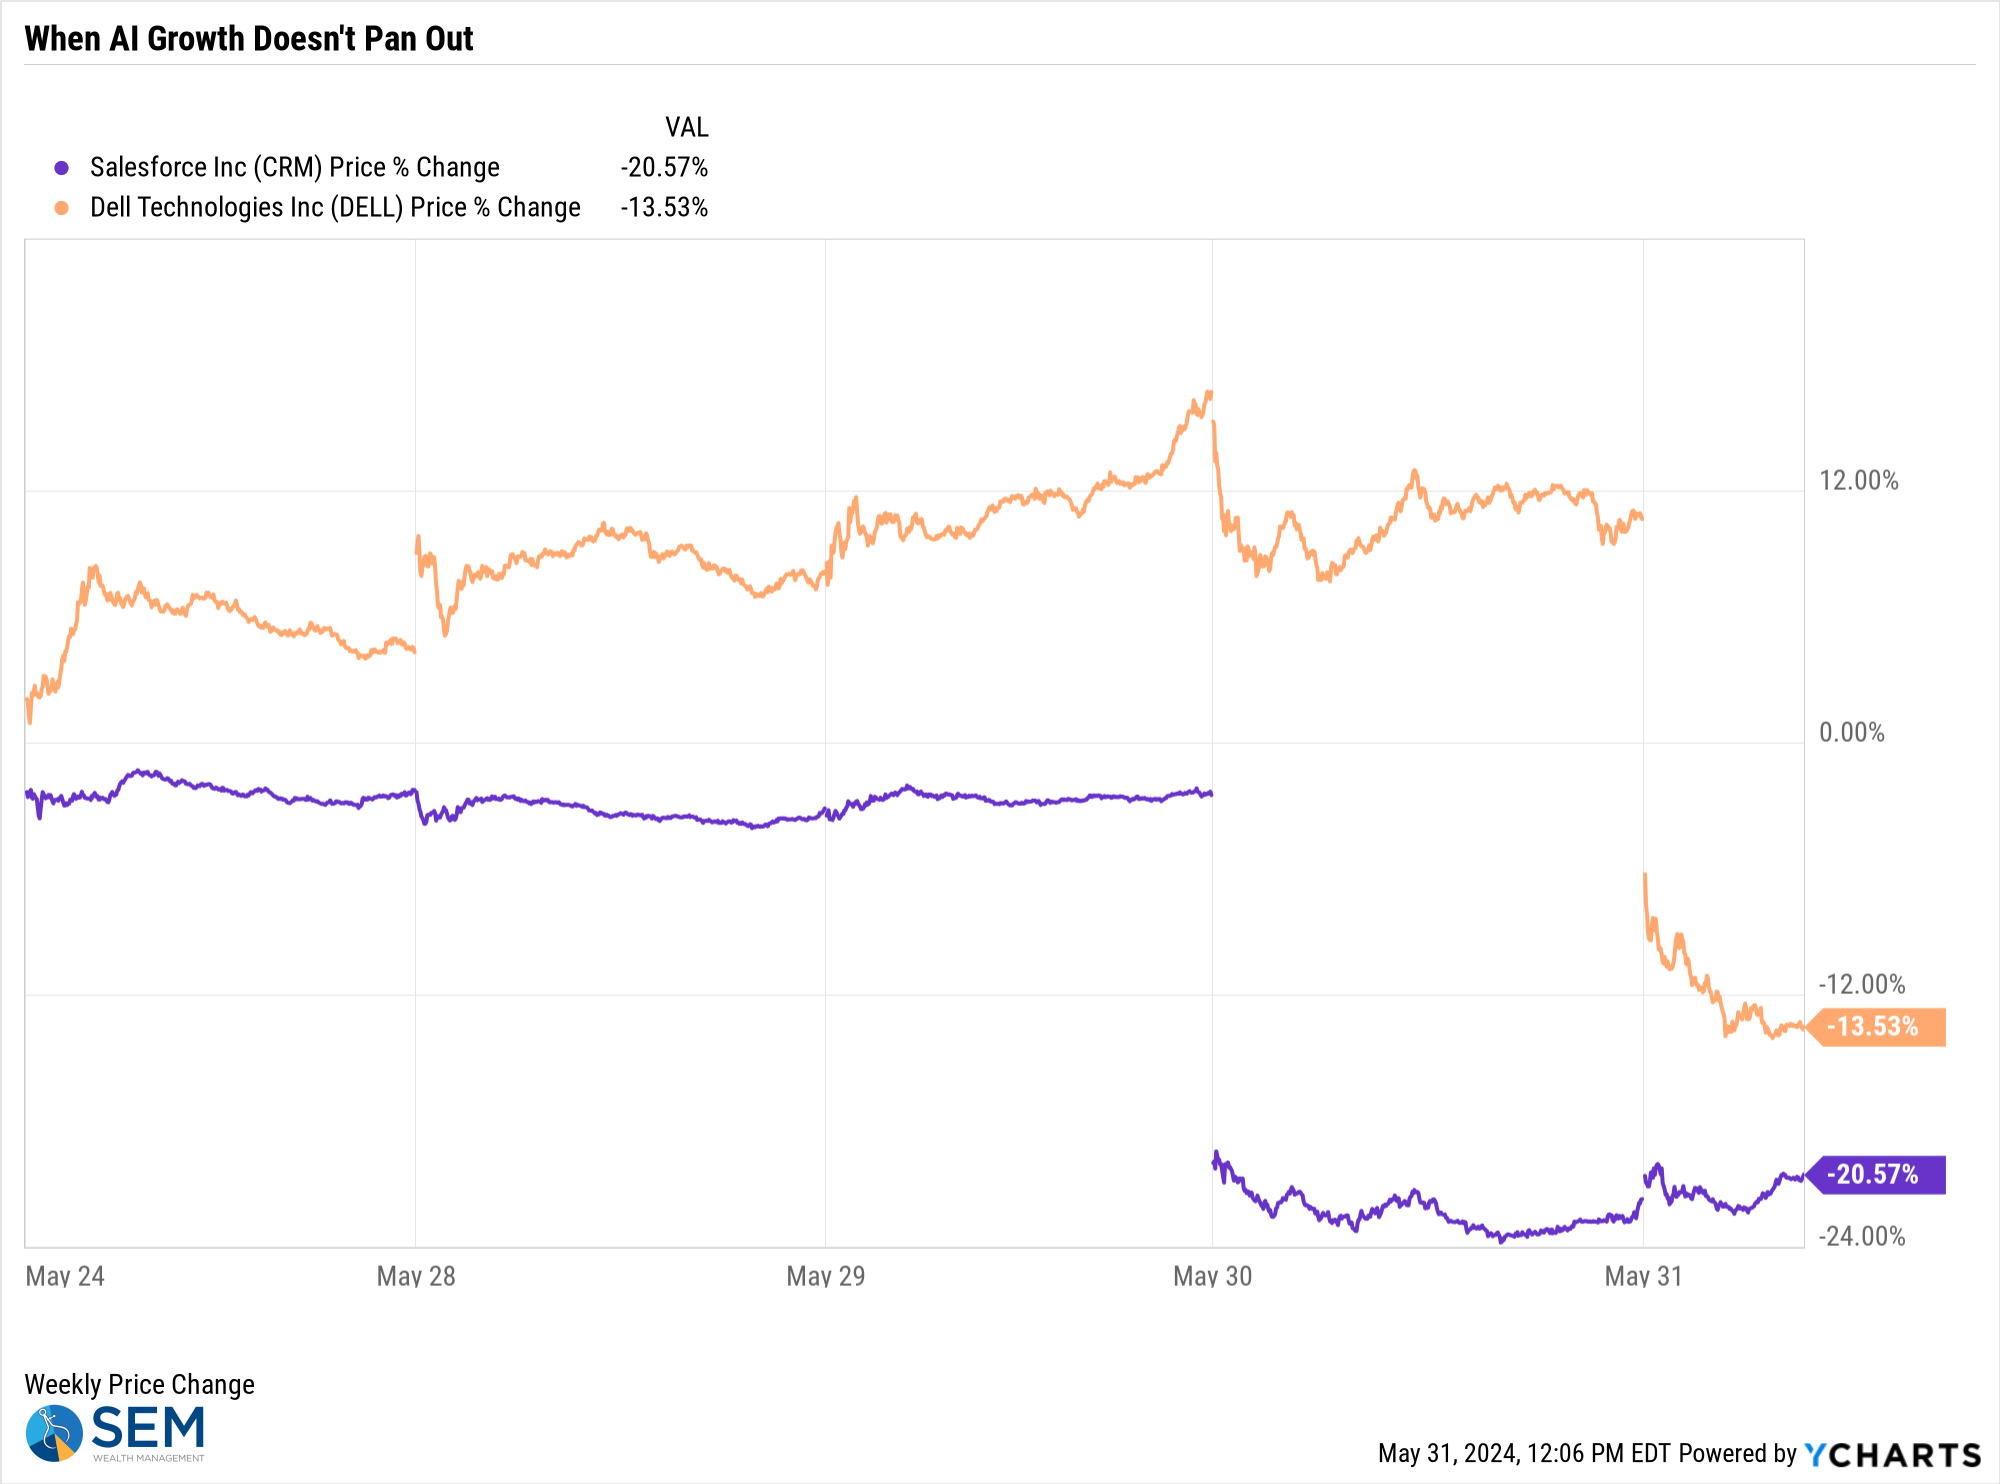
What happens when AI growth disappoints?
The problem when you're expecting strong growth is when a company misses those expectations the stock can be crushed. In 2023 companies learned quickly if they mentioned "AI" in their earnings calls their stock would get a nice boost. Sooner or later they will have to actually produce AI driven growth. This week we saw two examples of what happens when they fail to do so.
The first was SalesForce, which in 2023 had been touting their AI initiatives. Those initiatives have not only increased costs, but have not turned into increased profits or subscriptions. The stock at one point was down 25% on the day. It turns out because other companies have been spending a lot more money on technology, their budgets for Sales Force subscriptions have been cut.
Another example was Dell Technologies, who this year has goosed their stock by focusing on their AI-related server business. Growth was certainly strong last quarter, but nowhere near the expectations the market had. The stock was up 12% for the week going into the earnings report. It quickly lost 25% as expectations were adjusted. The realization is these servers are expensive and not every company can afford to purchase them at the rate everyone was expecting.
David Rosenberg highlighted the problem with those arguing this is an 'earnings driven' market.
I keep hearing this has been an ‘earnings driven’ market. Sure. EPS +6% YoY and the S&P 500 is up +26%. A 3-point multiple expansion from Oct-May is a near-2 SD event and at ~21x on the fwd. P/E, this is the top decile overvalued equity markets of all time.
— David Rosenberg (@EconguyRosie) May 29, 2024
Earnings estimates for 2024 and 2025 have barely moved, but yet the P/E multiple has gone up by 3 points from an already high level. Buying a market already expecting strong growth means you better hope the growth does not disappoint. Investors (speculators) in SalesForce and Dell learned that the hard way last week.
Is bad news bad news again?
Sometimes when the market is counting on Fed rate cuts, bad economic data is met with a positive reaction as it makes it more likely the Fed would cut rates sooner or more aggressively. This of course is counter intuitive for most because a weaker economy means slower consumer spending, which means weaker corporate earnings growth.
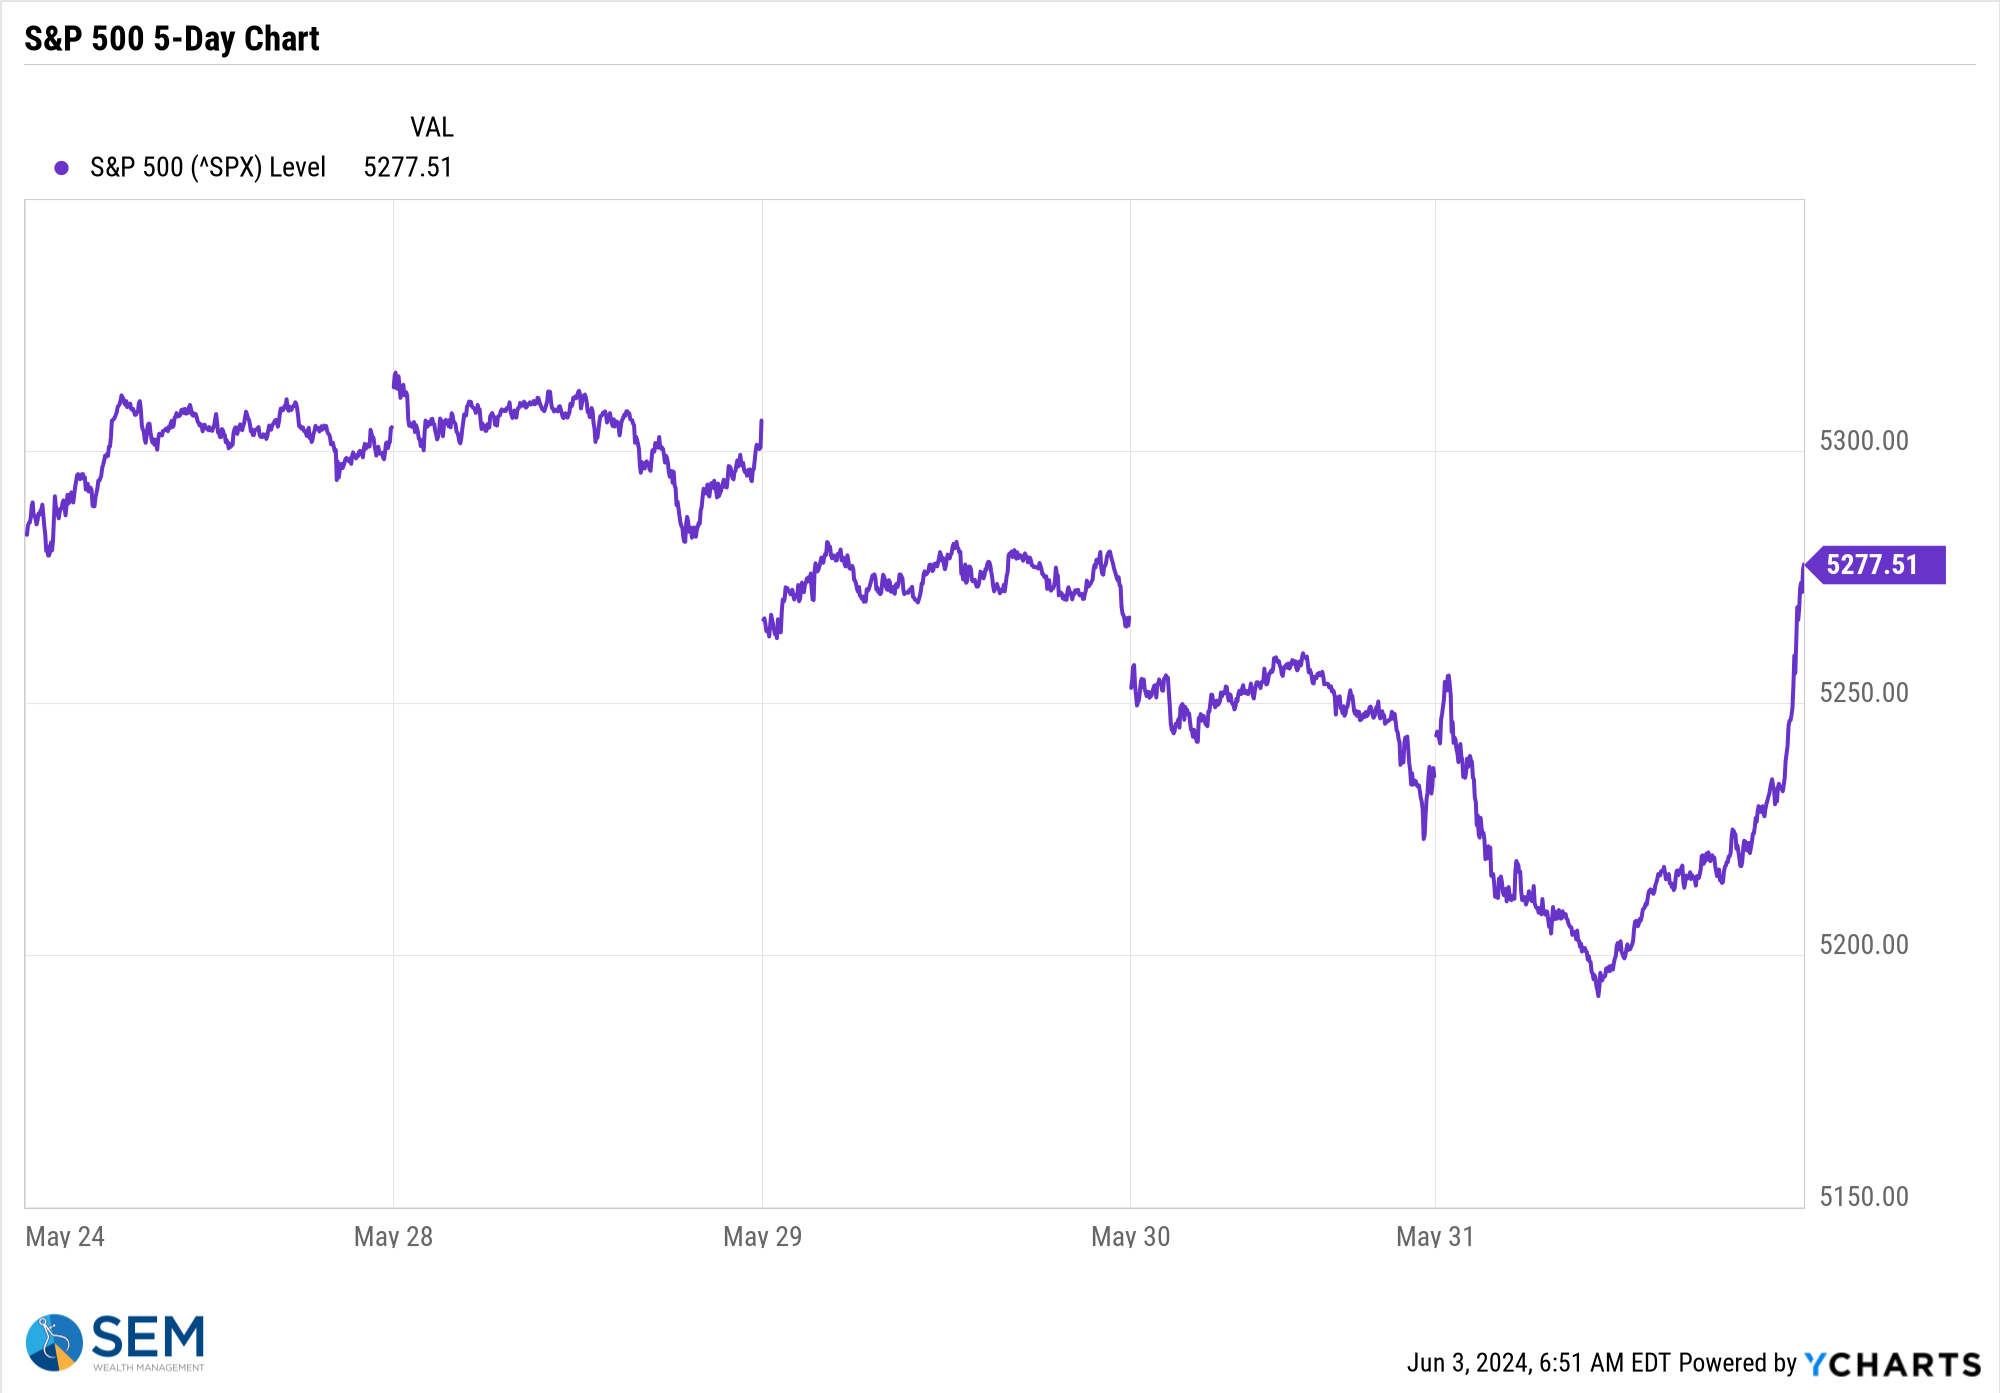
Last week we saw quite a few "bad" economic data points. These were met with SELLING in stocks (which is what most of us would expect).
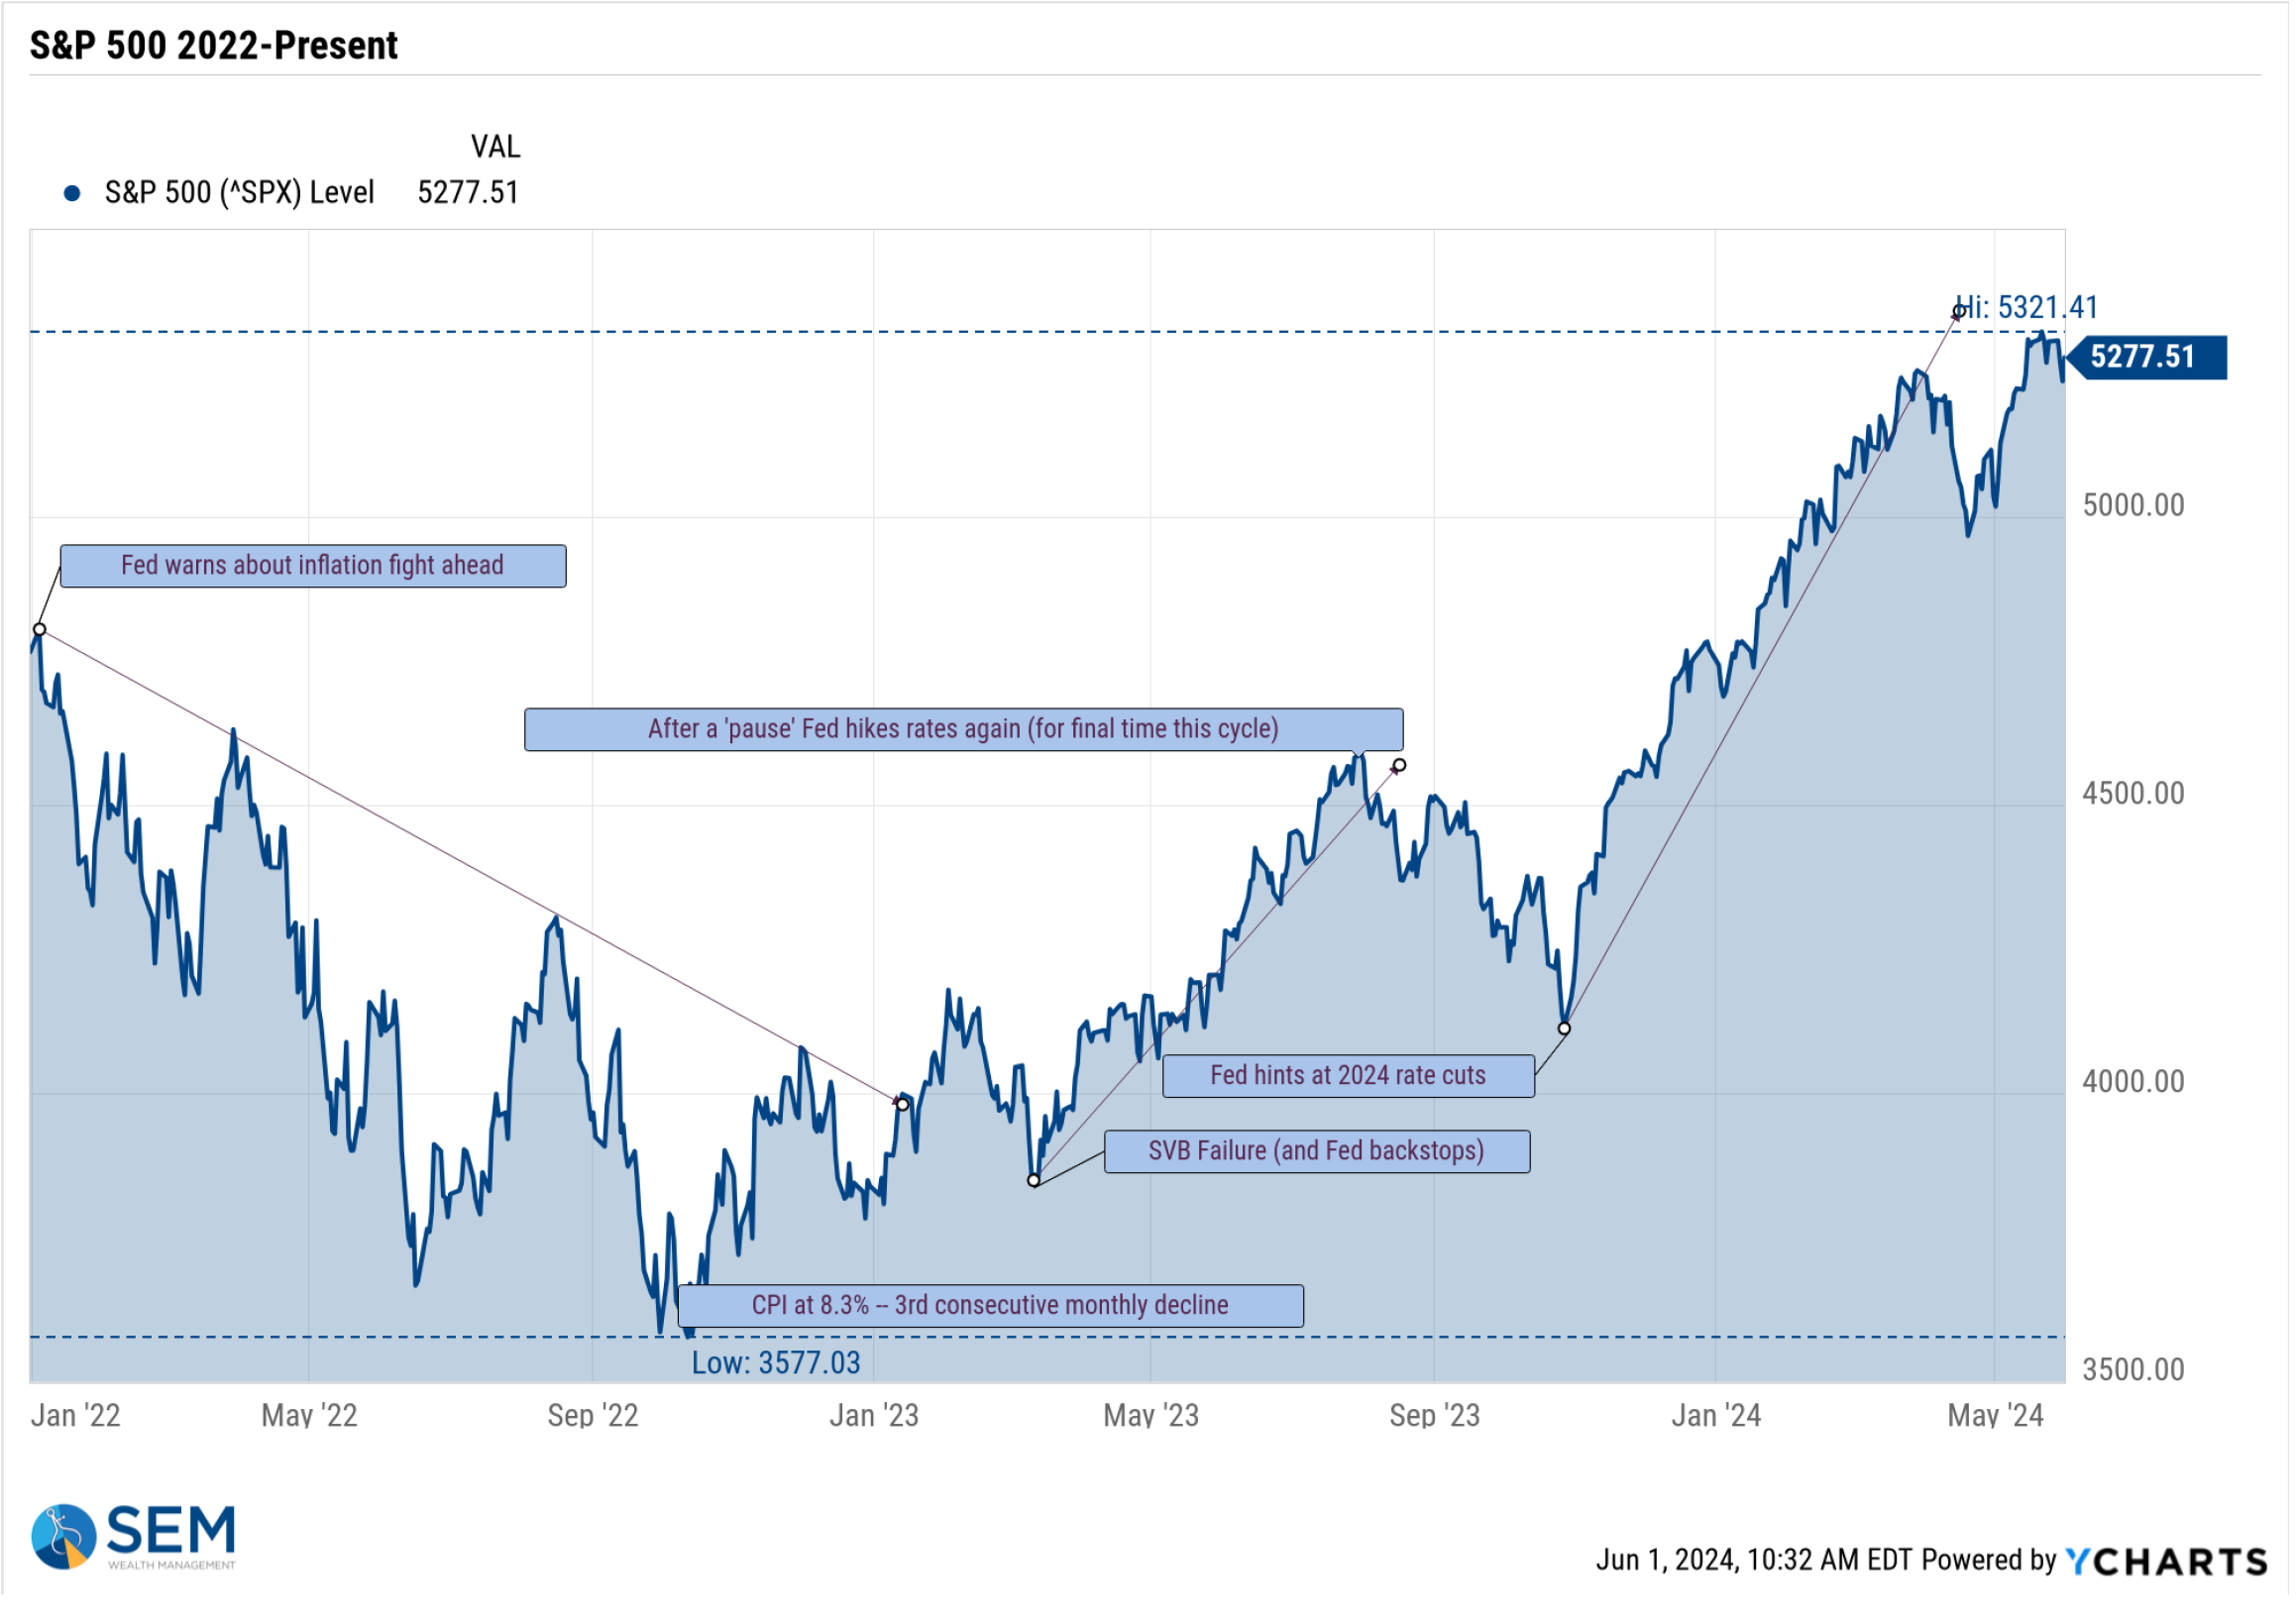
[Note: There was some strange activity in the last 20 minutes on Friday (see chart below), most likely surrounding the MSCI Index rebalances and/or closing of some positions ahead of month end which led to some short covering. The S&P 500 jumped 0.85% in the last 20 minutes. Overall Technology and Growth sectors still had a bad week, with value sectors such as utilities seeing large inflows and gains.]
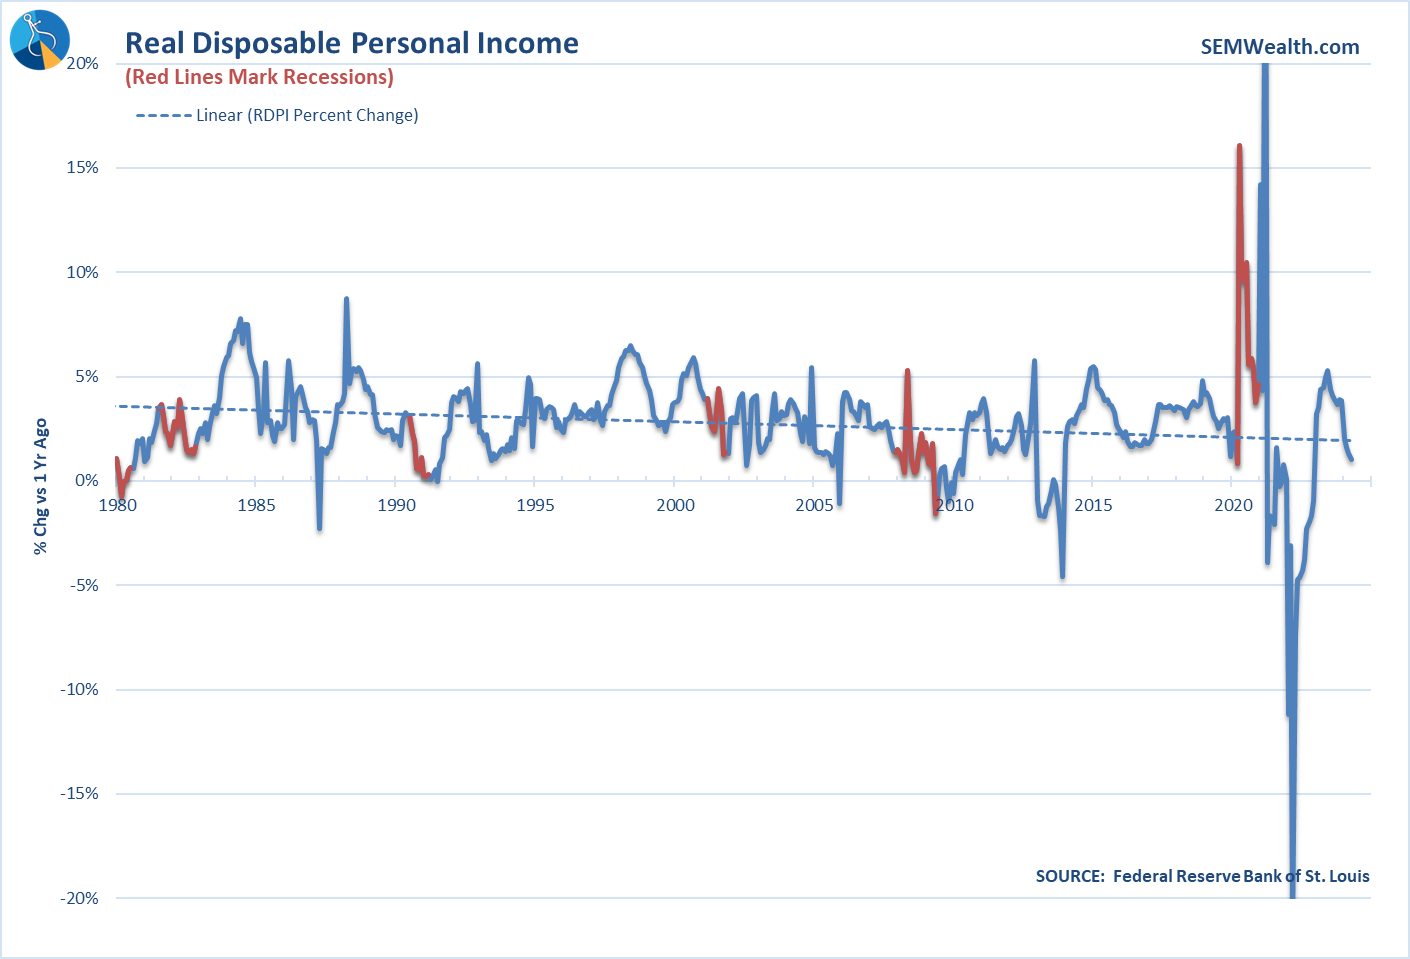
Consumer spending slowing, income not keeping up
Consumers have been the driver of the economy. Spending growth has continued to surprise, but it has obviously weakened from the stimulus driven surge.
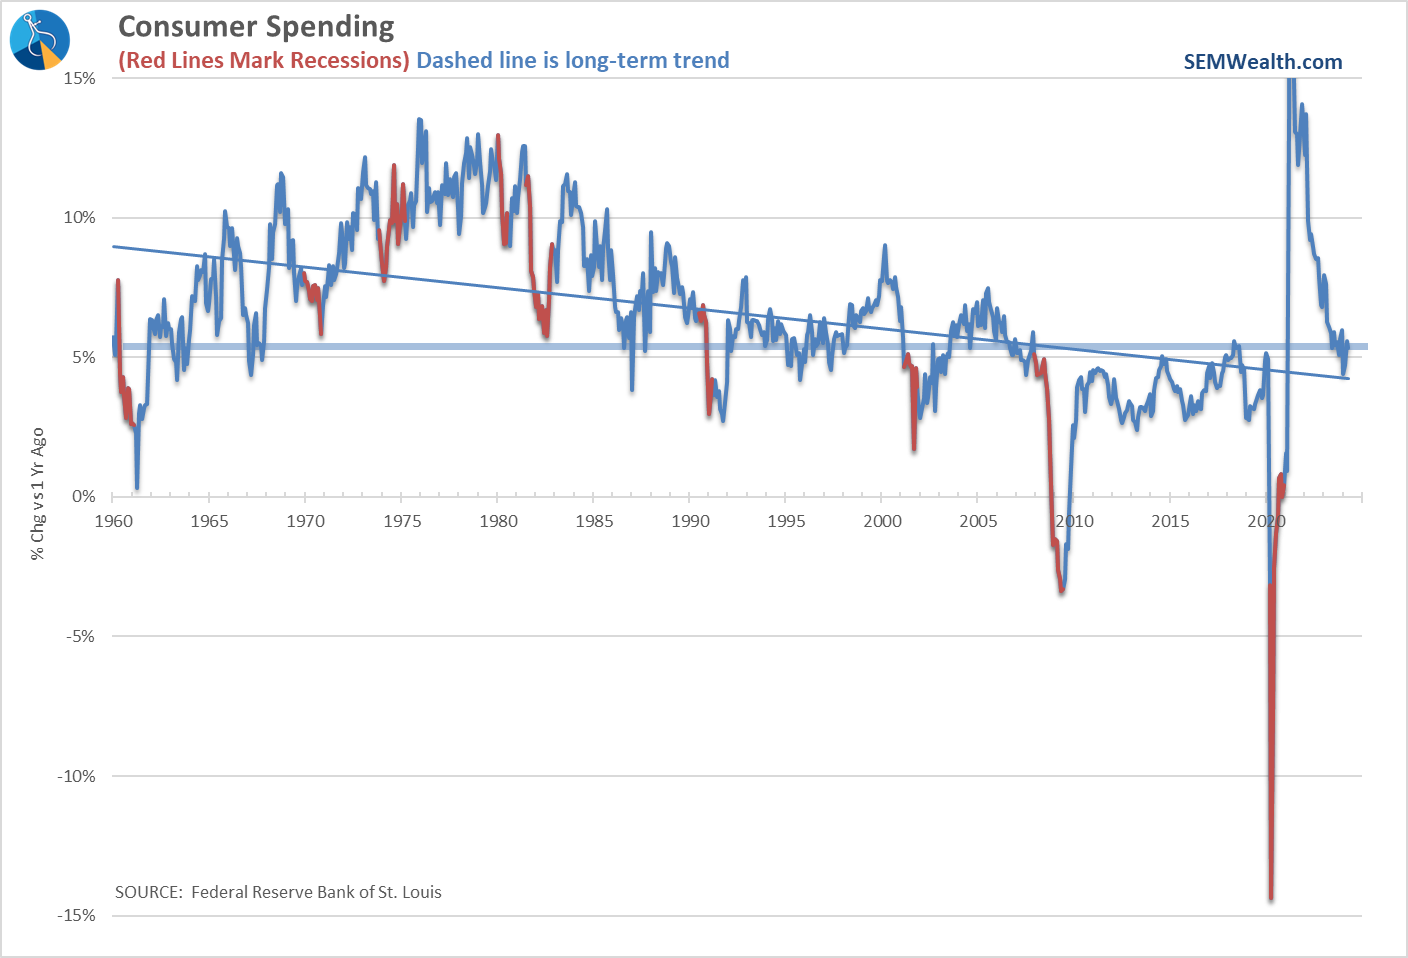
The bigger concern remains in personal income growth, which was up just 1% over the past year (compared to a 5% jump in spending.)
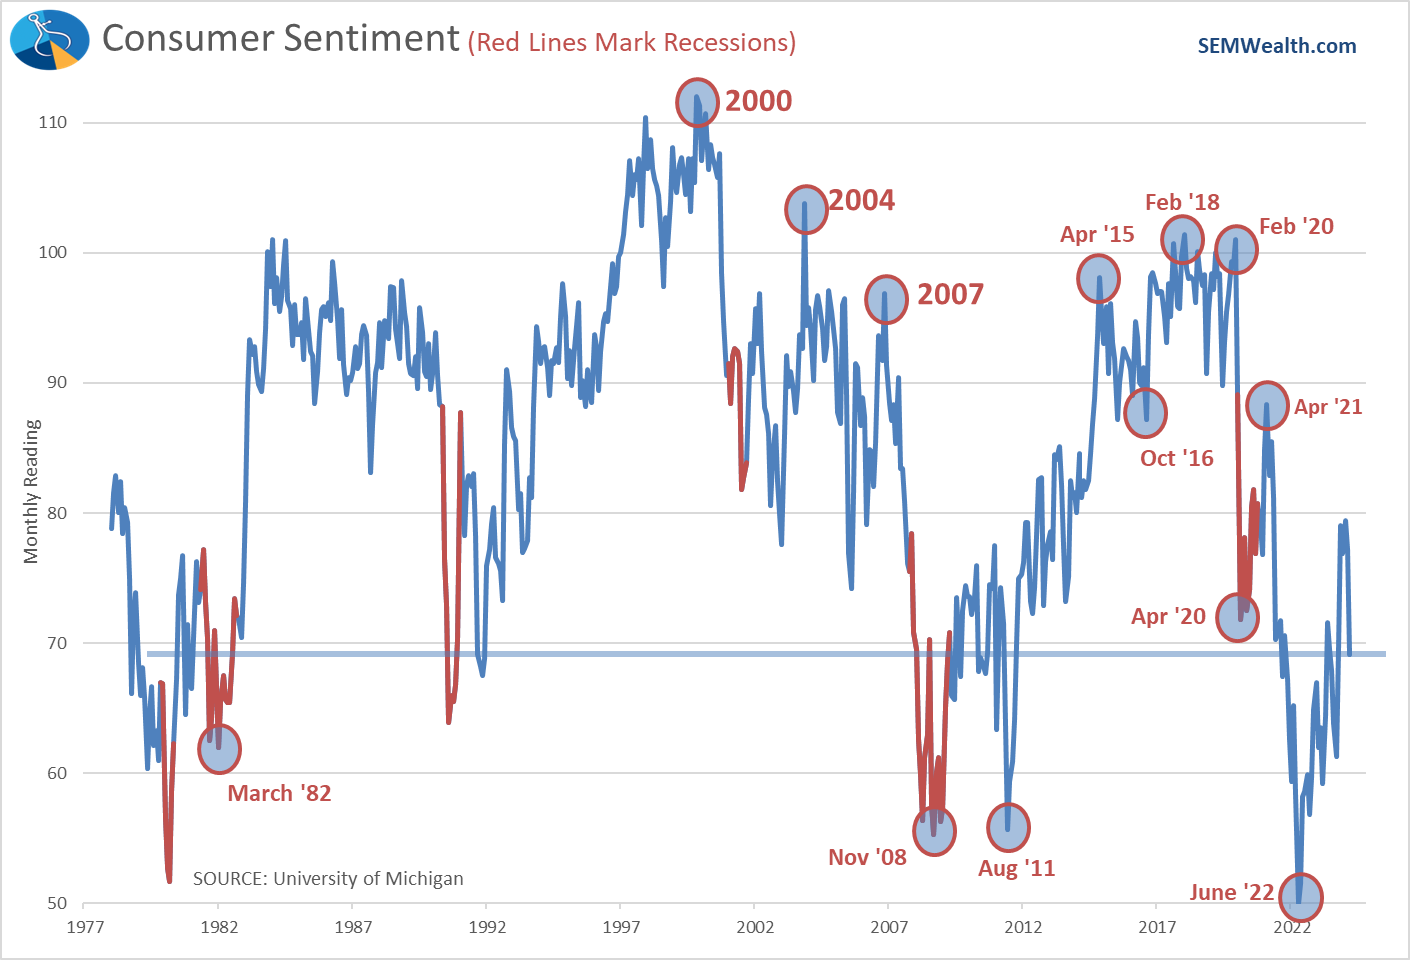
Consumer falling again
Last week we talked about the overall negative sentiment towards our economy expressed by likely voters (click here for the data). As we 'normalize' away from the post-pandemic, stimulus fueled surge we should expect a consumer who doesn't feel 'good' to slow their spending. The latest Consumer Sentiment readings highlight the current mood with sentiment now below the April 2020 levels.
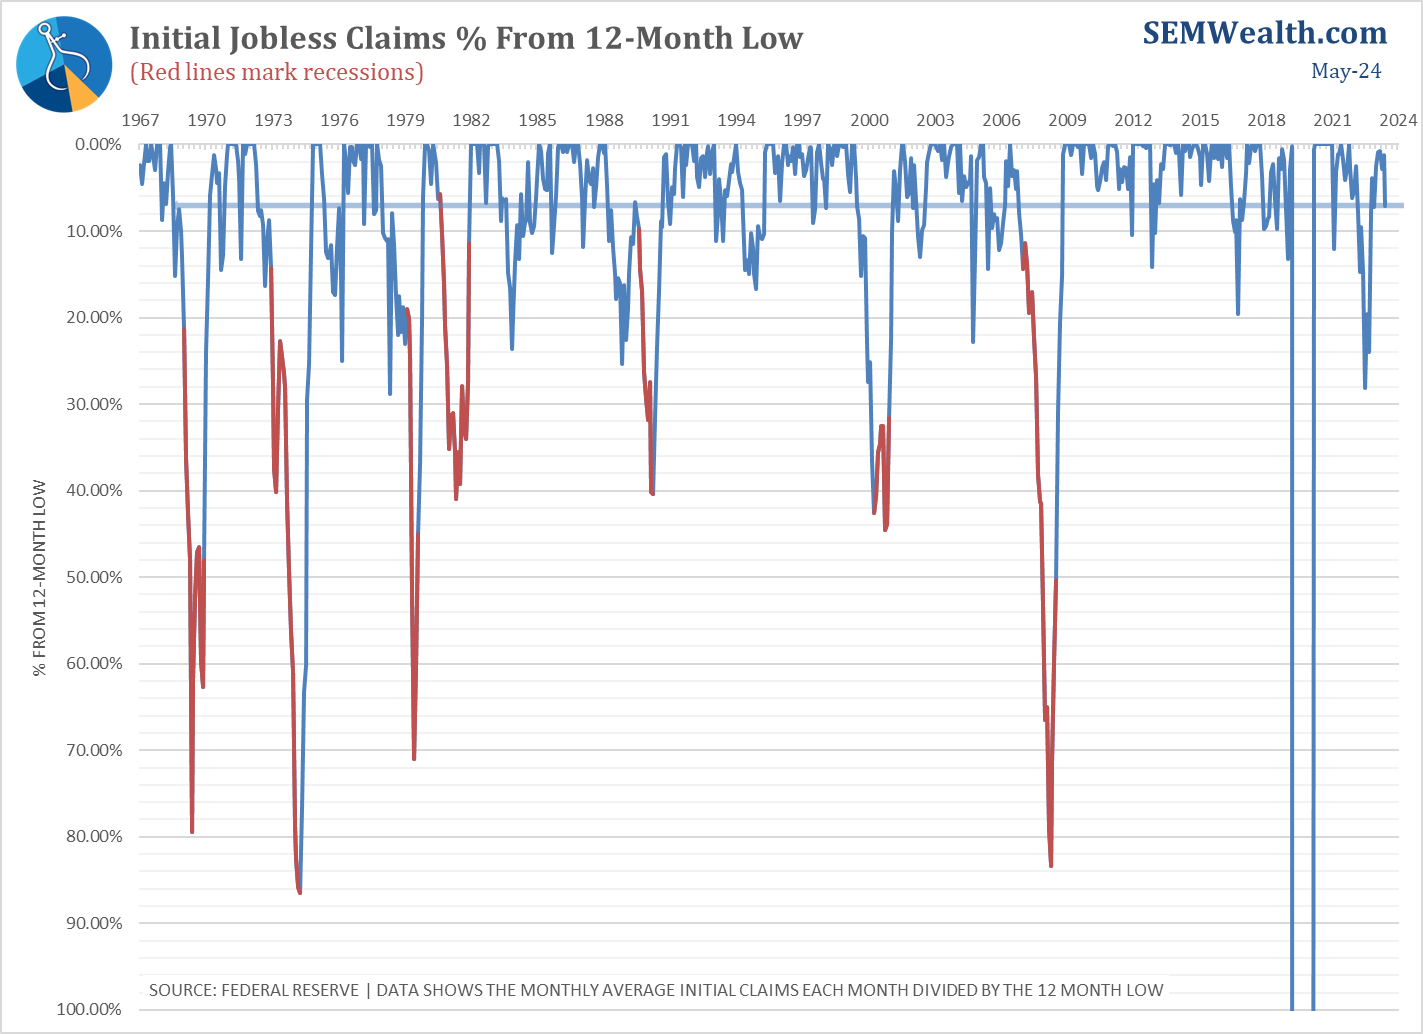
Jobless claims increasing
While still relatively low, we watch the weekly initial jobless claims for signs of labor market weakness. We've seen an uptick the last 4 weeks in claims. While not quite to worrisome levels, this is something everyone should be paying attention to. A spike in layoffs could hit spending pretty quickly.
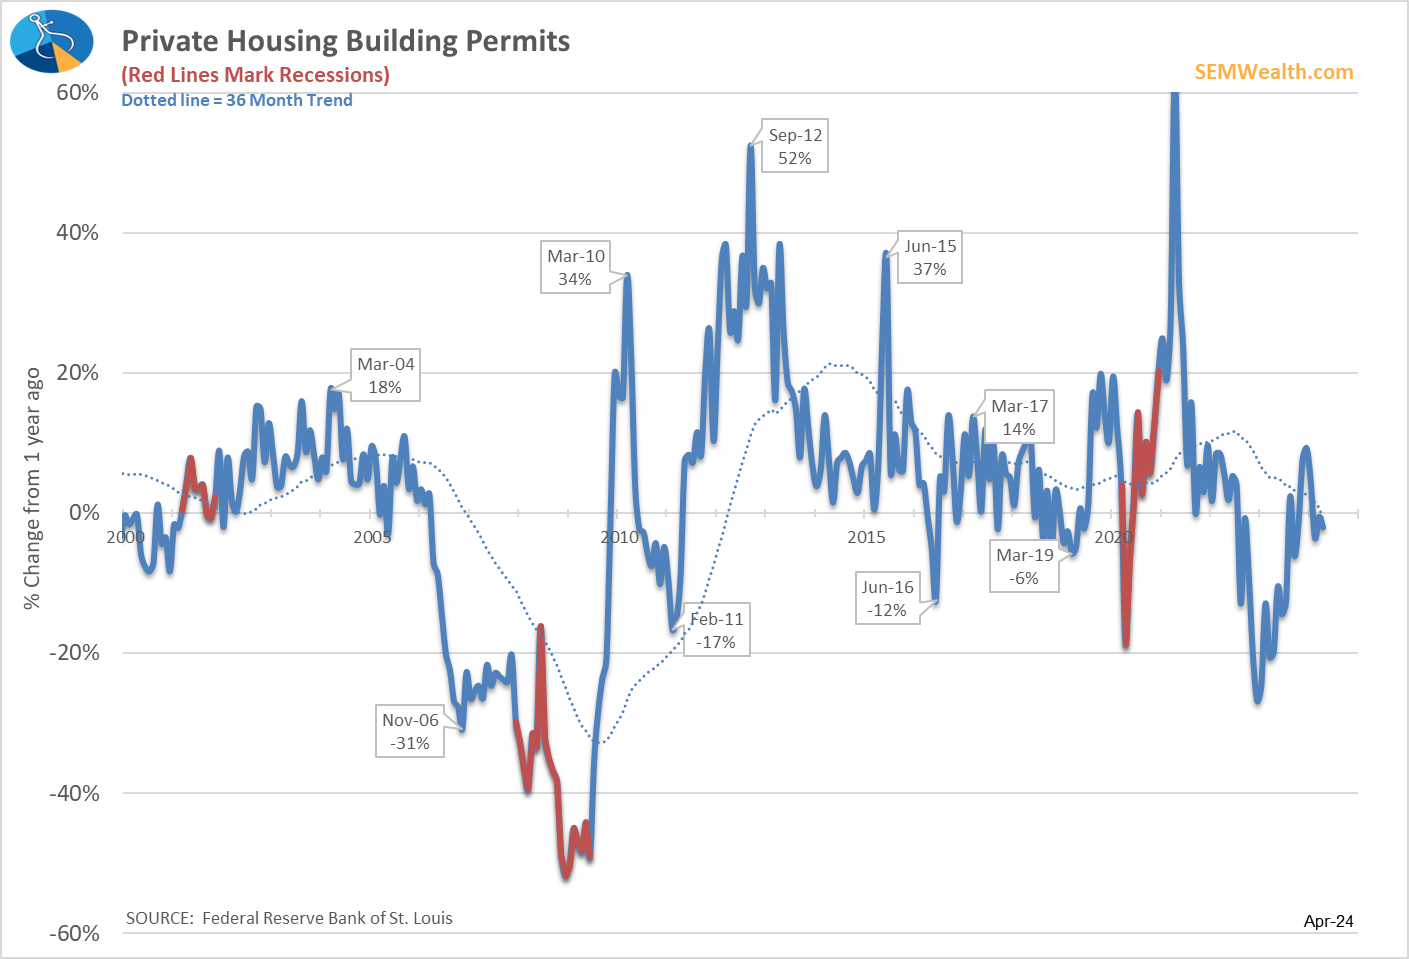
Housing market slowing
While a good sign for those hoping to buy a home, the housing market has slowed markedly. Building permits are declining over the past year.
Worse, the pending home sales index fell to the same level it was in the depths of the pandemic.

Pending home sales, a leading indicator, plunged 7.7% in April to the lowest level since the economy was in pandemic-lockdown recession mode in April 2020. Nice to see how ineffective Fed policy is, right? pic.twitter.com/kaT8nPCig6
— David Rosenberg (@EconguyRosie) May 30, 2024
As we've mentioned several times, the Fed is in a difficult spot. Higher interest rates are finally hurting the housing market (although we haven't seen prices take much of a hit). If the Fed were to cut rates, we could see the market turn right back around which would not help those who cannot afford to move because prices were already too high.
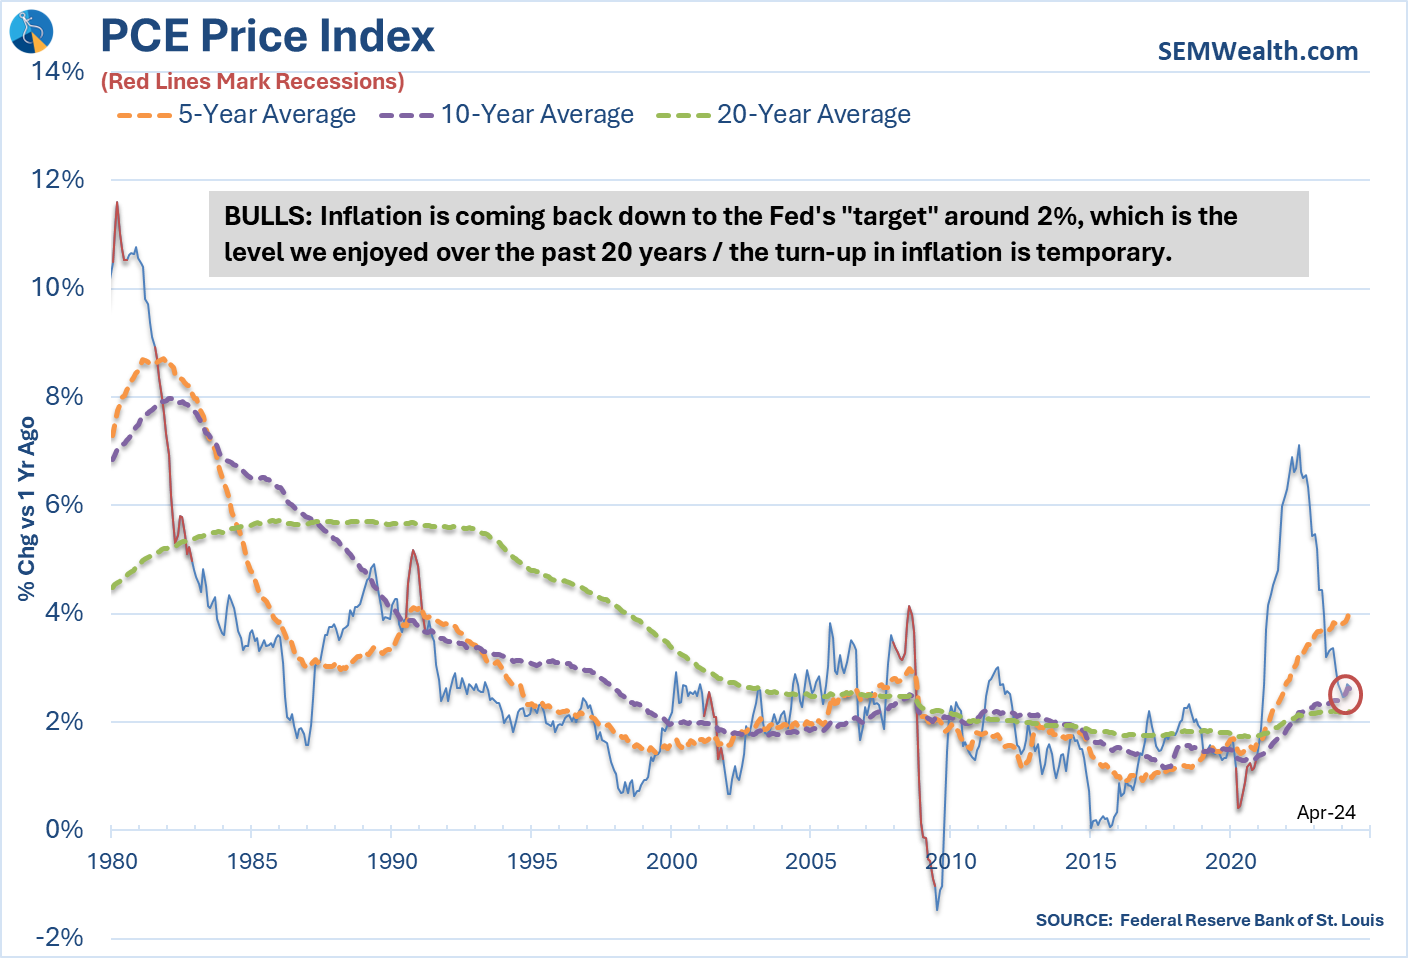
Inflation still too high
Despite the bulls' best efforts to describe the PCE Price Index (the Fed's preferred measure of inflation) as "slowing", inflation does not appear to be moving quickly enough to the Fed's target level of 2%.
I find this chart helpful when looking at these volatile monthly numbers. The Fed (and those banking on rate cuts) need to see more of those bars BELOW the red band. If they remain above it, that is a problem.
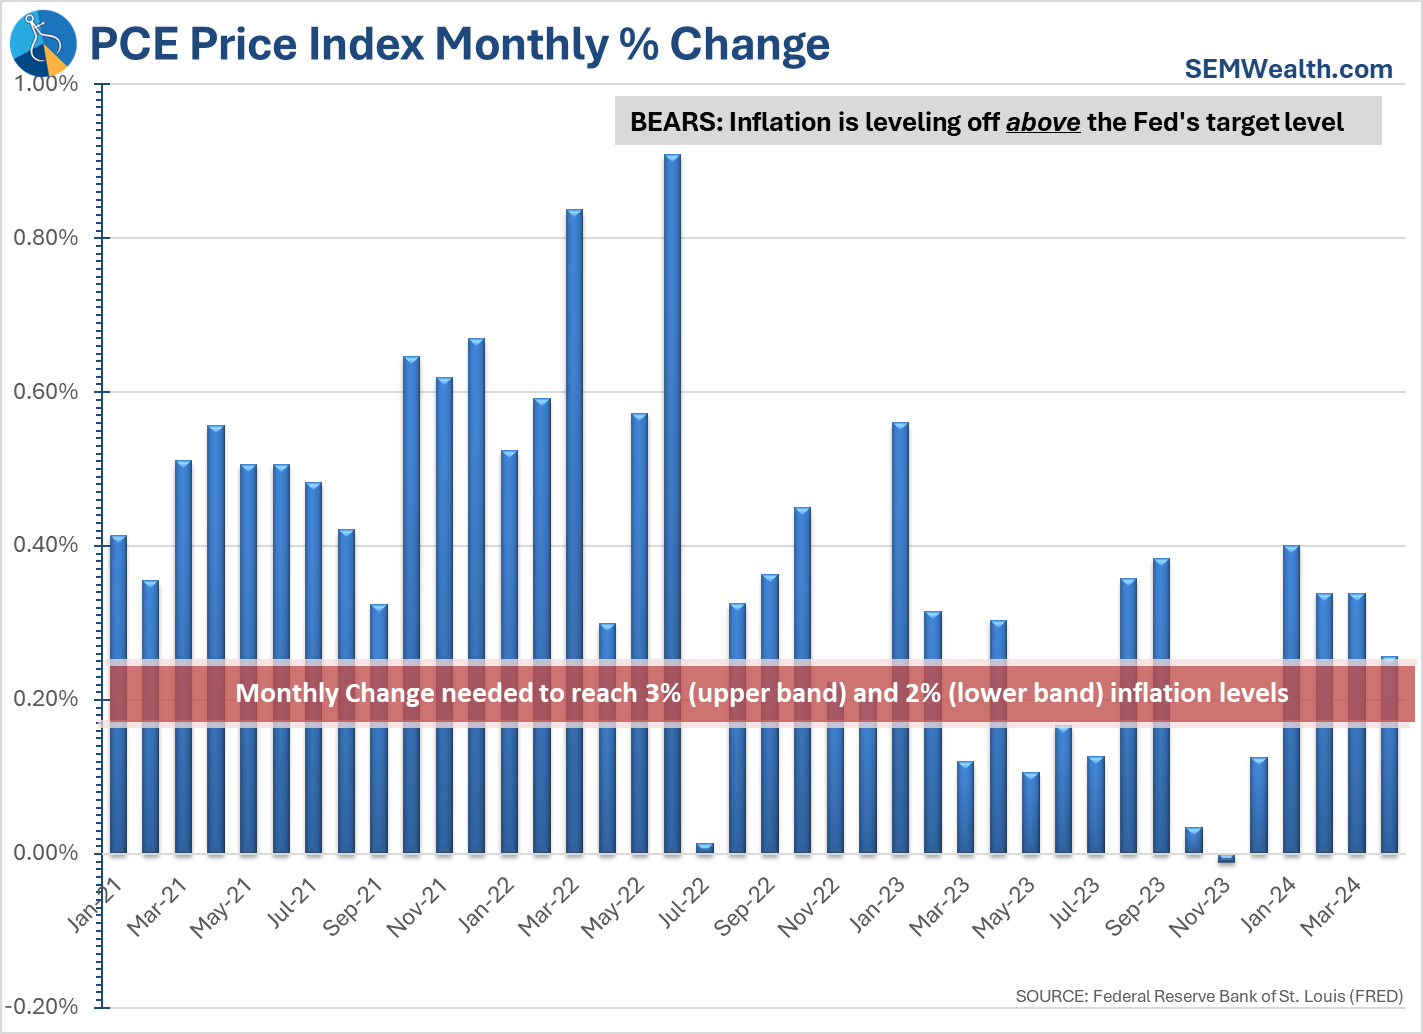
The reason the market sold off on this data is because inflation is not coming down quickly enough and the Fed messaging is they are not ready to cut rates just yet. This leads to the prospect rates will stay 'higher for longer' at a time where economic growth is slowing fairly rapidly. For more on the technical trends and how we are positioned to start the week, check out the sections below.
Market Charts
The S&P 500 spent the week below its all-time high. The technology sector, which is 32% of the S&P 500 struggled, losing nearly 2%. While I welcome a "broadening" of the market to other sectors, the S&P 500 needs tech stocks to regain their momentum to break out to new highs.
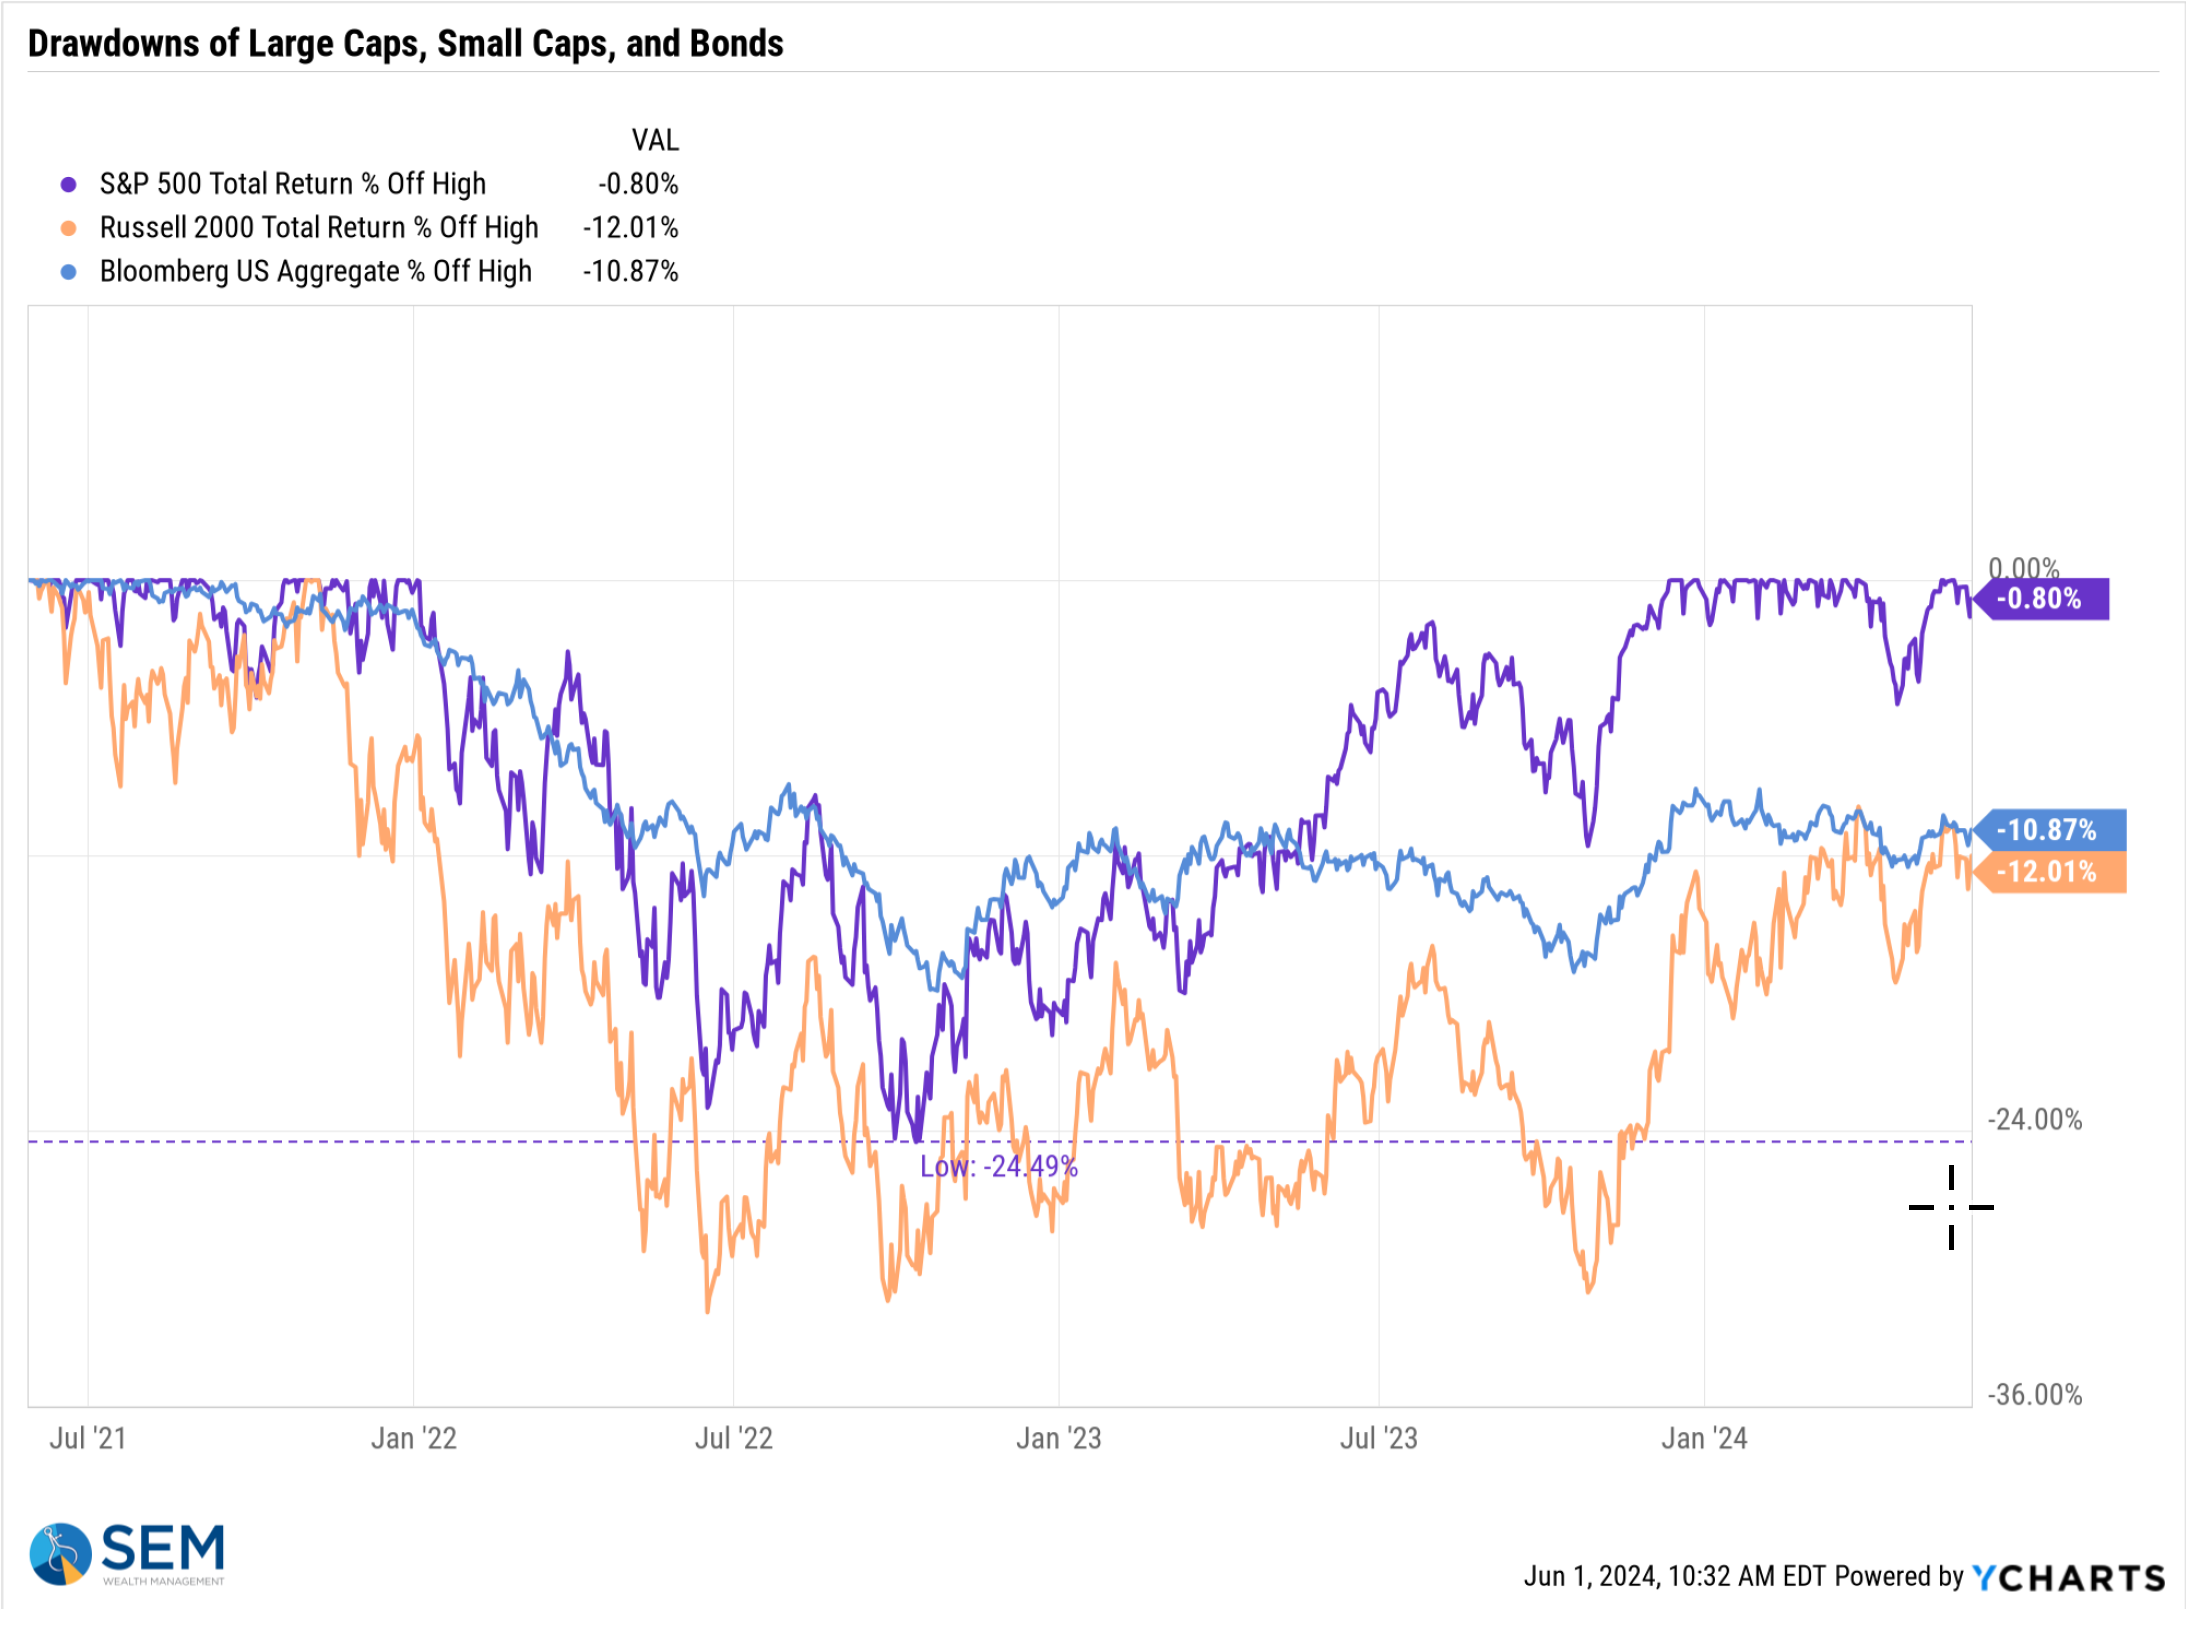
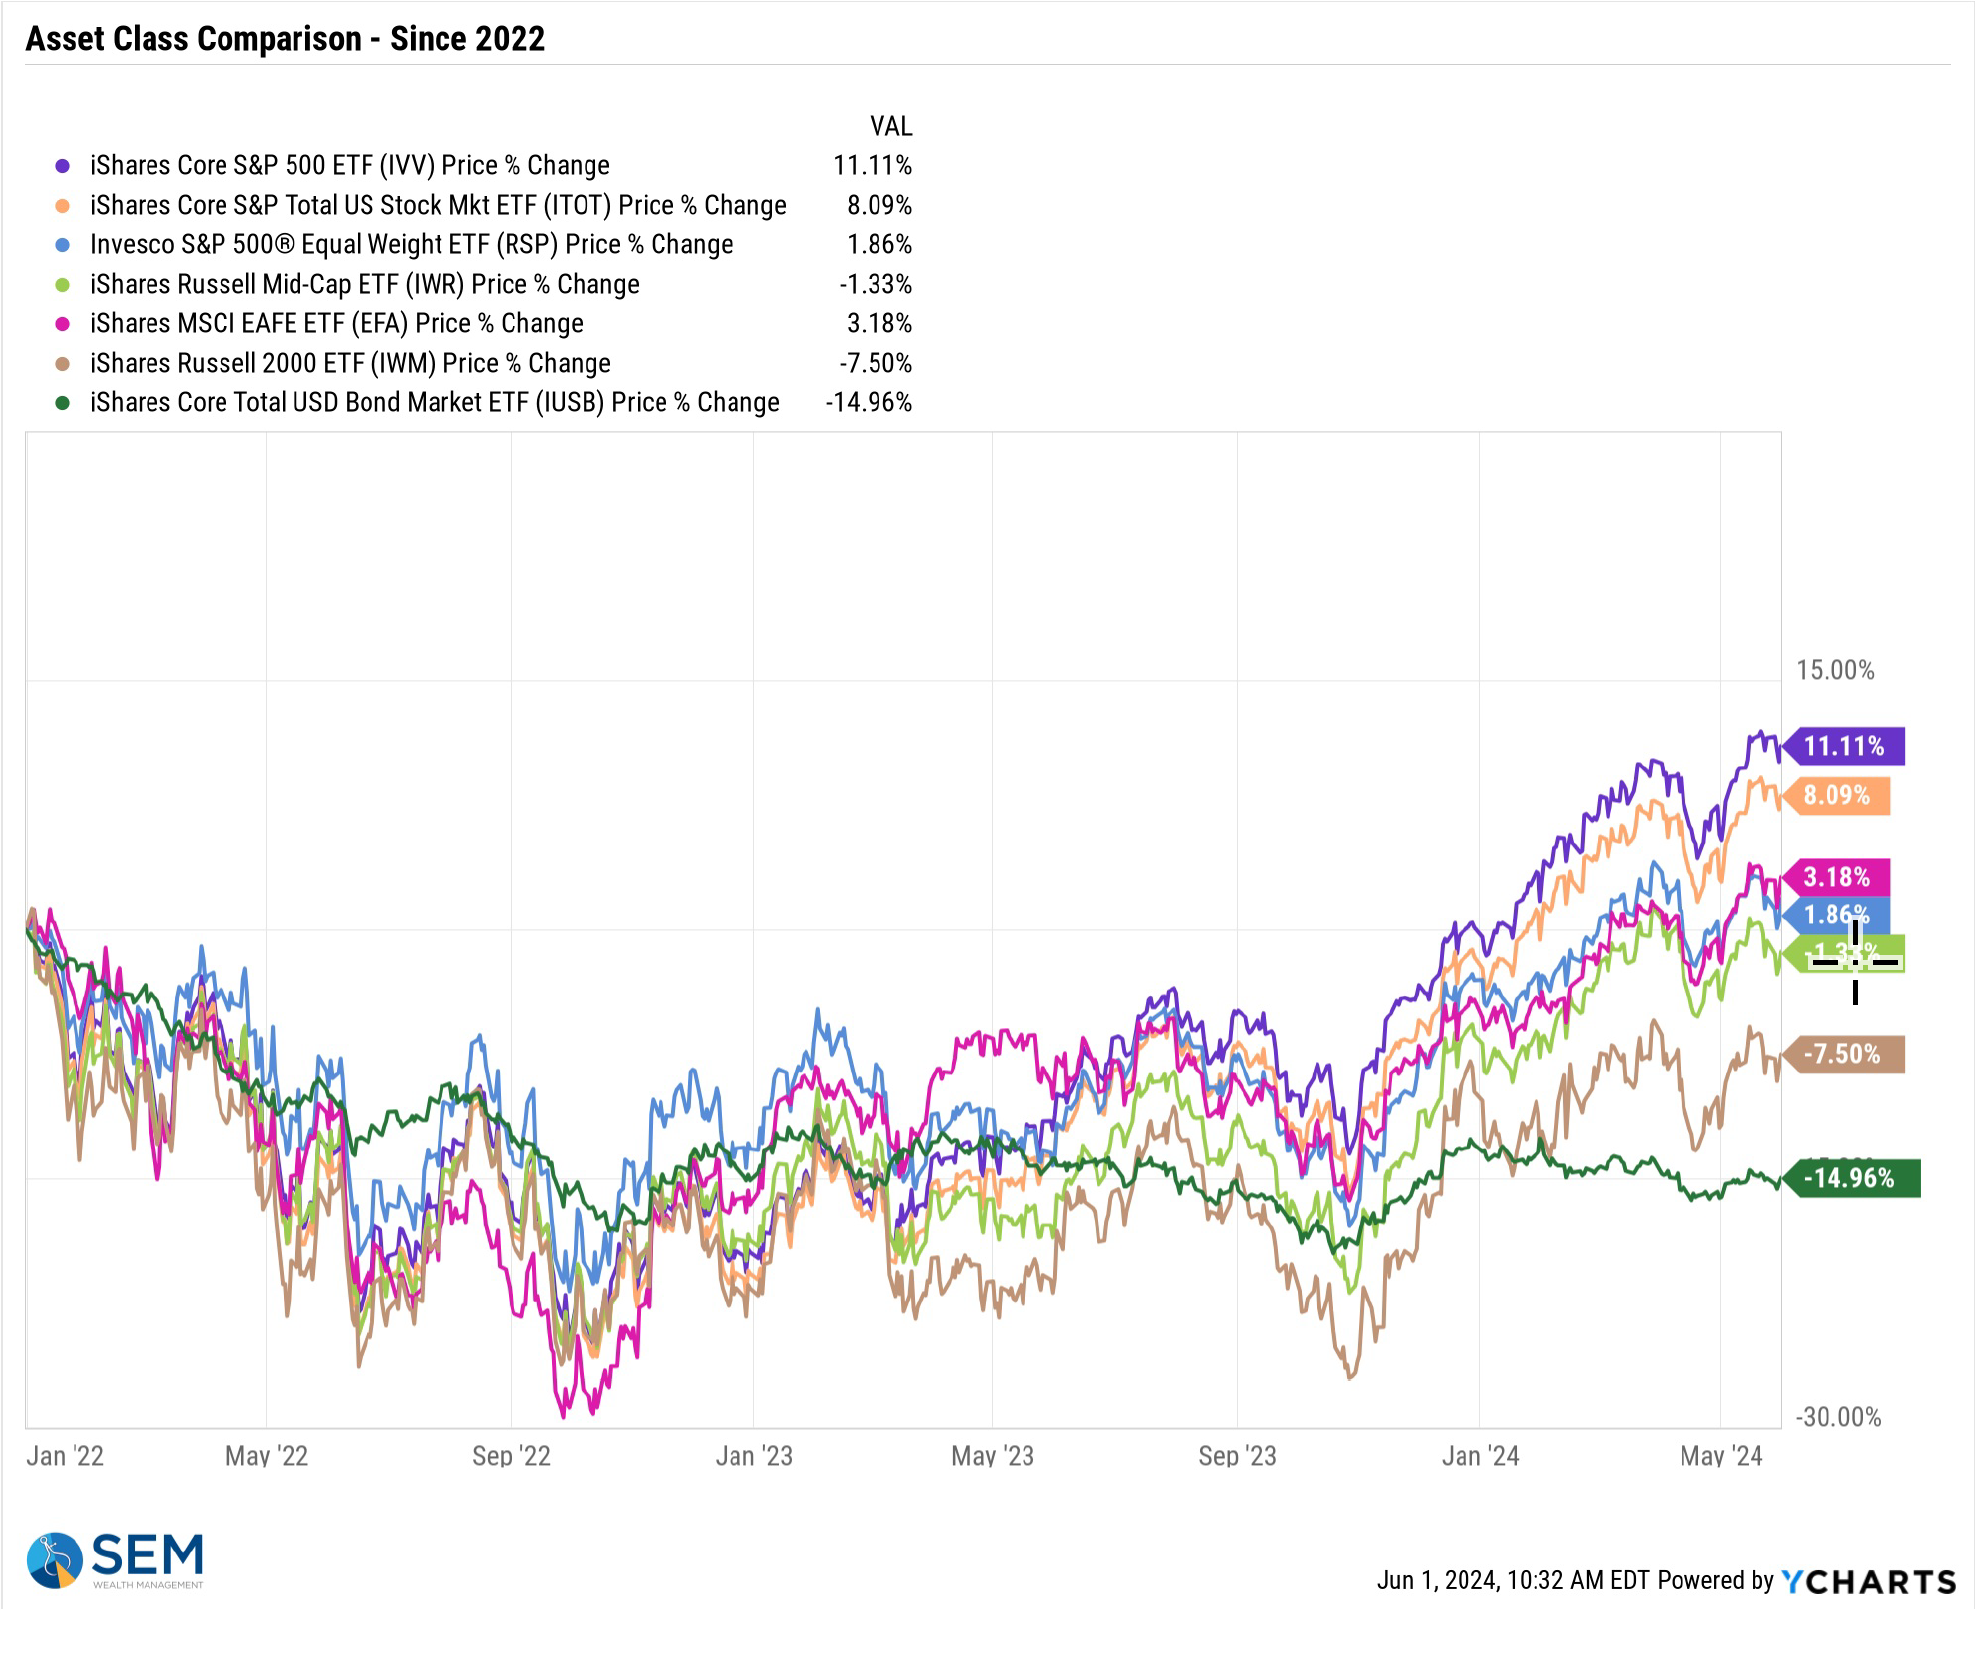
Speaking of 'broadening', small caps continue to lag large caps.
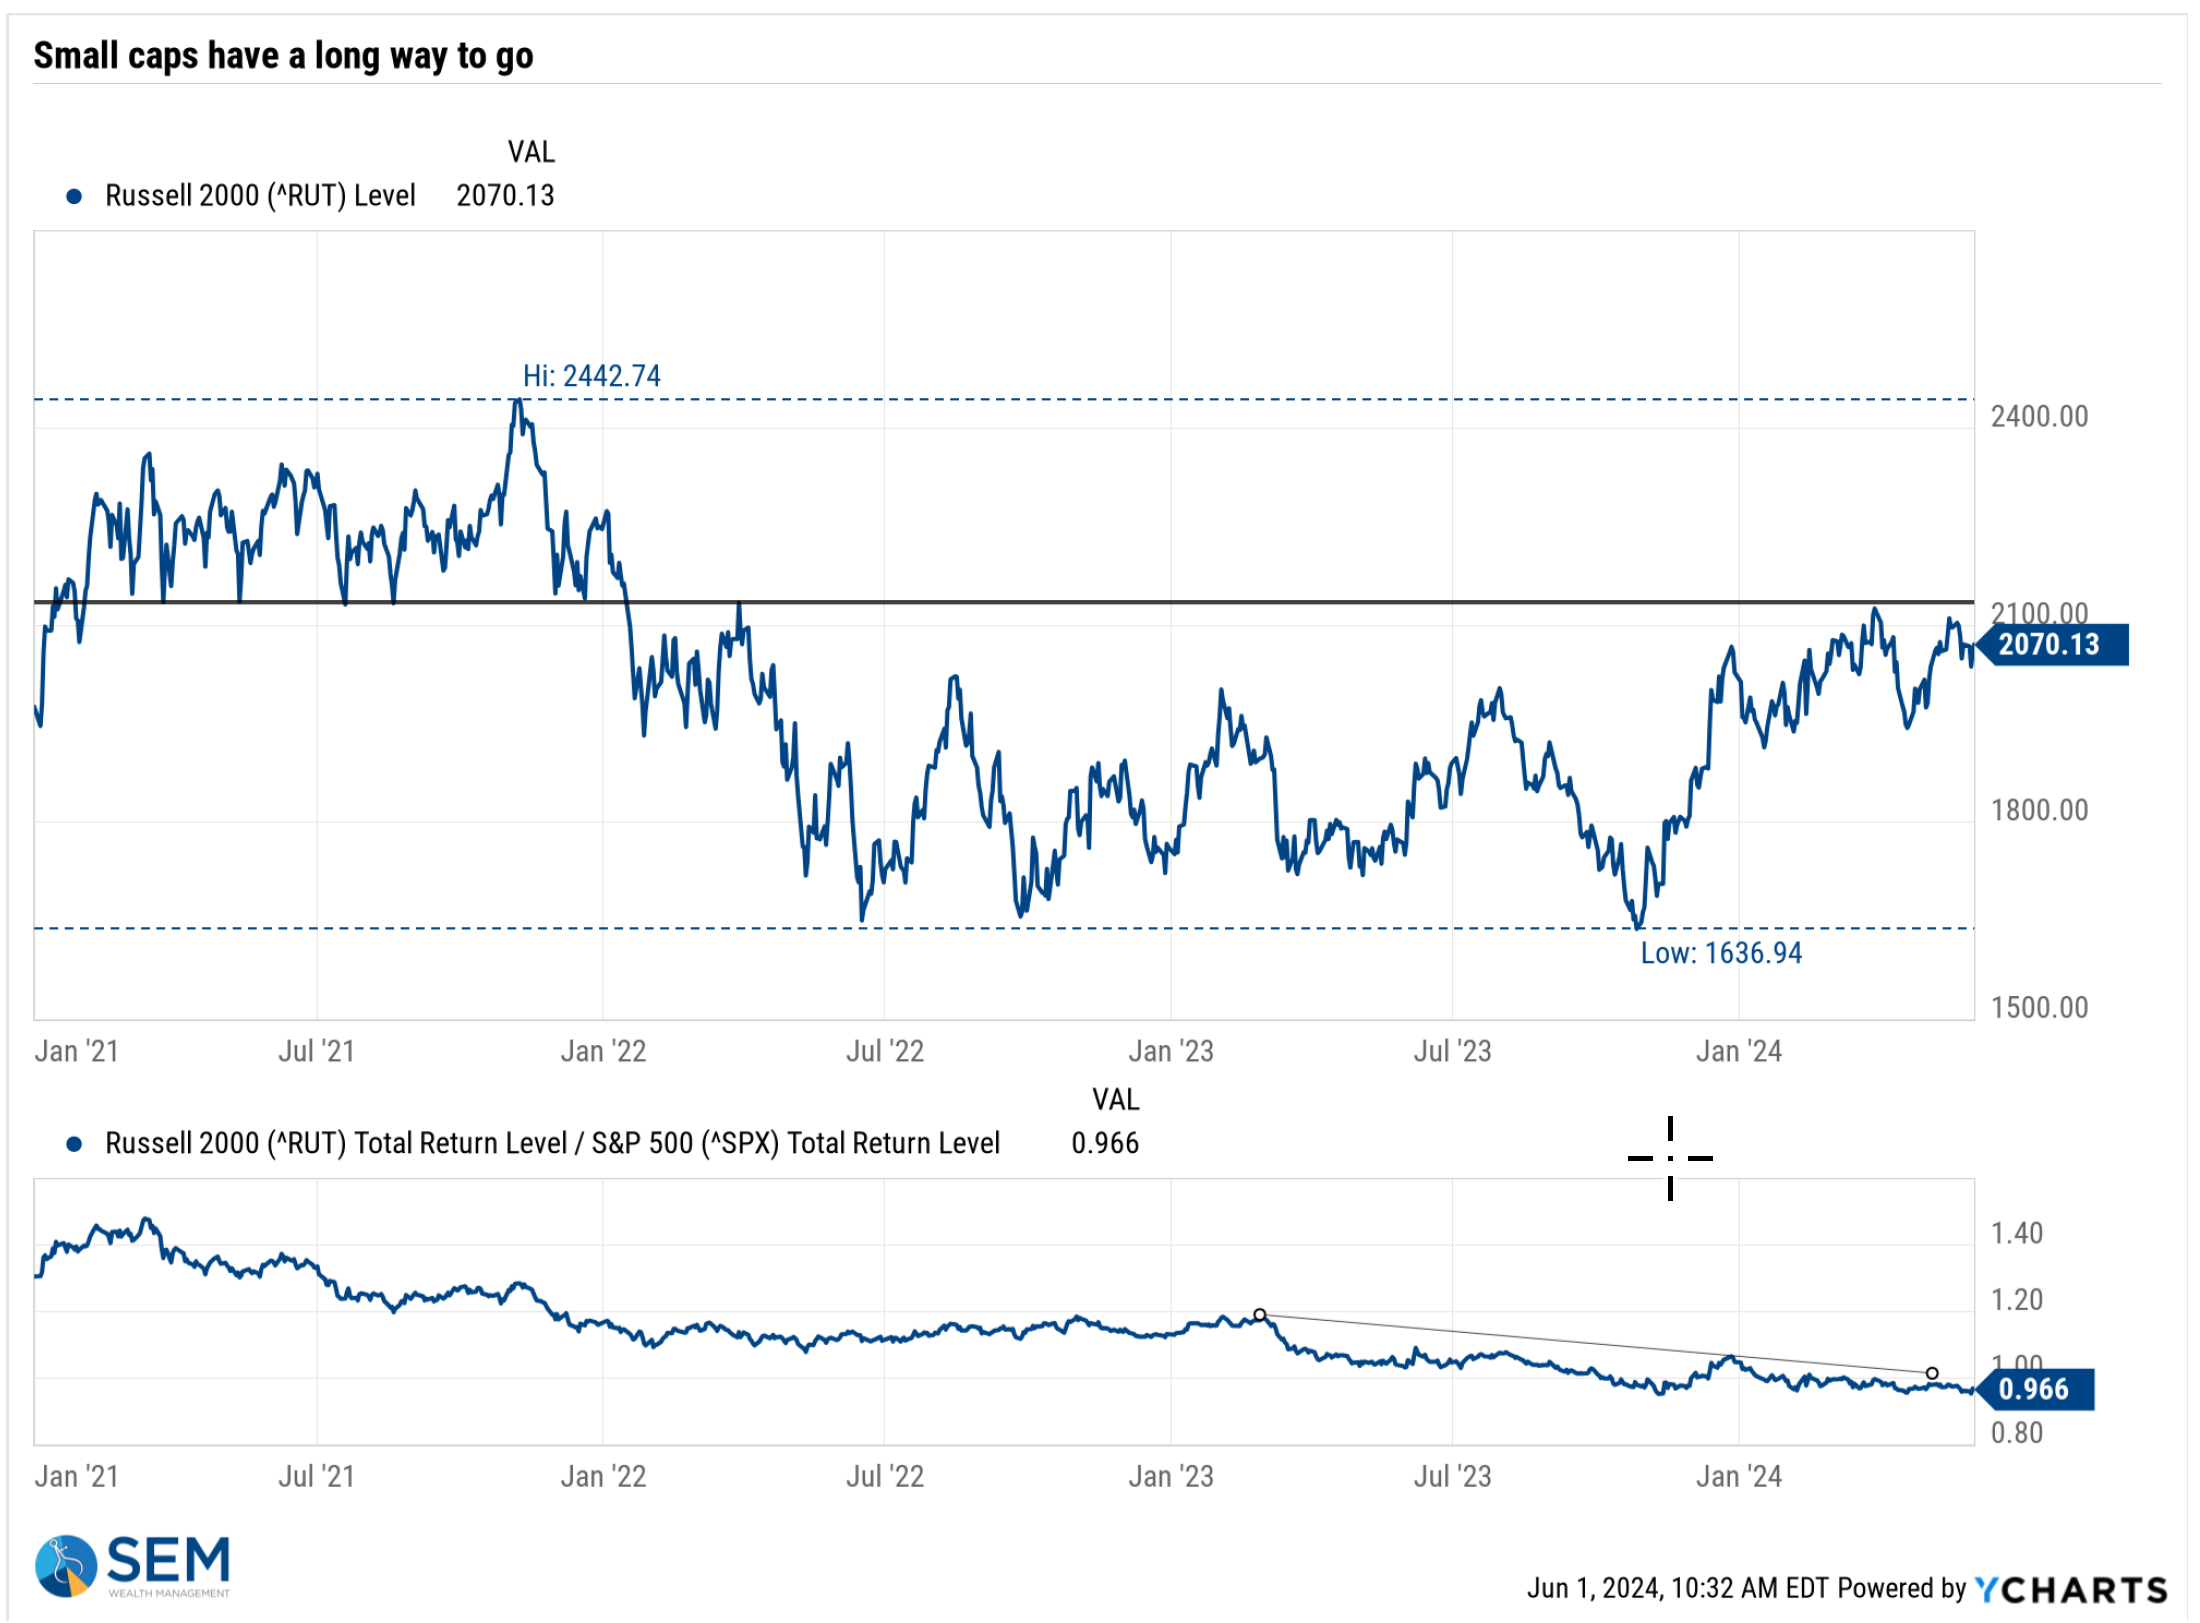
Any sort of diversification continues to be a drag on performance. History tells us this is not normal and some sort of correction needs to occur – either large cap stock values are reset at a lower price or small caps and bonds play catch-up.
Interest rates remain in their upward rising channel, which should not be good news for stocks (or the economy).
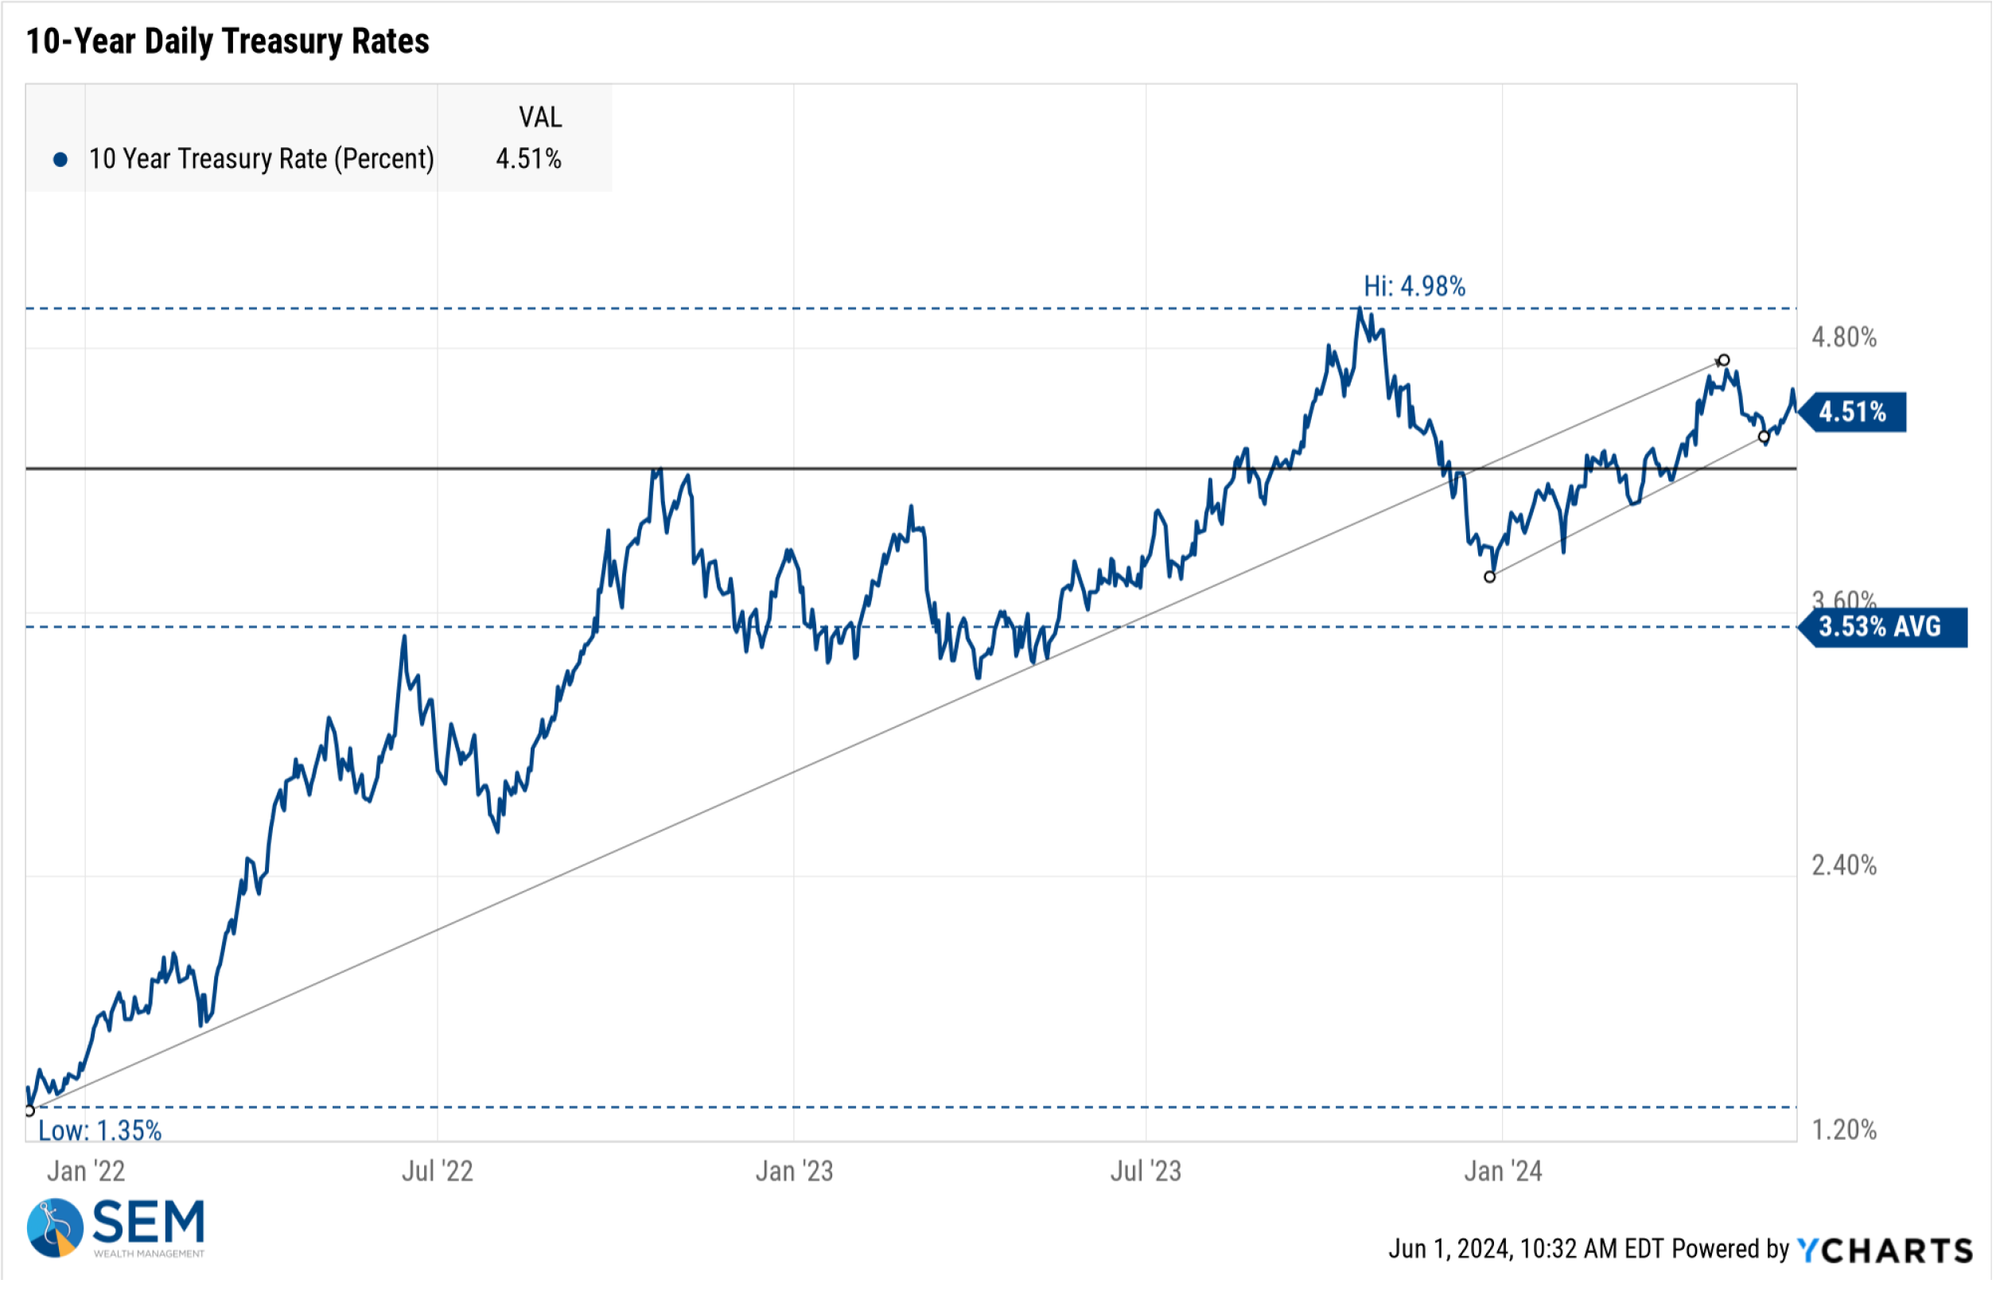
Remember, the Fed only has control over short-term rates. The "free" market sets rates on the rest of the duration curve and throughout 2024 they have said rates should be higher.
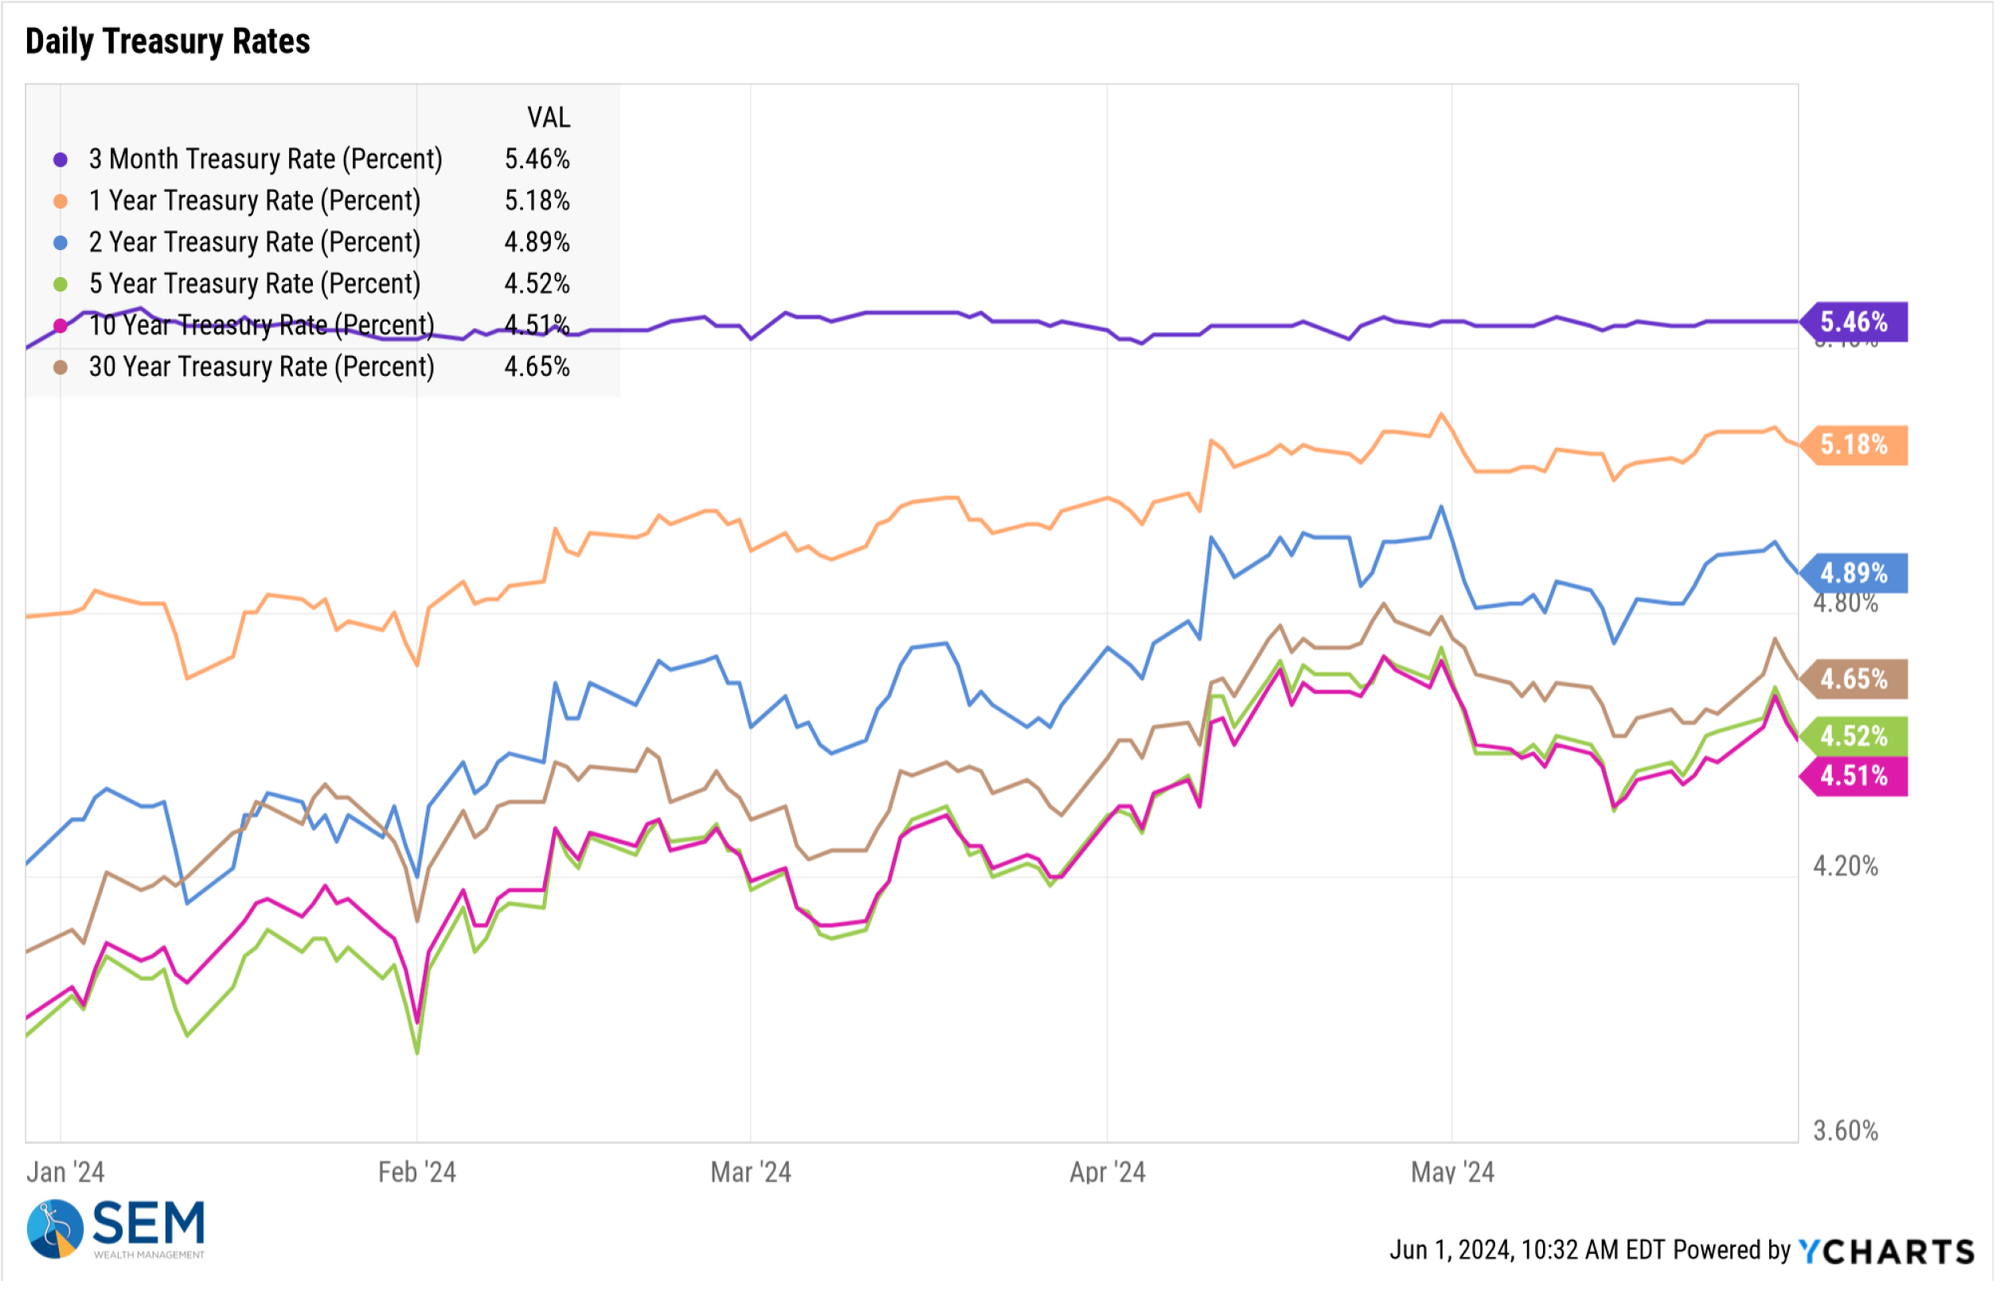
We can see how much rates have shifted higher over the past 3 and 12 months.
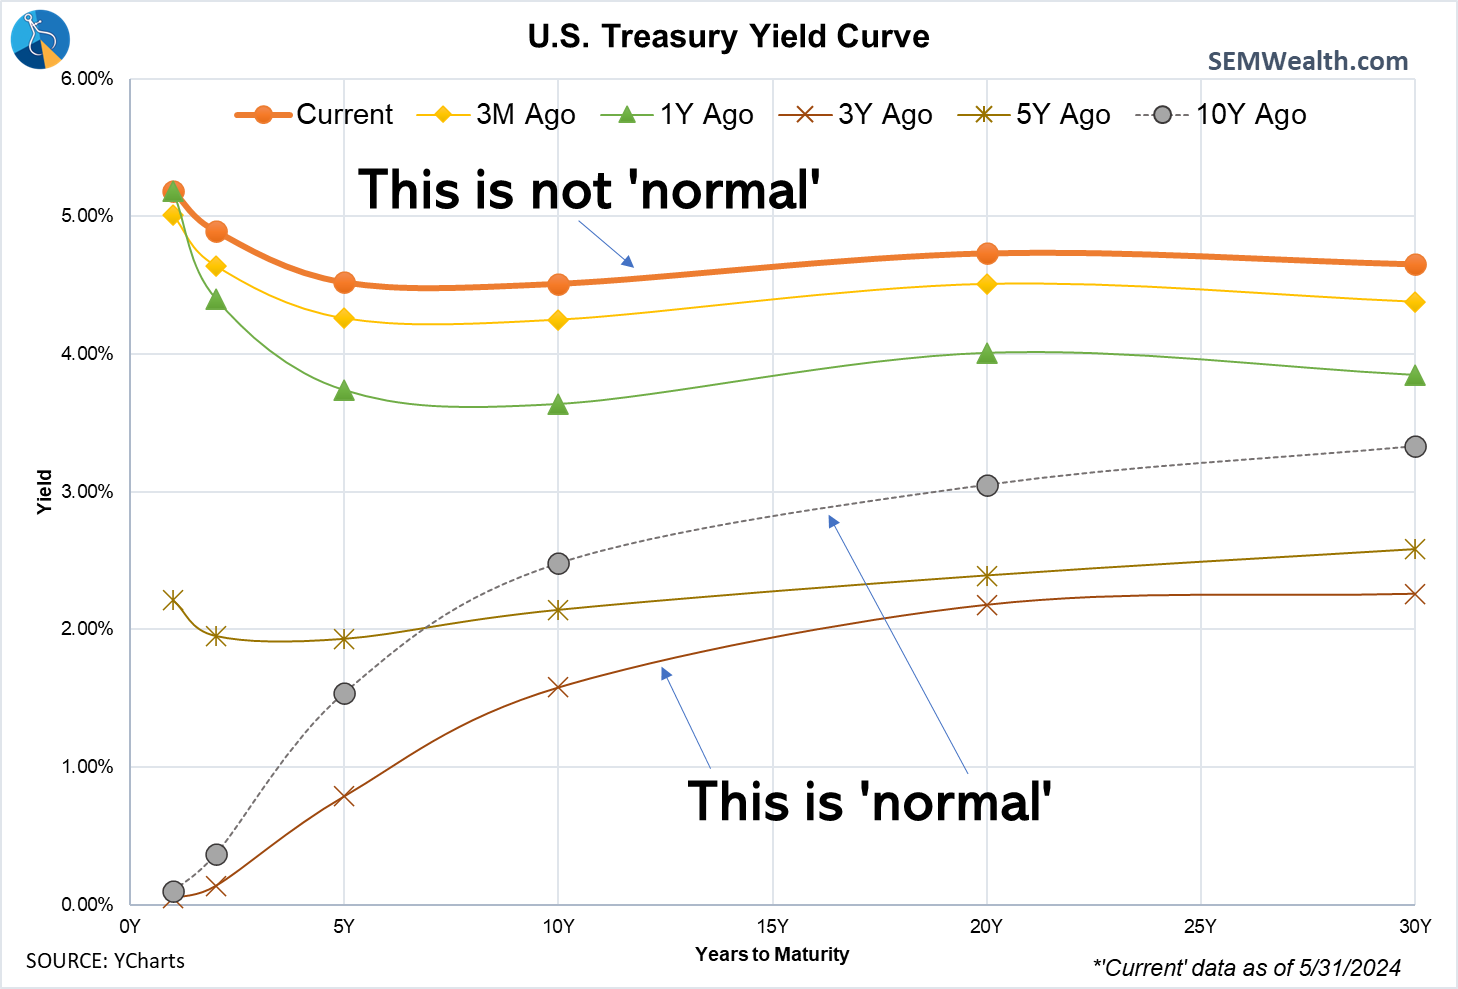
When short-term rates are higher than long-term rates, it skews everything. Investors start comparing returns to "safe" short-term rates attainable in money market accounts, CDs, or fixed annuities. What they are ignoring is the opportunity cost and the long-term drag on performance when they reinvest the 'guaranteed' investments once they come due.
Last month I did a study for our advisors comparing CDs to Passive Management and to Active Management since 2000. If you'd like a copy, drop us a message.
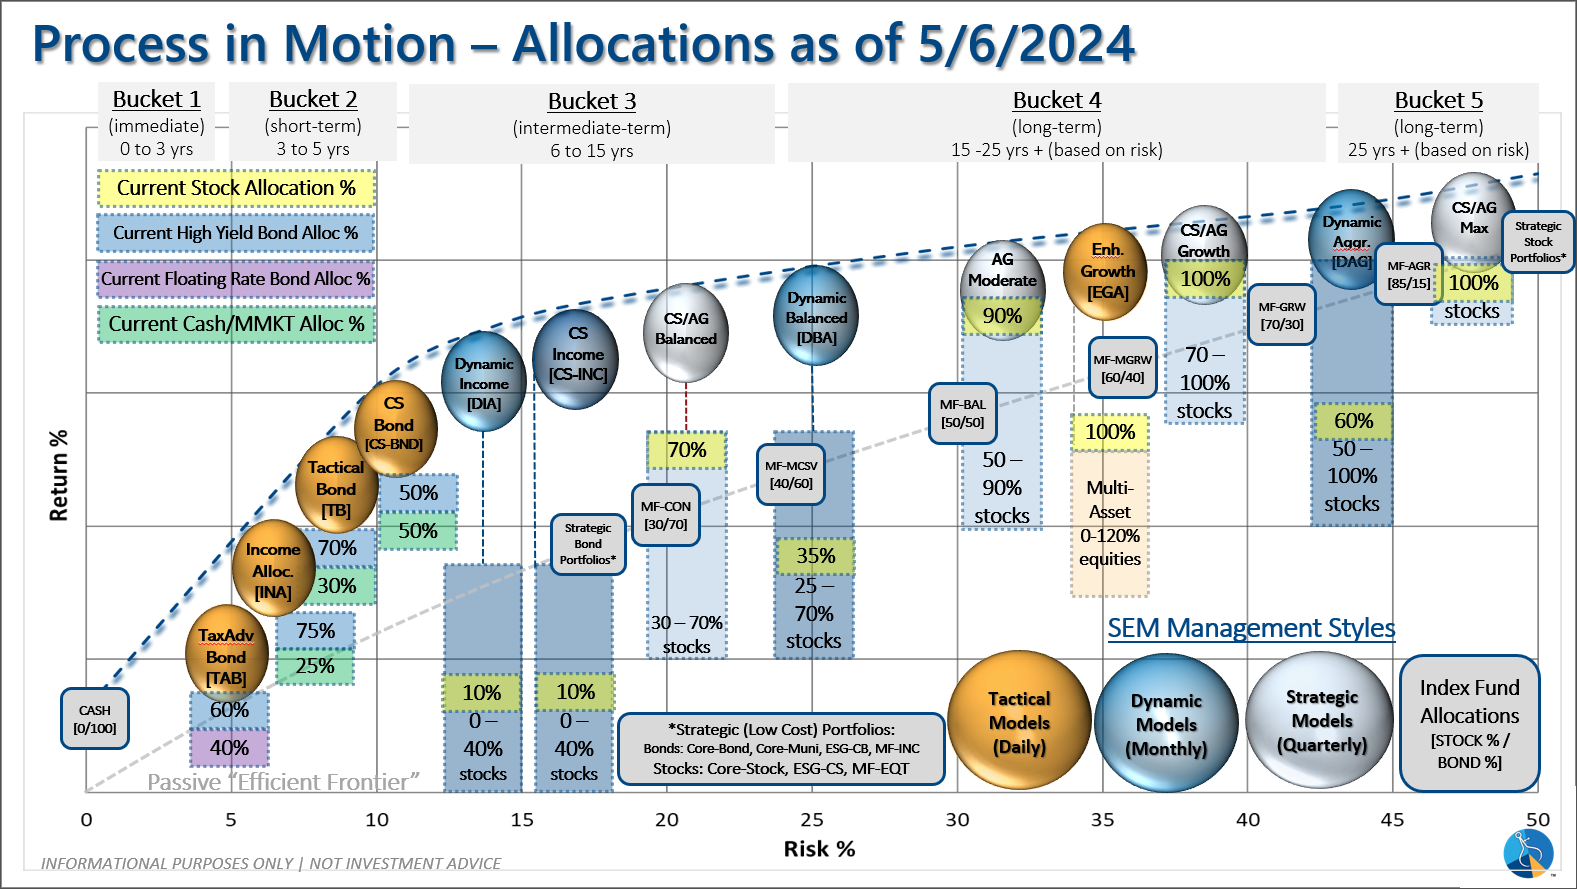
SEM Model Positioning
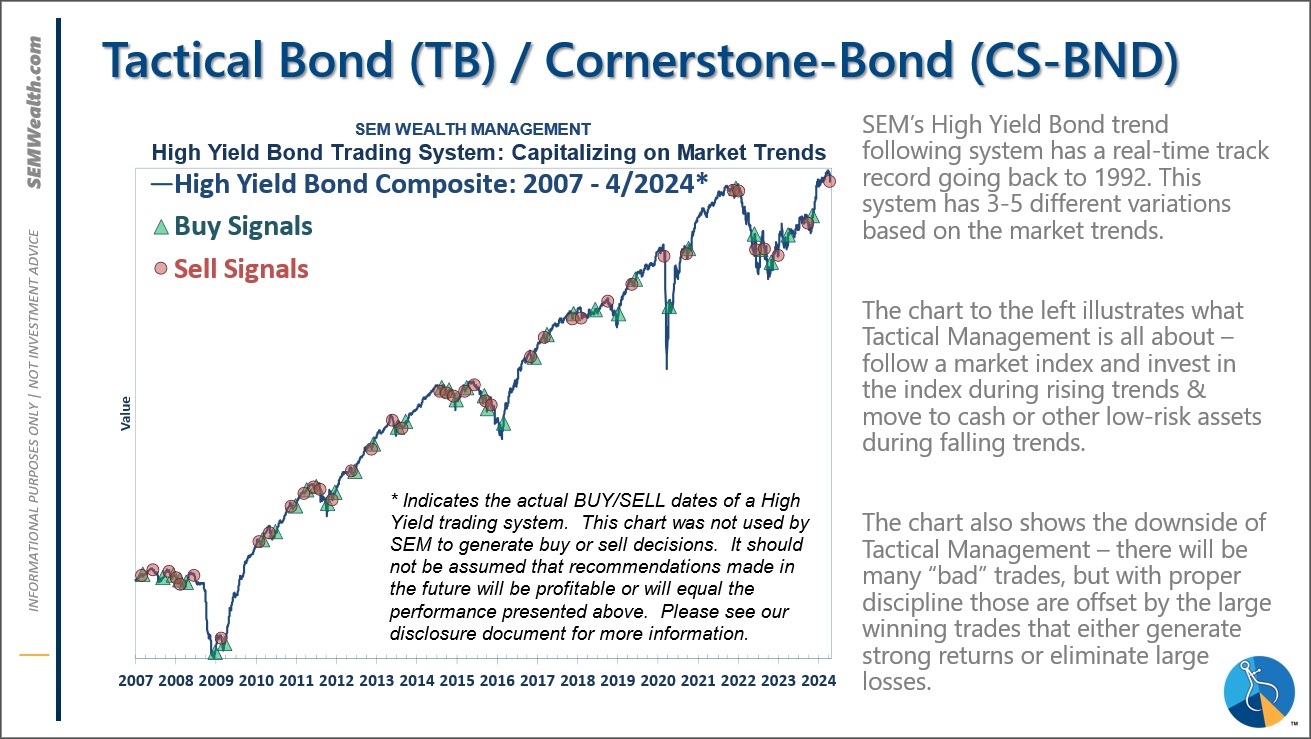
-Tactical High Yield had a partial buy signal on 5/6/24, reversing some of the sells on 4/16 & 17/2024 (note, we are within a whisker of seeing this buy signal revert back to money market)
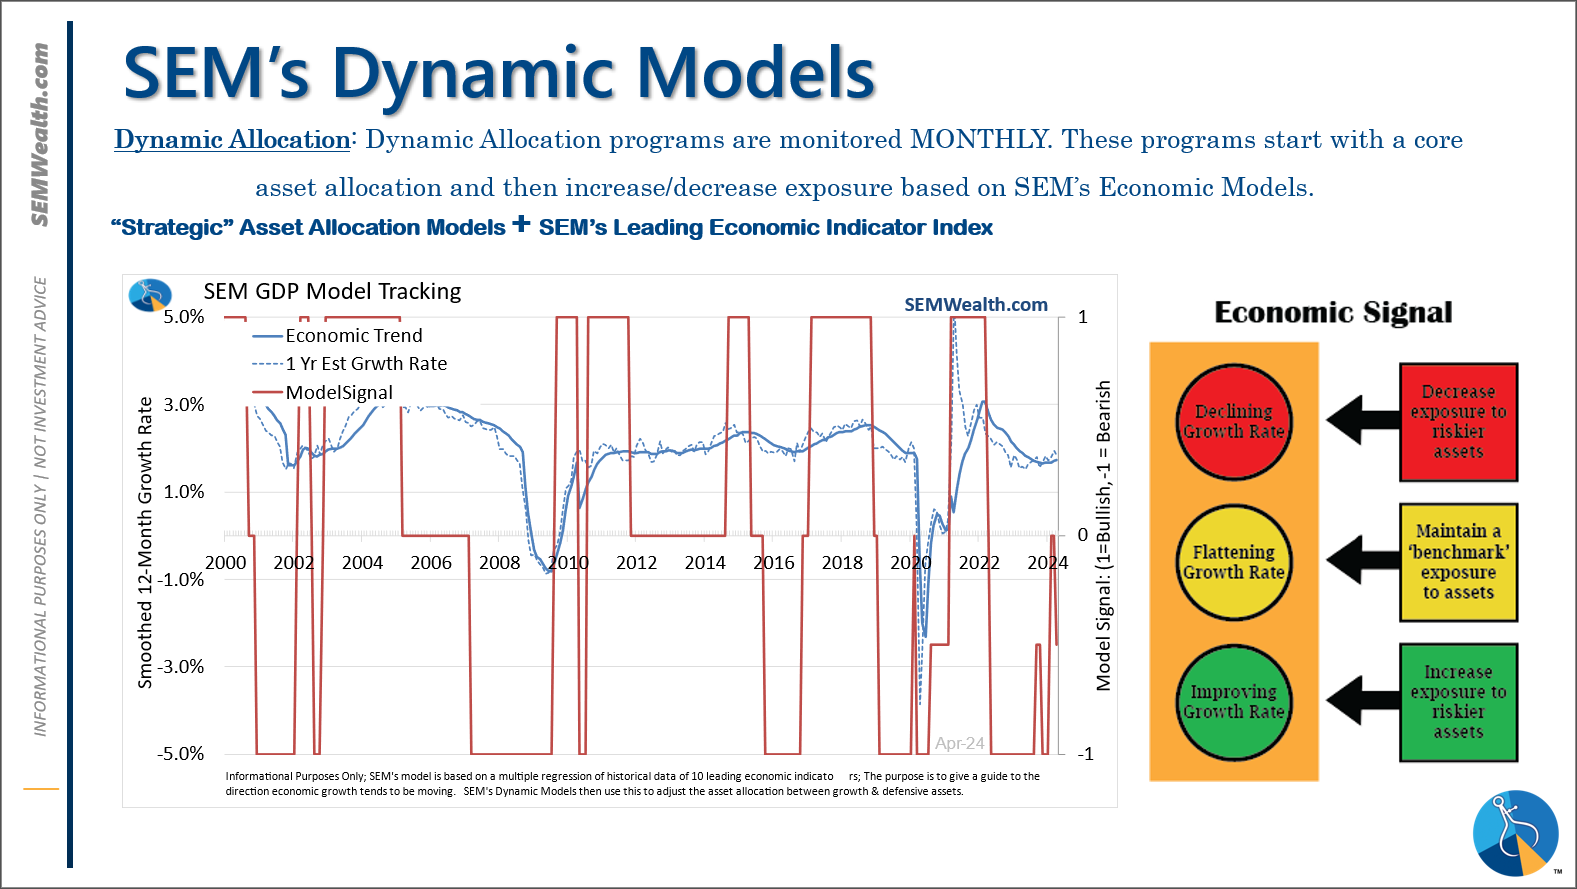
-Dynamic Models went half 'bearish' 5/3/2024
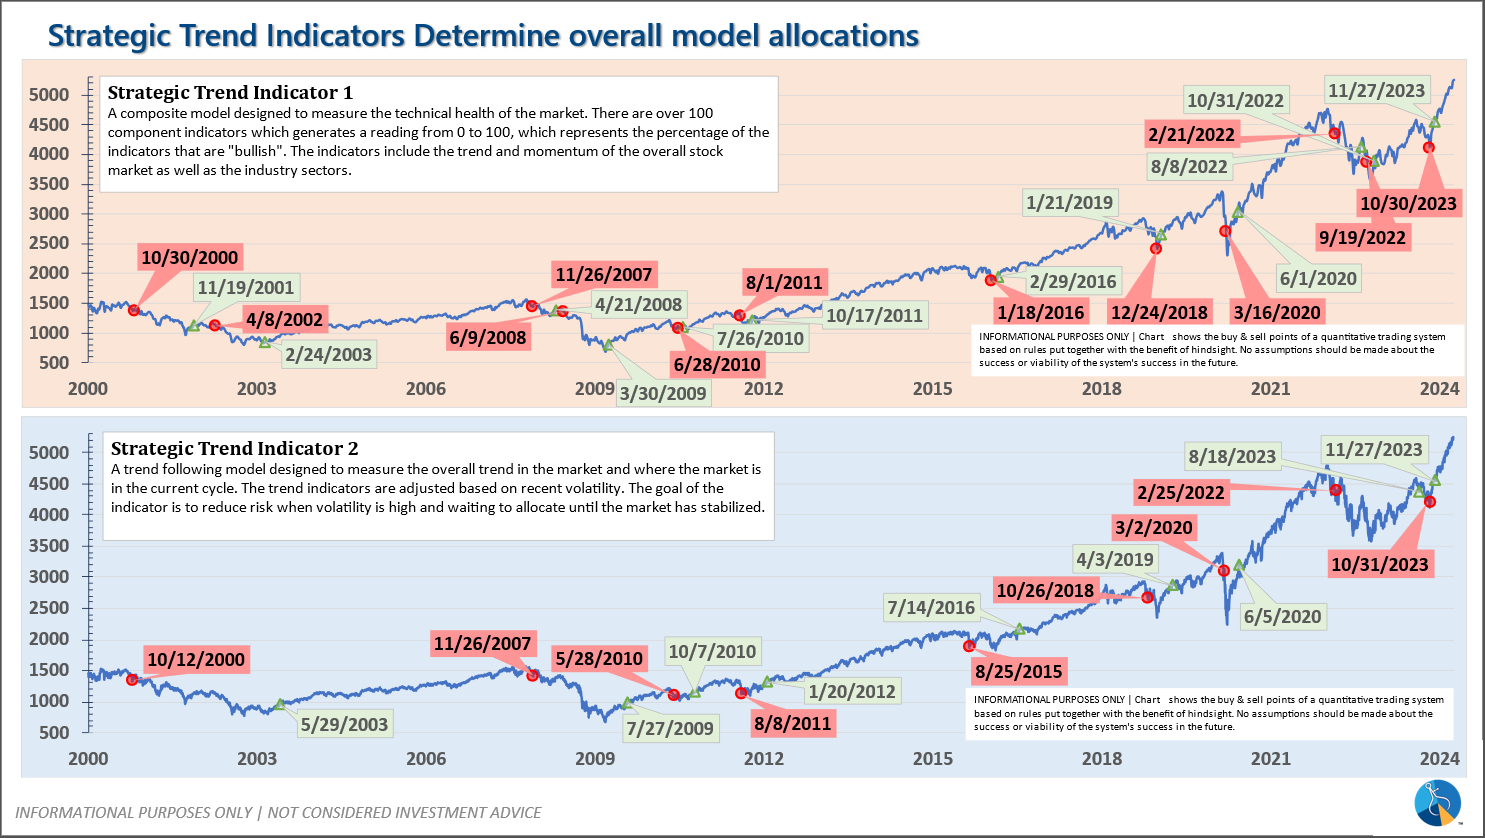
-Strategic Trend Models went on a buy 11/27/2023
SEM deploys 3 distinct approaches – Tactical, Dynamic, and Strategic. These systems have been described as 'daily, monthly, quarterly' given how often they may make adjustments. Here is where they each stand.
Tactical (daily): On 5/6/24 about half of the signals in our high yield models switched to a buy. The other half remains in money market funds. The money market funds we are currently invested in are yielding between 4.8-5.3% annually.
Dynamic (monthly): The economic model was 'neutral' since February. In early May the model moved slightly negative. This means slightly less than benchmark positions – 10% dividend stocks in Dynamic Income and 10% small cap stocks in Dynamic Aggressive Growth.
Strategic (quarterly)*:
BOTH Trend Systems reversed back to a buy on 11/27/2023
The core rotation is adjusted quarterly. On August 17 it rotated out of mid-cap growth and into small cap value. It also sold some large cap value to buy some large cap blend and growth. The large cap purchases were in actively managed funds with more diversification than the S&P 500 (banking on the market broadening out beyond the top 5-10 stocks.) On January 8 it rotated completely out of small cap value and mid-cap growth to purchase another broad (more diversified) large cap blend fund along with a Dividend Growth fund.
The * in quarterly is for the trend models. These models are watched daily but they trade infrequently based on readings of where each believe we are in the cycle. The trend systems can be susceptible to "whipsaws" as we saw with the recent sell and buy signals at the end of October and November. The goal of the systems is to miss major downturns in the market. Risks are high when the market has been stampeding higher as it has for most of 2023. This means sometimes selling too soon. As we saw with the recent trade, the systems can quickly reverse if they are wrong.
Overall, this is how our various models stack up based on the last allocation change: