Is the economy growing or shrinking? Is inflation too high or coming down? Is job growth too hot or too cold? Are the markets healthy or at risk?
The answer to all of those questions is "yes*"!
Note the * which is the problem – the answer depends on your situation – what your job is, where you live, how much money you make, whether you own a house, how old you are, how many kids you have. This is making it especially difficult for anyone to evaluate the economy.
Before we get too far into it, here's another random observation – for newer readers, "MMM" is short for Monday Morning Musings. This blog has gone through various iterations over the years (originally started as a weekly email newsletter in the early 2000s). At it's core, it is designed to be our readers' "research desk notes" since SEM works with independent financial advisors (who don't have a Wall Street research team) and independent minded investors (who either do not have enough assets to have an "elite" Wall Street team talking to them or those who understand those "elite" teams do not always have their best interests).
I've noticed over the past 20+ years of writing that the length of these posts will vary greatly. Sometimes there isn't much to say because there is nothing popping up that is a concern for the big picture or a trend I'm seeing developing that could hurt our readers. Other times there is A LOT on my mind. I've noticed the past few weeks the posts have been very long, meaning I must have a lot of things jumping out that I believe are important. Most of the time the longer posts happen at a time either just before or during a major market event or turning point.
With that said, I understand your time is valuable. For newer readers not all of my posts will be this long. I try to use headlines, bullet points, and charts to make it easier to digest. With that, let's dive into the DATA and what it means looking forward.
A few weeks back we looked at some surveys which basically said half of Americans were happy with our current situation and the other half were not.

Last week, we took a look at some of our economic indicators. As the headline of our article pointed out the data was not great two weeks ago. From big misses on the AI related tech front, to personal income, consumer spending, consumer sentiment, and housing all of the data pointed to a marked slowdown in the economy the market wasn't ready for.

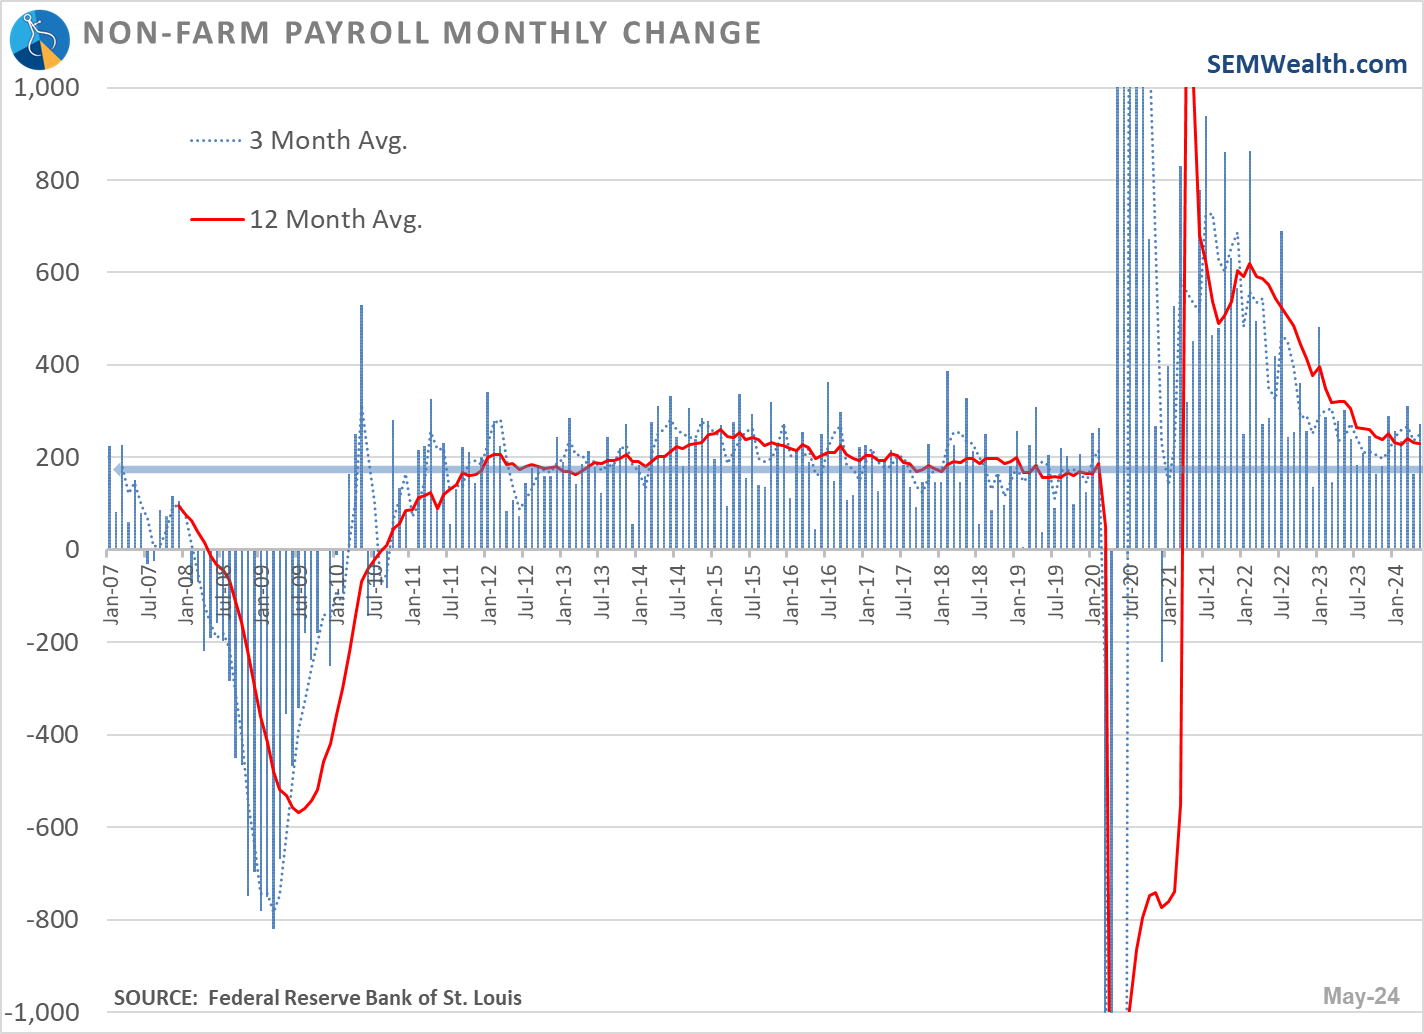
On Friday we received the latest Payrolls report from the government. The initial market reaction was interesting – the bond market didn't like the data because it indicated an economy that is still expanding at a rate that is increasing inflationary pressure. The stock market seemed a bit relieved the economy was still growing, but couldn't celebrate too much because of the bond market's reaction.
A Blowout Jobs Report?
The surge in the reported number of jobs was a surprise given the 'slowing' we've seen the past few months.
The bulk of the jobs again came from Education & Health Services, Leisure & Hospitality, and Professional & Business Services.
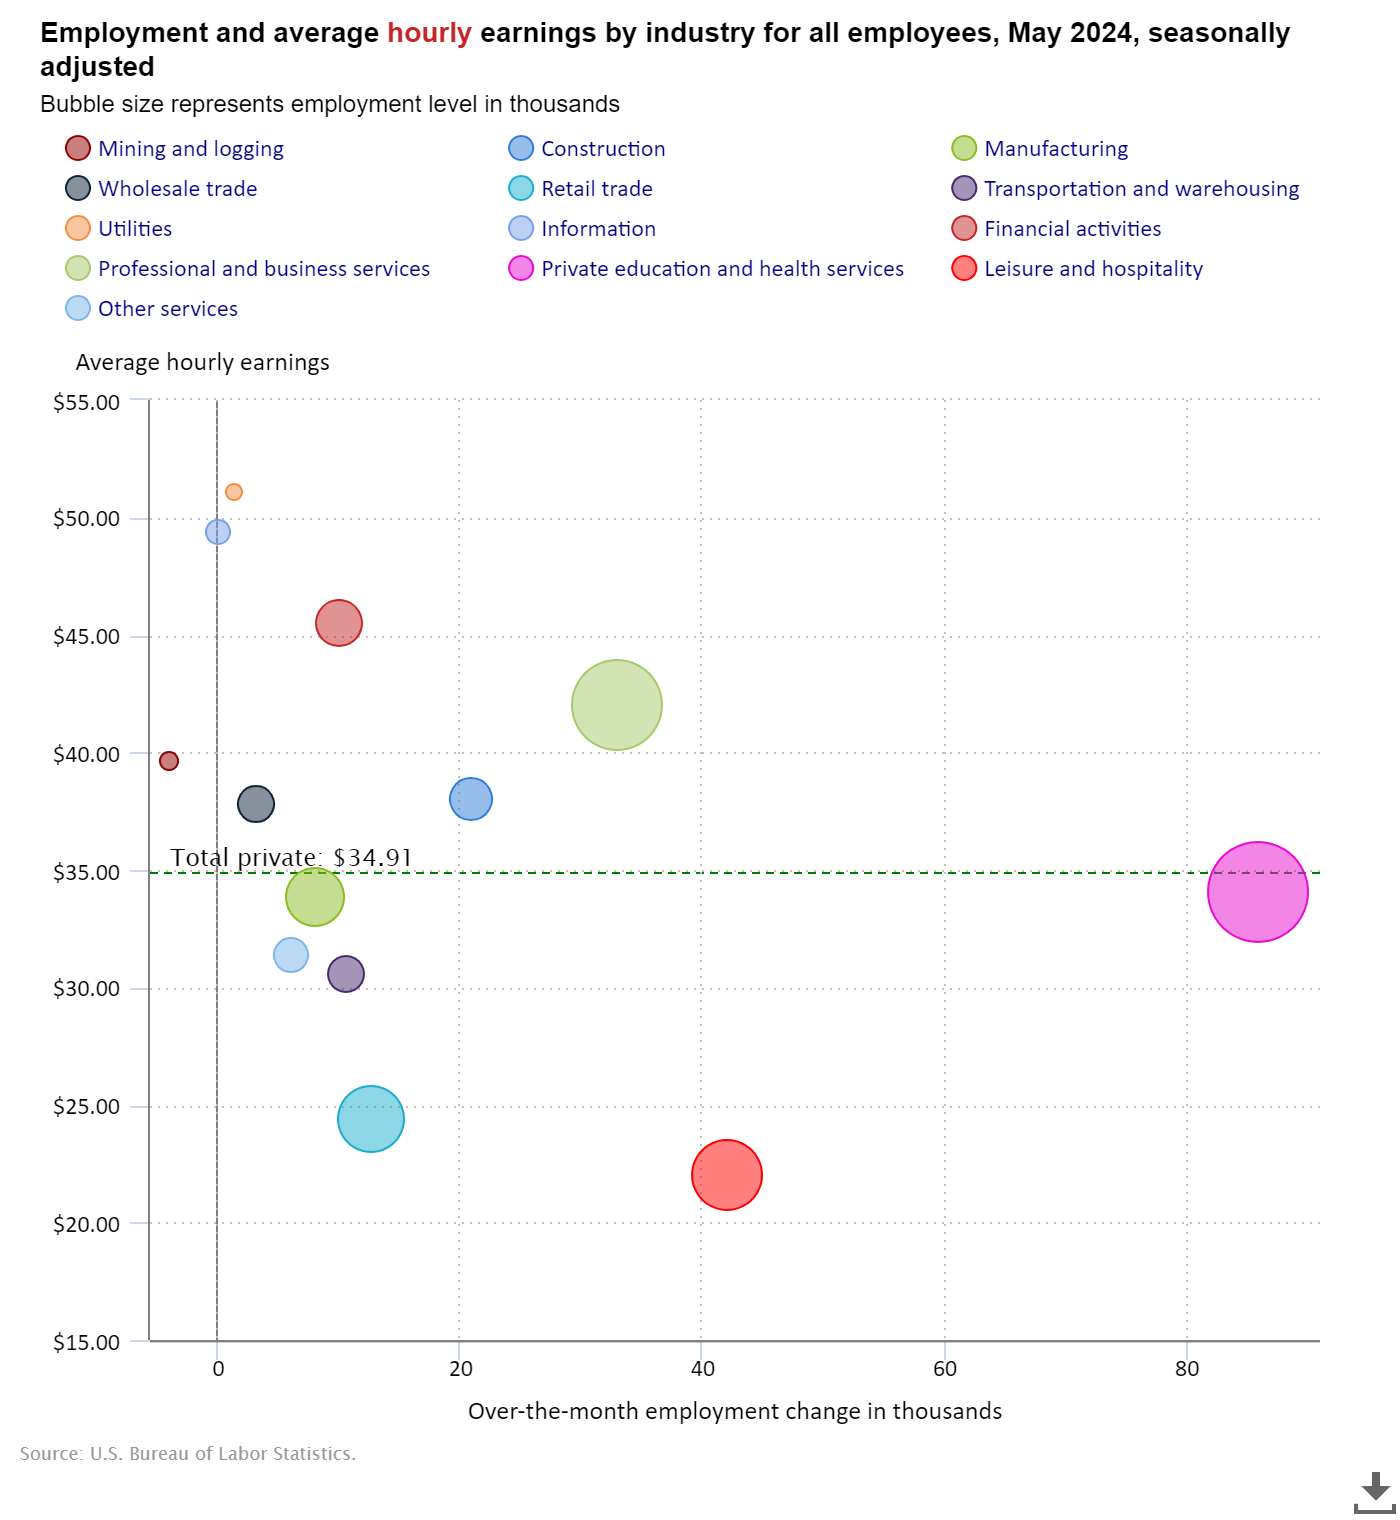
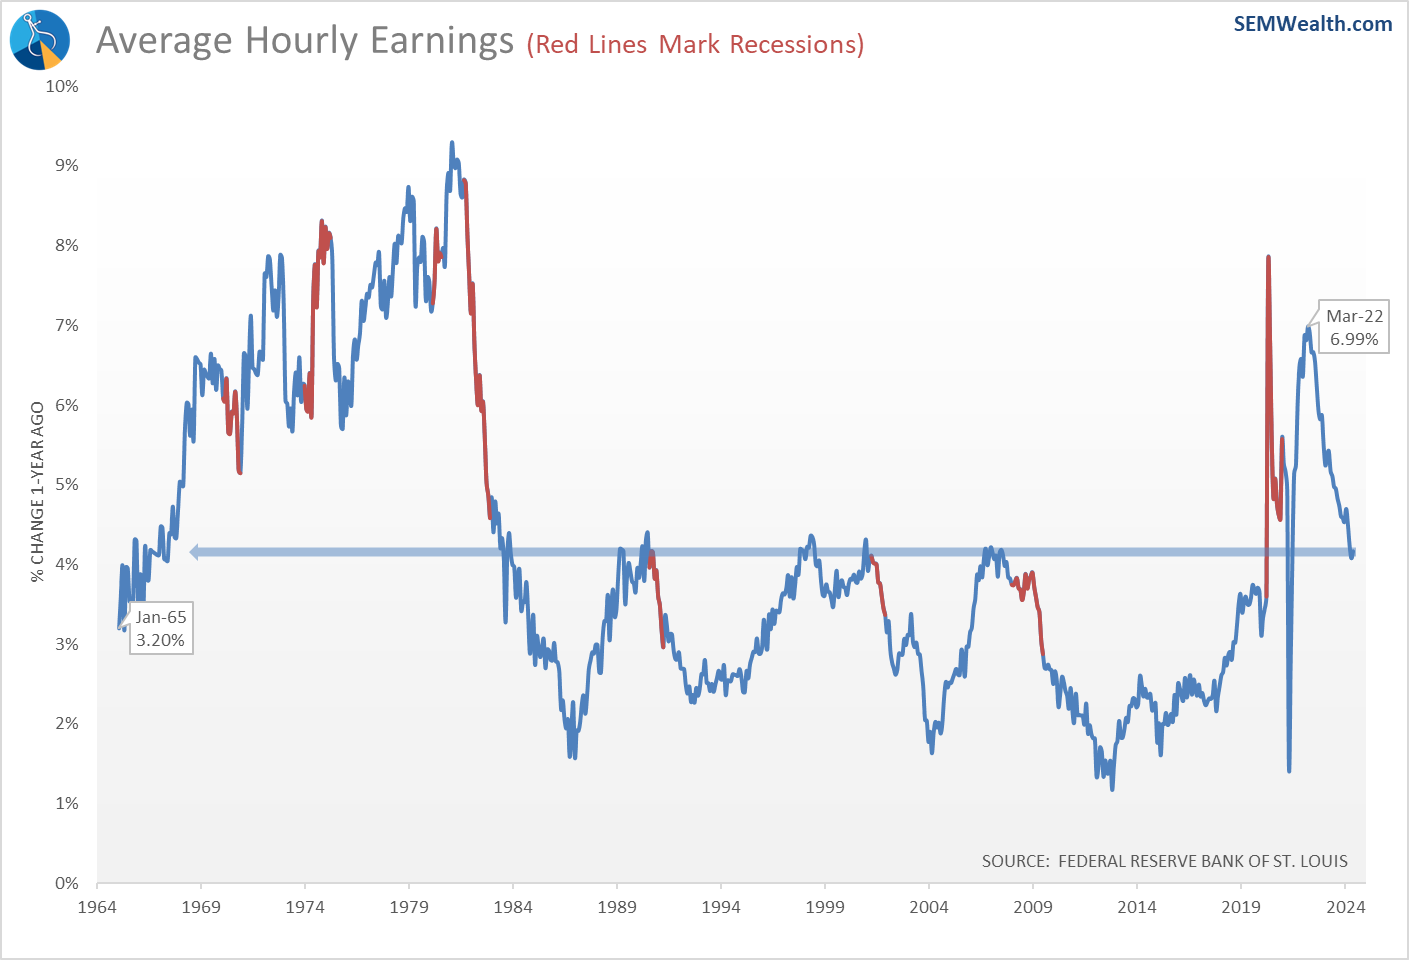
Combine this with an uptick in the pace of hourly earnings growth, and you can see why the bond market was concerned. a 4.2% increase in earnings is most certainly going to make it difficult for the Fed to justify rate cuts and/or to cut them without allowing inflation to come roaring back.
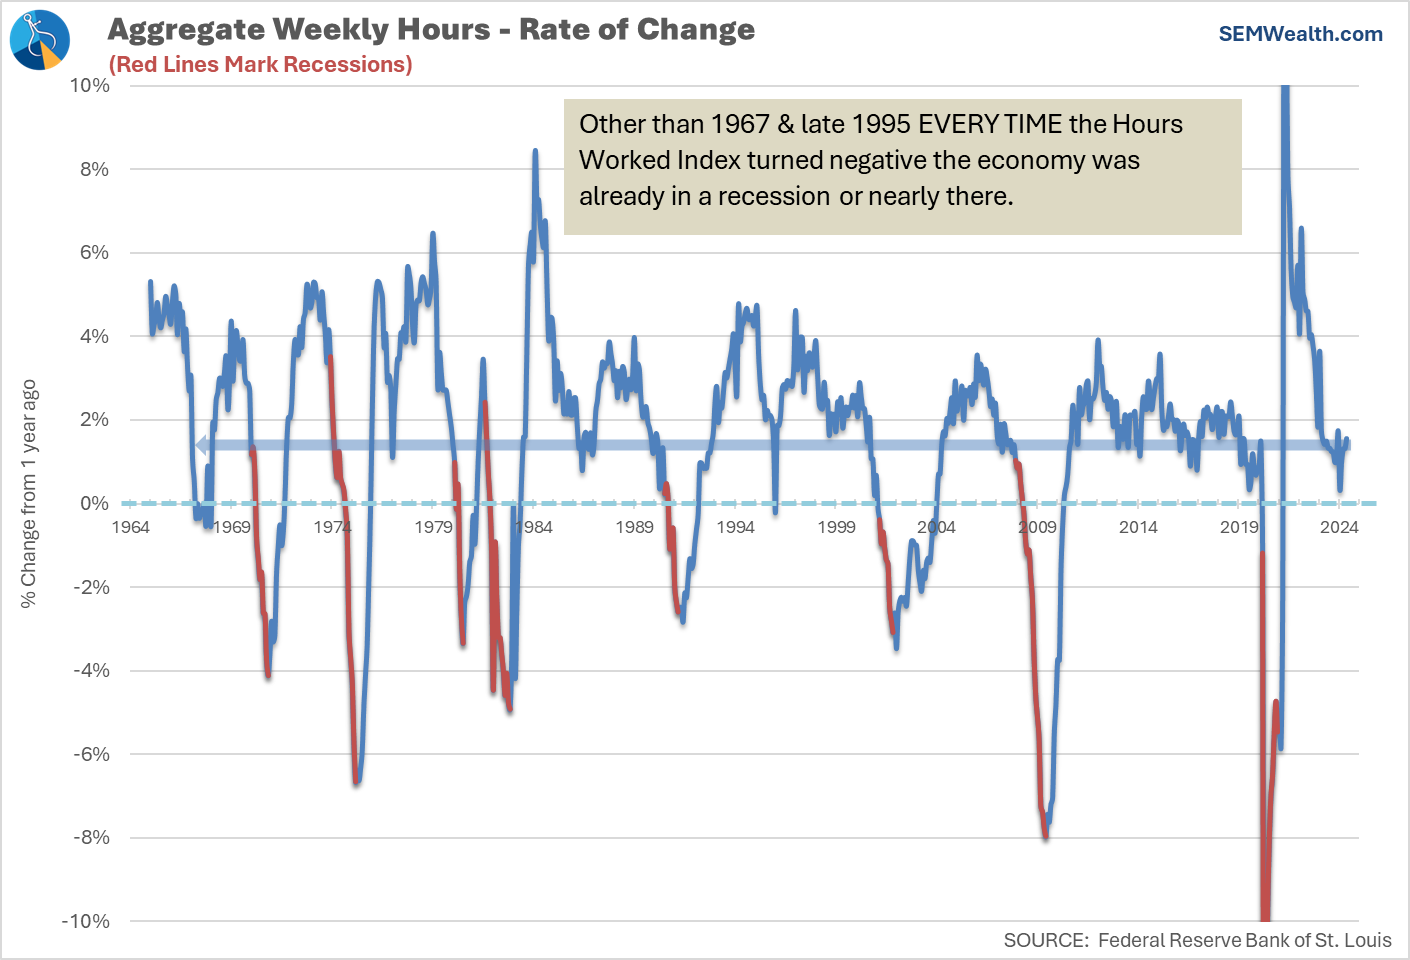
Turning to my favorite employment charts, the average weekly hours index held steady......
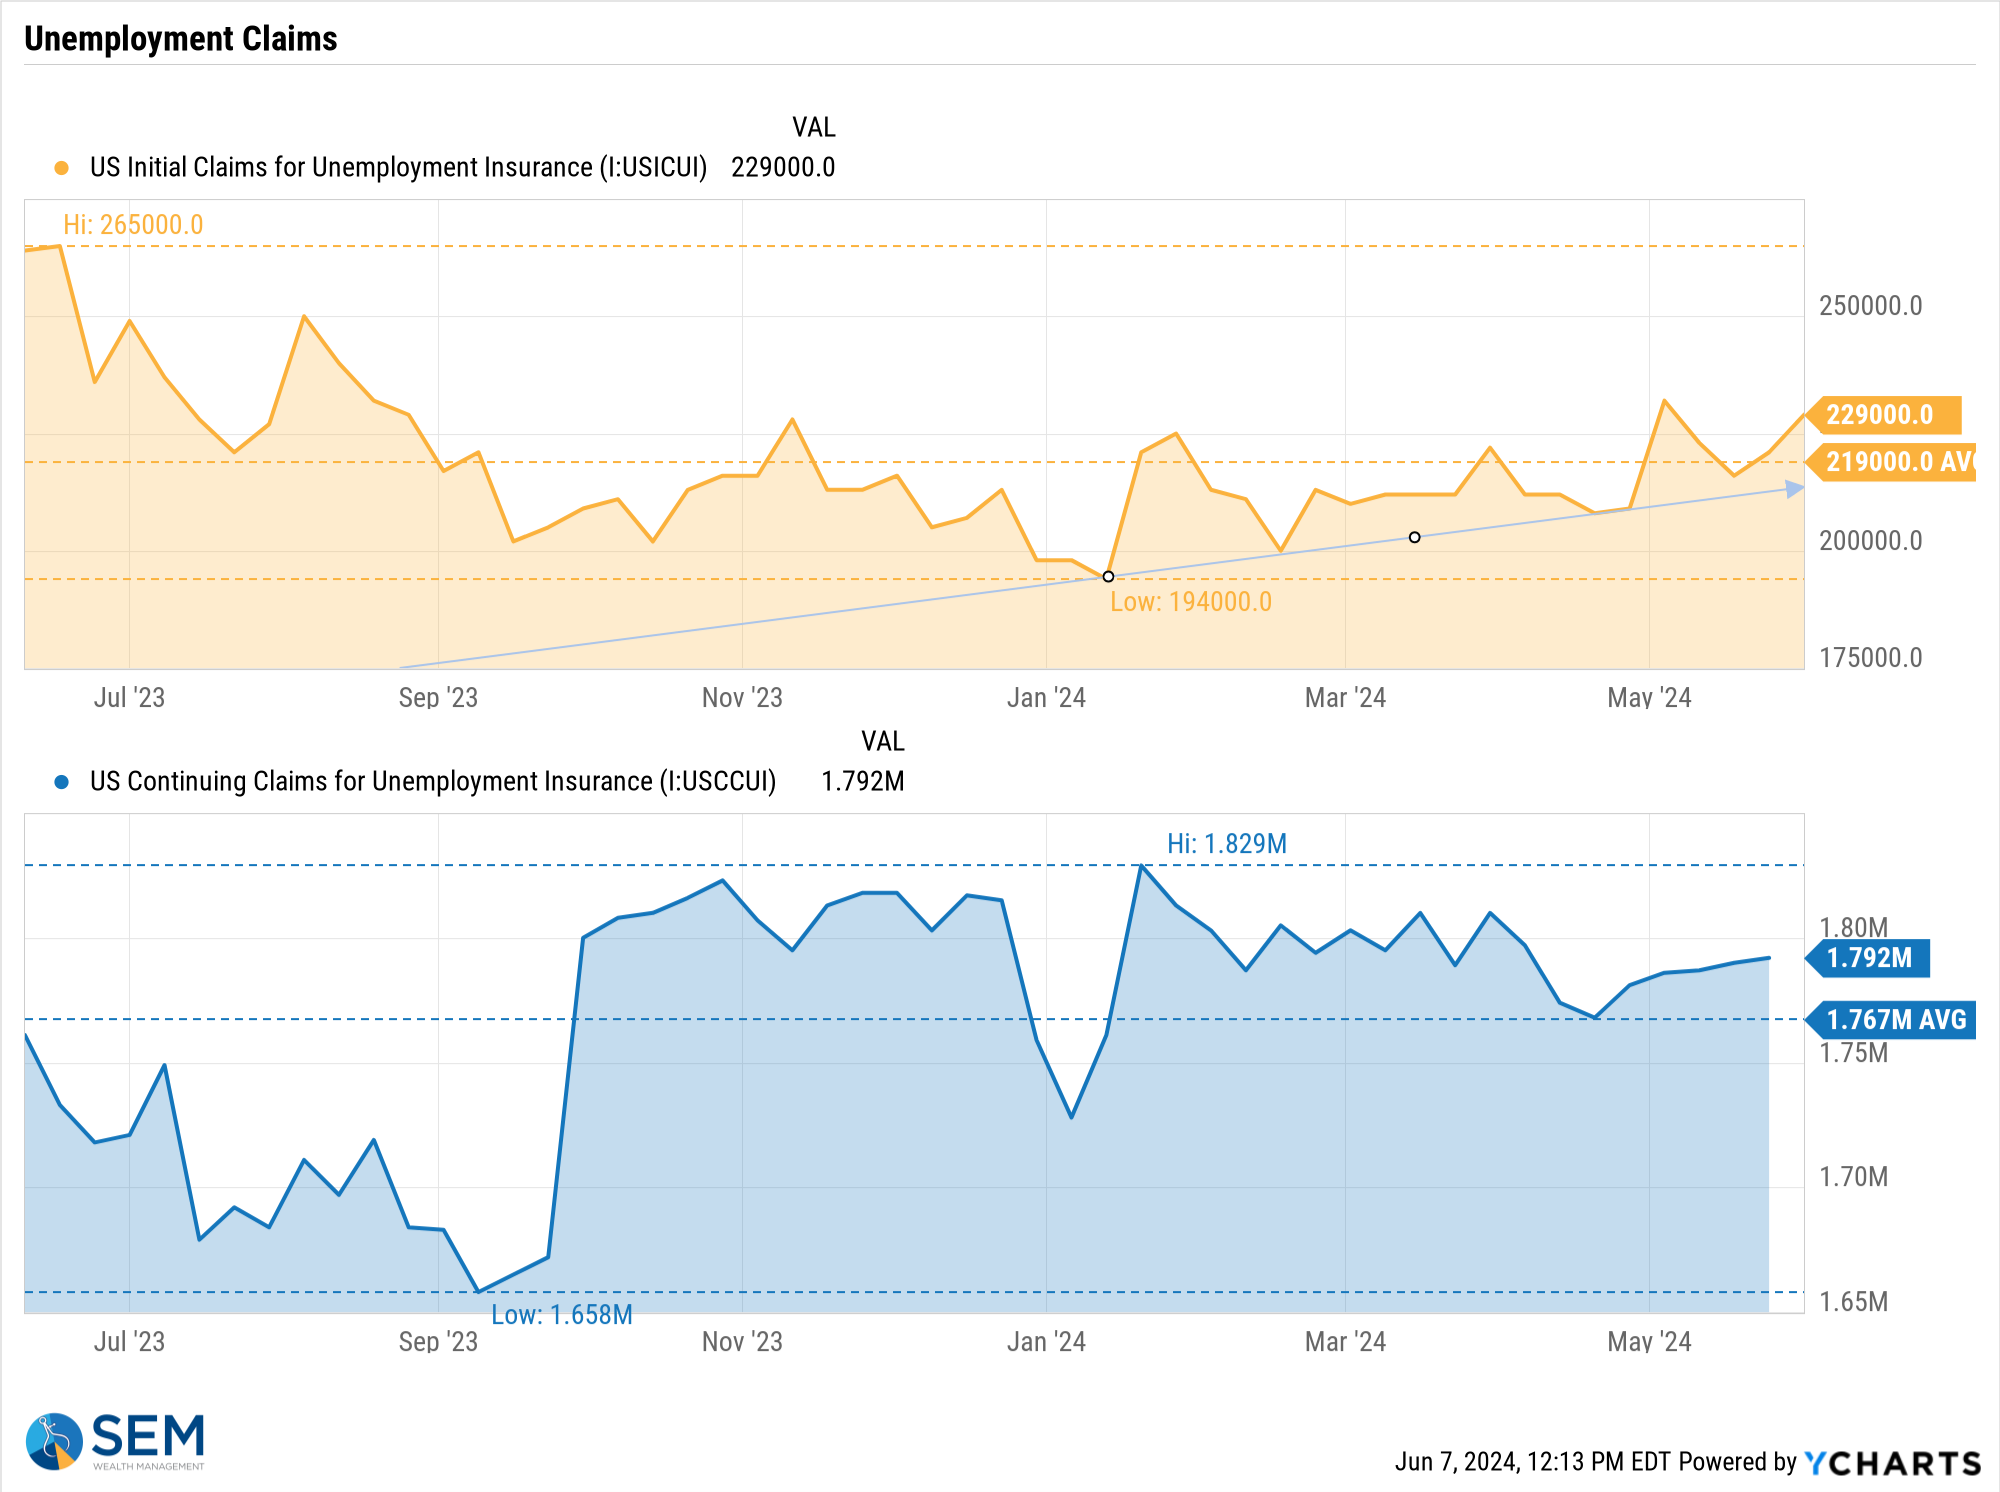
.....and unemployment claims continued to rise, now 7% off the lows.
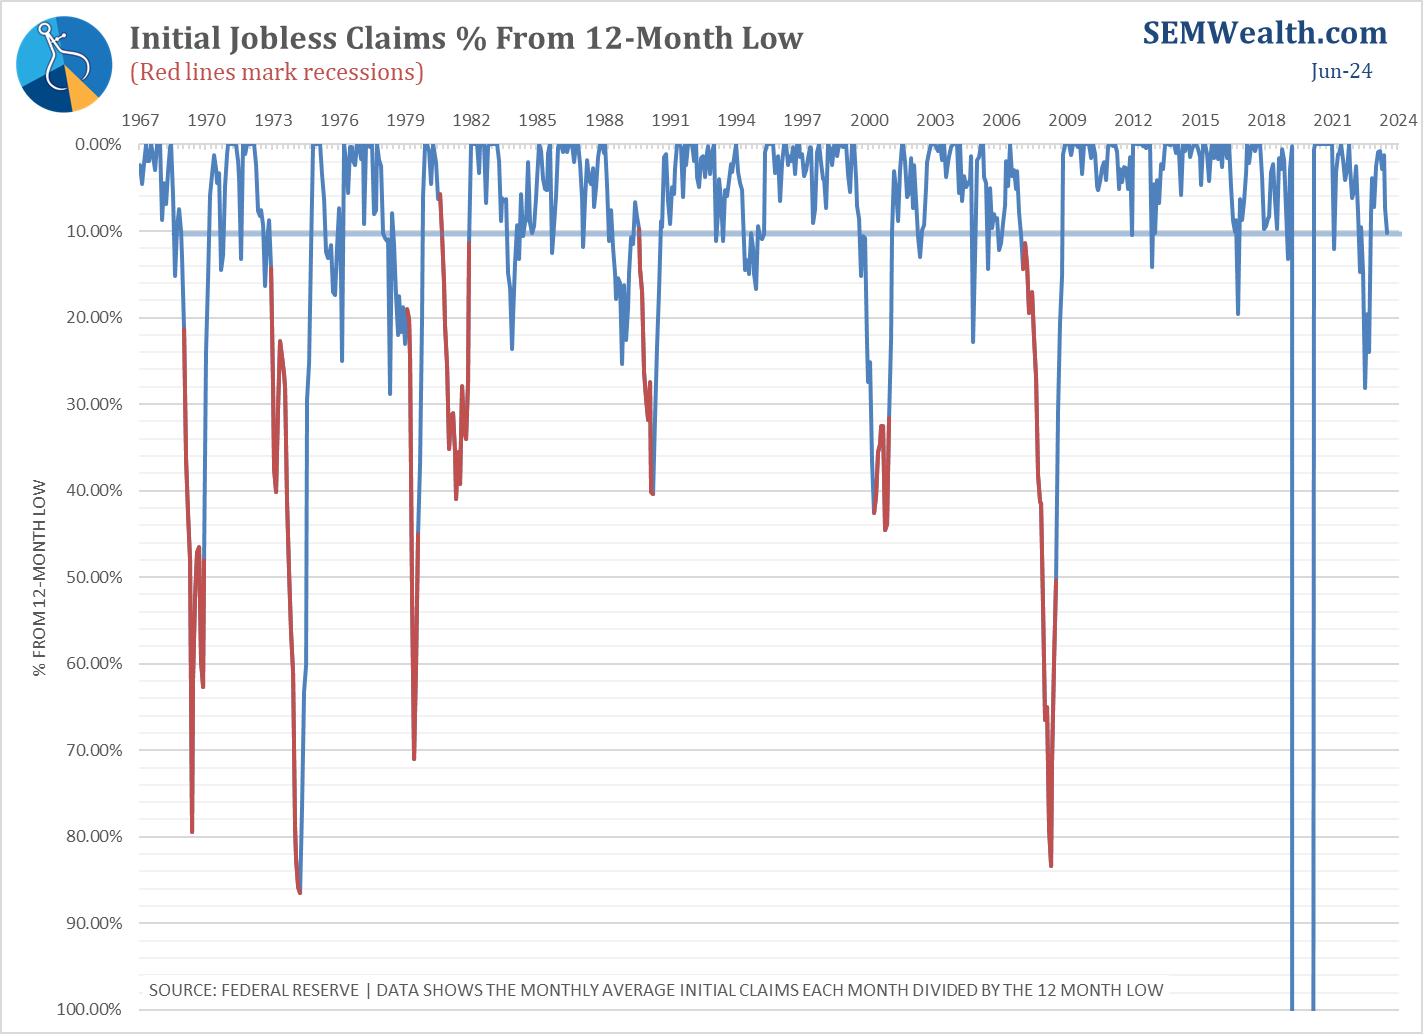
The absolute value of claims is not a concern, but the trend in unemployment claims does appear to be solidly higher now.
A few weeks ago, I spoke to at an FPA event about the economy. Here is a clip discussing employment indicators.
We will also be hosting a webinar at the end of the month to review our economic indicators, the state of the economy, and the impact of the election.

While these employment indicators are my "favorite" at the moment, here are a few more indicators that stood out in our model.........
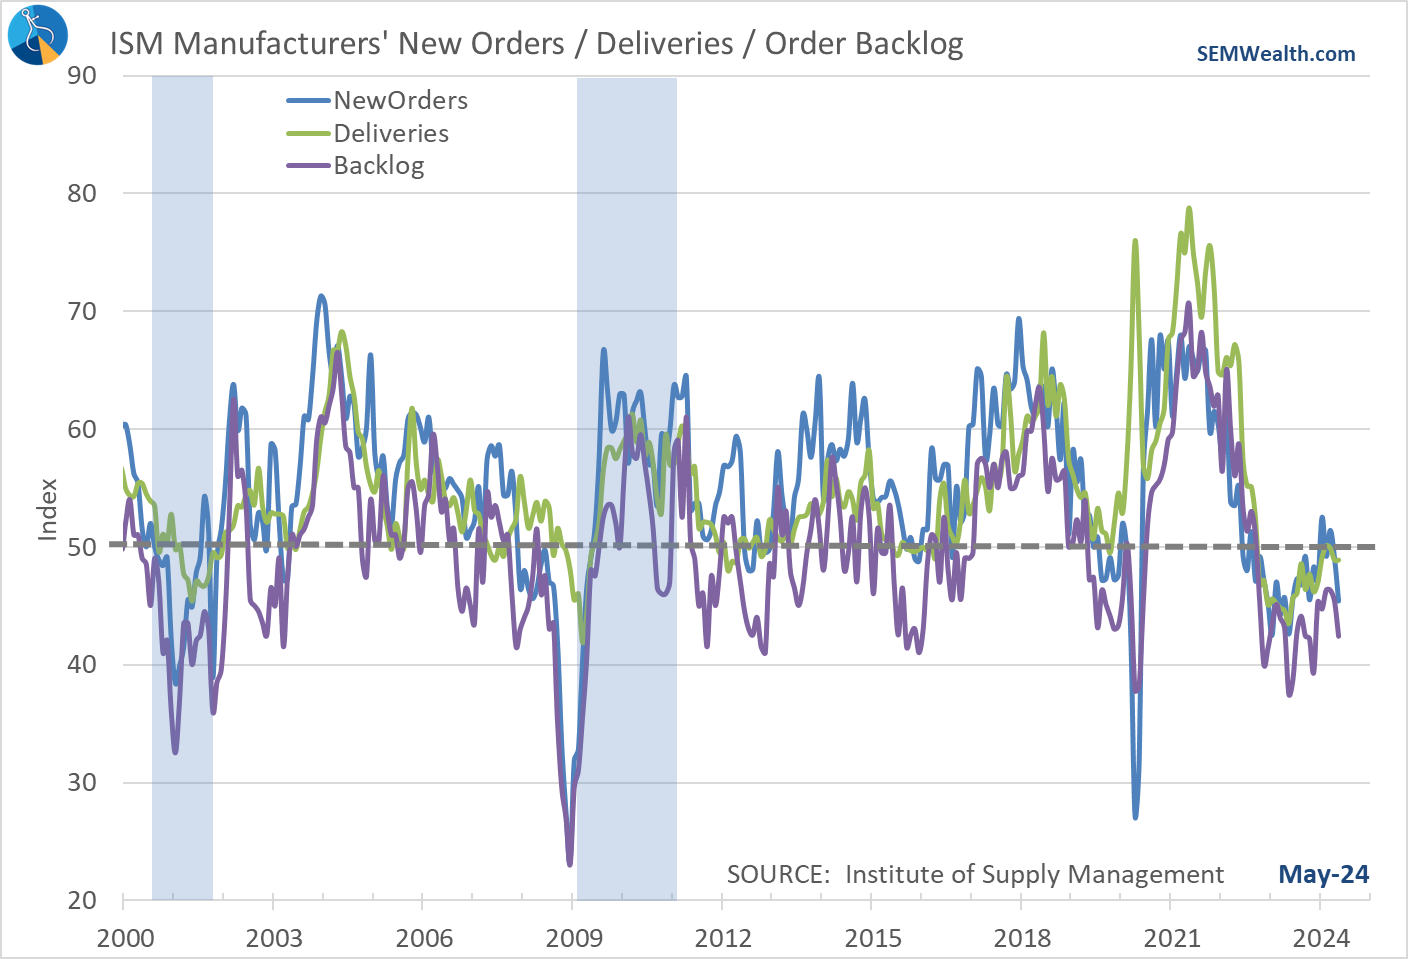
Manufacturing continues to slow
While we are not a manufacturing economy any more, the activity in this sector remains a key leading indicator as increased activity here is a sign of a strong underlying economy. Anything below 50 for these indicators is a sign of contraction in the economy.
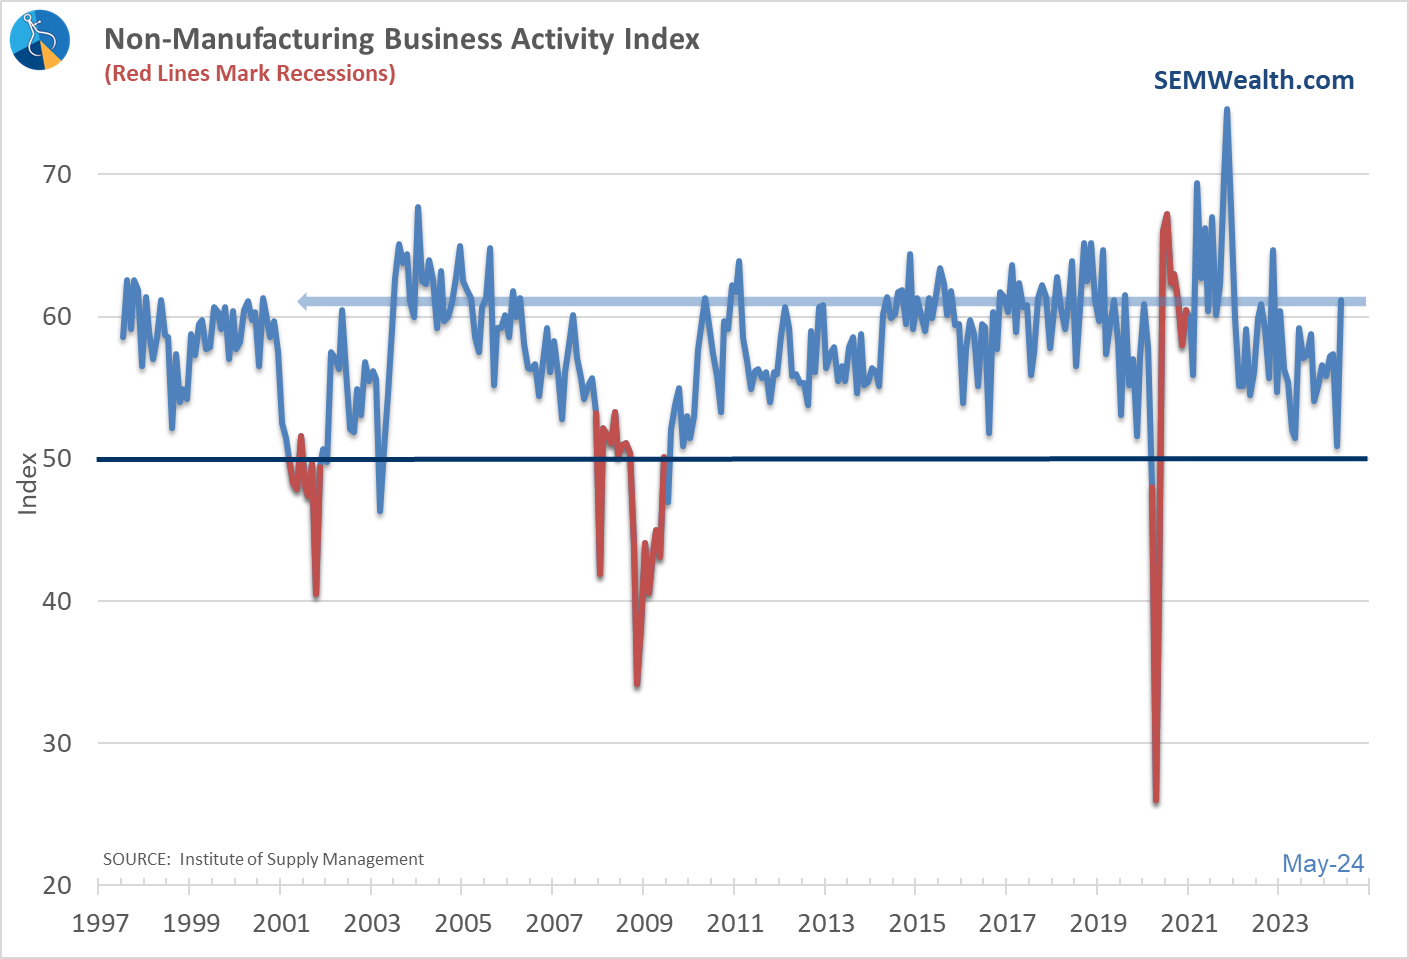
Service business activity surges
I always put this indicator in the 'easy-come, easy-go' category as spending on services can be shut off or increase fairly quickly. Service business activity was heading towards contraction the past two months, but in May this sector reported a surge in activity.
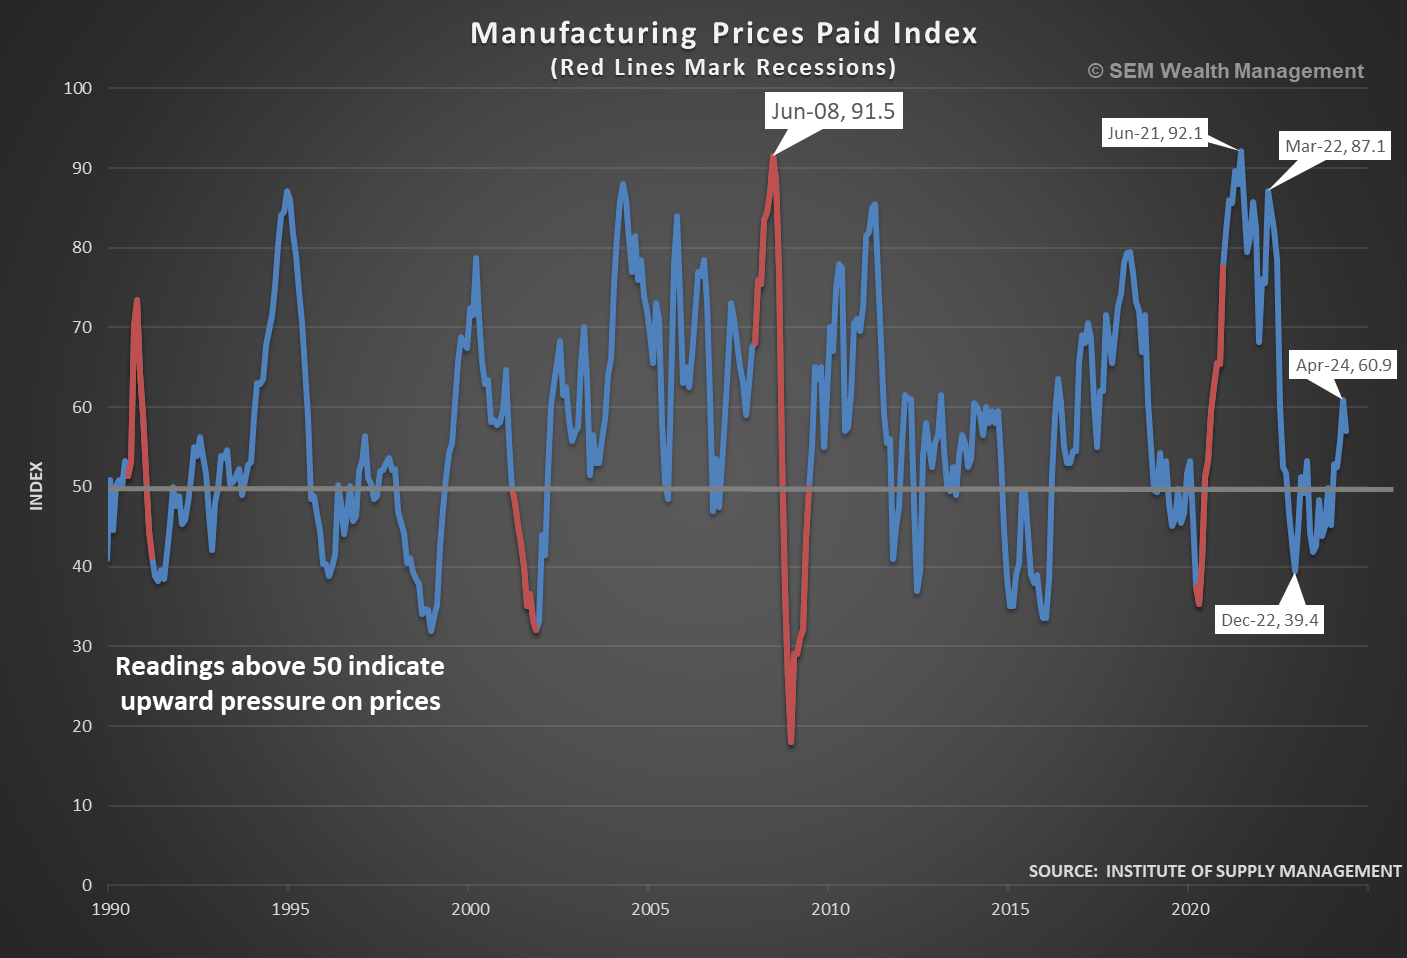
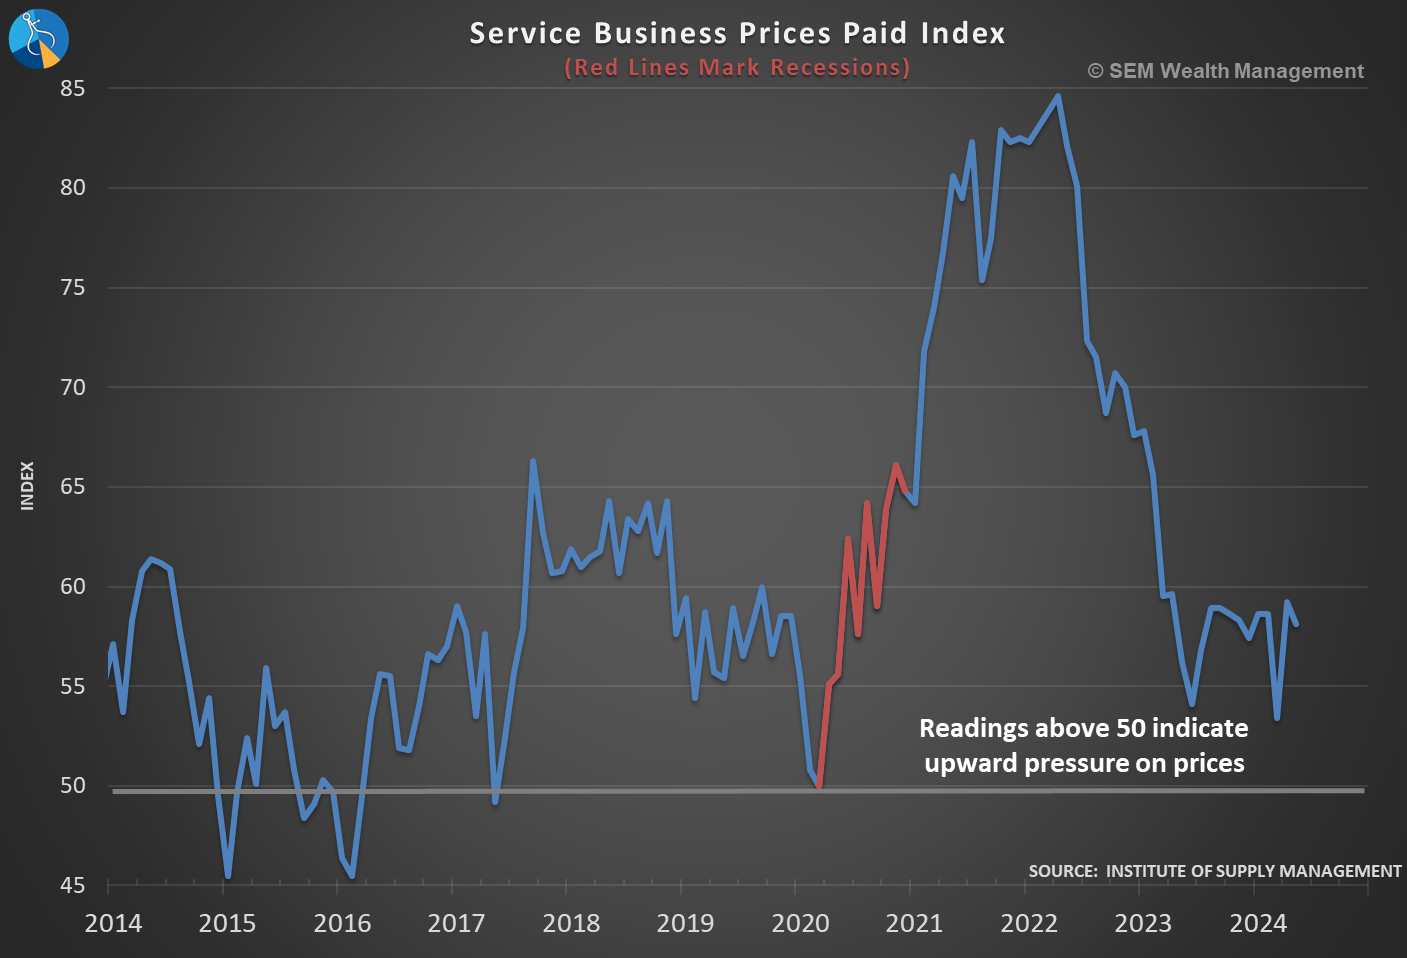
Prices still rising for both manufacturing components and services
This is the problem the Fed faces – there is upward pressure on prices that could make it difficult to cut rates before the economy slows too quickly.
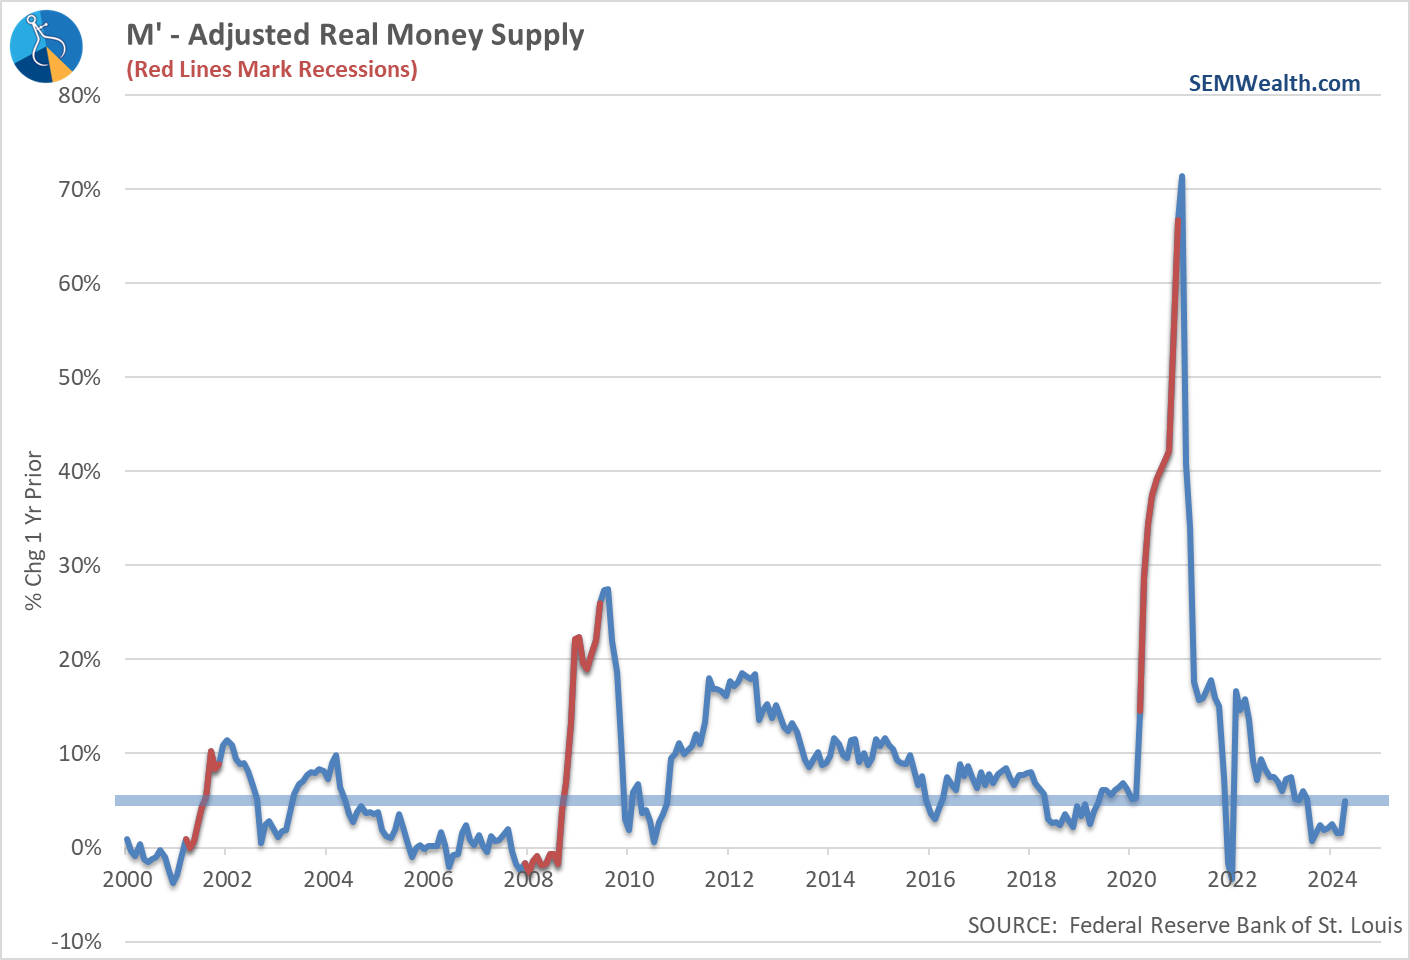
Money isn't 'tight'
I know for many people, the squeeze of higher interest rates and high inflation levels has tightened their finances, but the screams from Wall Street and the banks that the Fed needs to loosen things up is simply not true. One reason for this is the very nice yields you can get on a Money Market account (we currently yield right around 5% when our models go to "cash"). This has actually been hurting the Fed's attempt to slow inflation.
SEM's economic model uses a measure of Money Supply called M-Prime. This adjusts the traditional "M2" used by most economists and accounts for inflation and most importantly BROKERAGE (non-bank) money market accounts. We all know these accounts are basically cash equivalents in today's electronically connected world, so it's important to see what is happening with ALL CASH, not just that at the banks.
When the Fed is 'loose' with money, the money supply will increase. To slow growth and thus inflation they need to shrink it. As our M-Prime chart shows, the GROWTH of the money supply barely went negative for a short-time in 2022, but it is still expanding. In fact, it is UP 5% over the past year! It's hard to say the Fed is TIGHTENING things when there is this much excess money (yielding 5%) sitting around ready to be spent.
The Fed has been and continues to be tone-deaf in their policies and reactions. This chart of the Fed's Balance Sheet tells the story. Focus on the blue line. This shows the size of the Fed's Balance Sheet. The other lines are the underlying components. While the Fed has thankfully shrunk their balance sheet some, they have only taken it back to January 2021 levels, a point where inflation was already escalating quickly.
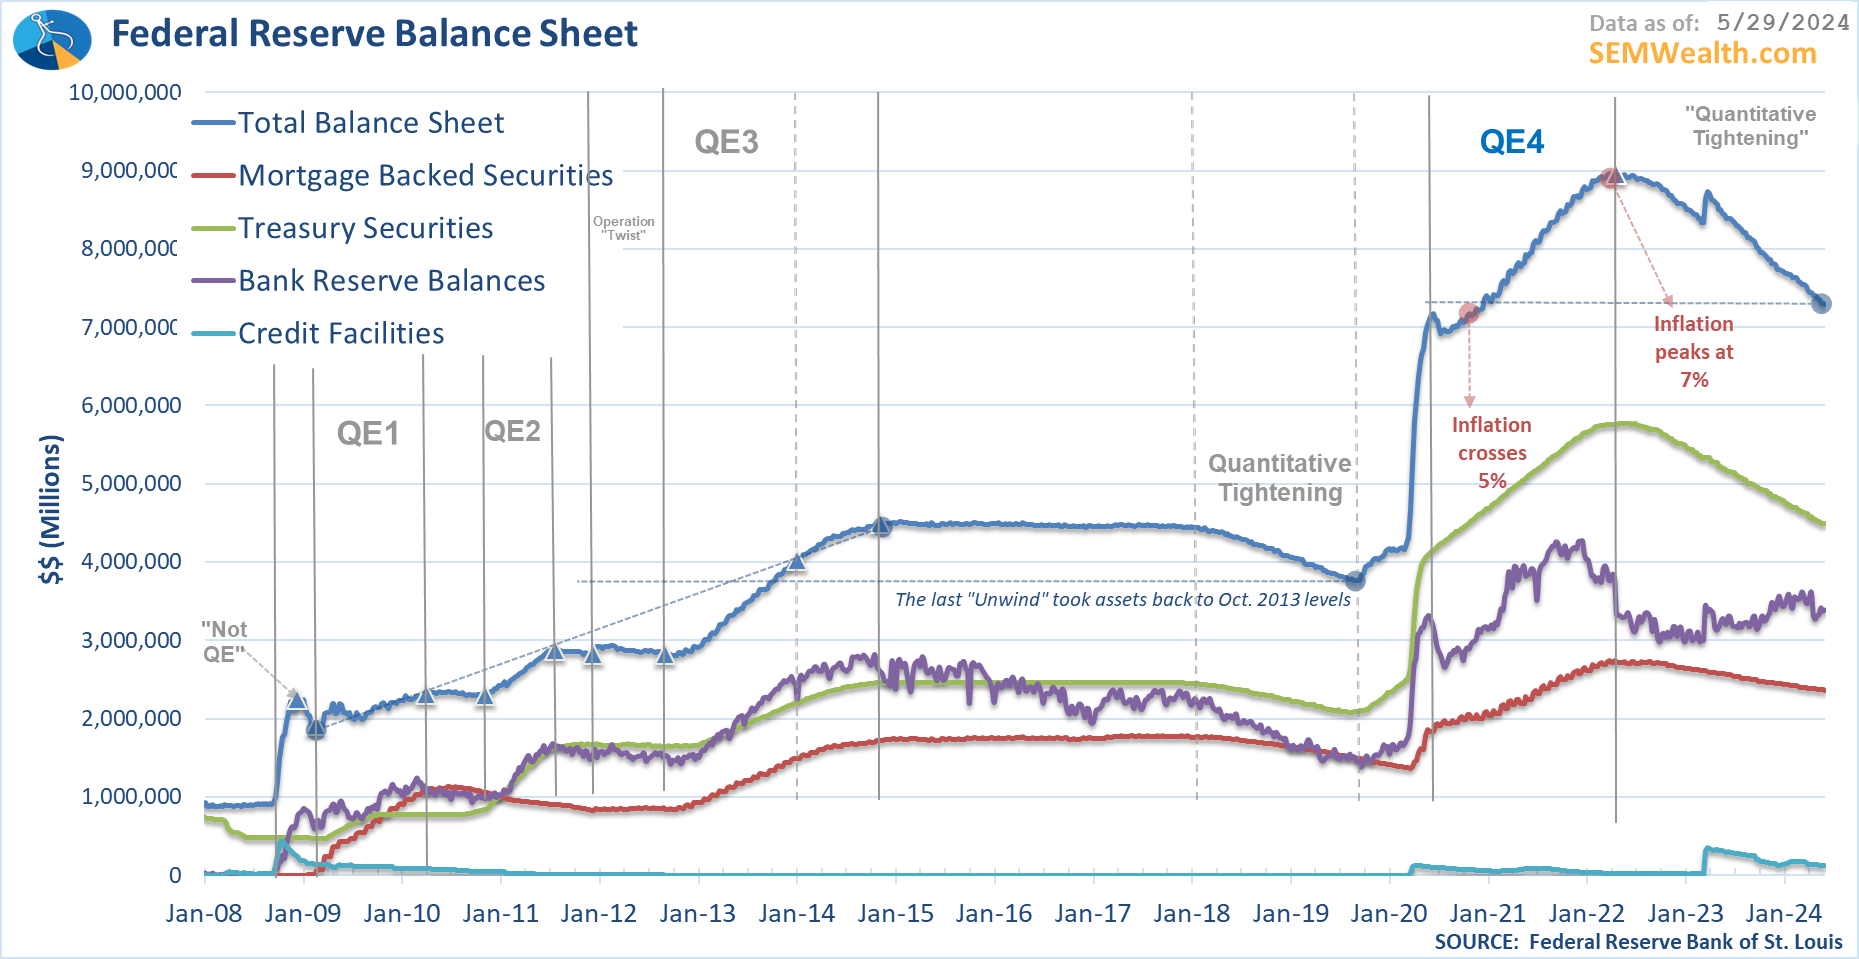
They have done NOTHING to take away the ridiculous amount of money they flooded the economy with in February - June 2020. That money was given to the Wall Street banks, which helped boost their investment portfolios along with their clients. That money continues to earn risk free yields above 5%. That money will continue to be on the sidelines to provide growth fuel (and inflationary pressure) until the Fed sucks that liquidity back up.
They broke the economy with their unprecedented policies and have no idea how to get out from under them or more importantly what the impact will be if they wait too long.
Yield spread decreases again
I mentioned last week the yield spread and how many 'experts' are saying it doesn't matter any more because it is "different this time". While the cause of the economic contraction is most certainly something we've never experienced before along with the reaction/solutions to the contraction by the Fed and Congress, from a fundamental economic perspective the yield curve inversion is still important as it causes things to not react normally.
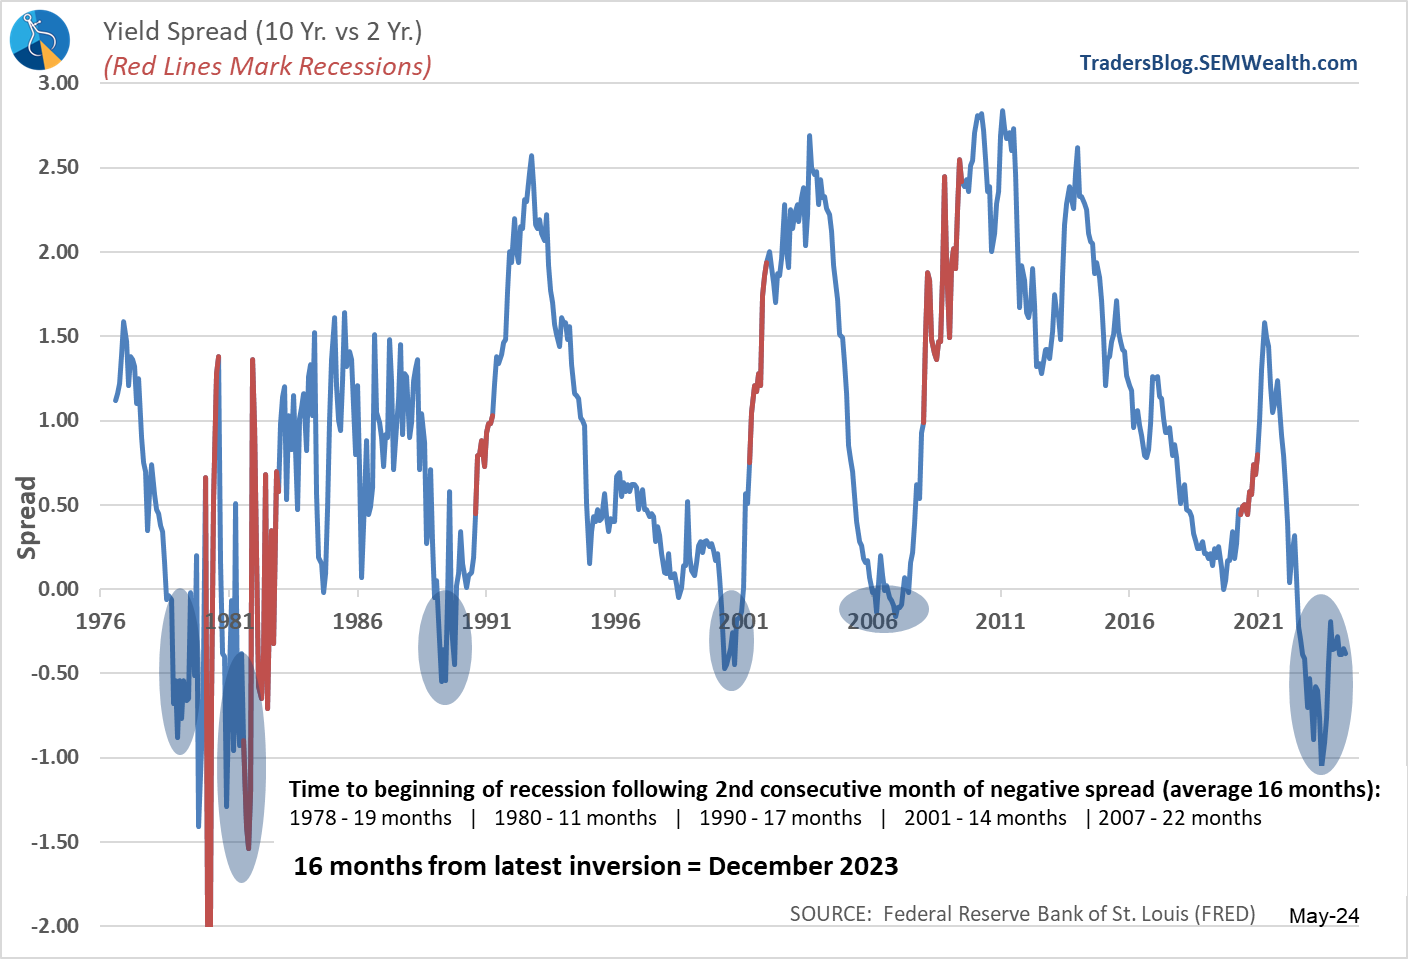
Note the data above says the AVERAGE beginning of the recession following the inversion of the yield curve is 16 months. Note in 2007 it took 22 months before the inversion finally mattered. Also of note, the Fed was already cutting rates by then yet the economy still entered a recession (and the recession was thought to be 'shallow' and just a 'technical' recession at the time.)
We are currently 21 months since the yield curve officially inverted for 2 months straight, meaning we are just about to the time it took for the disconnect in the economy in 2007 to finally start to matter.
History doesn't repeat, but it most certainly rhymes. As noted below, we are not jumping ship from this rally yet, but history, experience and data tells me you most certainly don't want to be subjectively guessing/betting/speculating that things are different this time.
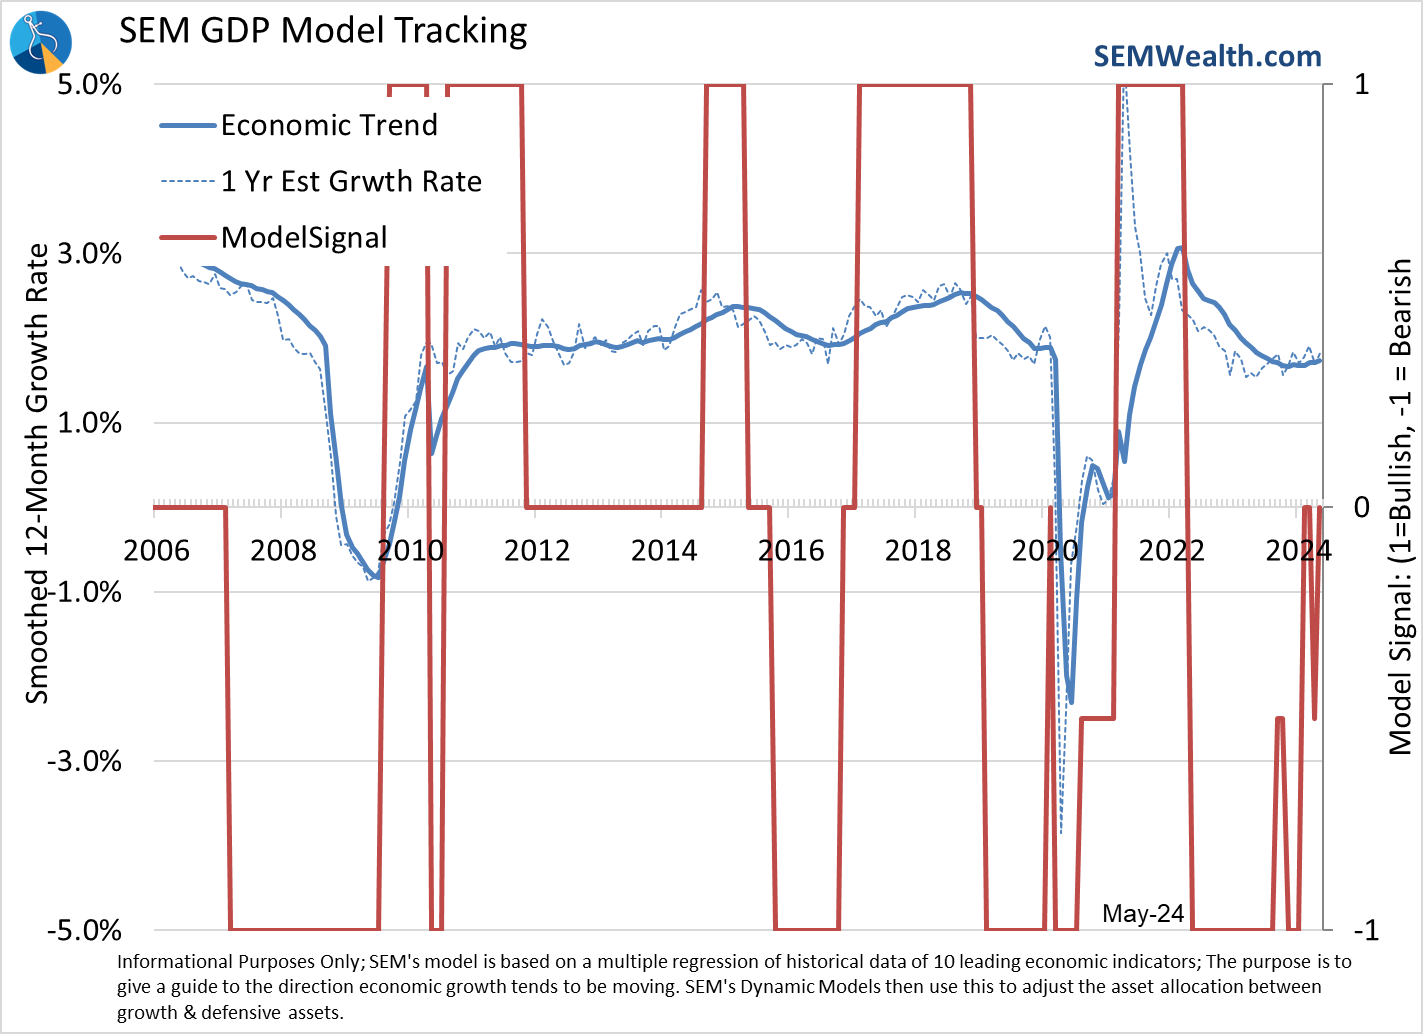
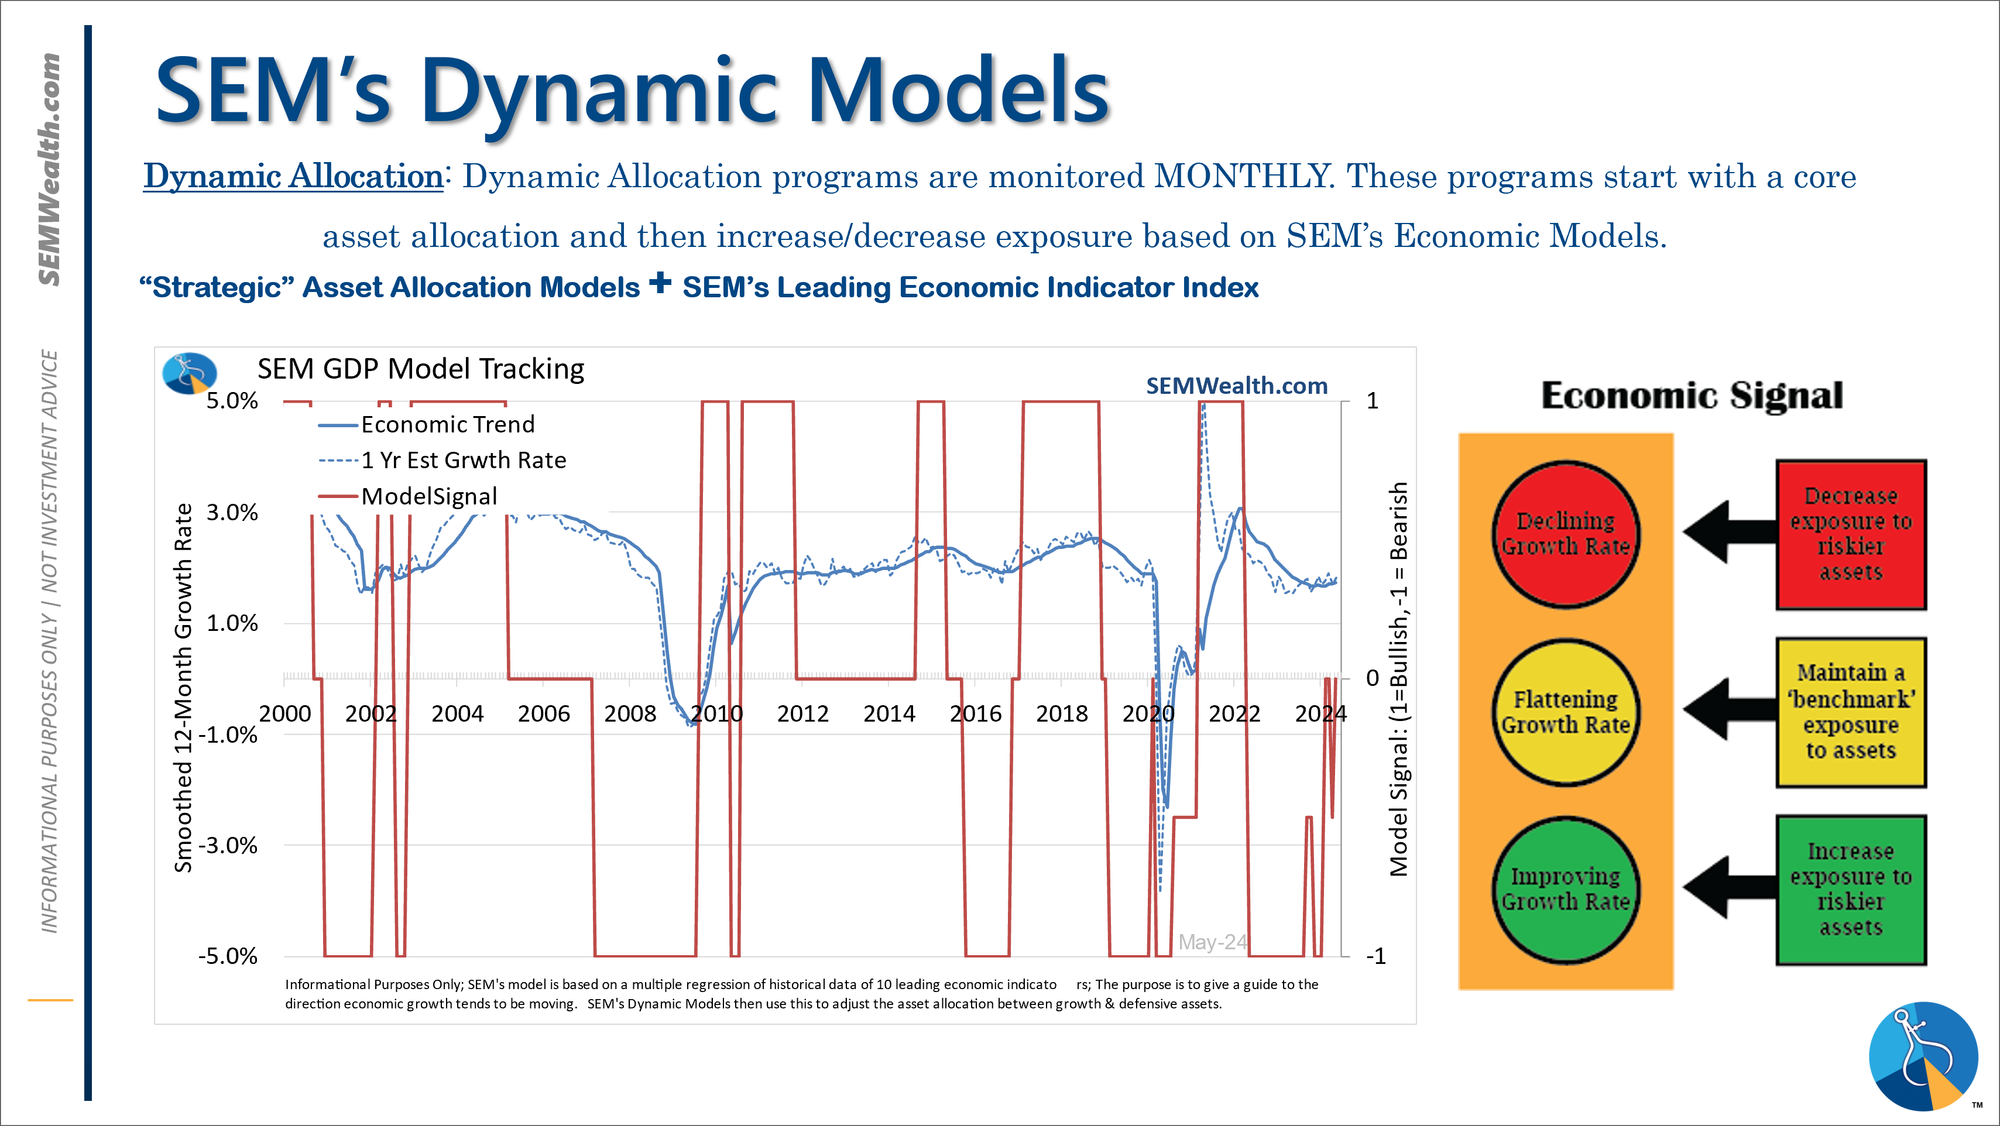
Economic Model Improves Slightly
The marginal improvements in the labor market & services sector were enough to swing our economic model back to 'neutral'. Last month it had dipped slightly (but not all the way) towards the bearish signal. The data is most certainly noisy over the past 9 months, again due to the unprecedented economic events followed by the unprecedented reaction from Congress and the Fed. The model is set to self-normalize but it should be expected to be a bit noisy as it does so. The model is actually designed to not take bets in either direction when the data is this noisy.
Economic Dashboard Mixed
The last two weeks we've reviewed pretty much every indicator in our economic model. Here is a good summary.
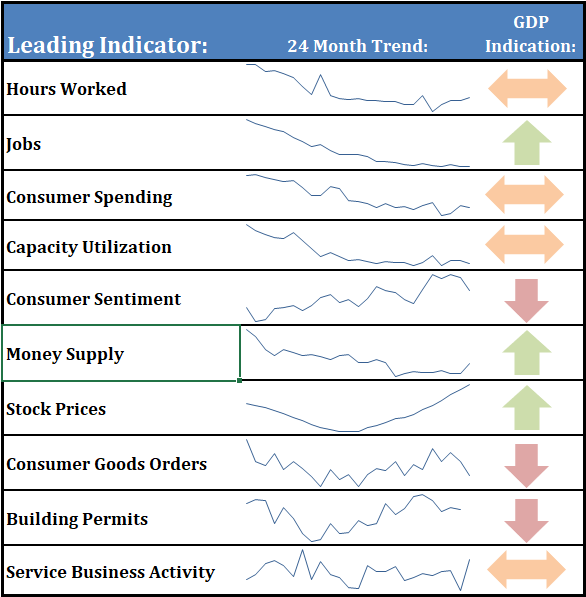
Essentially Jobs, the Fed (via still too loose Monetary Policy) and Stock Prices are pointing to strong growth ahead. Consumer Sentiment, Manufacturing (Consumer Goods Orders), and Housing are saying a recession may be on the horizon. Everything else is a mixed bag. 3 positive, 3 negative, and 4 neutral readings means our model is waiting for a more clear picture before making any big changes.
Market Charts
Two weeks ago, utilities and value stocks had strong performance while large cap growth/technology struggled. Last week performance essentially flipped with utilities and value stocks giving up all of the prior week's gains and large cap growth/technology nearly gaining back everything they lost.
While the market internals still indicate a tug-of-war between the bulls and the bears, there is one thing of note. Two weeks ago I mentioned the strange action during the last 20 minutes of the week. Last week nearly every day saw a strong rally near the end of the day, most of the time reversing the larger losses we saw most of the day. Volume was light, but it is usually a sign of some sort of institutional buy programs, which could be good news.
That is of course speculation. The charts still indicate an uptrend for stocks and until proven otherwise, the most likely direction is up. As I've said throughout my career – the trend is higher, until it isn't. Market changes are the most 'surprising' when valuations are near a peak and sentiment is strong. What is seen as 'minor' or 'temporary' news headlines with hindsight could be the thing that breaks the market.
So please do not take anything said here as advice, but merely a guide to what I'm seeing based on over 30 years of market experience.
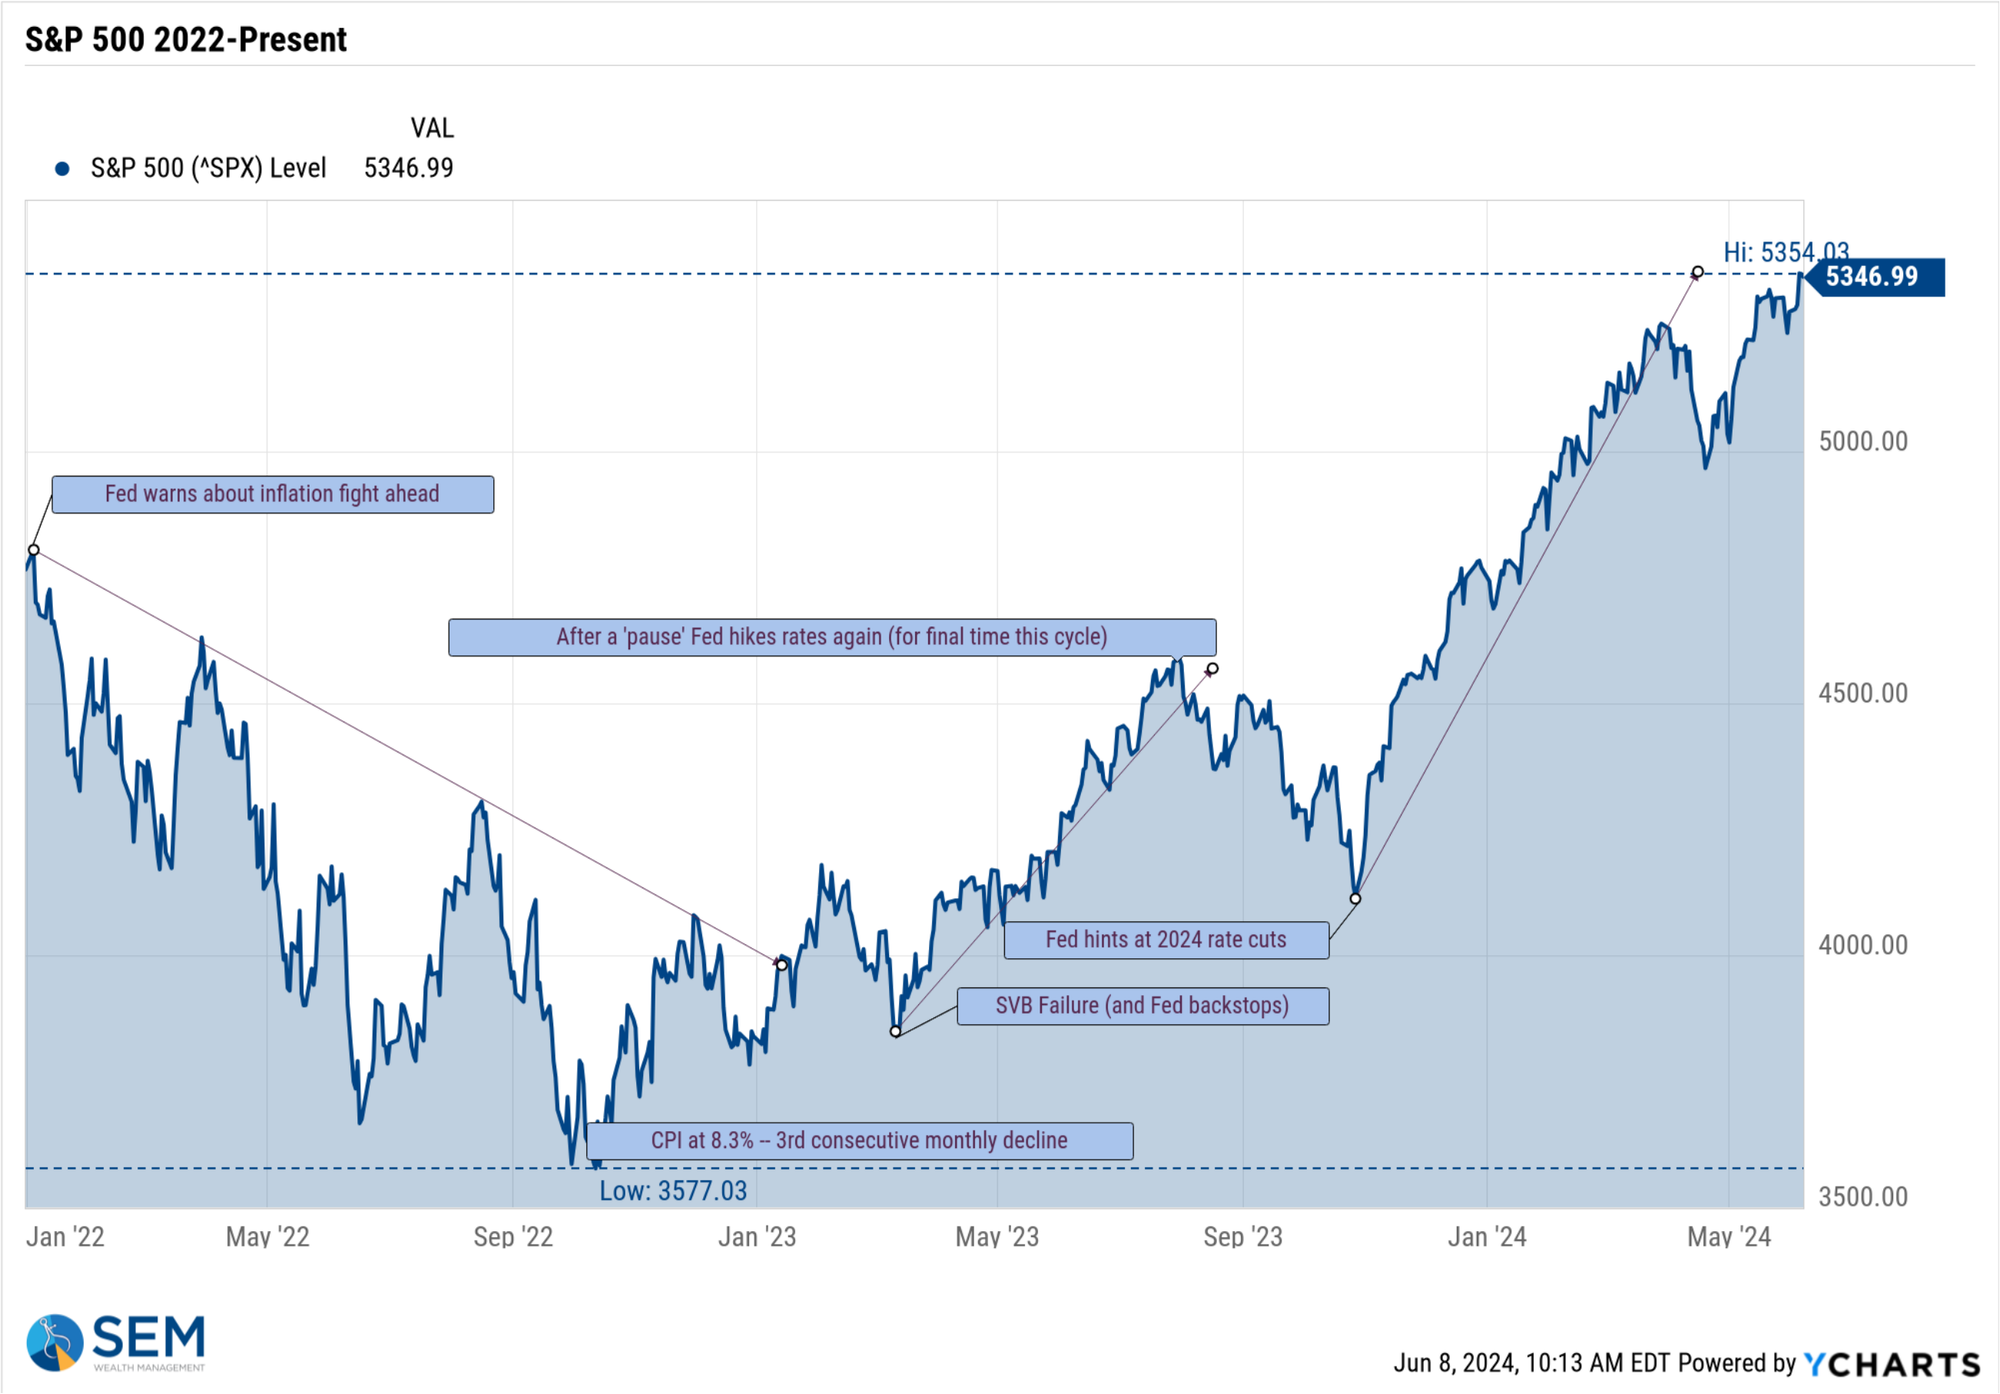
For the large cap heavy S&P 500, higher highs continue to breed higher highs. After a quick 5% correction, we are back to all-time highs.
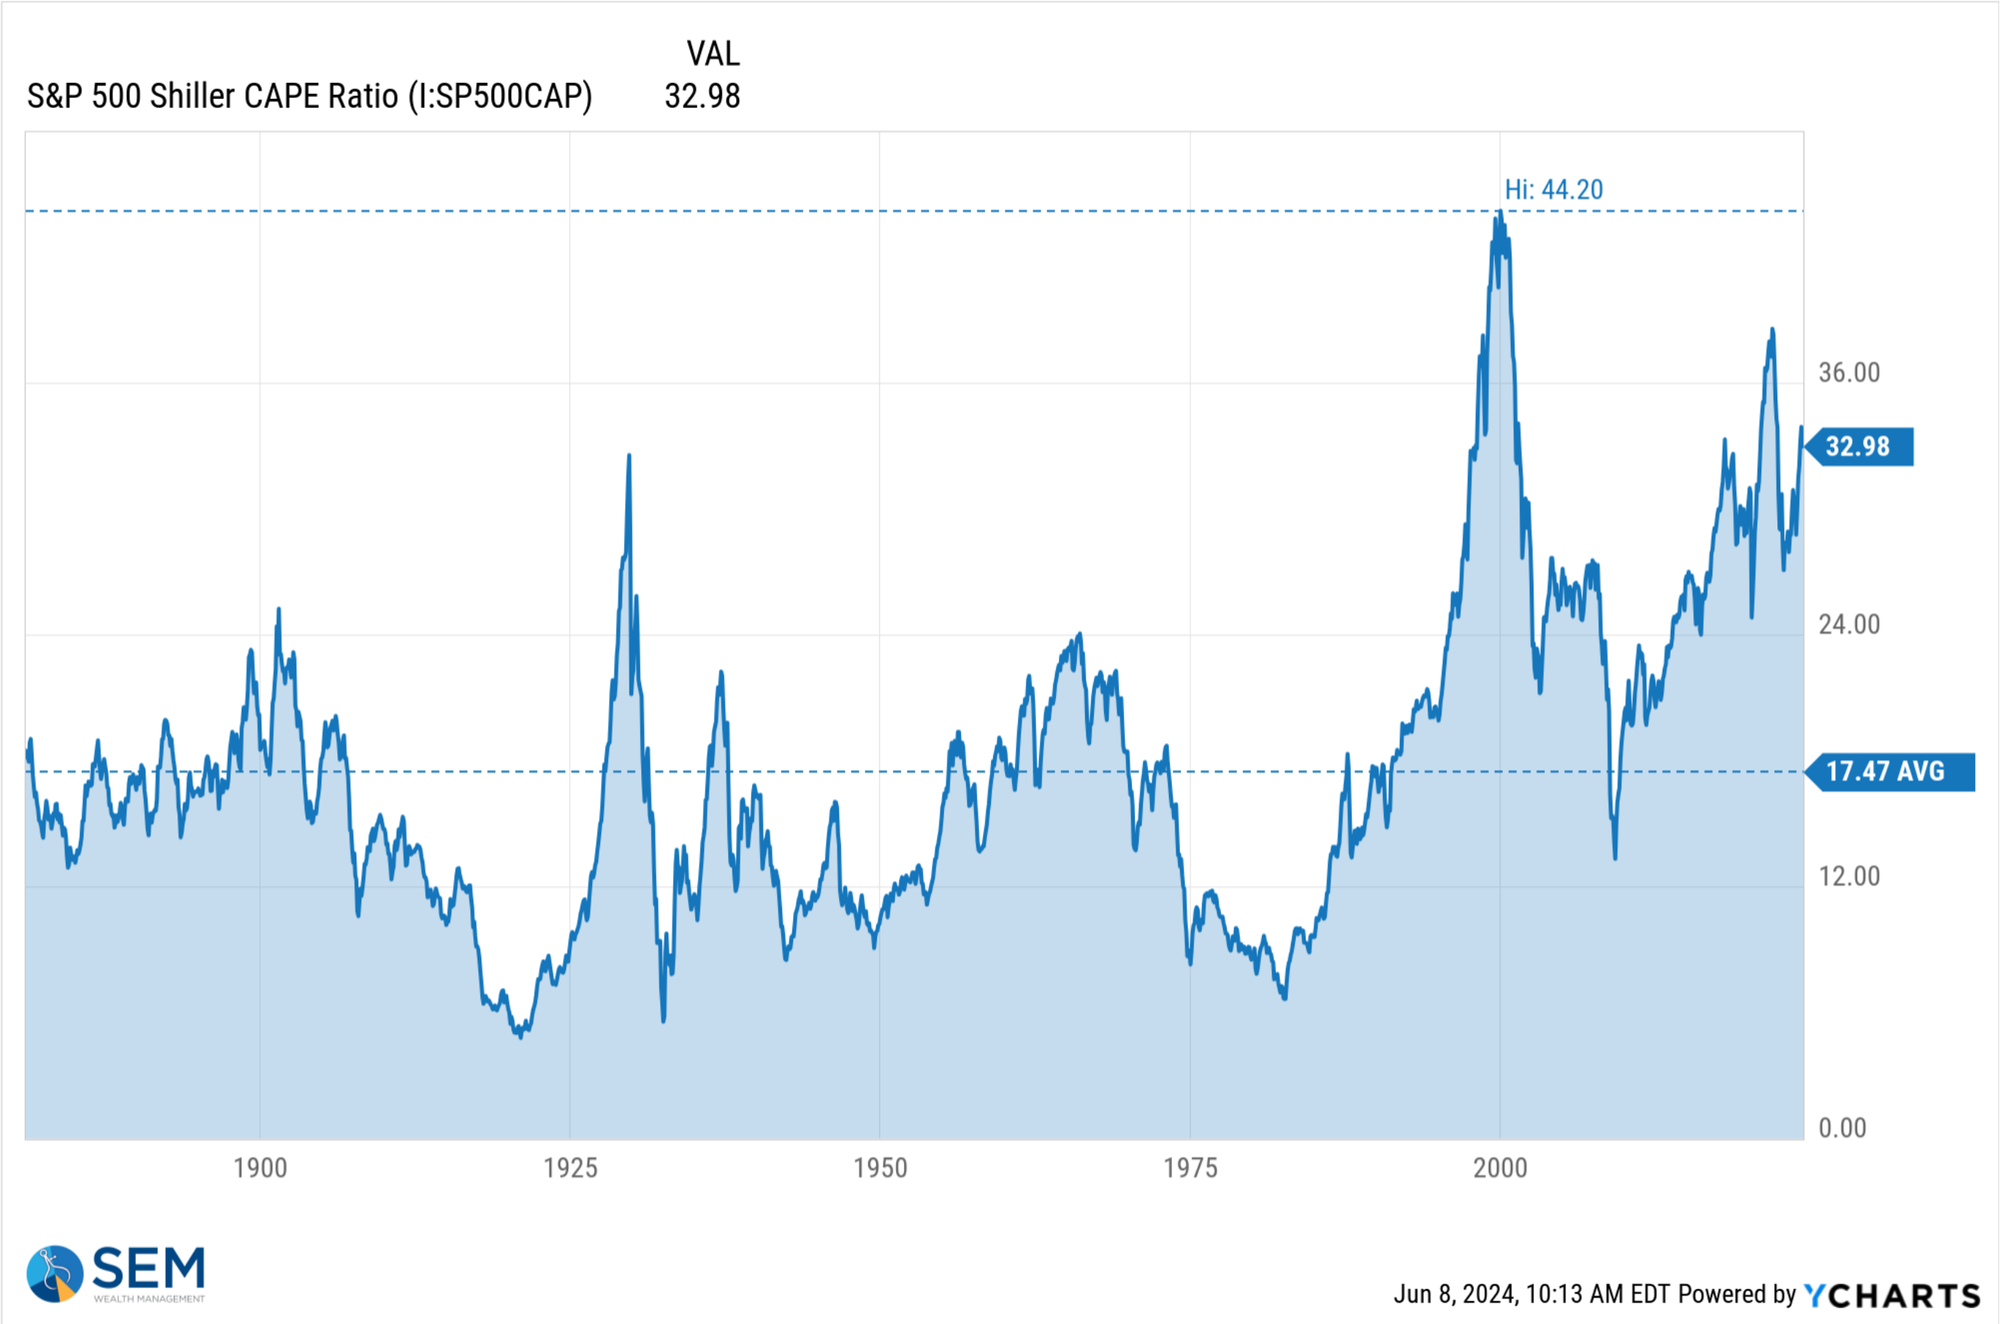
Valuations are once again approaching the 2021 highs. As we learned in 2022 even a slowdown in earnings growth can knock 20-25% off of stock prices. If earnings actually decline things could get ugly.
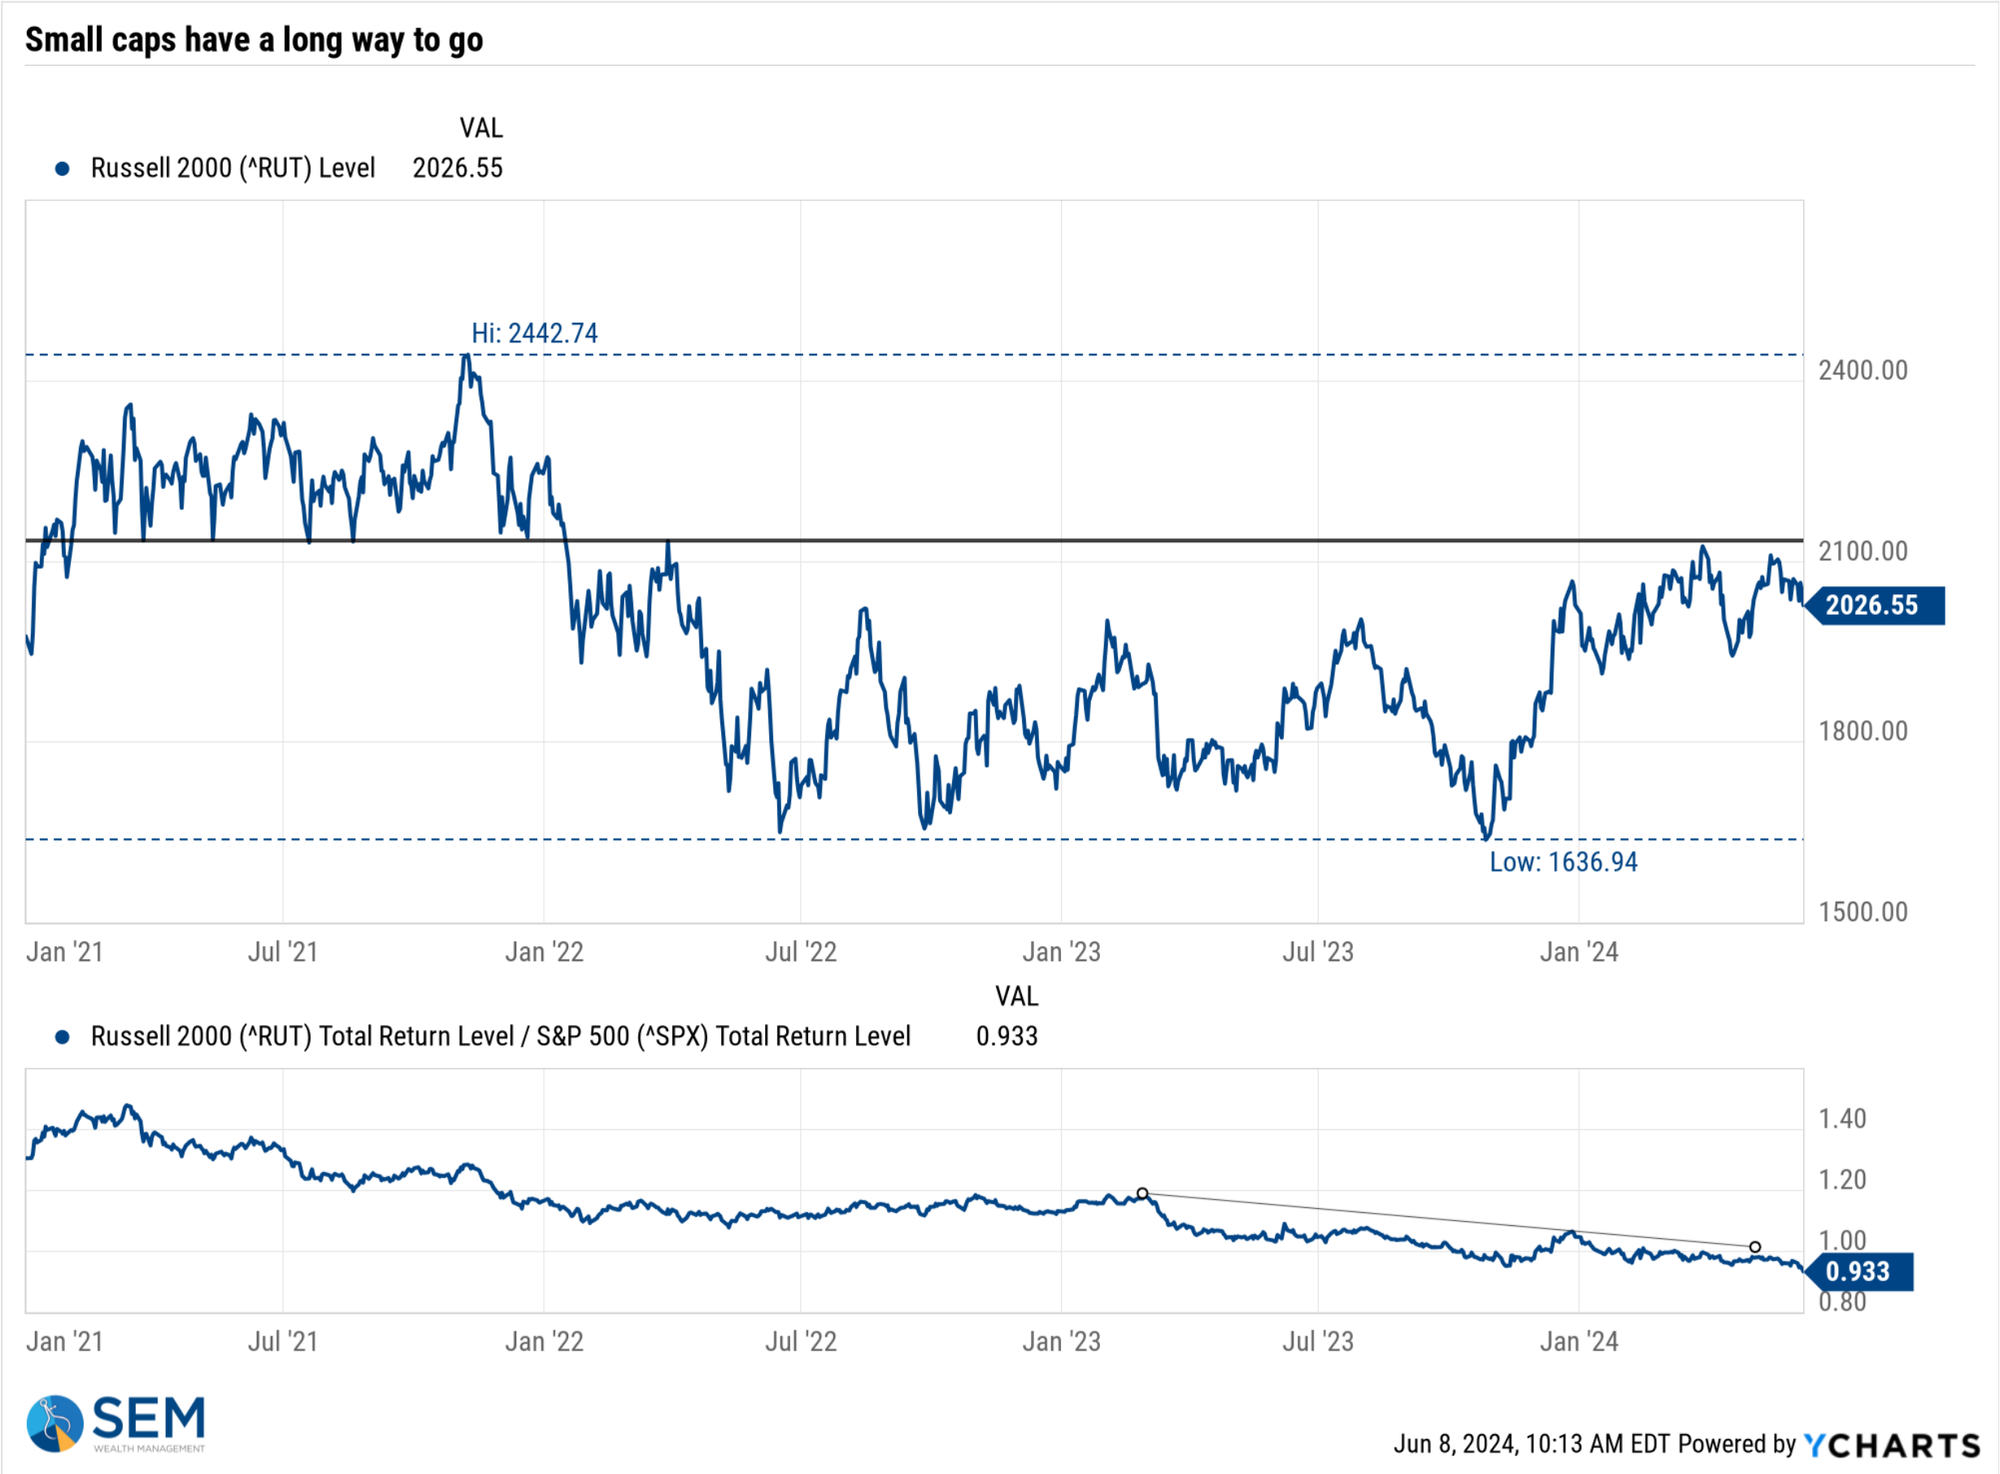
Small caps continue to point to an economy that is weakening. Long-term this is not a healthy signal. We need small companies to grow and become large companies. If too few companies control the market and economy innovation suffers along with the underlying economy. This means the excessively high valuations cannot be supported by strong on-going growth. I keep hoping we will see the market broaden out so this indicator is one of my favorites to watch.
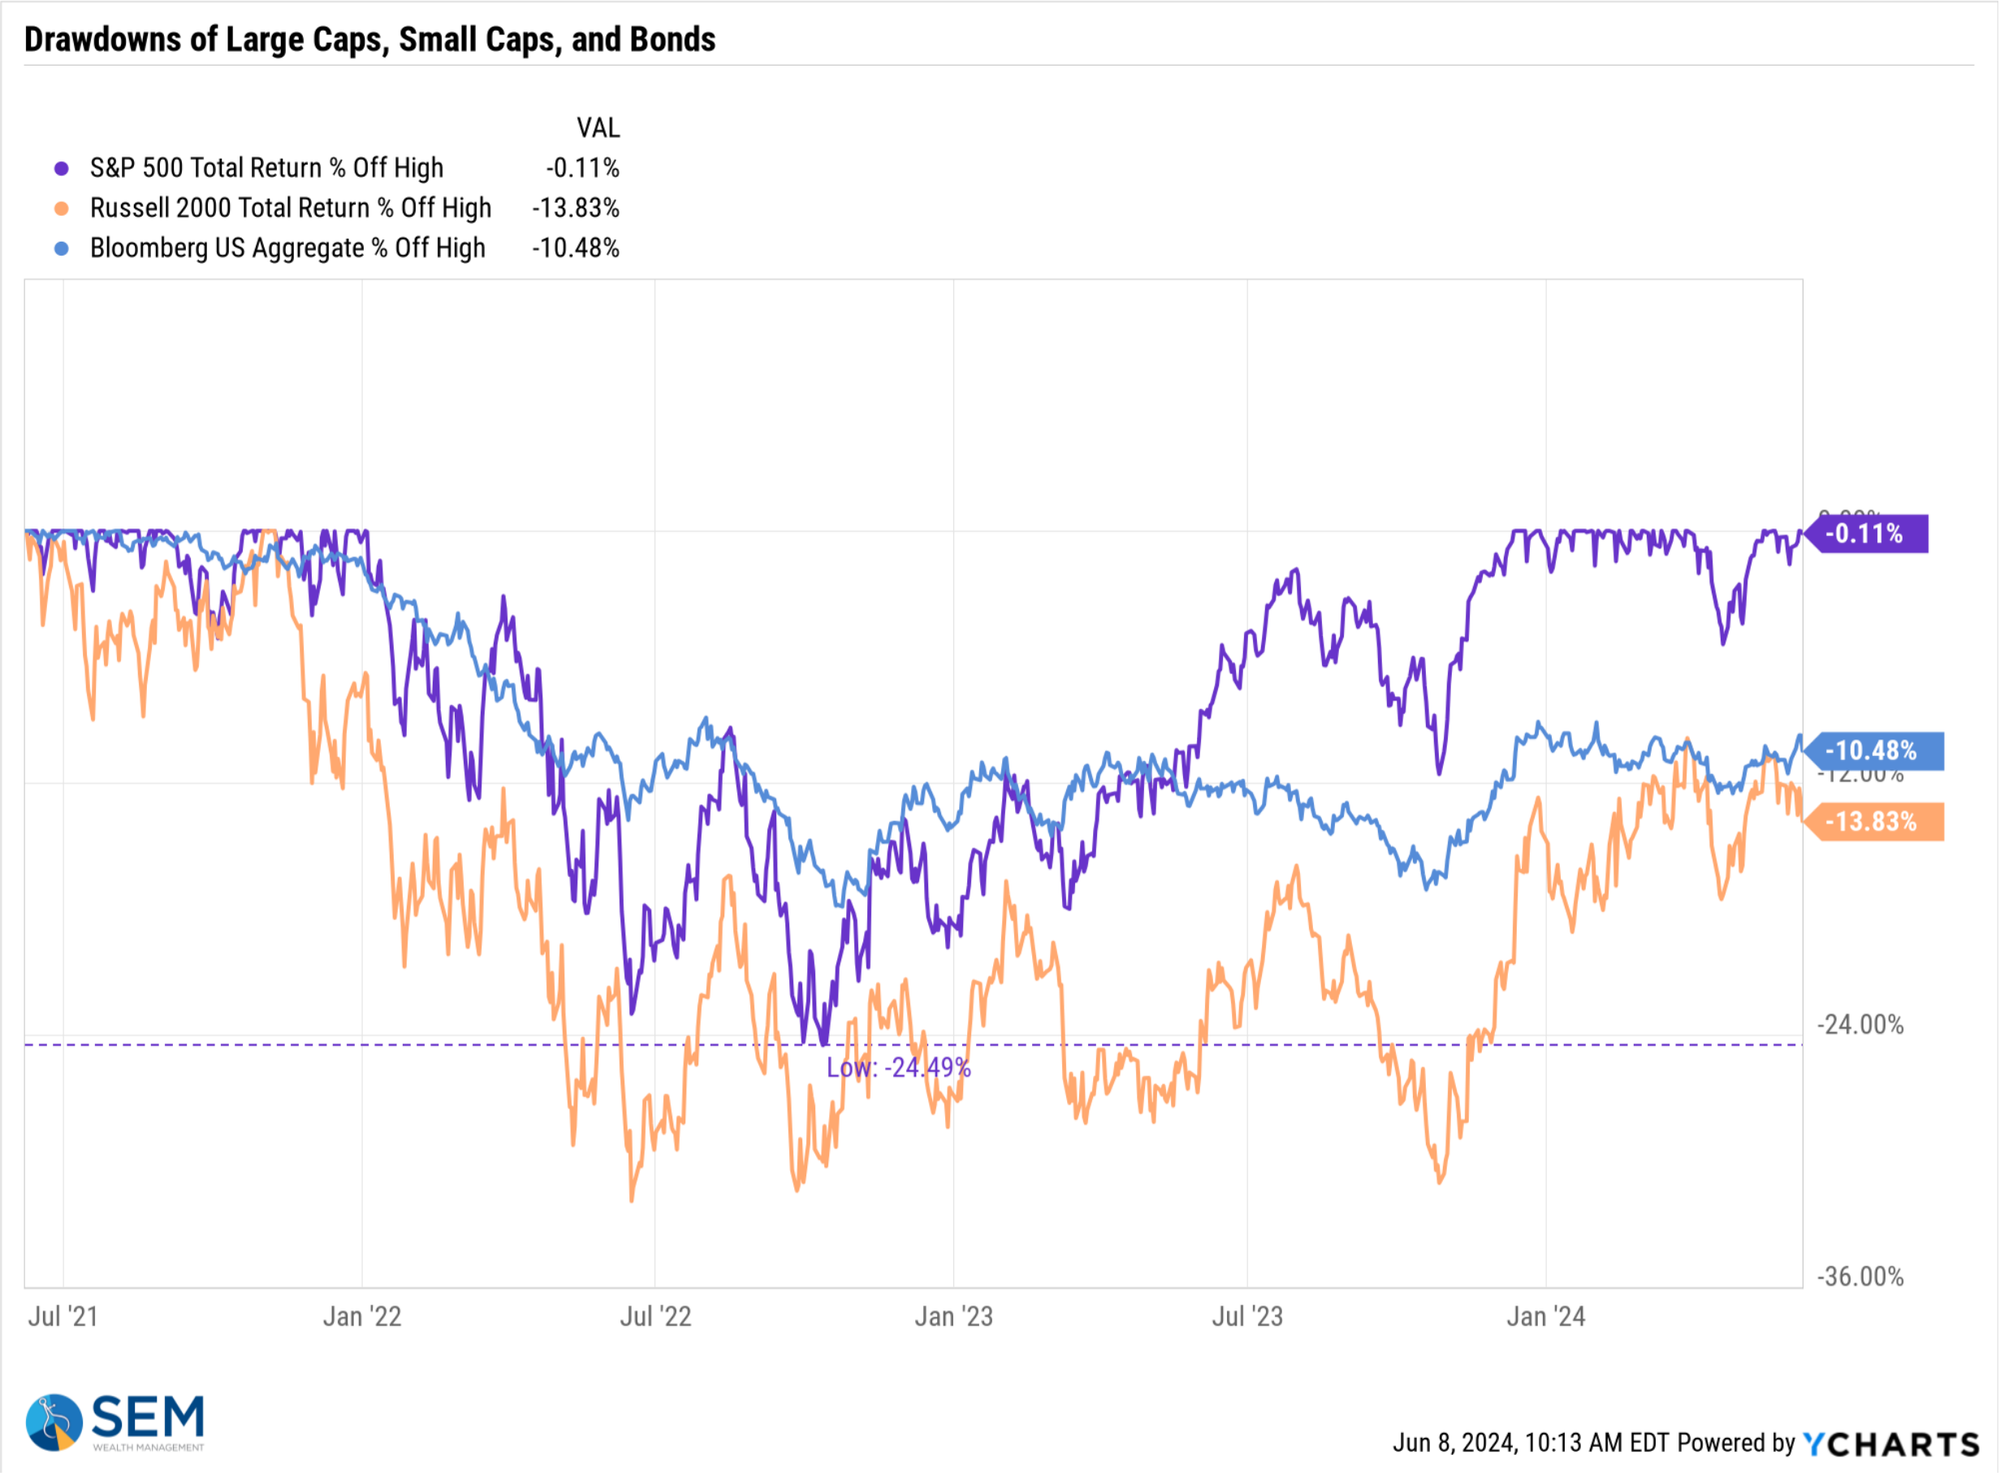
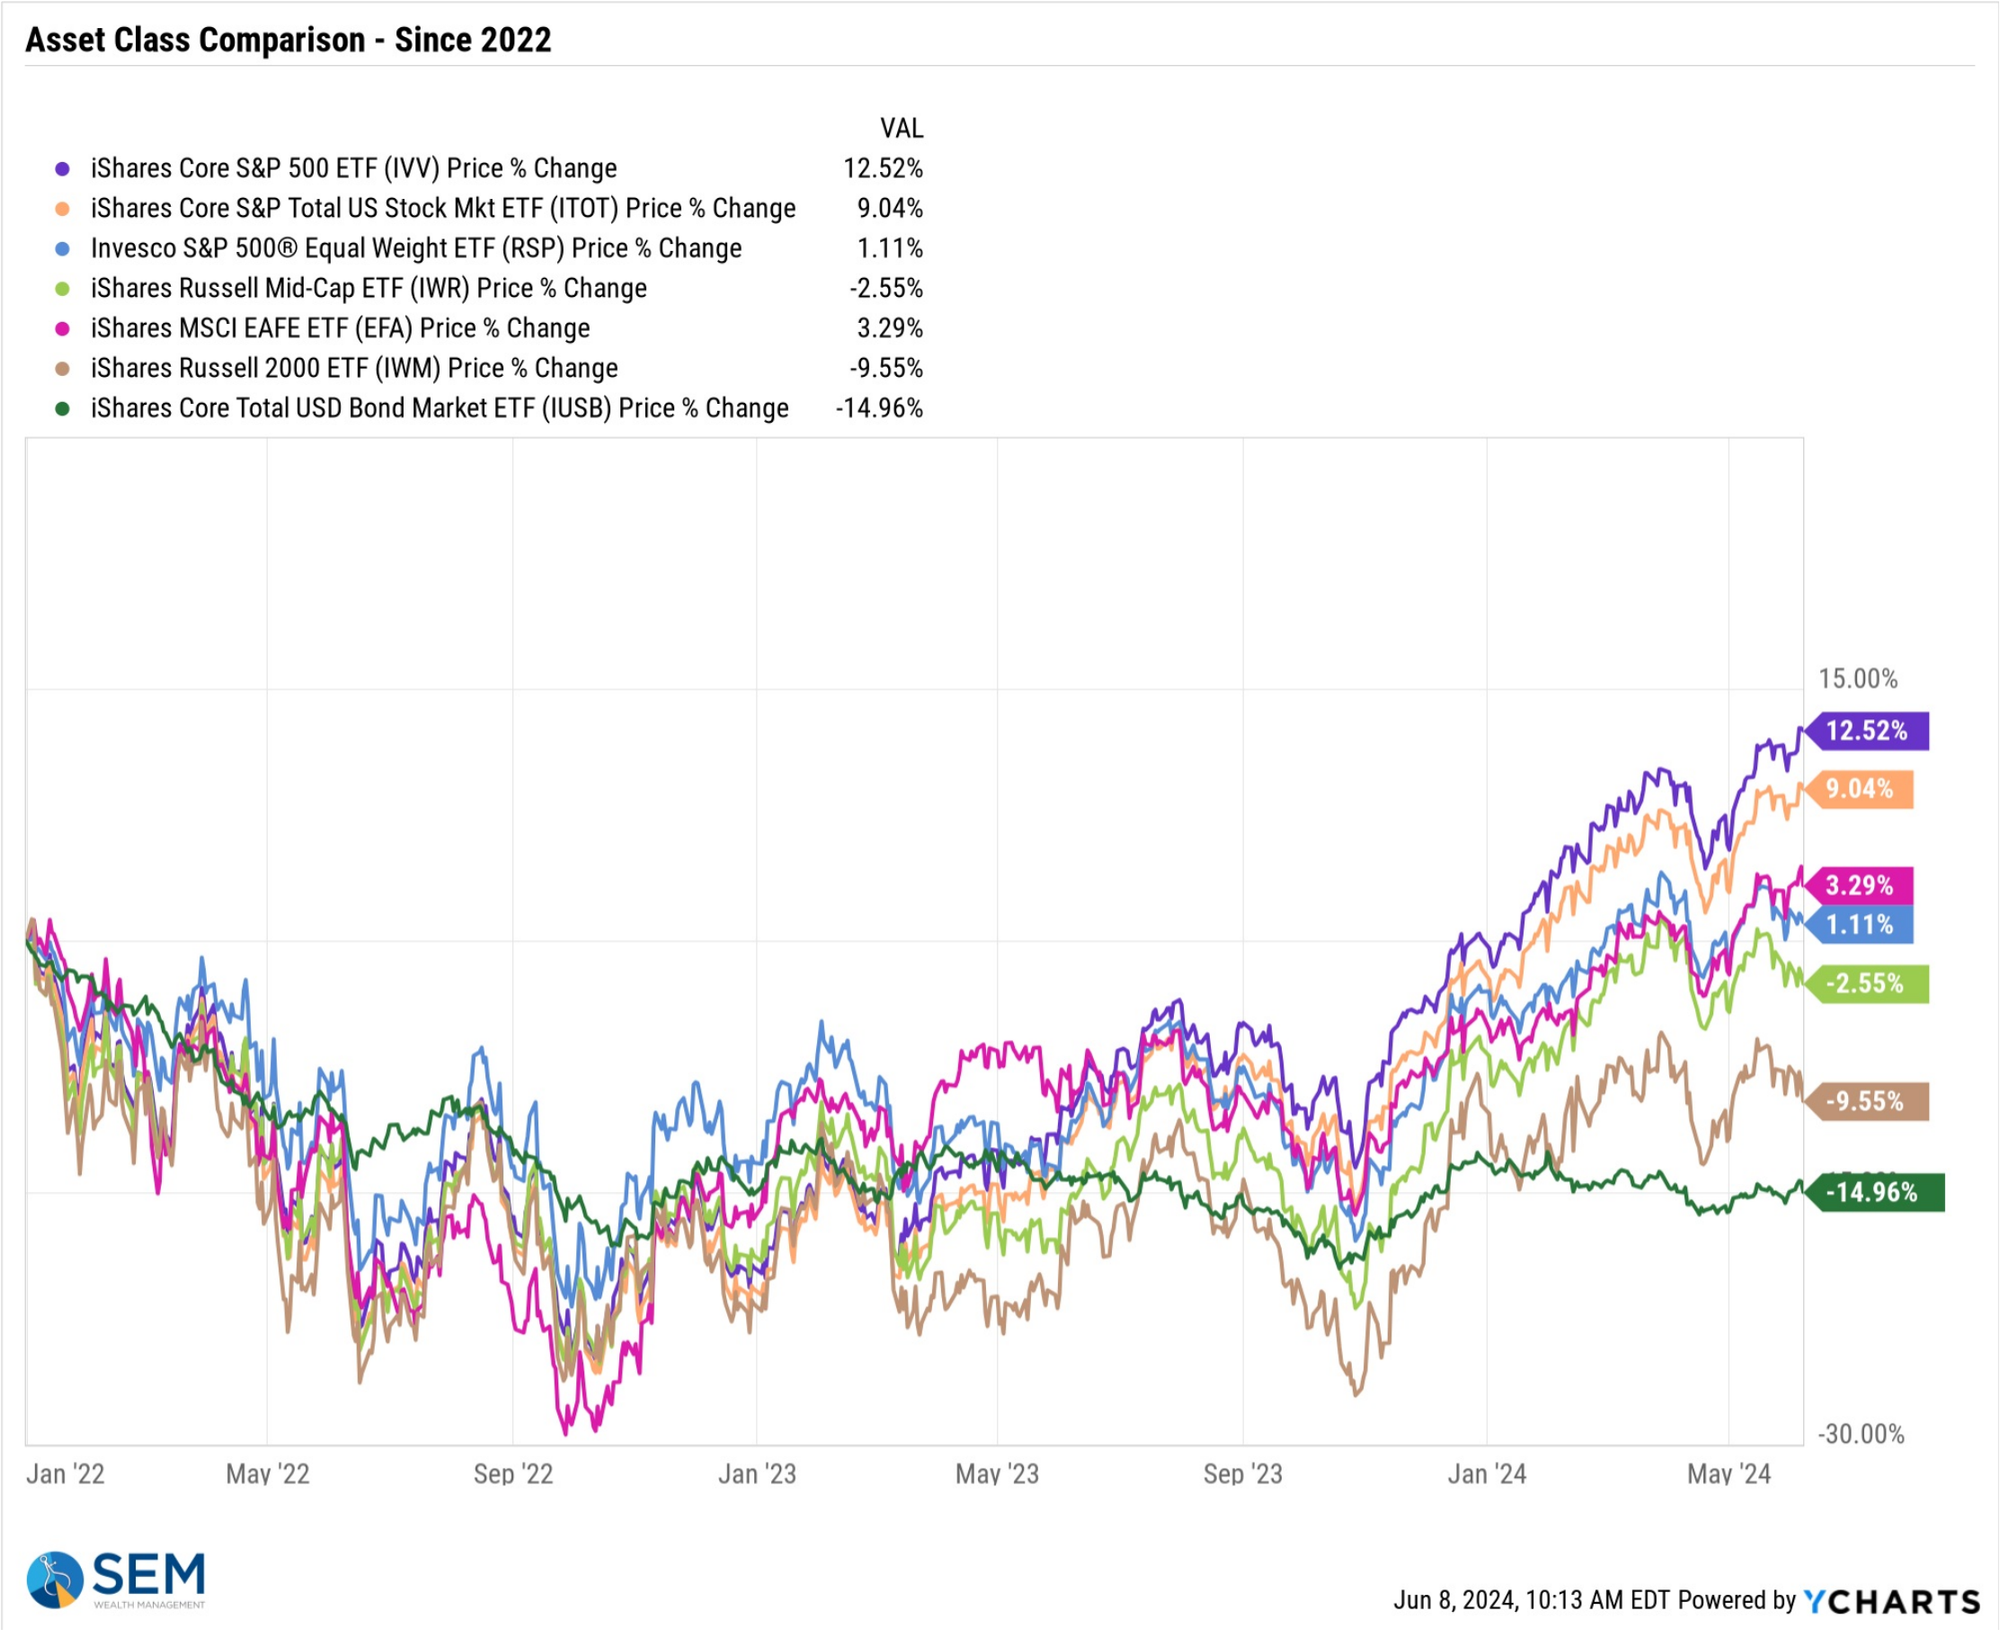
For the last 3 years any sort of diversification has 'hurt'. Small caps and bonds continue to be more than 10% below their highs while large caps continue to set records.
It is a normal human reaction to take the recent experience and believe that is how it will be for the foreseeable future. After a brief rally in bonds late last year, the weakness in the bond market has led to another mass outflow from the bond market in favor of 'guaranteed' instruments paying 4-5%.
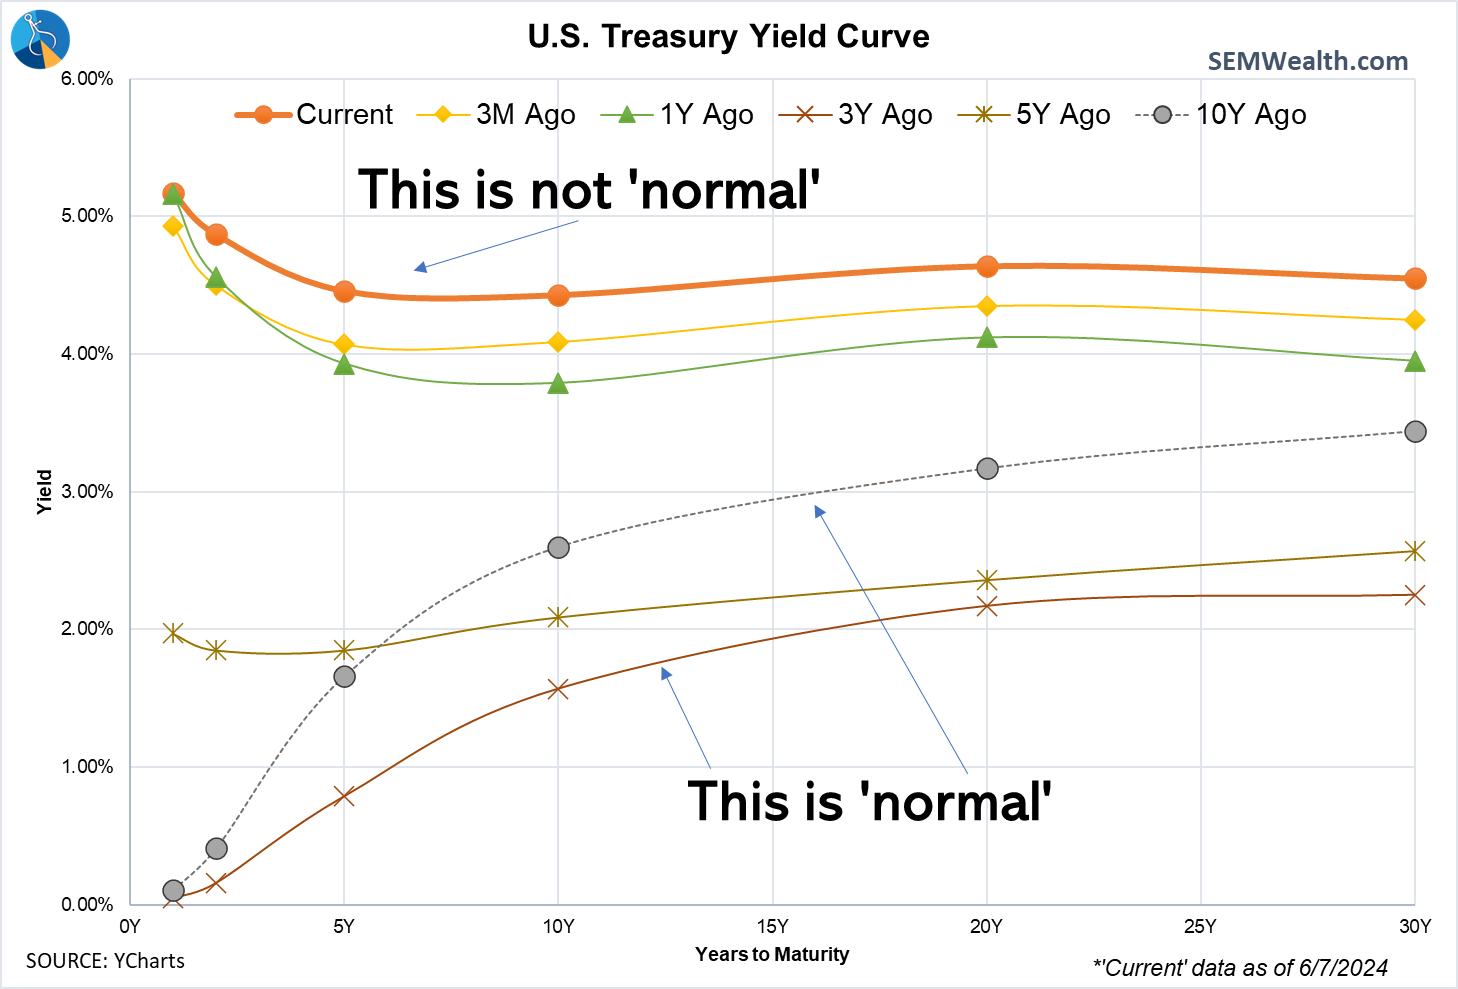
What people are missing is the current environment is not normal. Locking in these high short-term rates now could mean missing out on potentially large gains in 'conservative' investments. When short-term rates are higher than long-term rates we see abnormal things happening. It's important to keep this in perspective before making long-term decisions.
Last month I did a study for our advisors comparing CDs to Passive Management and to Active Management since 2000. If you'd like a copy, drop us a message.
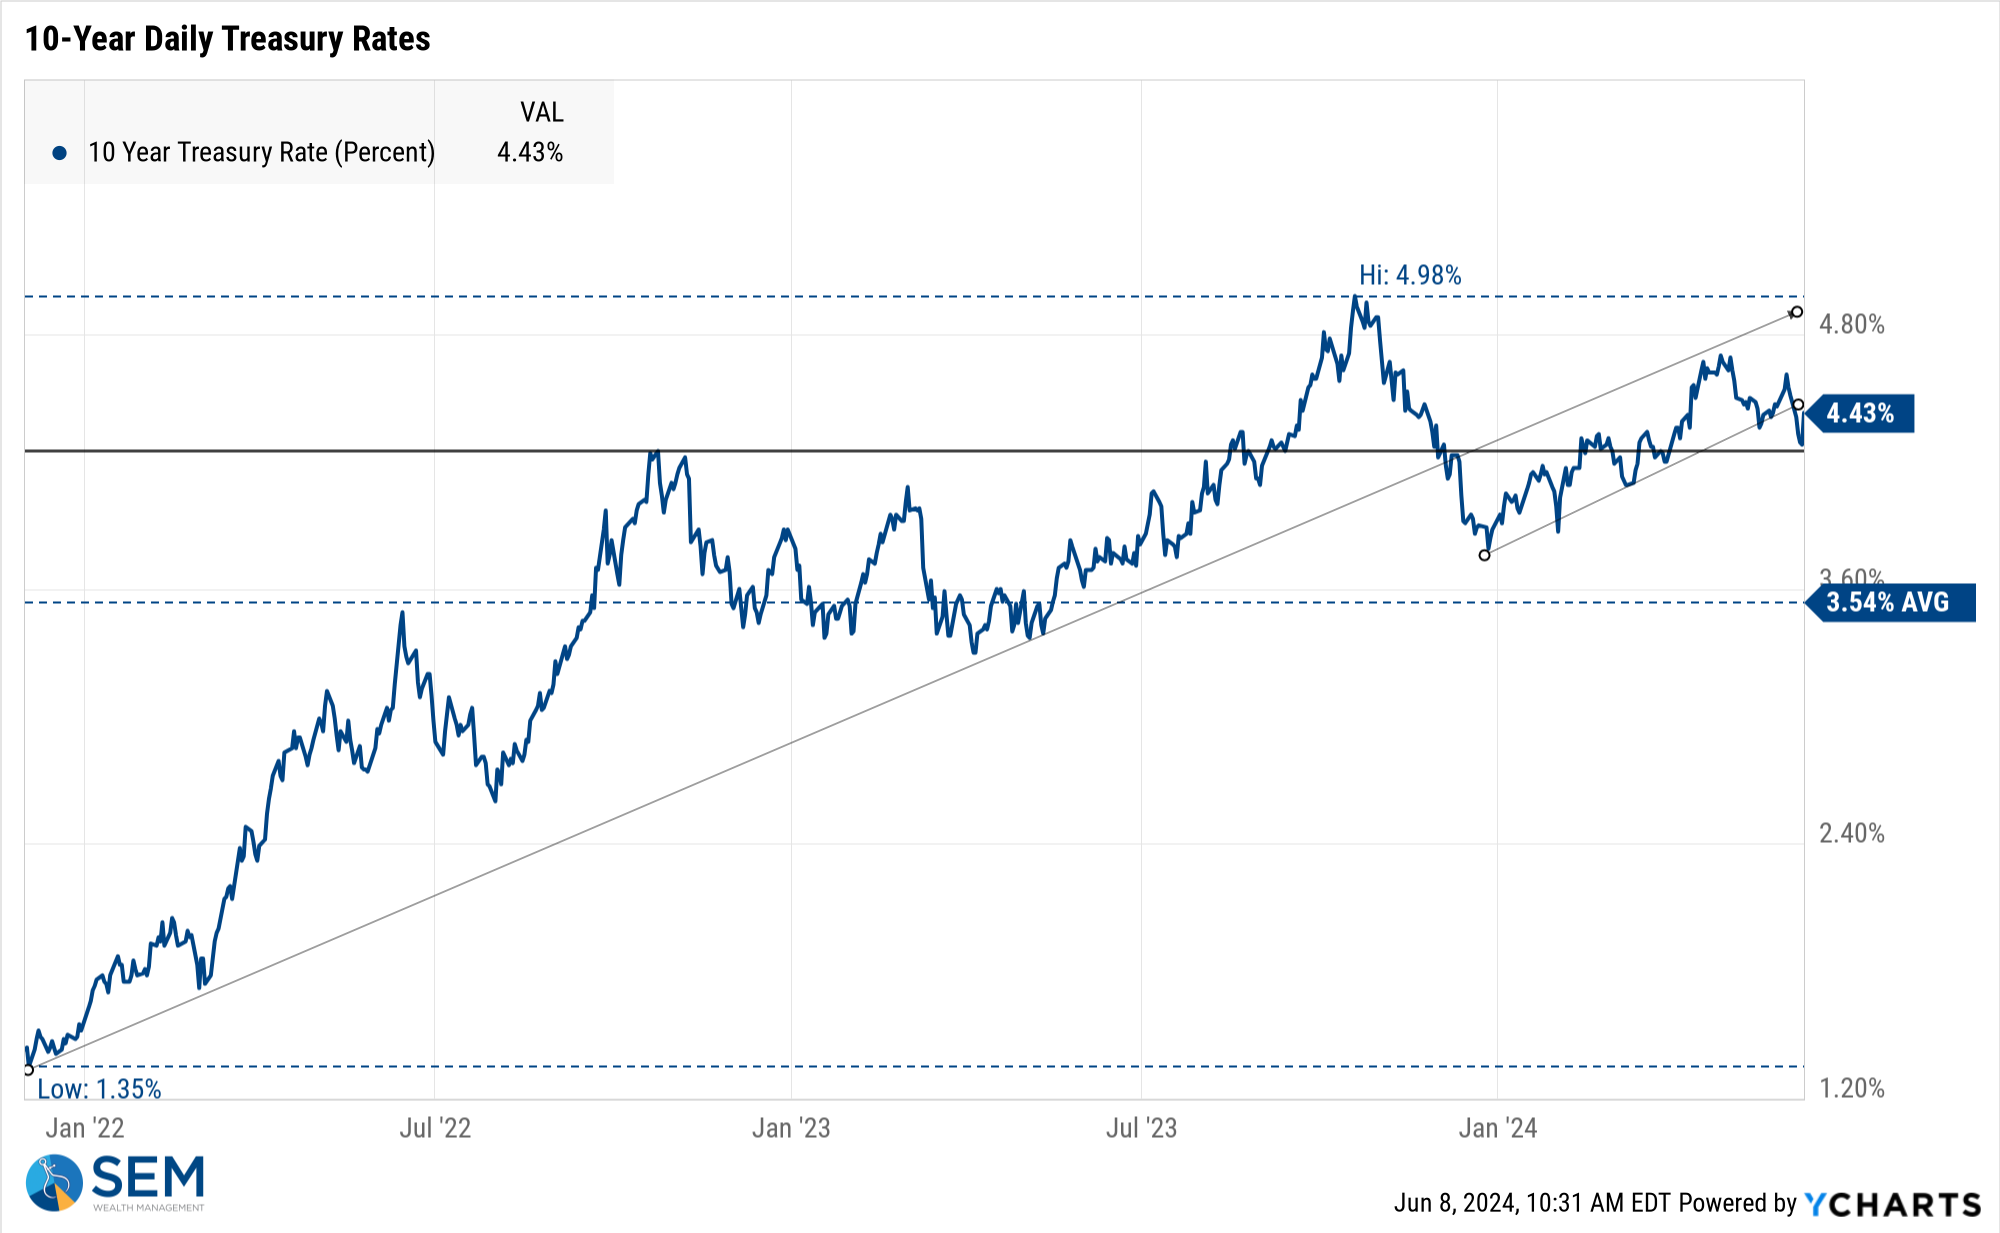
The good news from last week is 10-year yields broke out of the upward rising channel we've been stuck in for all of 2024. The 4.2-4.3% level seems to be a pivot point to watch.
SEM Model Positioning
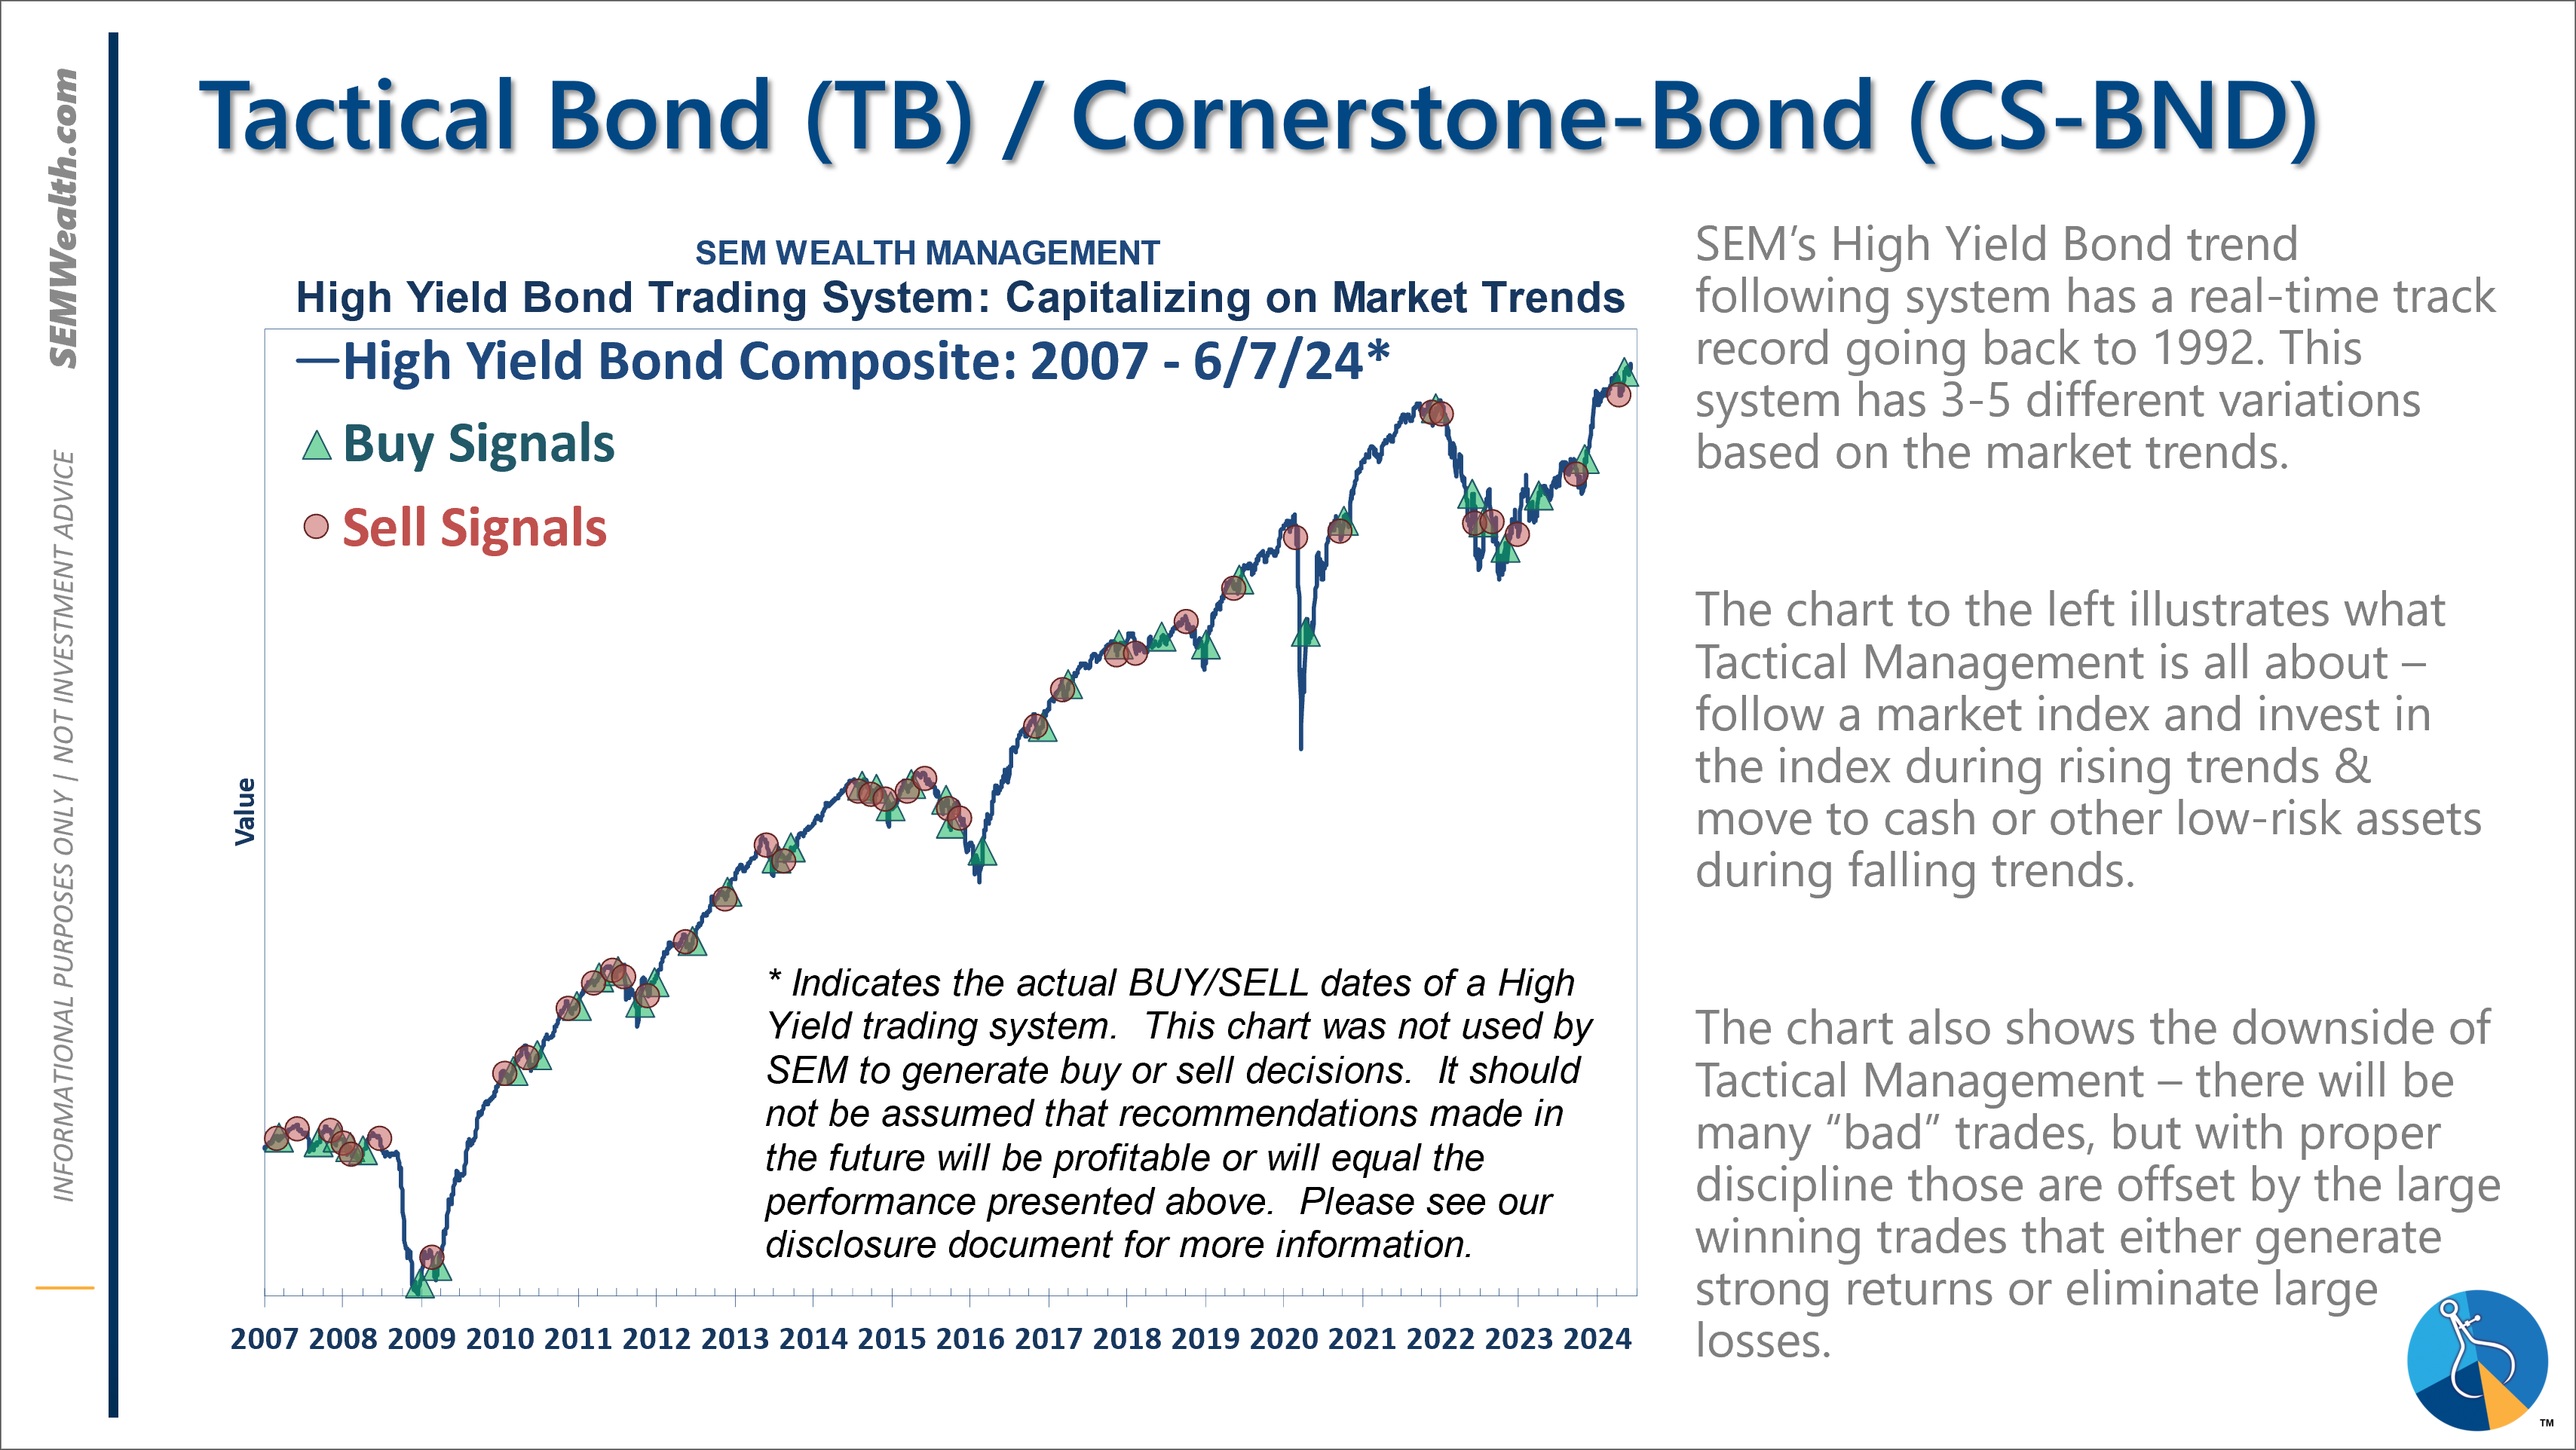
-Tactical High Yield had a partial buy signal on 5/6/24, reversing some of the sells on 4/16 & 17/2024 - the other portion of the signal remains on a sell as high yields continue to oscillate.
-*NEW* Dynamic Models are 'neutral' as of 6/7/24, reversing the half 'bearish' signal from 5/3/2024
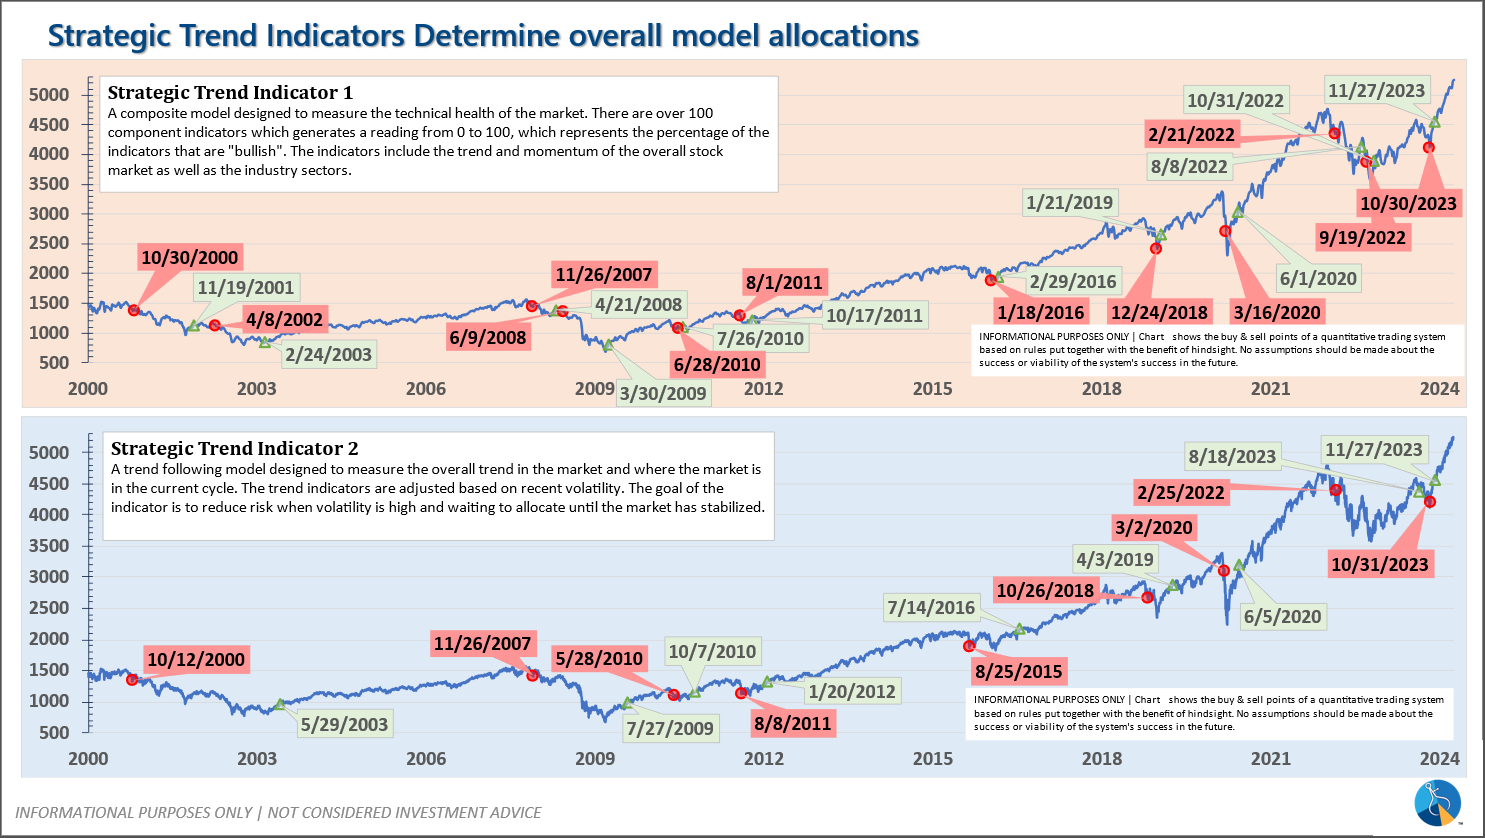
-Strategic Trend Models went on a buy 11/27/2023
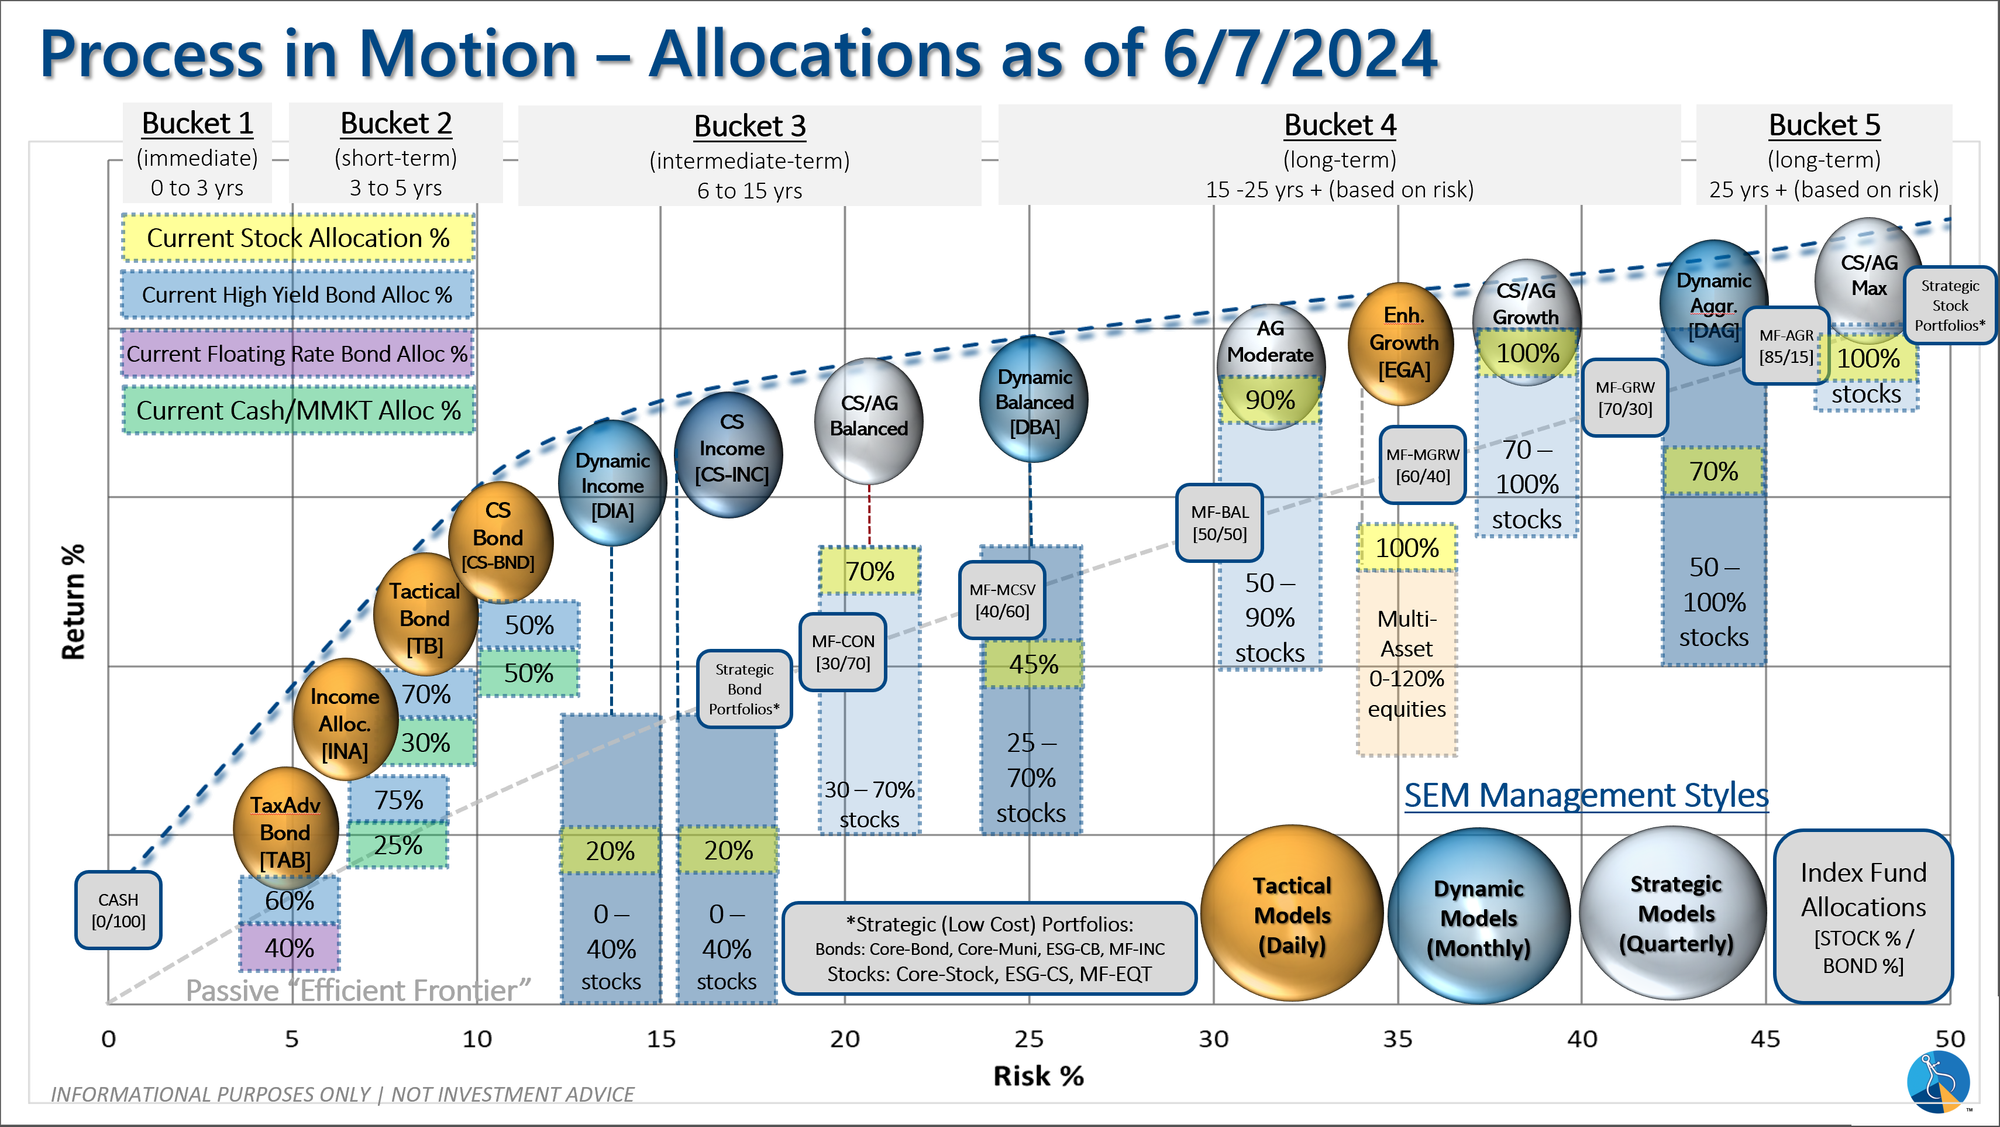
SEM deploys 3 distinct approaches – Tactical, Dynamic, and Strategic. These systems have been described as 'daily, monthly, quarterly' given how often they may make adjustments. Here is where they each stand.
Tactical (daily): On 5/6/24 about half of the signals in our high yield models switched to a buy. The other half remains in money market funds. The money market funds we are currently invested in are yielding between 4.8-5.3% annually.
Dynamic (monthly): The economic model was 'neutral' since February. In early May the model moved slightly negative, but reversed back to 'neutral' in June. This means 'benchmark' positions – 20% dividend stocks in Dynamic Income and 20% small cap stocks in Dynamic Aggressive Growth.
Strategic (quarterly)*:
BOTH Trend Systems reversed back to a buy on 11/27/2023
The core rotation is adjusted quarterly. On August 17 it rotated out of mid-cap growth and into small cap value. It also sold some large cap value to buy some large cap blend and growth. The large cap purchases were in actively managed funds with more diversification than the S&P 500 (banking on the market broadening out beyond the top 5-10 stocks.) On January 8 it rotated completely out of small cap value and mid-cap growth to purchase another broad (more diversified) large cap blend fund along with a Dividend Growth fund.
The * in quarterly is for the trend models. These models are watched daily but they trade infrequently based on readings of where each believe we are in the cycle. The trend systems can be susceptible to "whipsaws" as we saw with the recent sell and buy signals at the end of October and November. The goal of the systems is to miss major downturns in the market. Risks are high when the market has been stampeding higher as it has for most of 2023. This means sometimes selling too soon. As we saw with the recent trade, the systems can quickly reverse if they are wrong.
Overall, this is how our various models stack up based on the last allocation change: