
I hate talking politics, but we've been fielding a lot of questions about the debt ceiling and the chances of default. I've actually been avoiding writing about this because every time I think about it, my blood pressure skyrockets. The fact that we are back here AGAIN is a failure of leadership in BOTH parties. It is also a failure of voters to think beyond ideological talking points and actually look at the data. Most importantly voters need to think for themselves.
If you are an active member of either of the political parties, I will probably offend you. I apologize for that, but hope you will look at what the DATA and LOGIC says about the problems we are facing as Americans. This isn't one political parties fault. It's our own fault for allowing this to go on for so long.
I've written and spoken about this for over 15 years. The last time the threat of default due to not extending the debt ceiling was this high was back in 2011. Back then I wrote a weekly series called, "The Debt Ceiling Circus".
Like most sequel's this one is going to be much worse than the original. The animosity and distrust of the other side is palatable. I wouldn't be going out on a limb to say a large number of people on both sides would rather see the US default than to give any semblance of victory to the other side. In this situation Americans lose.
That said, my best guess from listening to Washington insiders the past week is Congress will push us to the edge (and probably over it briefly). The markets will respond with a huge sell-off and they will eventually do what they have to do -- agree to pay for the debt they helped create.
Like in 2011 (and all other financial events) if the market believes risks of calamity are increasing, our investment models are designed to take risk off the table. For more on our positioning and plans, scroll to the bottom.
The following discussion has nothing to do with how we manage money at SEM. It is simply a data driven approach to understanding the current situation which not only will likely cause problems for our investments the next few weeks (months if they decided to kick the can a bit further down the road), but also will weigh on the economy and thus the markets for the rest of this decade.
Please stop listening to the news media and especially do not believe what you hear from either side. The politicians are LYING to you and trying to scare you to vote for their side. Instead look at what the DATA is telling us.
BOTH parties are EQUALLY responsible for our debt. Since 2000 we've added over $25 Trillion to the $31 Trillion total. Think about that for a second. At the turn of the century, we had just $6 Trillion of debt.
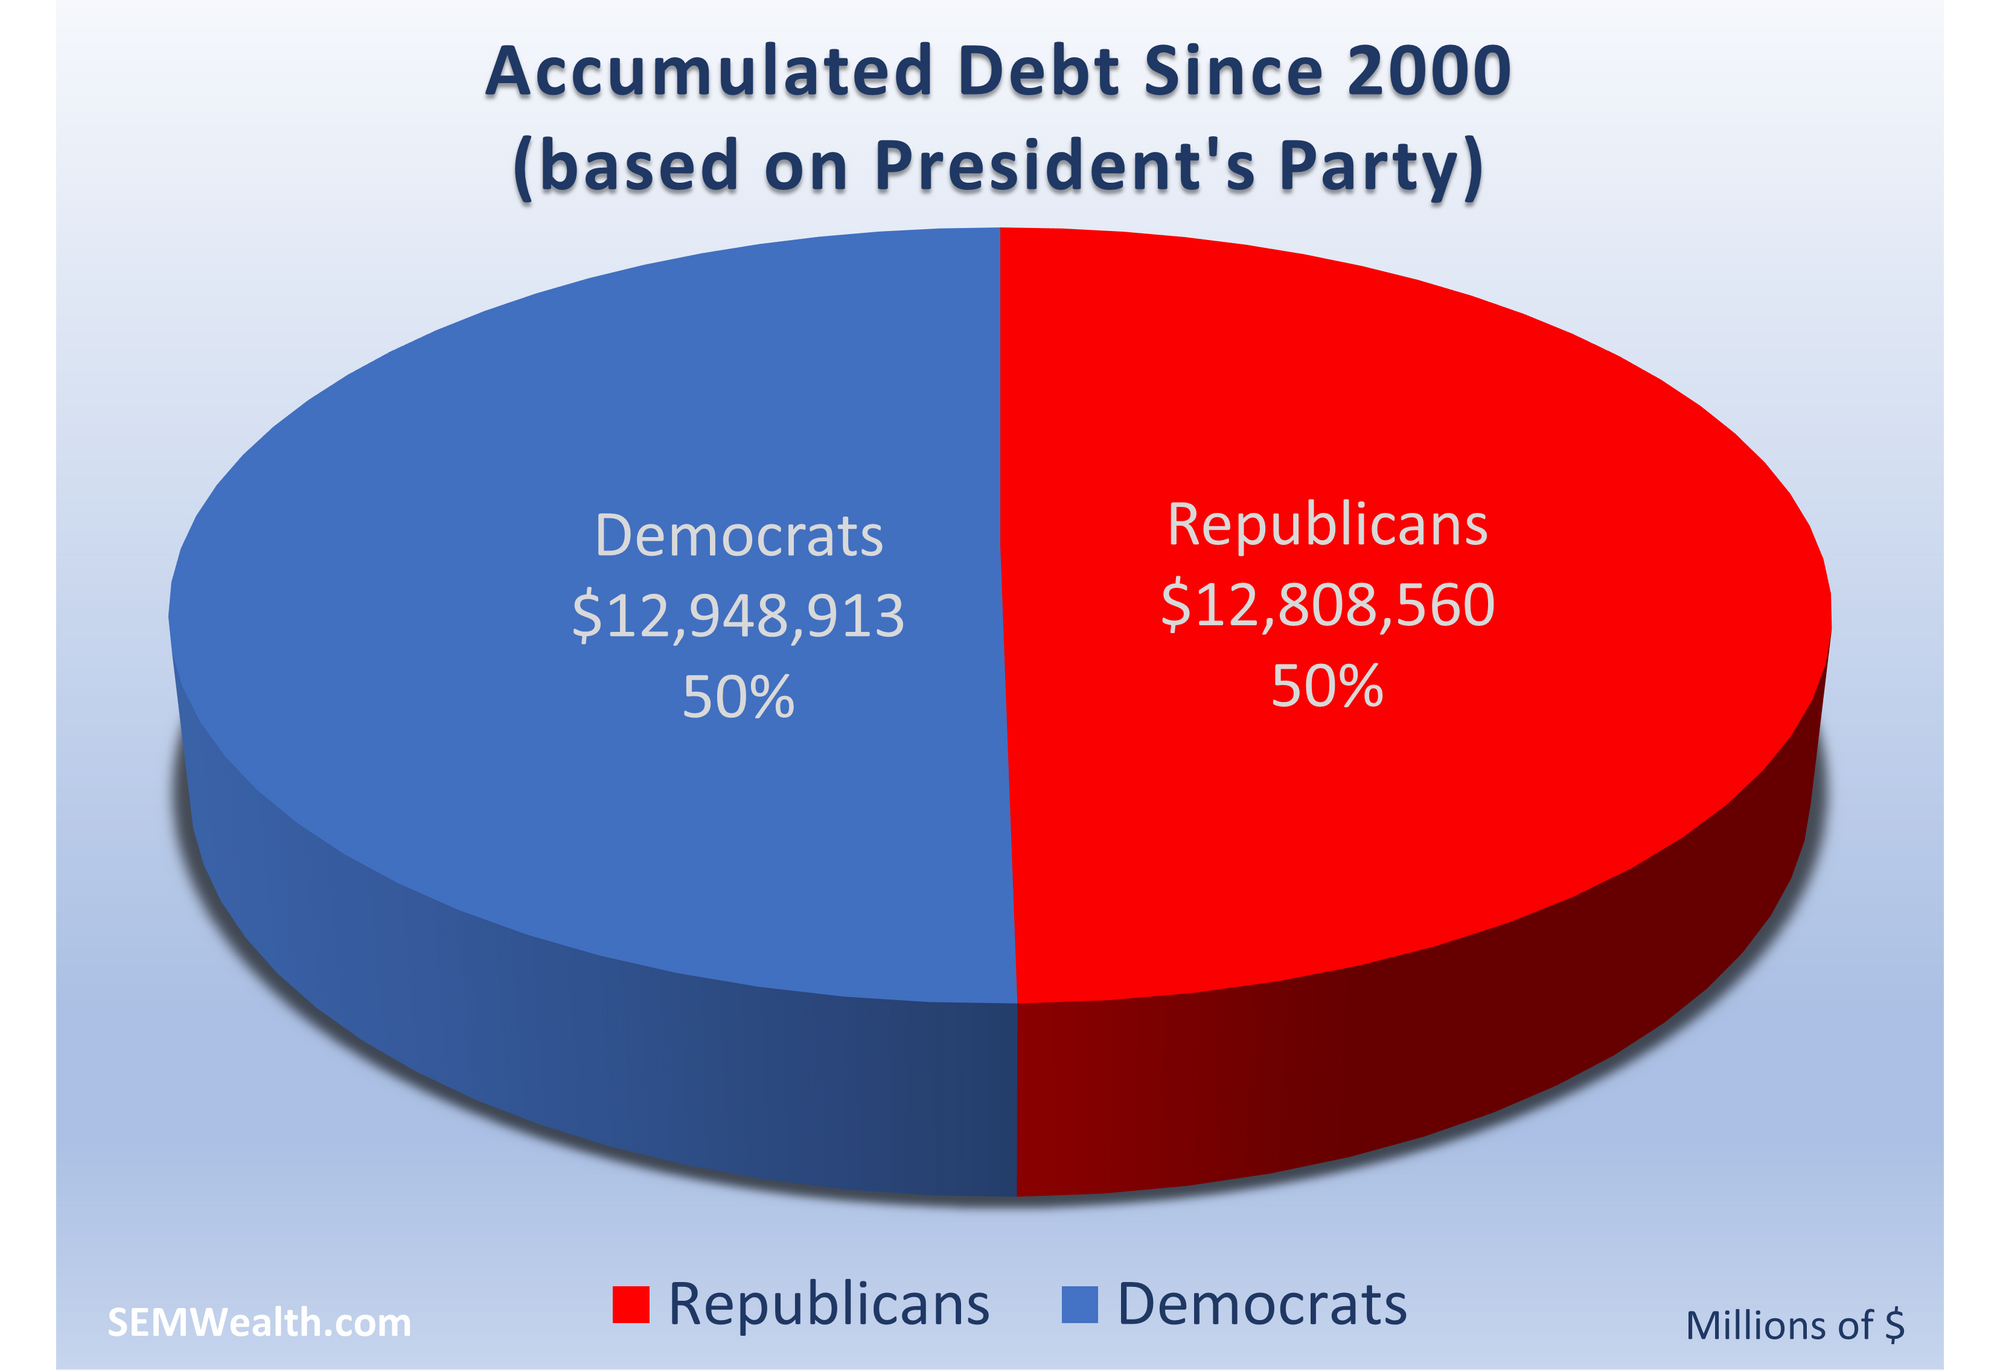
It might be easy to blame the other party, but the data doesn't support this. Trump and W Bush were just as responsible as Obama and Biden. Both sides have no problem raising the debt ceiling when their guy is in office, but suddenly take issue with it when the other guy has control.
Either you're fiscally responsible or you're not. The leadership from the Republicans is misleading Americans by trying to claim they are not responsible for this dire situation we are facing. Just as they did during Part I of this Circus, they are claiming they are the fiscally conservative party. Just as they were back then, they are lying.
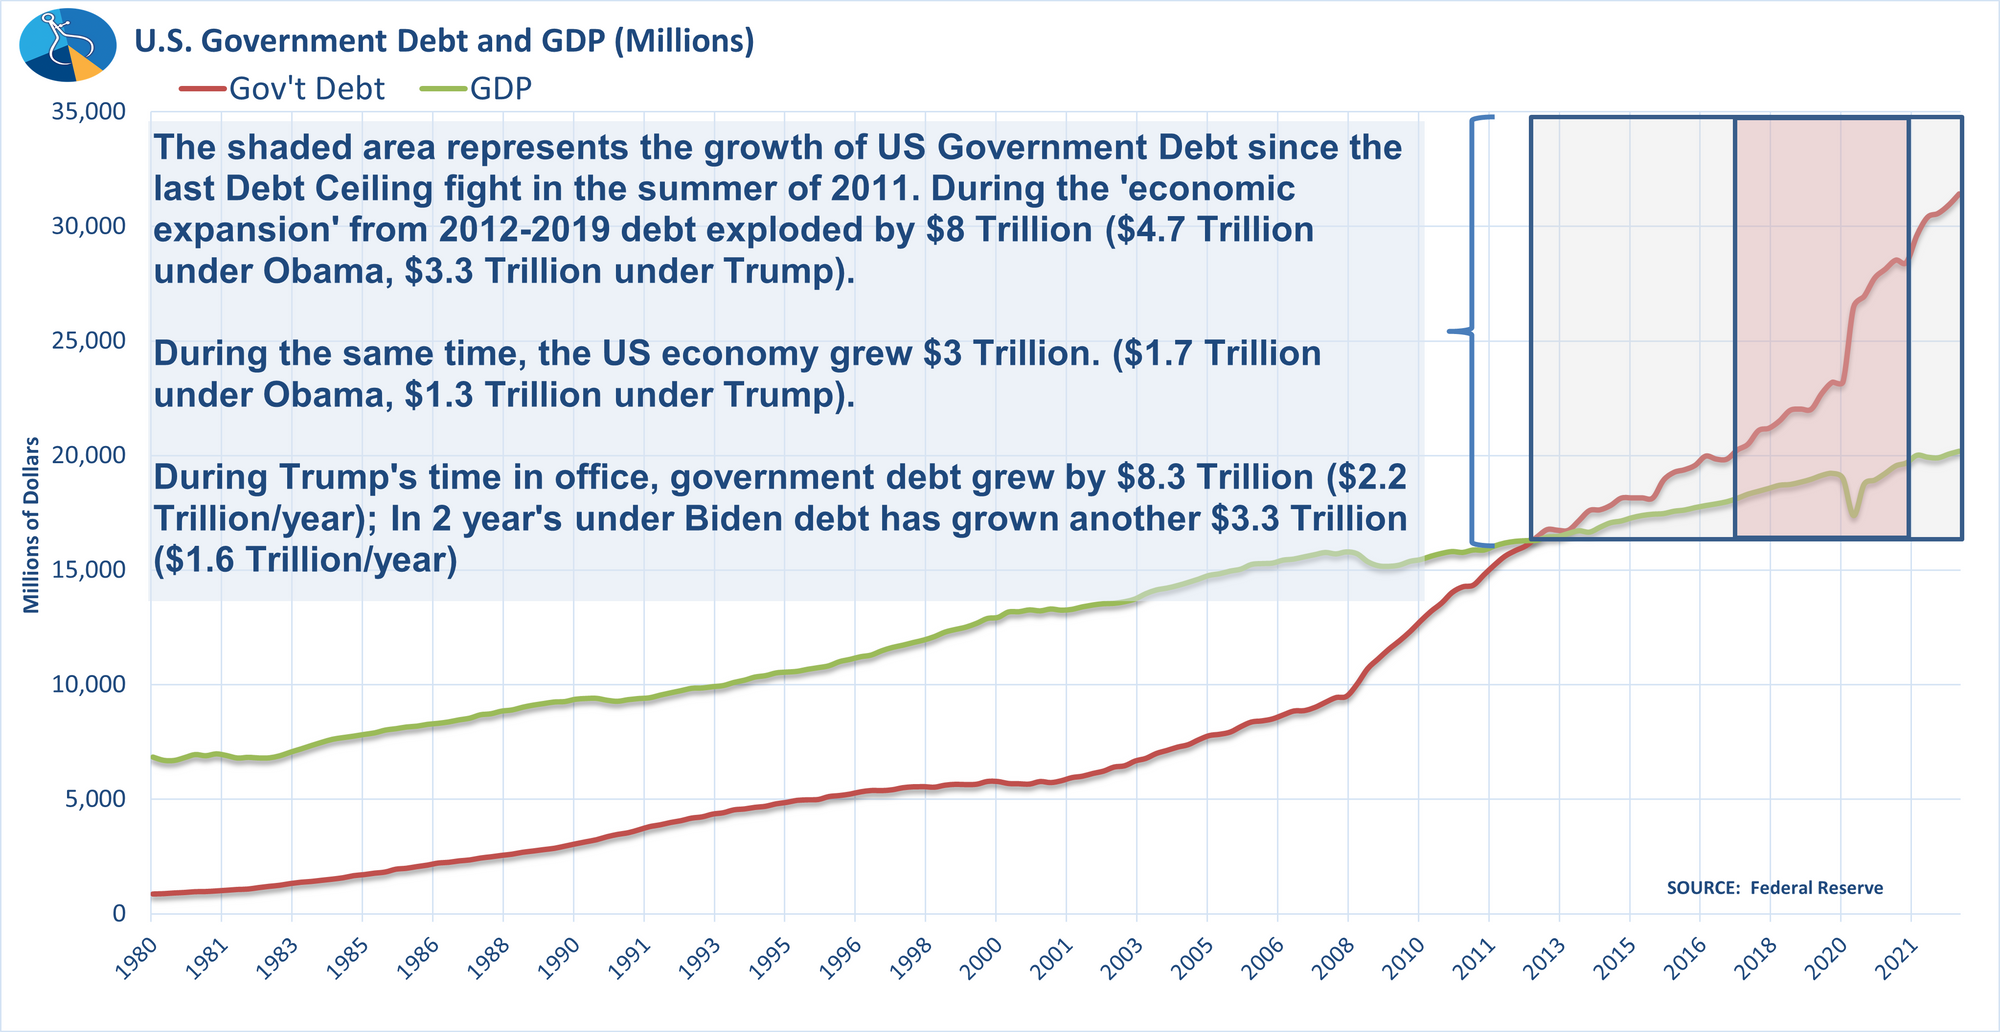
The national debt grew $8 Trillion under Trump, more debt than our country added from 1776-2000. Congress voted 3 times to raise the debt ceiling under Trump (after the Democrats own brinkmanship). Yes, Biden has added another $3.3 Trillion in 2 years, but if we continue that pace he would add $1.7 Trillion LESS debt than Trump.
Even if you give Trump a pass for the 2 rounds of COVID stimulus he signed, you can see the trajectory under Trump was just as bad as we saw under Obama.
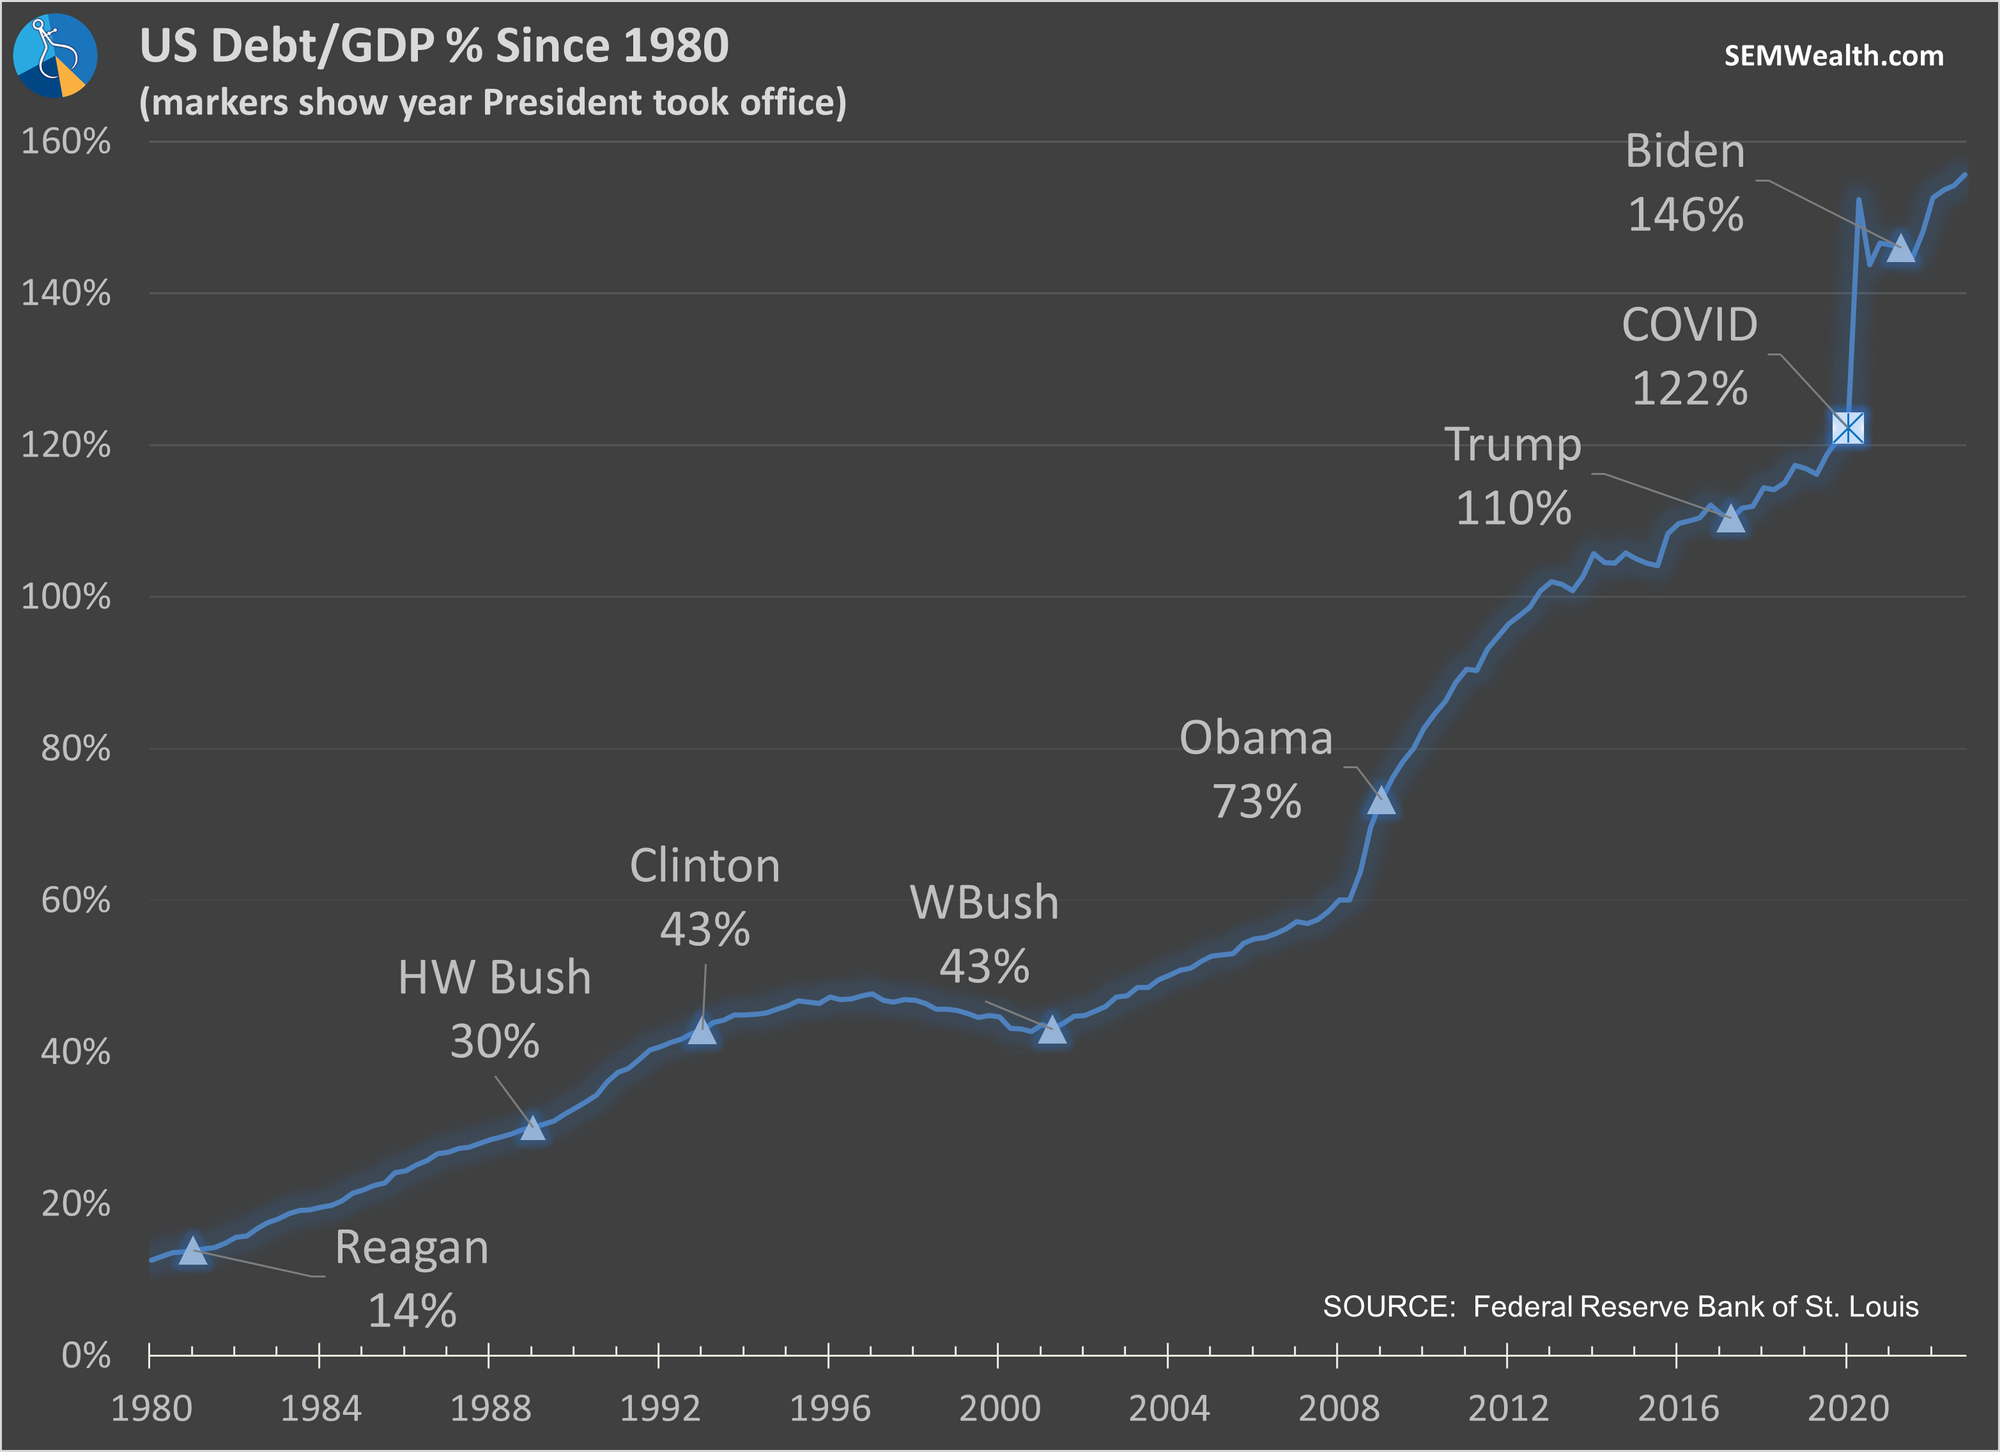
A friend of mine sent me this when looking at the above chart:
We should look at the average change in debt/GDP per year:
- Reagan: 16%/8 years = 2%
- HW Bush: 13%/4 years = 3.25%
- Clinton: 0%/8 years = 0%
- W Bush: 30%/8 years = 3.75%
- Obama: 37%/8 years = 4.625%
- Trump: 36%/4 years = 9% (about 4% ex-COVID)
- Biden: 10%/2 years = 5% (about 3% without the last COVID stimulus)
Republican average per year of presidency:
- 86%/24 years = 3.58% (62%/23 years = 2.7% ex-COVID)
Democrat average per year of presidency:
- 37%/16 years = 2.31%
So tossing COVID for the Republicans and still including it for the Democrats the Republicans have increased debt/GDP at a FASTER rate than the Democrats.
Annualizing the data really tells the story of economic policies. Warning! The data does not support the ideological talking points you see on social media and television.
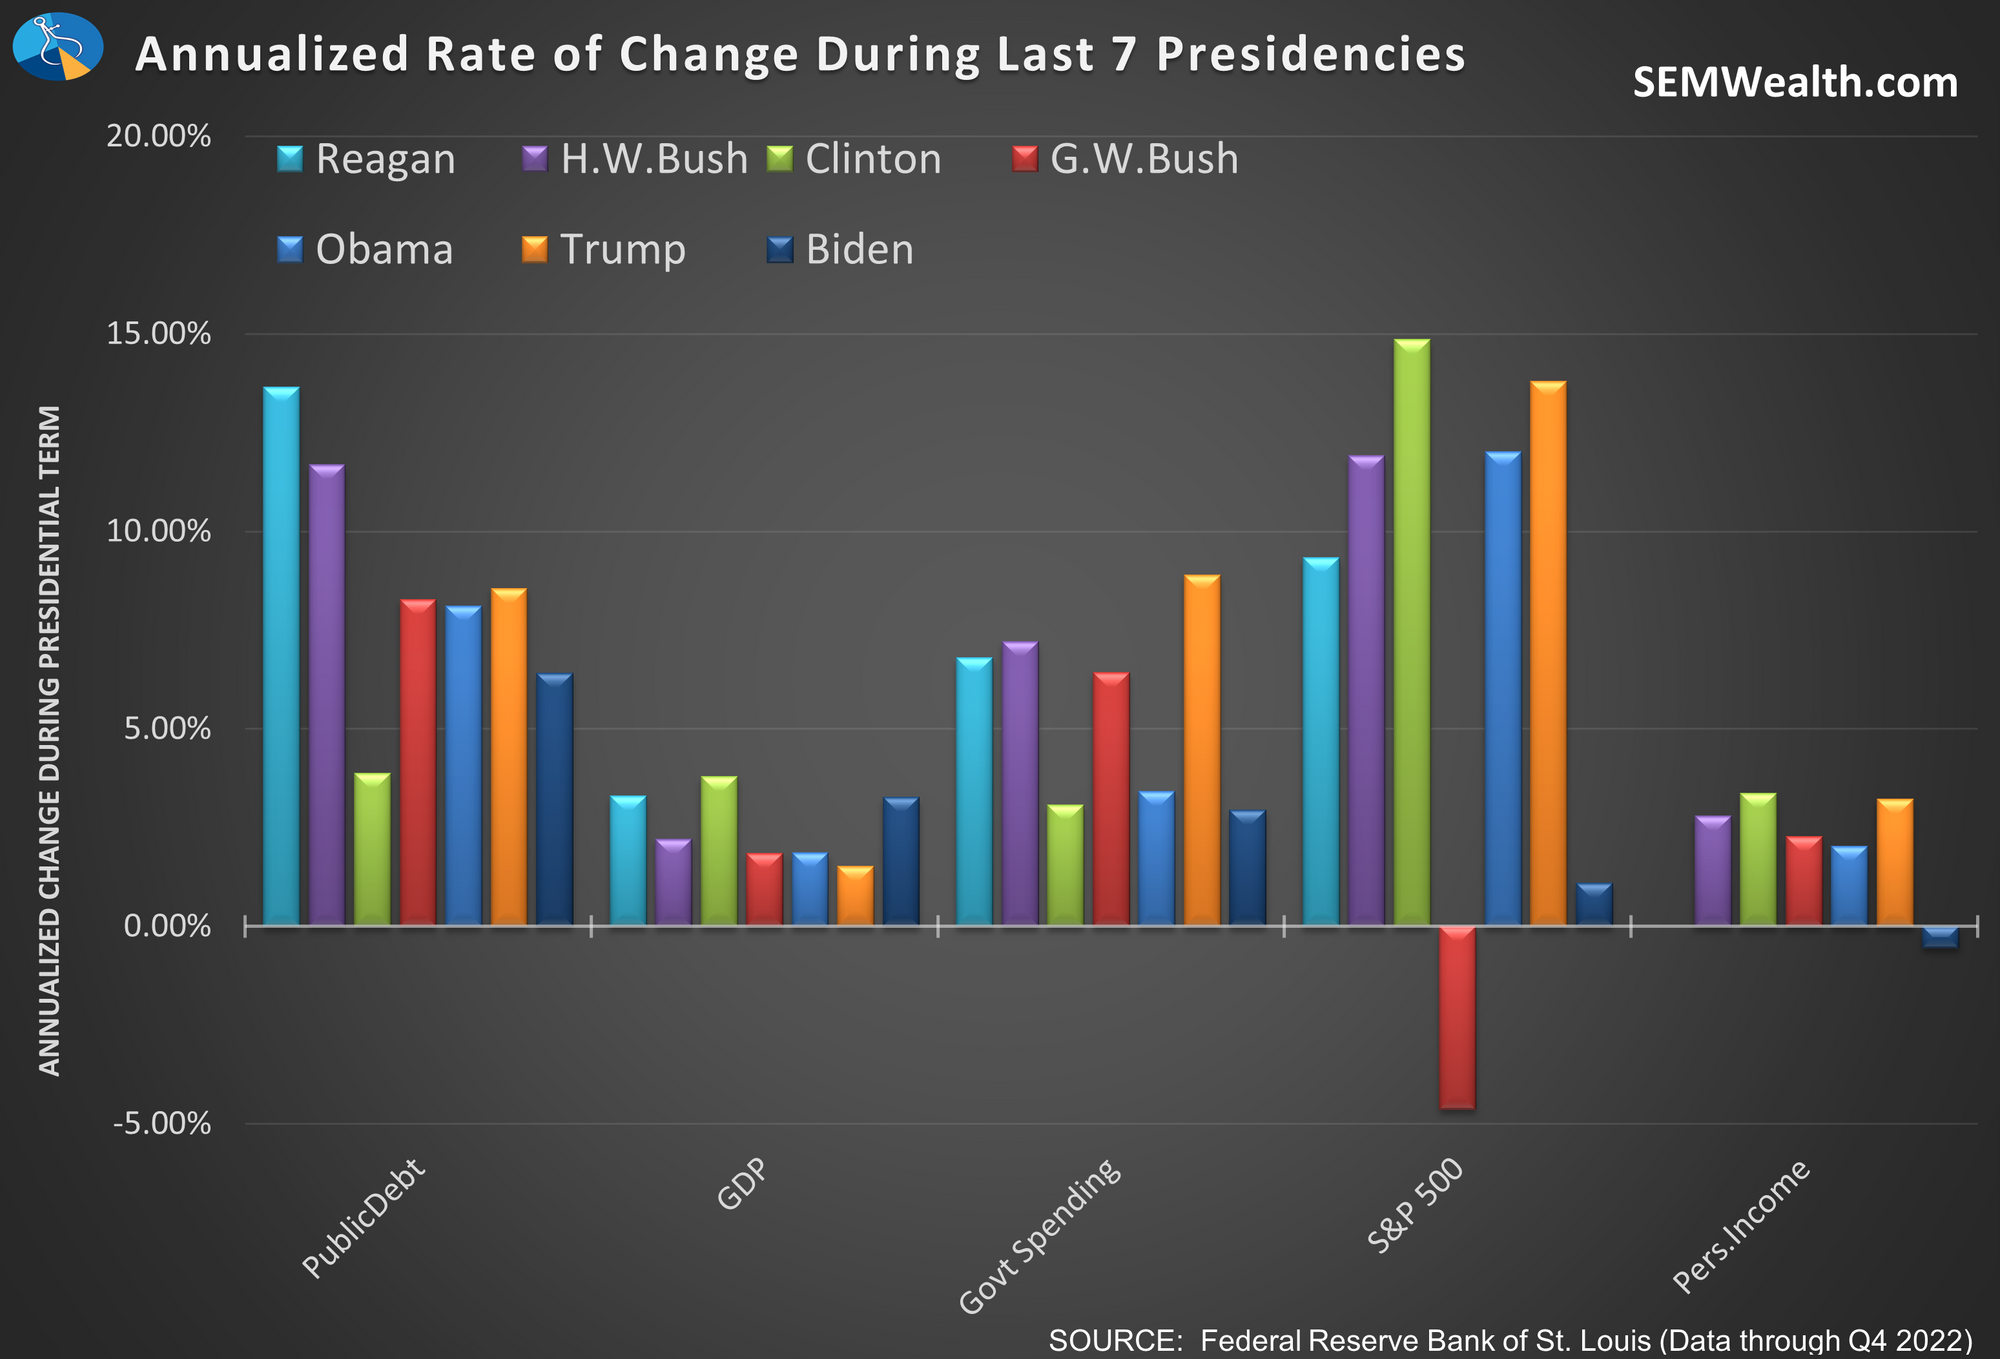
Trump increased government debt at a pace higher than any president since H.W. Bush. Regan was actually the worst in % terms. The average growth rate of the economy was WORST under Trump. Government Spending? Trump increased it faster than any President the last 40 years. To be fair, if you exclude COVID, GDP grew just slightly lower than it did under Obama and government spending was running about the same as it was under Obama before COVID.
An interesting sidenote, the presidents who increased government spending the most under their terms were Republicans. The 3 lowest % increases have been Biden, Clinton, and Obama.
Again – I'm not endorsing EITHER side, I'm just tired of the Republicans claiming they have the moral high ground when it comes to fiscal discipline. The data tells us the opposite.
It's idiotic for the Republicans to not raise the debt ceiling for the simple fact Trump added $8.3 Trillion in debt in just 4 years, a pace even Biden will not exceed. We have to pay interest on Trump's debt (and all the other past President's from BOTH parties). We have to pay for the tax cuts that didn't pay for themselves (which is why he ran such a big deficit even before COVID). We have to pay for all the deficit spending they have passed. We have to pay our bills because it's the right thing to do.
(And this doesn't include the ticking time bomb that is Social Security and Medicare, which Trump and Biden have both sworn to not touch).
None of this commentary means I believe we shouldn't figure out a way to stop deficit spending, but neither side is willing to actually address our spending problem. If you ignore Social Security and Medicare, the gap, while still large, is not as bad as you'd think.
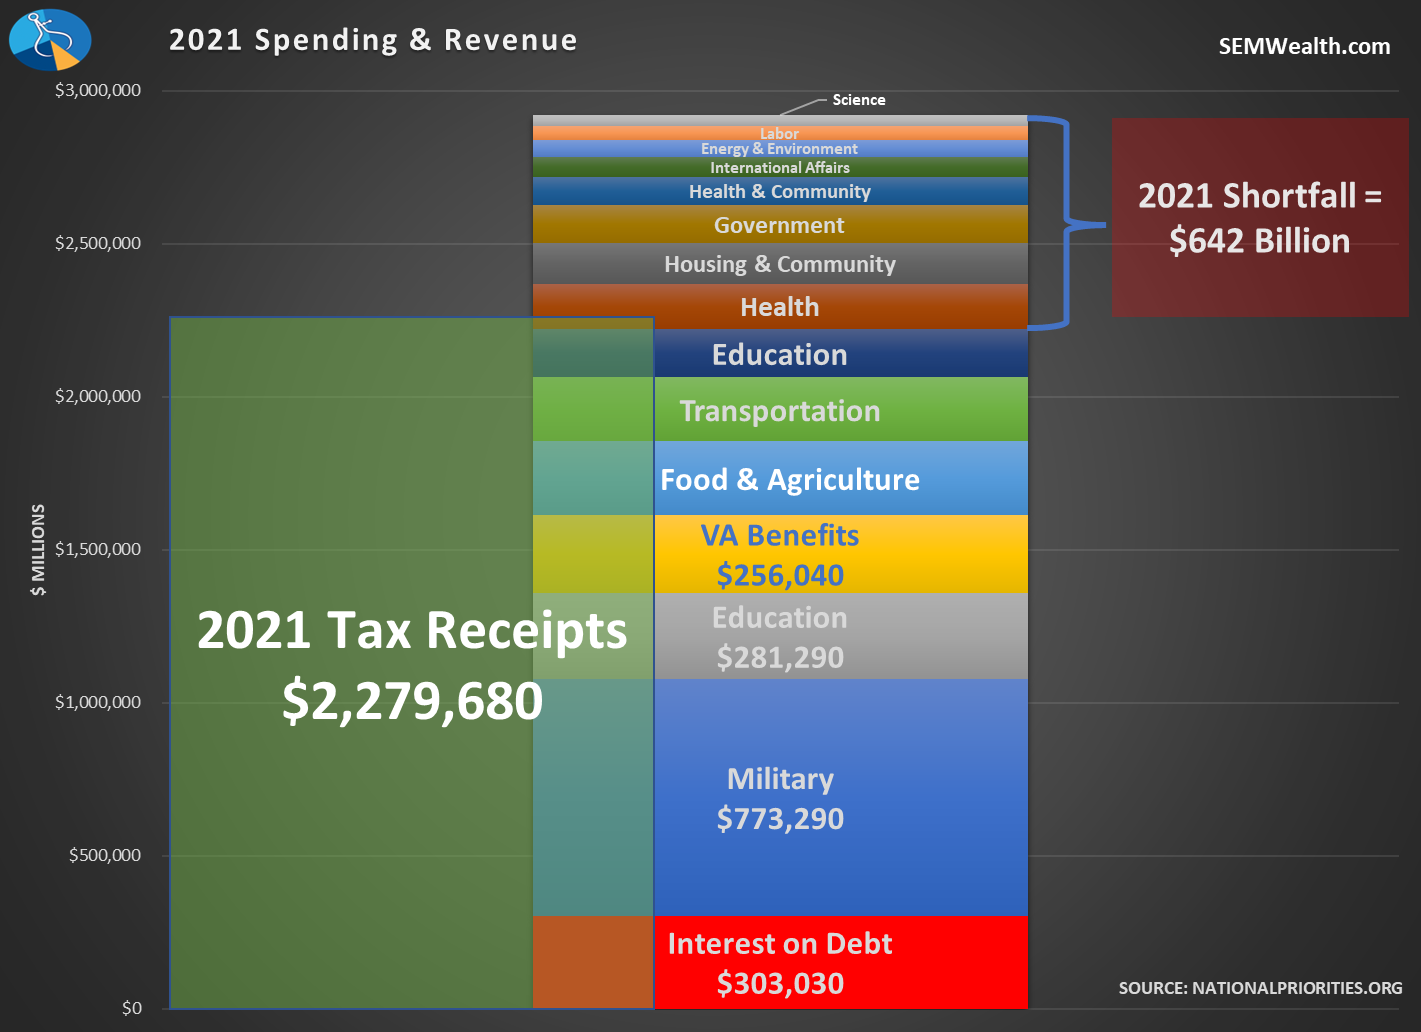
The biggest problem, which is going to get significantly worse is INTEREST. 47% of our budget deficit is due to INTEREST EXPENSES on our DEBT! This is debt, as shown earlier was equally accumulated by BOTH parties.
The gaping hole in our budget comes from two sources – Social Security and Medicare:
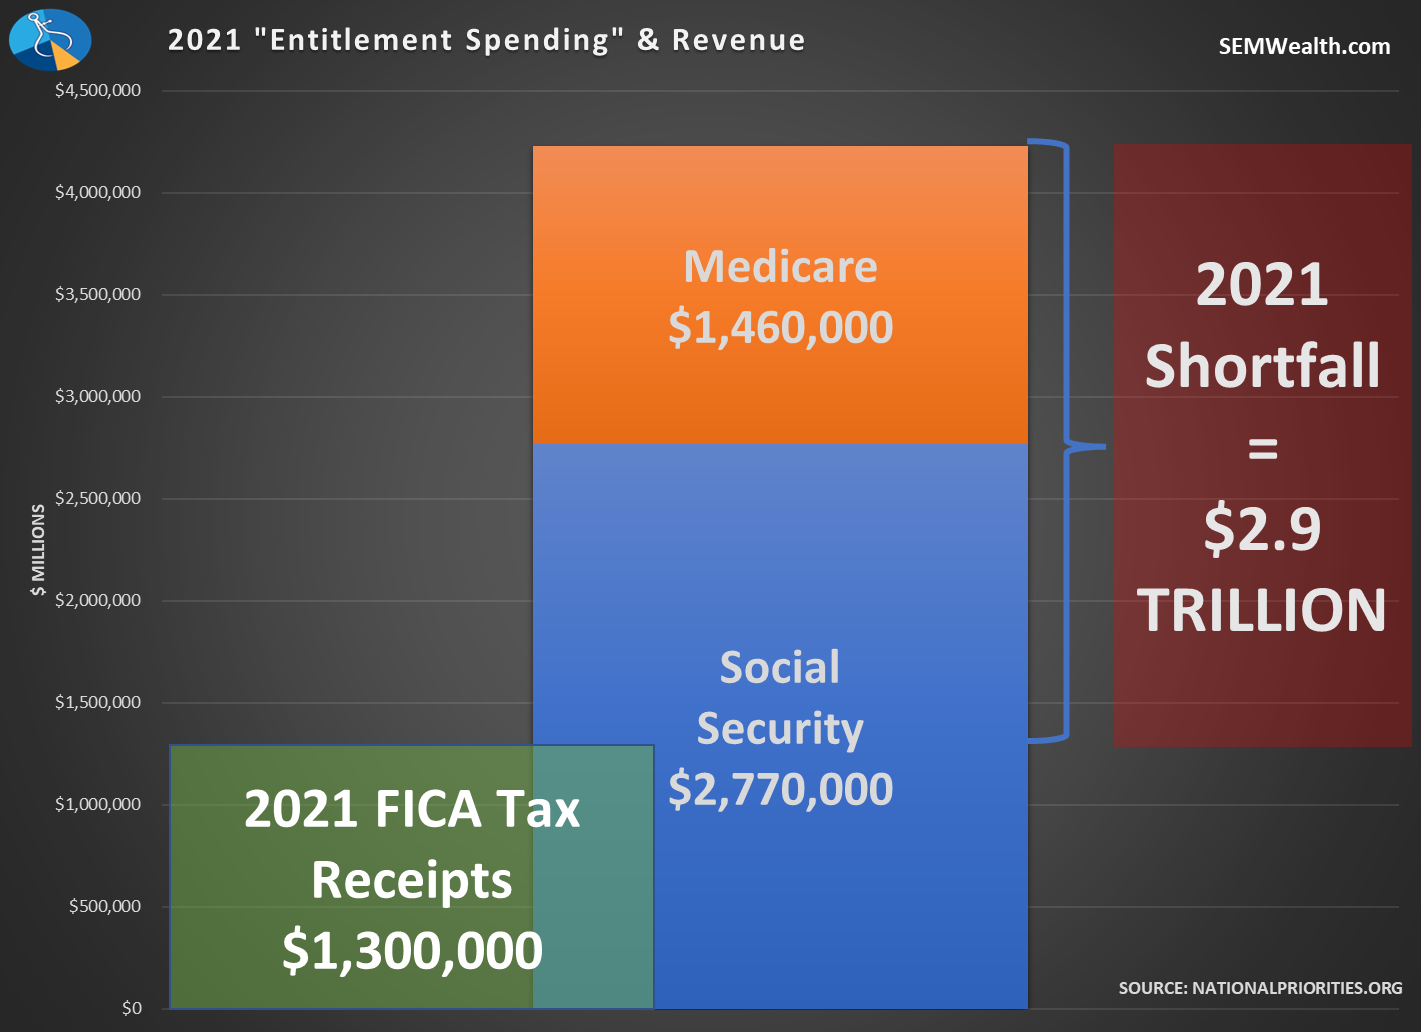
As you can see, the receipts (FICA Taxes) are nowhere near enough to cover what we are paying out. But wait, we collected money for all these years and held them in a "trust fund" so it would be there when it was time to pay benefits. Sadly, that is not what happened. Yes there is technically a "trust fund", but in the early 1980s, changes to the Social Security Act allowed the government to borrow money from the Social Security Trust fund if the government ran a deficit. This allowed the government to not have to borrow as much from the public.
The problem now, as shown in the chart above, is we have to borrow from the public in order to pay back the trust fund. Another way to put it, all of the deficit spending under Reagan, Bush I & II, Clinton, Obama, Trump, and Biden is now coming due. We have to raise the debt ceiling in order to pay back the money borrowed from Social Security!
Let's forget the fact that Social Security has never been able to pay for itself. I wrote about this back in 2021. Today's recipients are not just getting back "what they paid it", but 3-5 times MORE than they ever contributed. I wrote about this back in 2021. It's only gotten worse.

So let's pretend both parties are concerned about our deficit, the overall level of debt, and what it is doing to the chances of future generations being able to prosper. Take a look at this chart and tell me where the problem is:
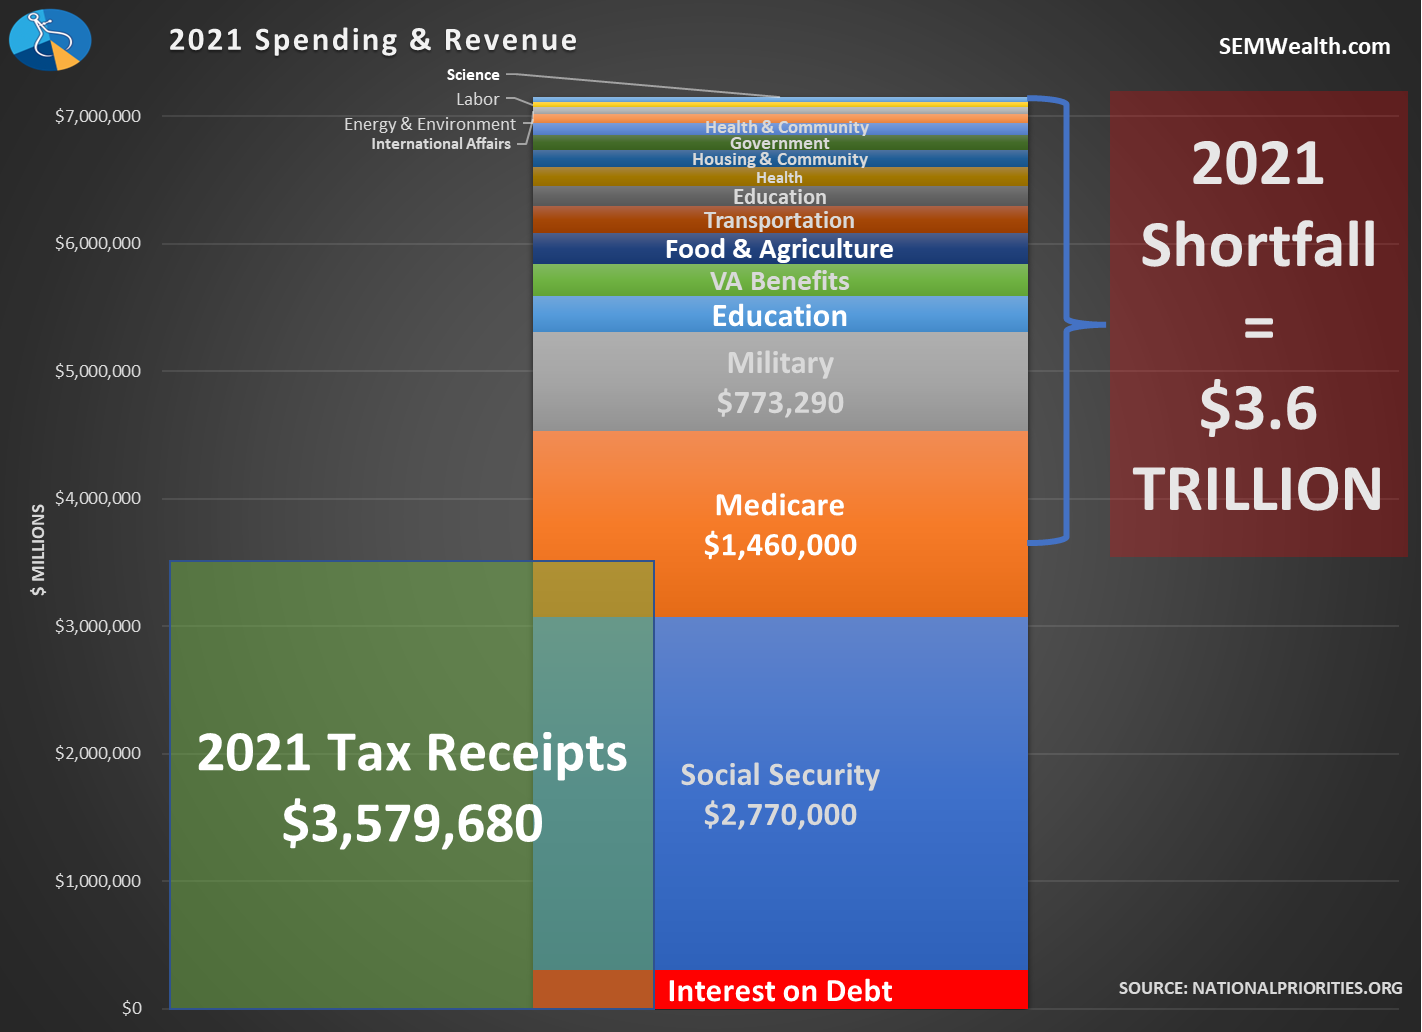
Both Biden and Trump have said Social Security and Medicare are 'off the table', yet it is literally impossible to do anything meaningful to cure our debt problem without MAJOR reforms to these programs. Interest expenses are only going to go up. We are only bringing in enough revenue to cover interest, Social Security, and 34% of Medicare spending.
Put another way, we could cut EVERY spending category other than Social Security and Medicare and not balance the budget. Cutting 'wasteful' spending doesn't matter in the whole scheme of things. The analogy I used during Part I back in 2011 was this:
Imagine your client was trying to figure out how to come up with enough money to pay their $3000 mortgage payment. They spent weeks deliberating ways to come up with the money and came back to you and said, "after much debate, we've decided to cut our $15 Netflix subscription."
That's what we're doing right now — we are fighting over pennies when the bank is ready to foreclose.
If you've read this far, I hope you can see my heart. I'm a registered Independent because I believe in a country as diverse as ours, good ideas can come from BOTH sides. This is an American problem that I believe we can solve, but not if we constantly blame the opposite side for everything and believe we have the only answers.
Stay tuned. The Debt Ceiling Circus Part II is far from over.
SEM Market Positioning
There were no changes last week in any of our models. We remain mostly invested in high yield bonds in Tactical Bond, Income Allocator, and Cornerstone Bond. We remain "bearish" in the Dynamic models (reduced risk exposure based on our economic model), and right in between minimum and maximum exposure in our 'strategic' models. This chart summarizes where we are:
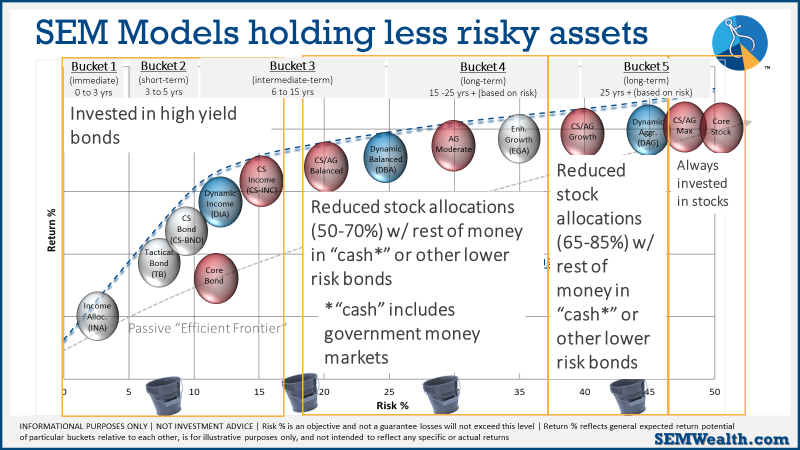
As always, our models will change if the environment changes. For now, calculated, short-term risks are acceptable with the knowledge things could change quickly.
While we expect Part II of the Circus to be more volatile than the first version, our models are designed to monitor the overall TRENDS. If Wall Street gets concerned, they will tell their largest clients and we will see trends change in the market. Regardless of the reason, we only care about where the money is flowing (both in and out).
That said, we will be watching more closely than usual the underlying holdings in our funds to make sure they are not taking on abnormal risks. We will keep you posted if anything changes in our positions.
I feel as if I should close with my primary piece of advise during times like this:
Do not let your political beliefs influence your investment decisions. The markets (and economy) do not always react the way you think they will based on the ideological talking points.


