
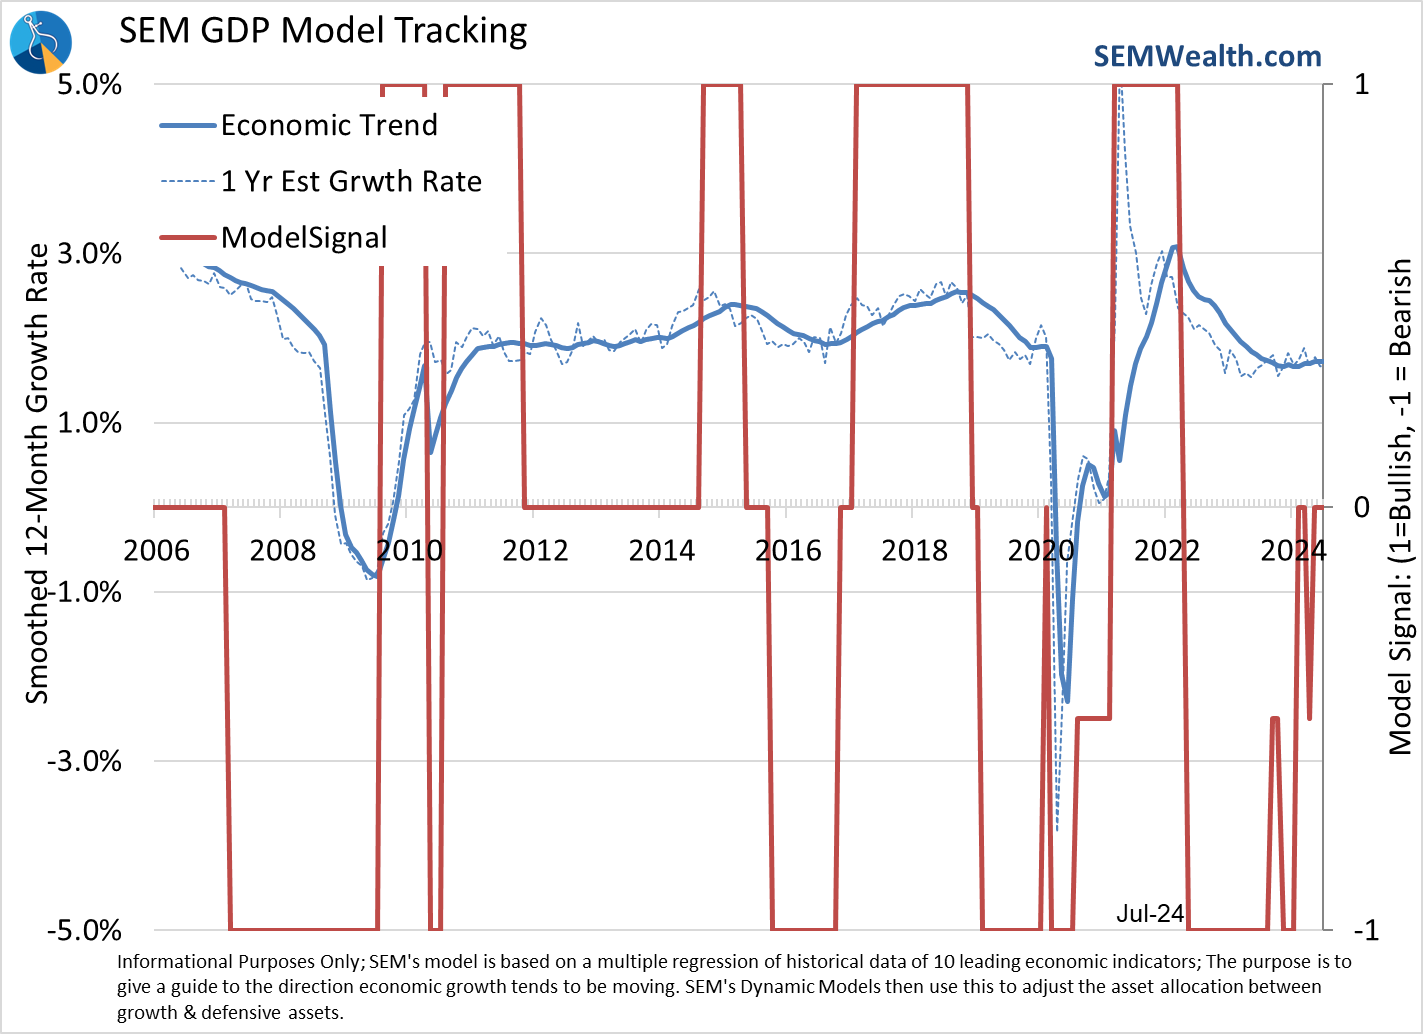
Four weeks ago the title of the blog was "Be careful (what you wish for)." At the time bad economic data was viewed as 'good' news for stocks as it meant the Fed was likely to cut interest rates at some point soon. I warned at the time about the Fed's horrendous track record of waiting too long and the fact that in every recession in the modern era the Fed was cutting rates BEFORE the recession started, yet we still had a recession. I show this chart often to illustrate the delayed impact of Fed policy changes.
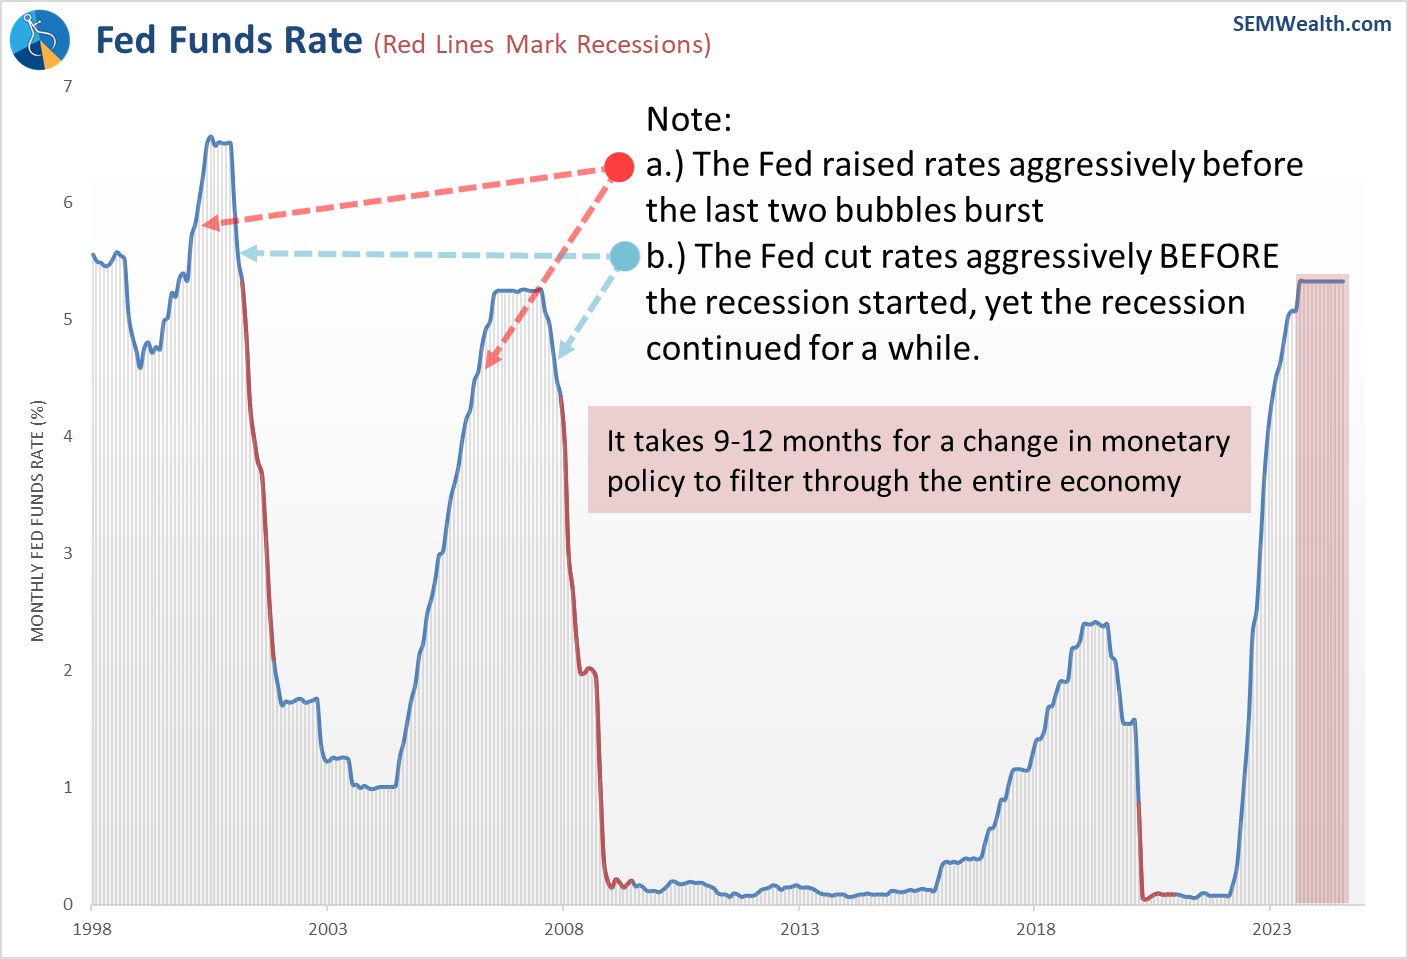
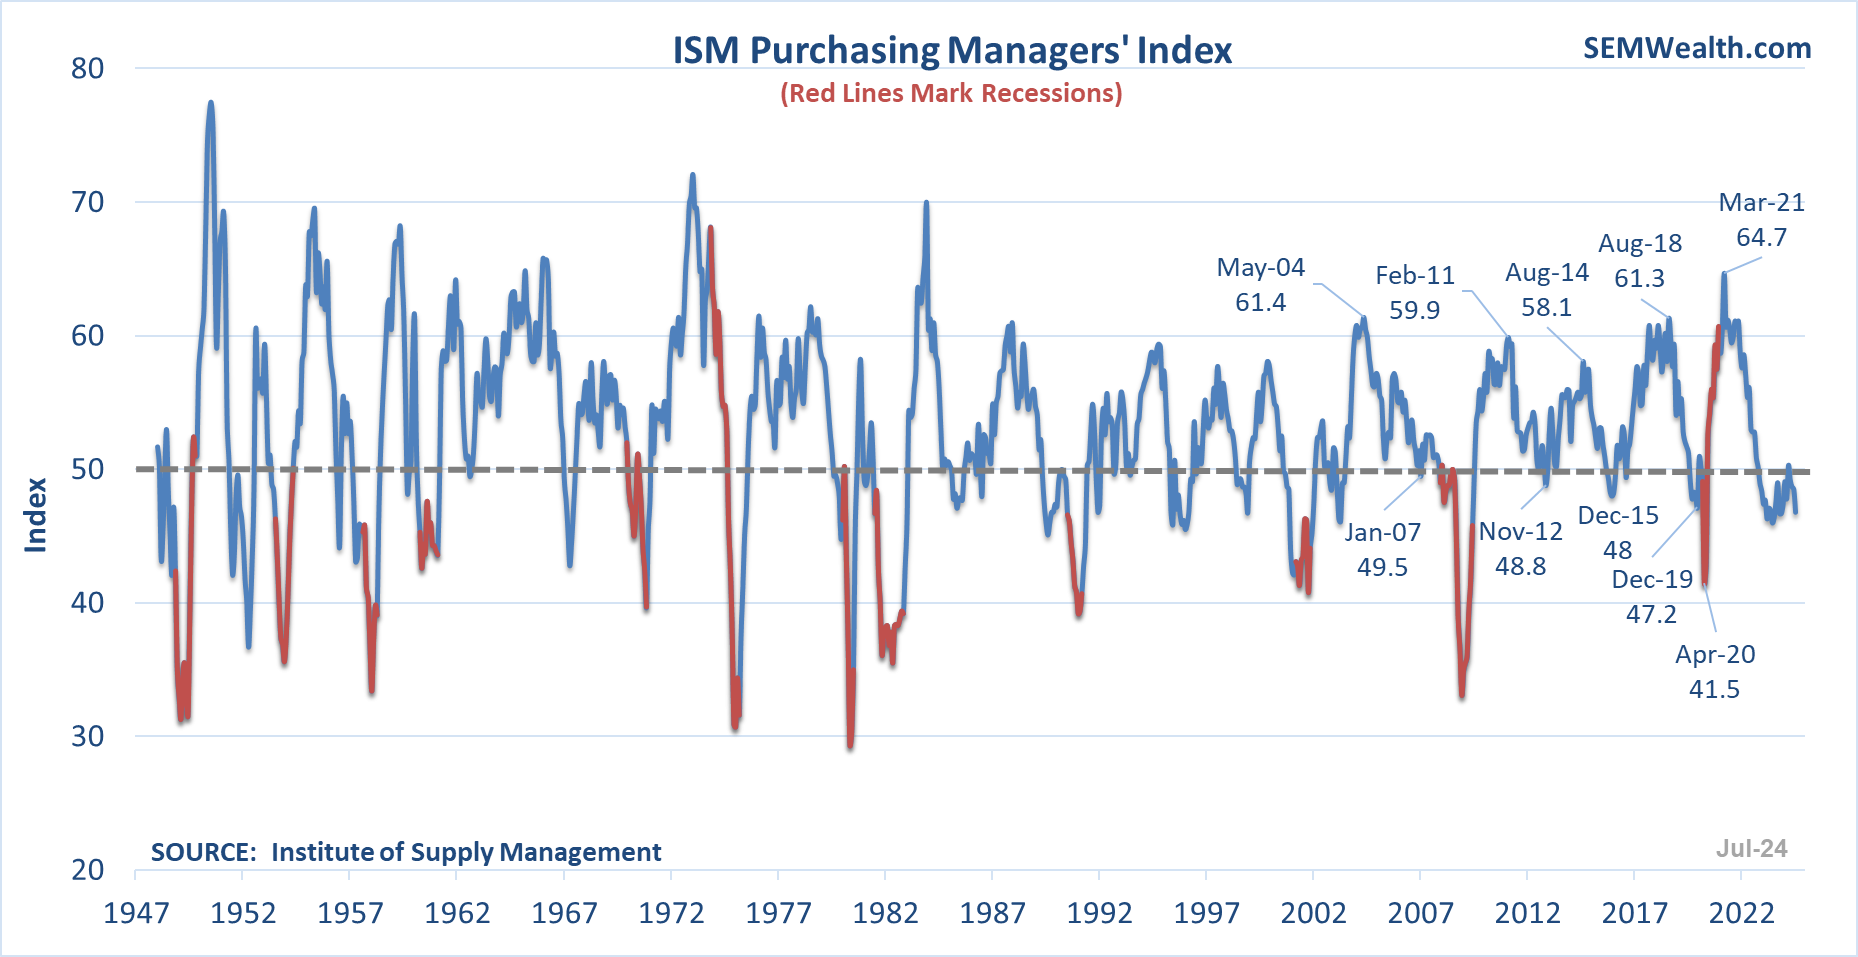
On Wednesday stocks enjoyed a strong rally following the Fed's latest meeting. While they didn't cut rates yet, Fed Chair Jerome Powell made it clear we could expect a rate cut as early as September. The futures market immediately priced in 3 rate cuts totaling 0.75% in 2024. A slew of negative earnings reports where mainstream companies warned about slowing sales began hitting stocks Wednesday evening. That was followed by some concerning economic data. First, the ISM Manufacturing came in well below expectations while dipping further into "contractionary" territory (below 50).
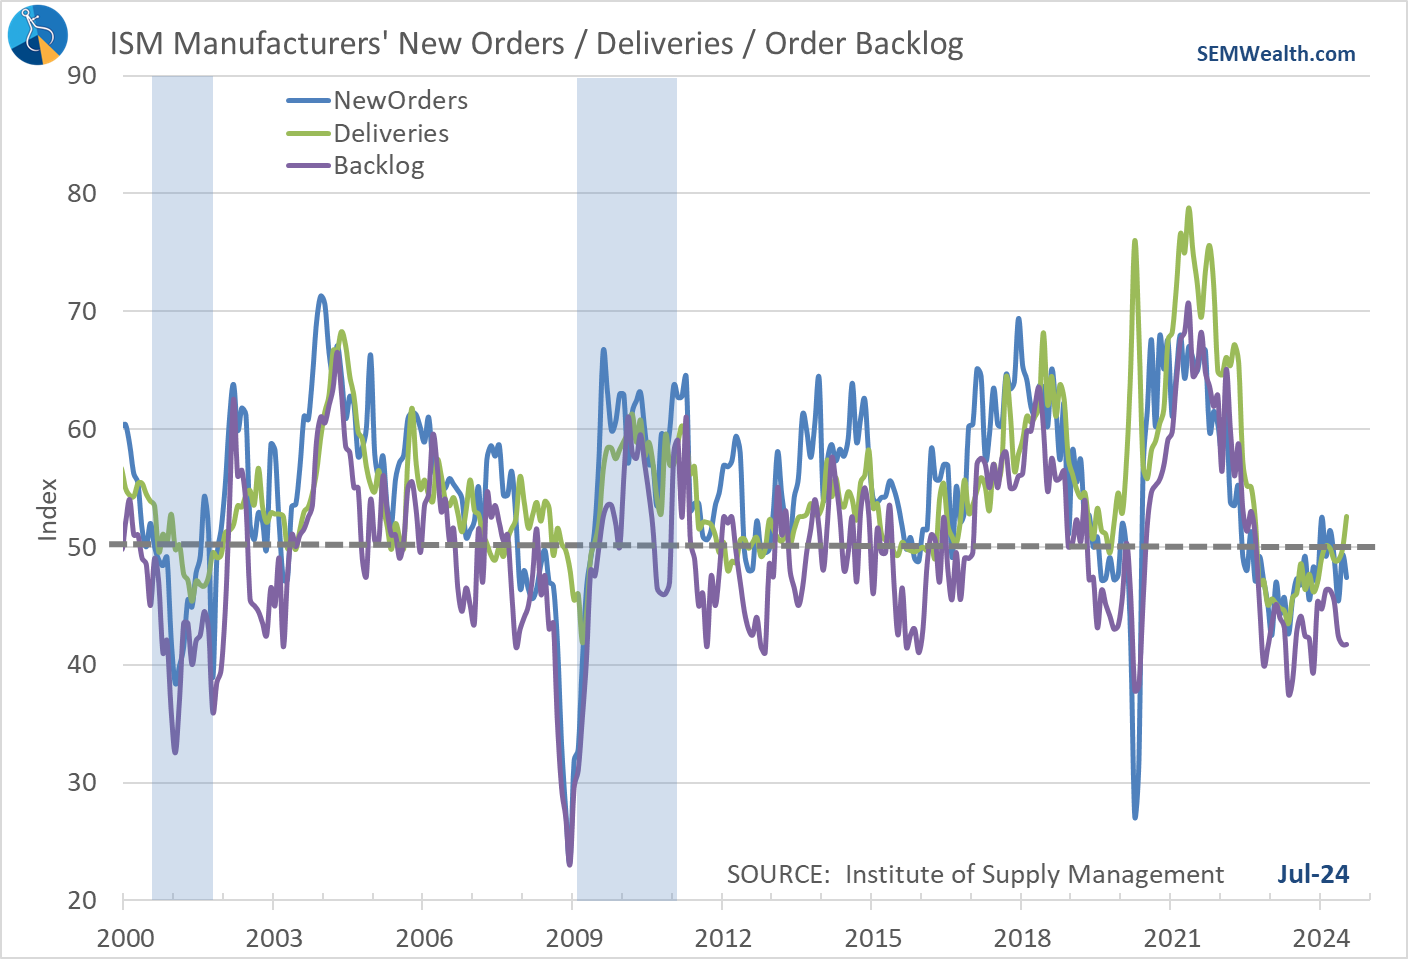
2 of the 3 'leading' components also deteriorated last month.
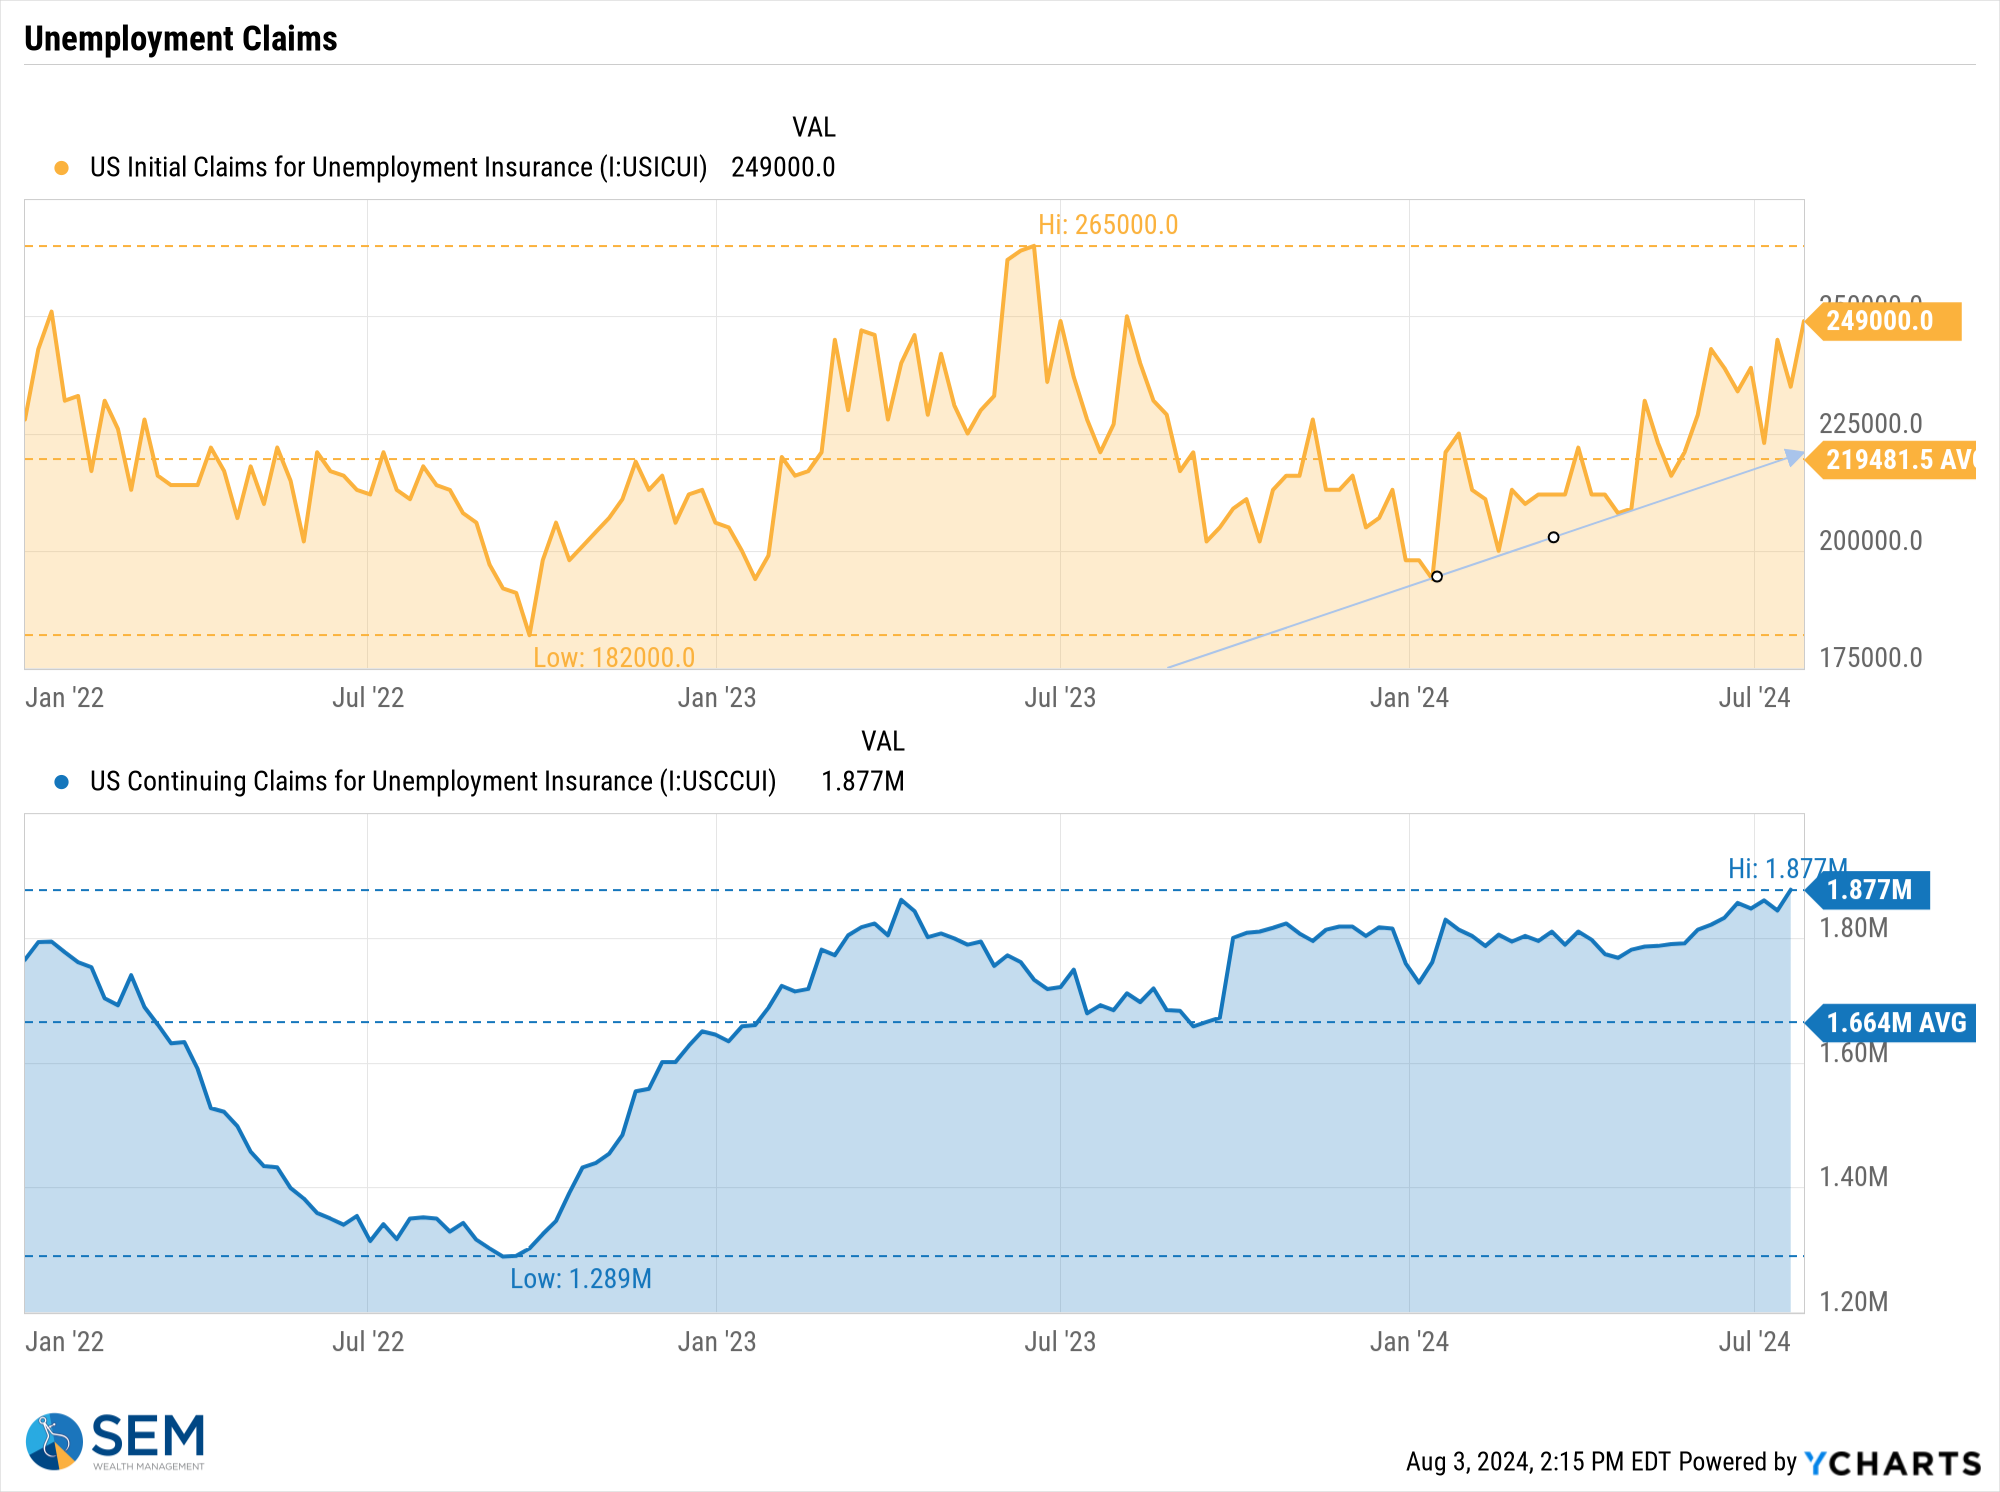
This data also accompanied concerning jobless claims data, with initial claims hitting the highest level since last June and continuing claims eclipsing last summer's highs. While this data can be noisy, the trend is obviously moving in the wrong direction.
Thursday evening Intel added to concerns about the growth outlooks from Microsoft and Amazon with a dire outlook on their revenue forecasts. While one quarter does not make a trend, something I've been concerned about throughout the year is whether or not the hype surrounding anything mentioning AI along with mass capital expenditures towards these initiatives would lead to meaningful growth. So far Microsoft & Amazon have made it clear it may not be as easy as everyone believed last month to turn AI investments into accelerated sales growth.
The jobs report on Friday further added to the growth concerns with the July number coming in below expectations and the last two months revised lower. We've now gone from a very 'healthy' rate of job growth to a concerning number. Again, one month does not make a trend, but the (over) reaction to the report does make sense given the well above average earnings growth rates the market was pricing in.
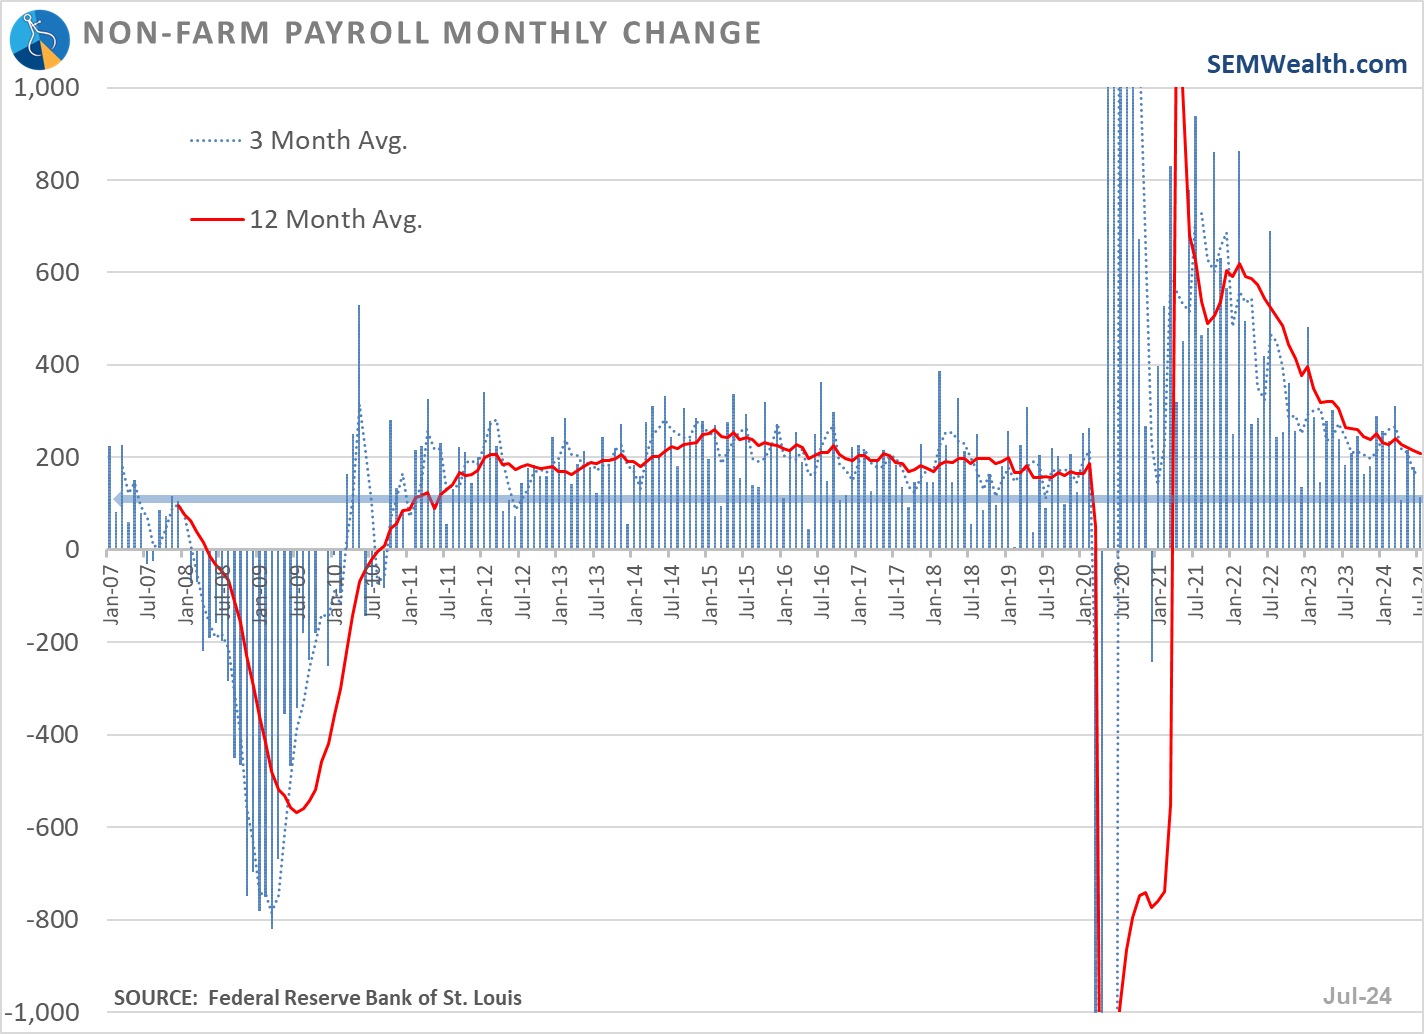
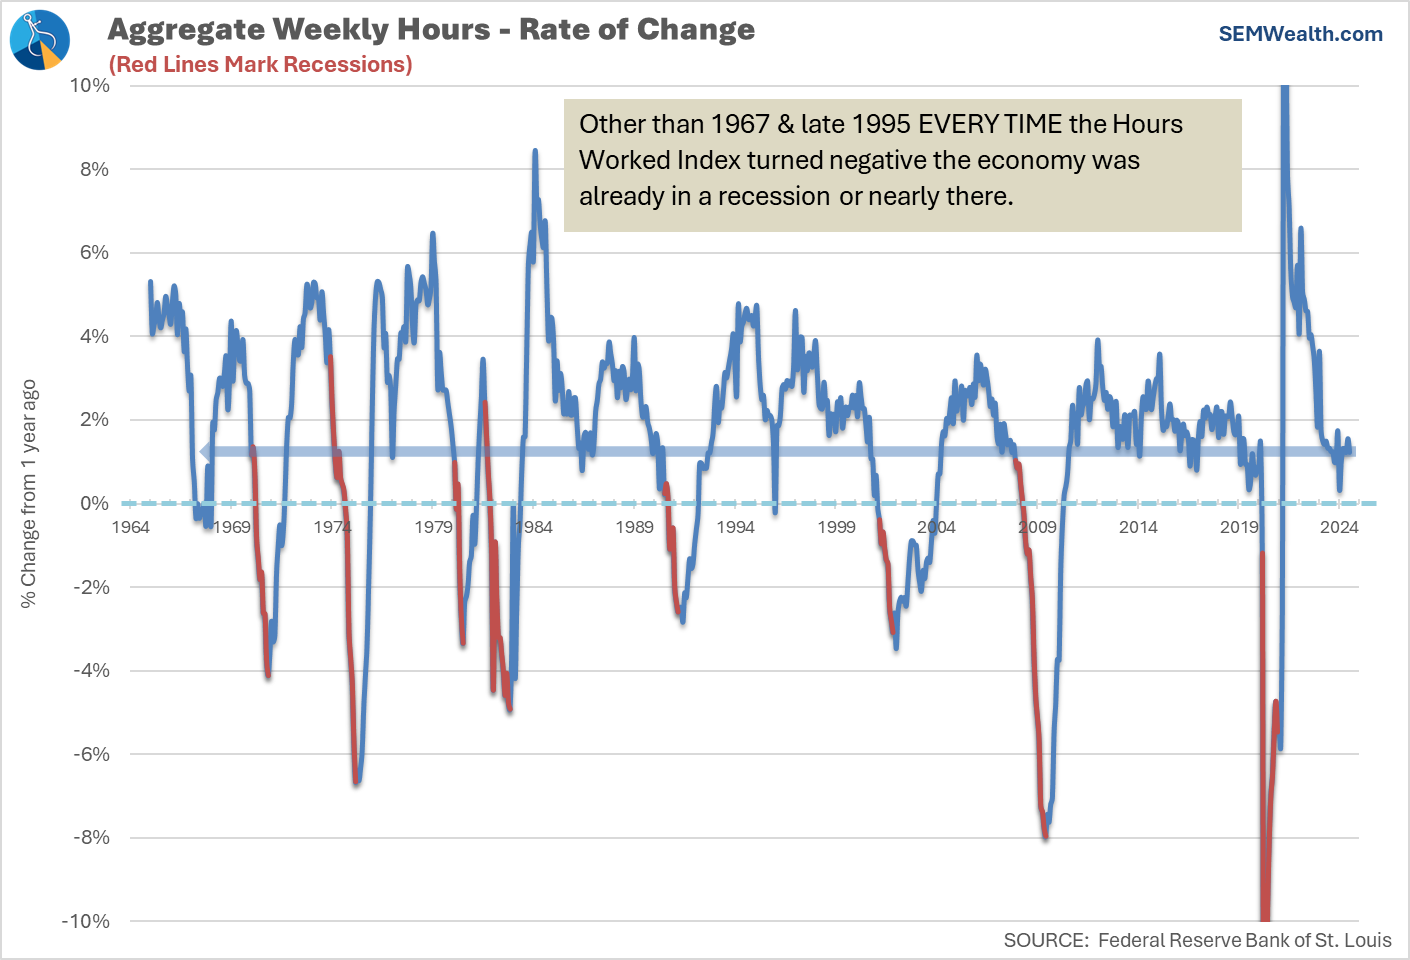
We've had only a few non-recessionary months since the Financial Crisis with job growth below July's meager 114,000 new jobs. Other indicators inside the report were not as dire, with the Aggregate Work Week remaining favorable.
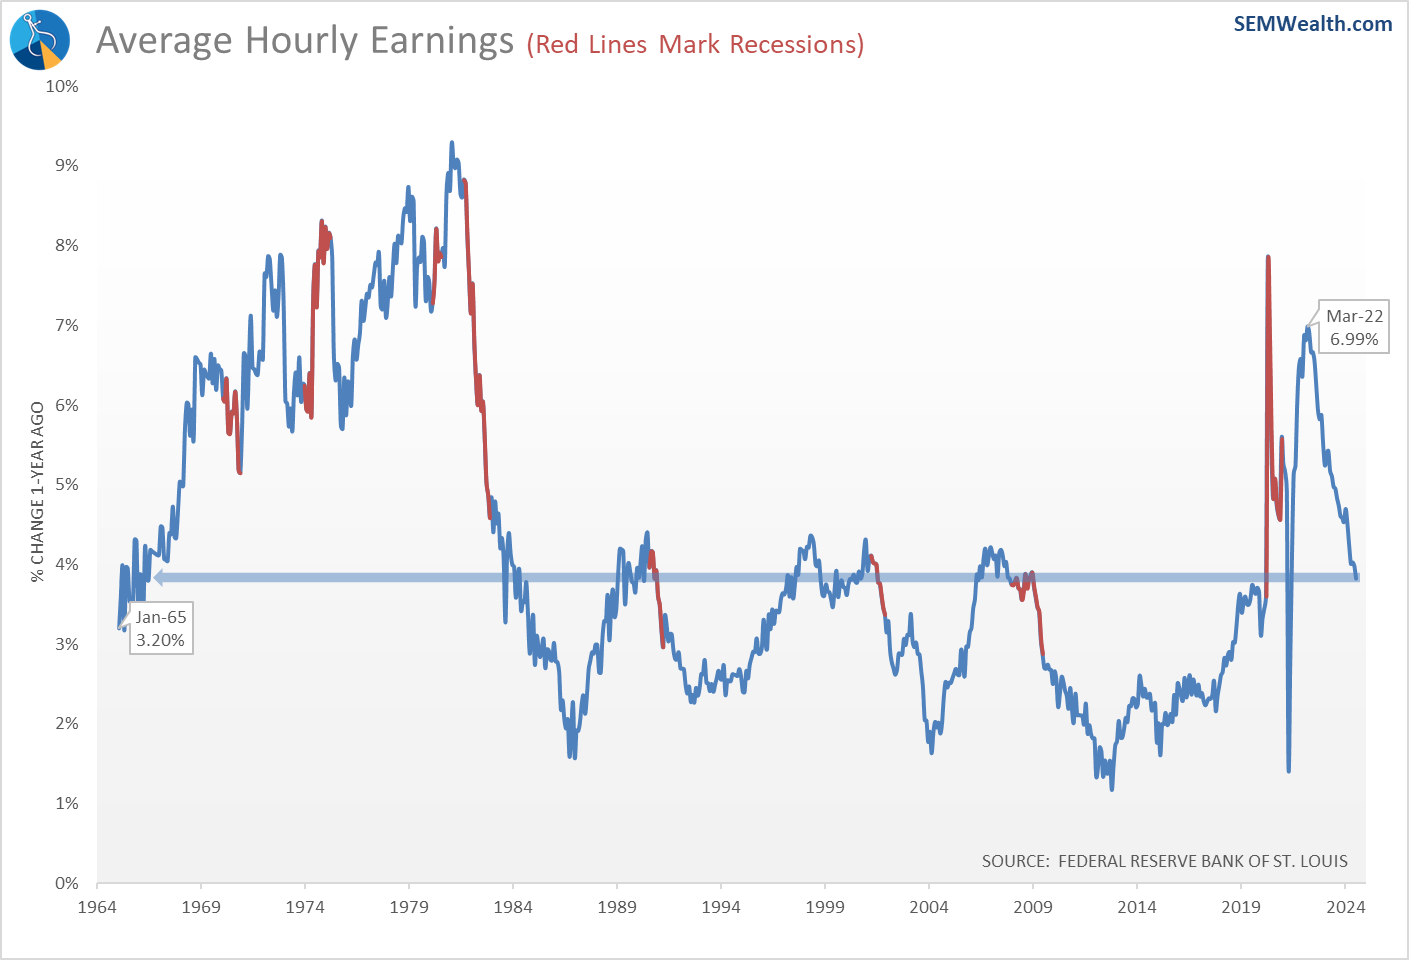
Average earnings growth slowed, but was still a healthy 3.8%.
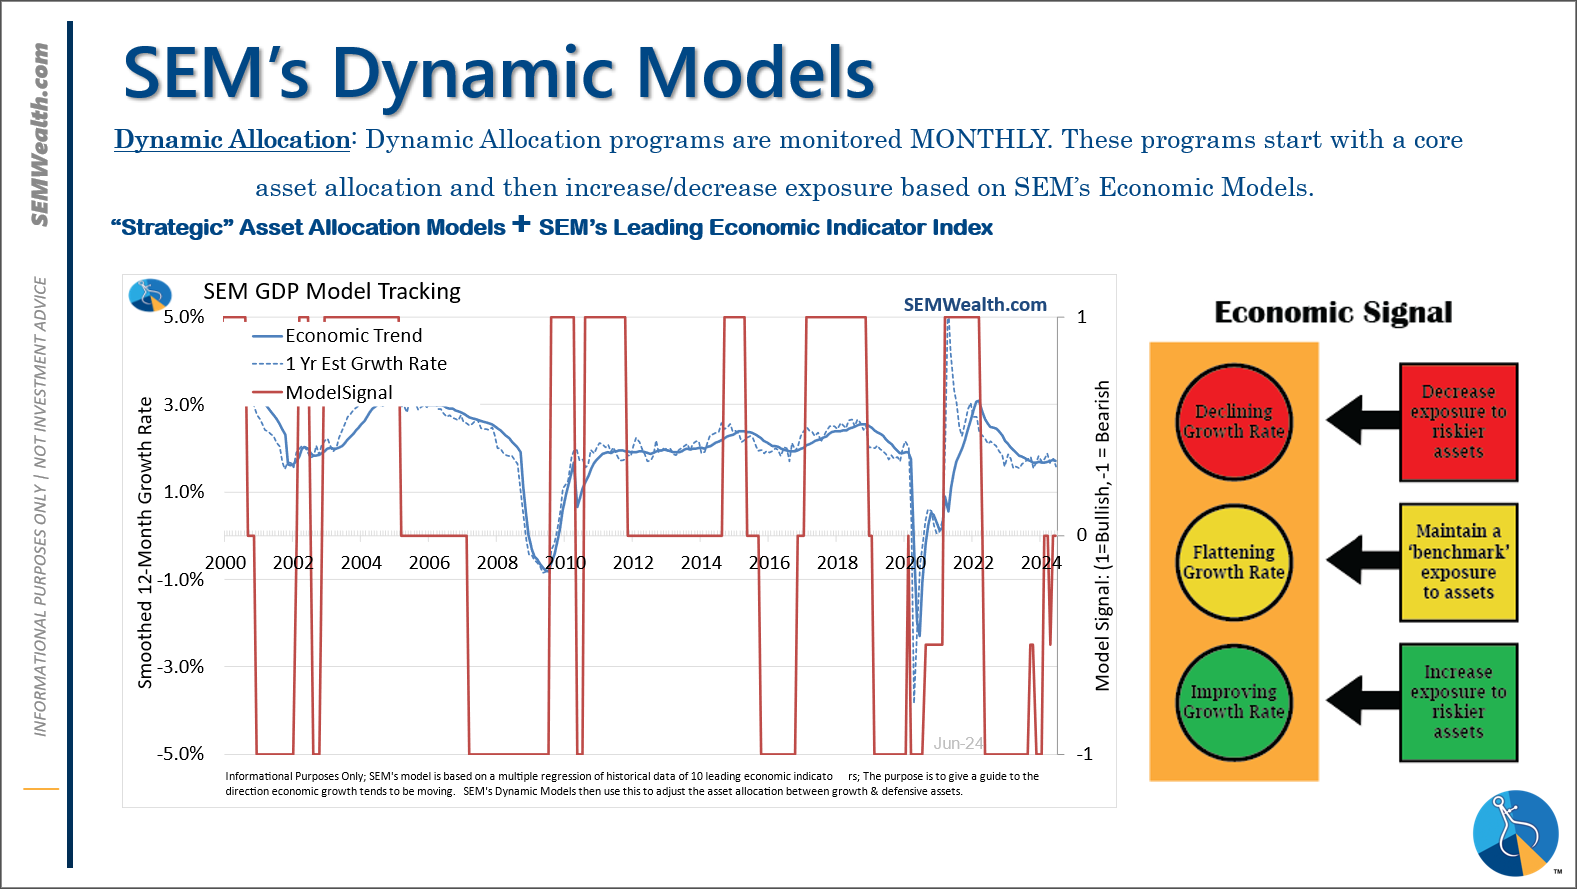
Overall our dashboard of indicators deteriorated a bit with just Capacity Utilization and Stock Prices (as of the end of July) the only two indicating an above average (3%+) growth rate. Most indicators are 'neutral'.
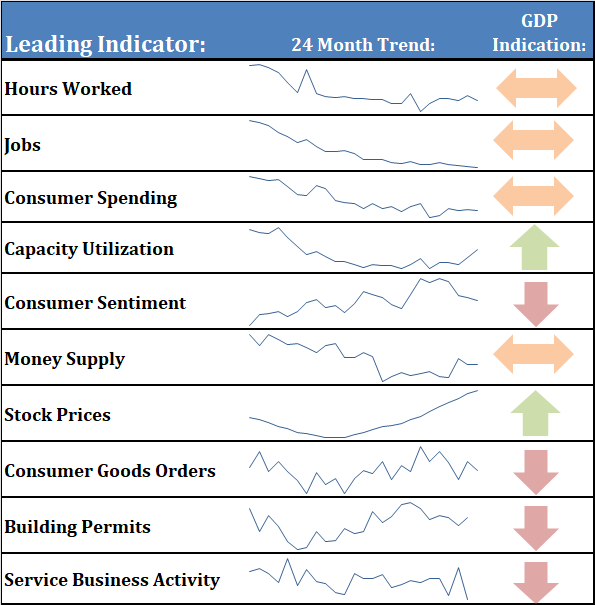
This leaves our overall model (barely) in neutral territory. Regardless of what the Fed does, the reality of a slowing economy could take its toll. We will know soon enough.
Market Charts
The mega-cap S&P 500 quickly reversed from Wednesday's all-time closing high, losing over 5% in two days.
Perspective is key – the opening price on Monday puts us back to the same place we were on May 7. Our momentum indicators are currently not going to be concerned until the S&P 500 breaks below 4925. That would take out the April lows, leaving very little support underneath.
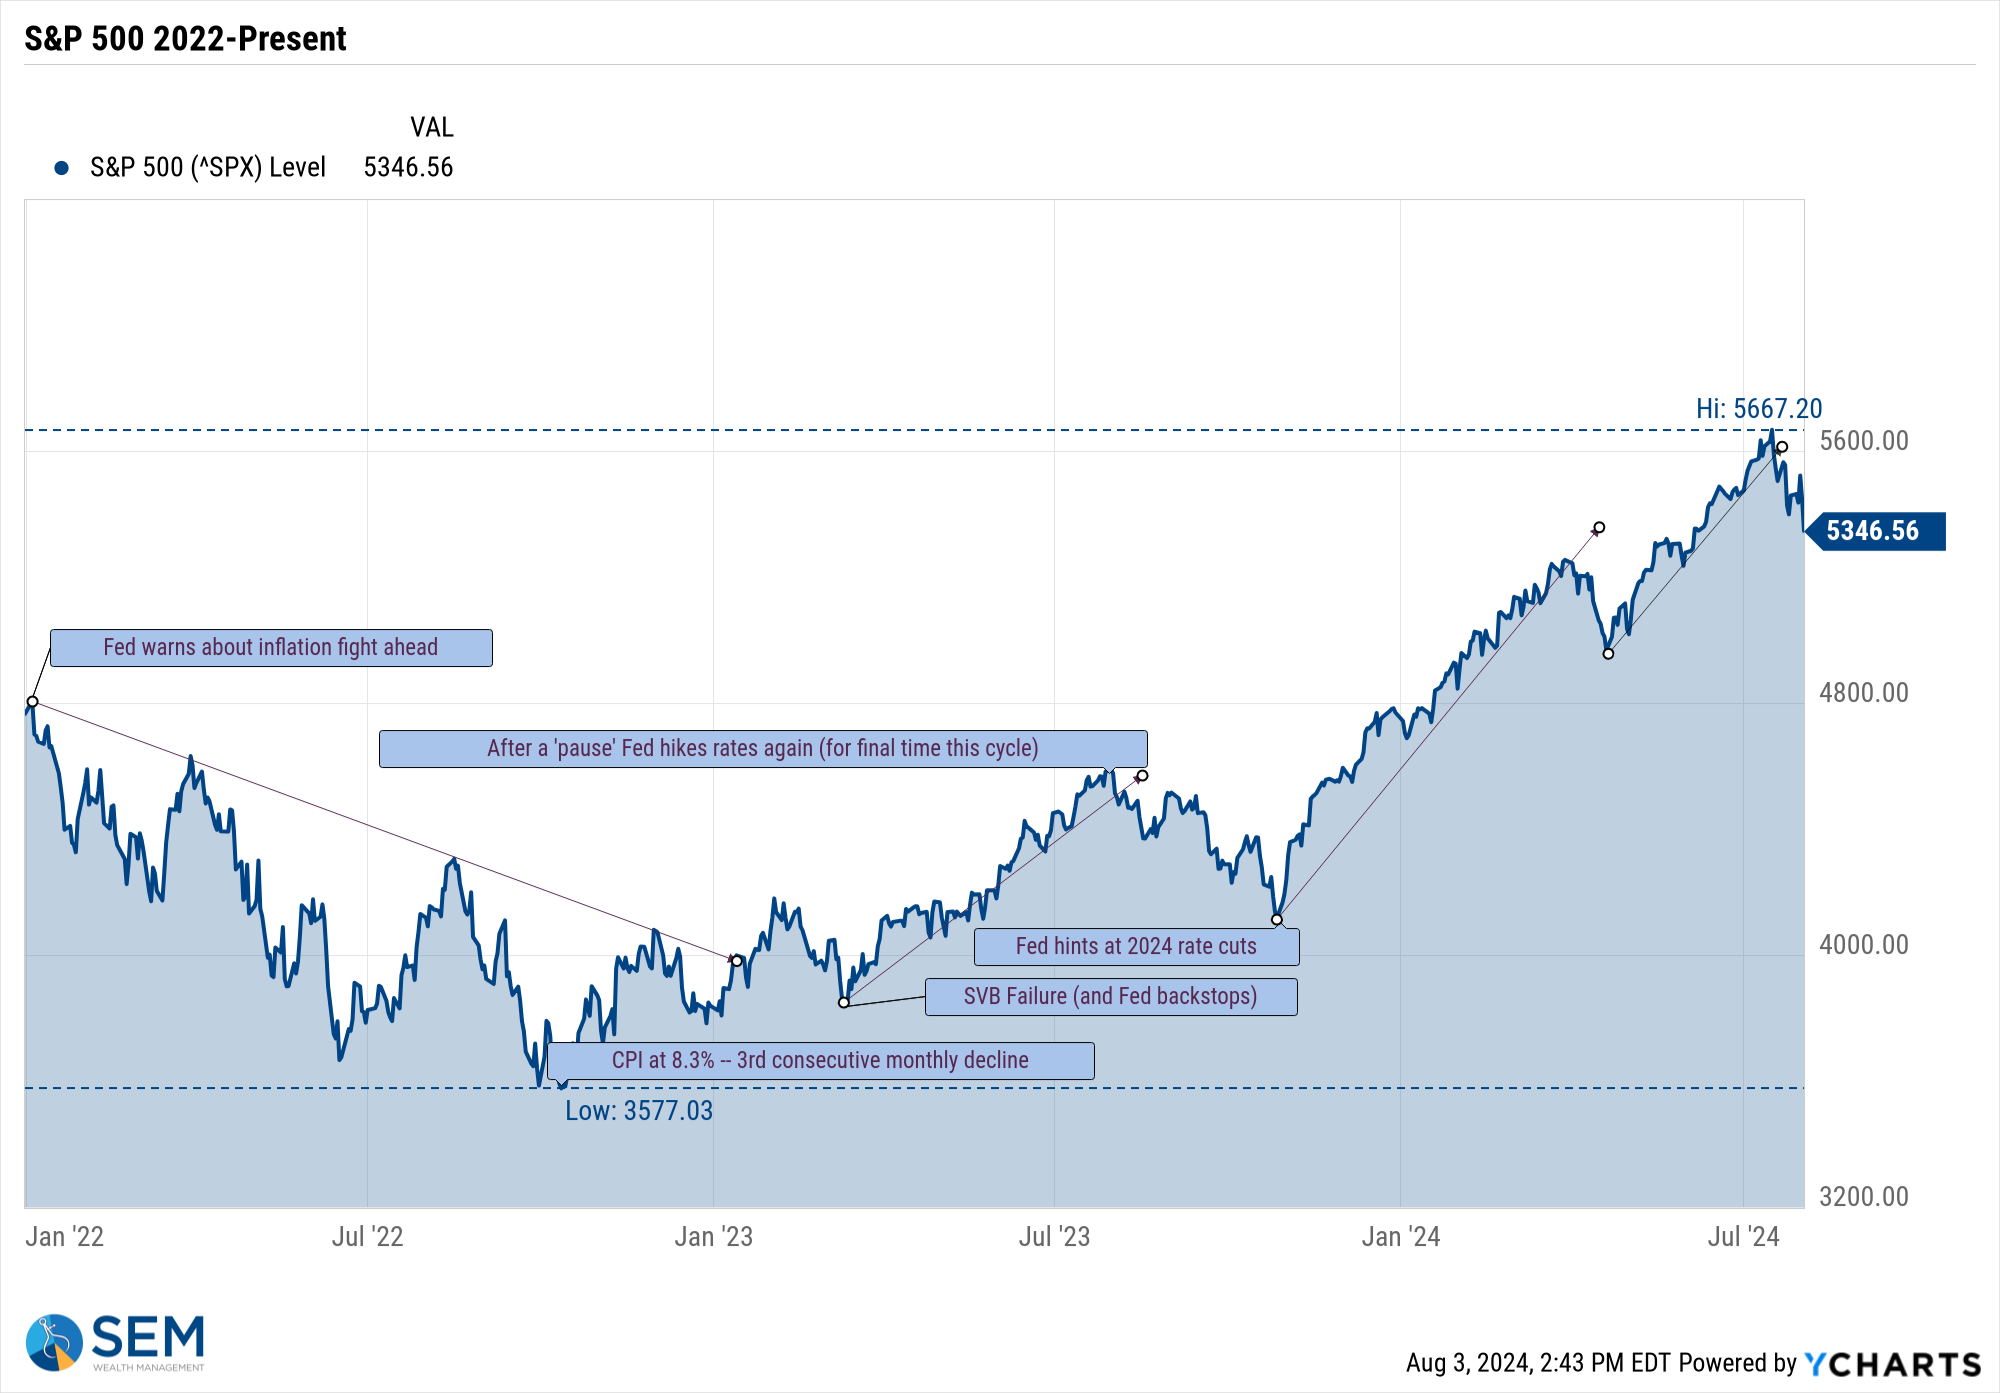
Going into last week, the S&P 500 was trading at 23 times 2024 estimated earnings and a whopping 21 times 2025 estimated earnings. The historic "forward" P/E medium is 15 and the historic "trailing" medium P/E is 18. Trading at 23 times "forward" earnings is bubble-like territory. A correction should be expected to dampen expectations.
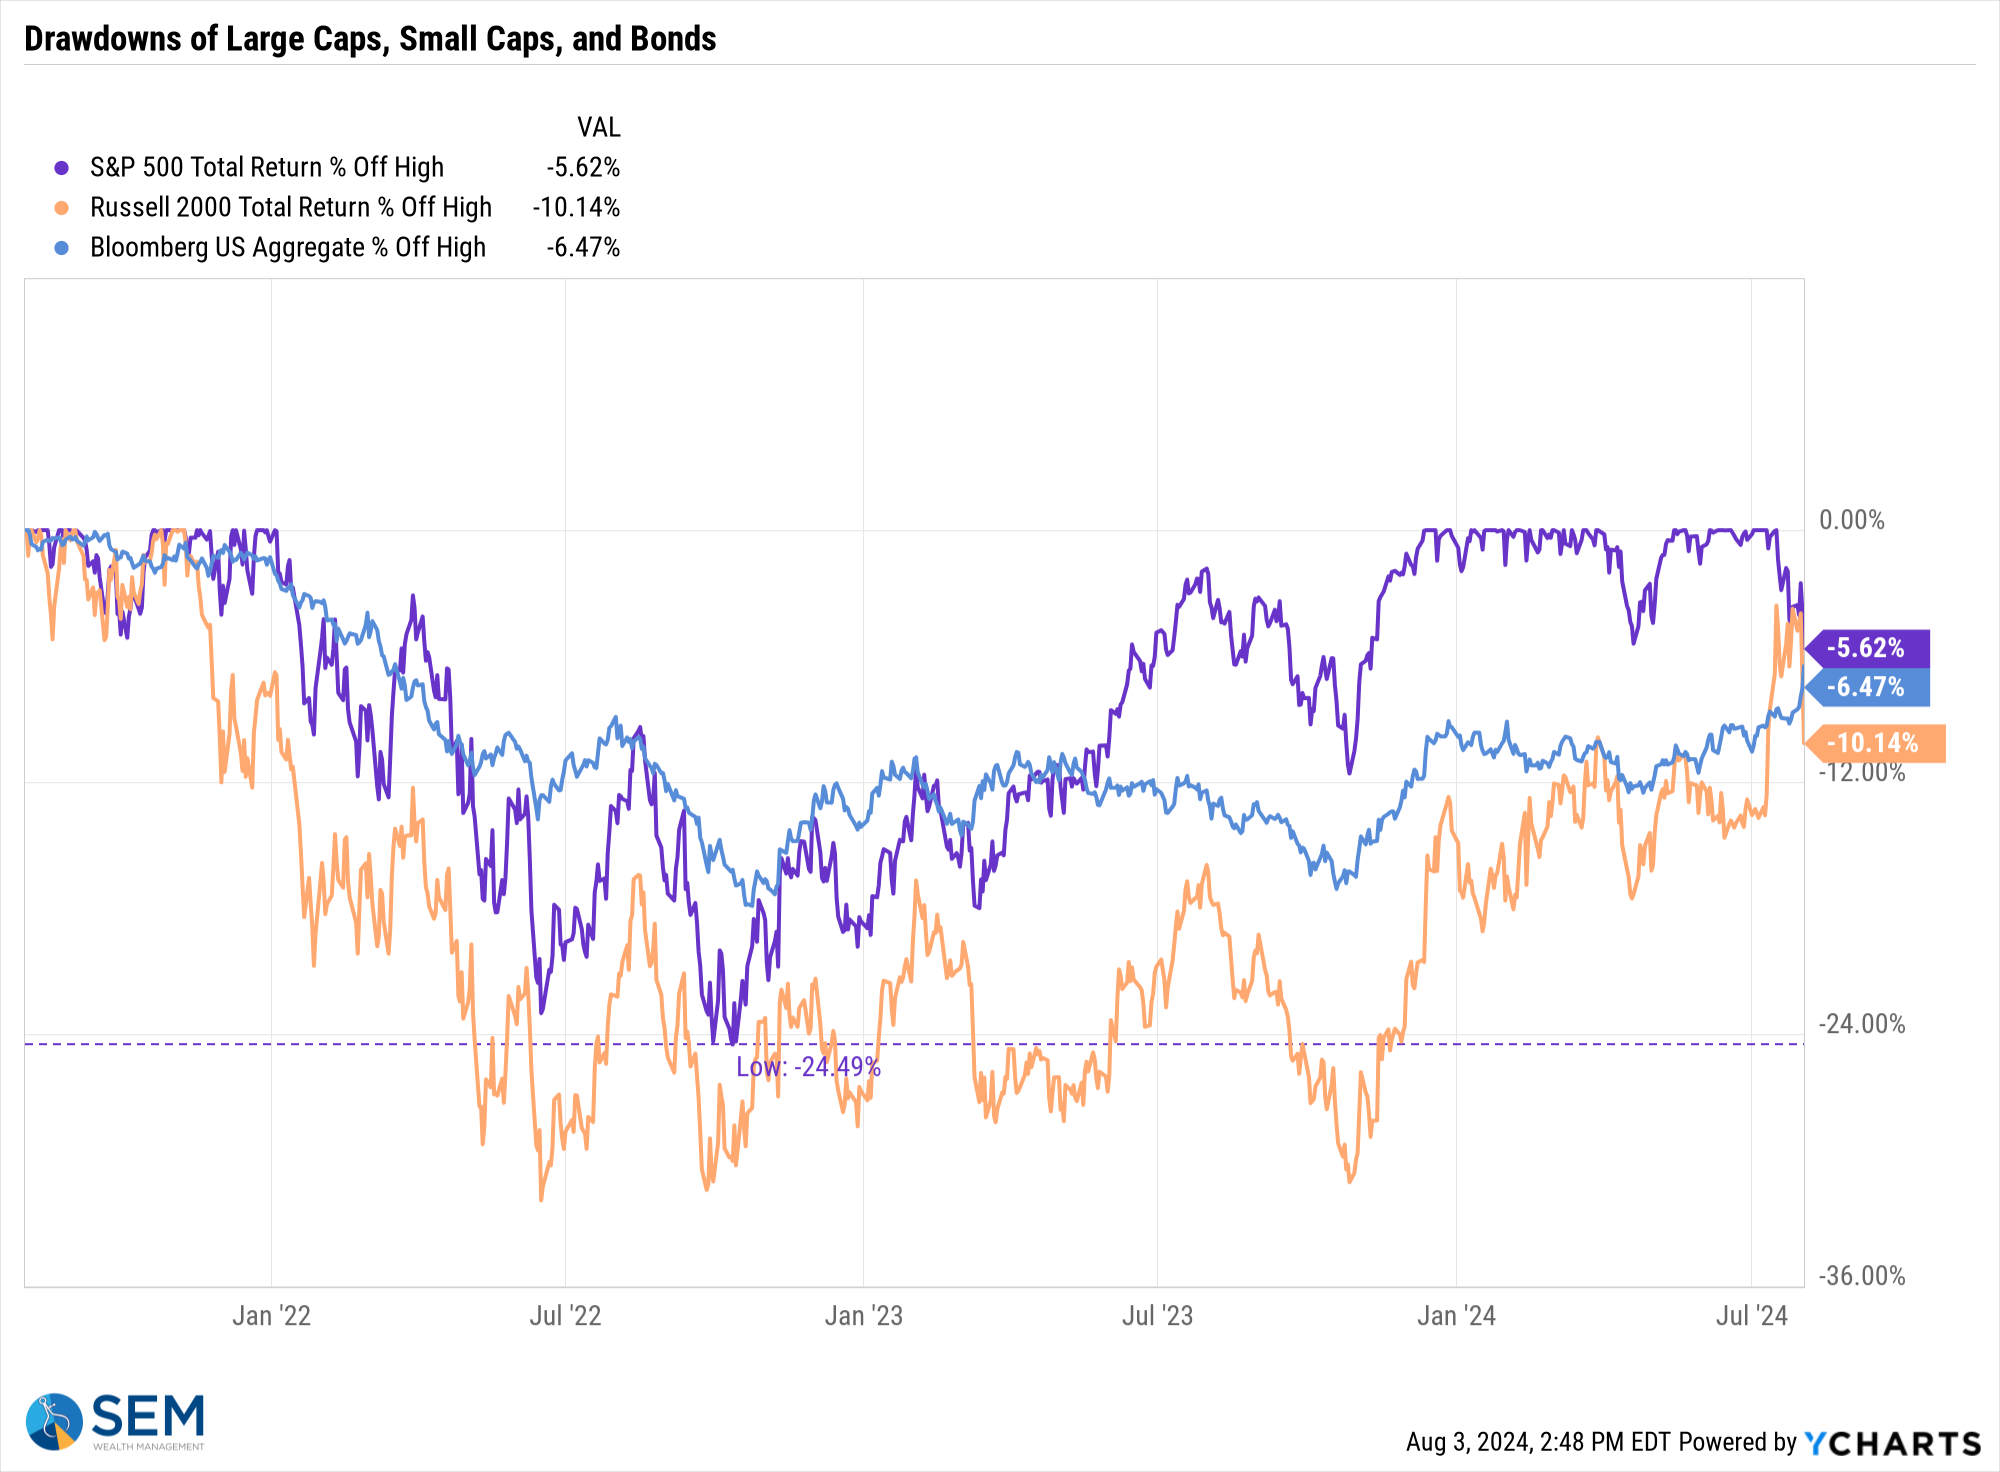
Small cap stocks, which had just enjoyed their best one-day rally since 2020 on Wednesday also gave back all of those gains and then some on Thursday and Friday.
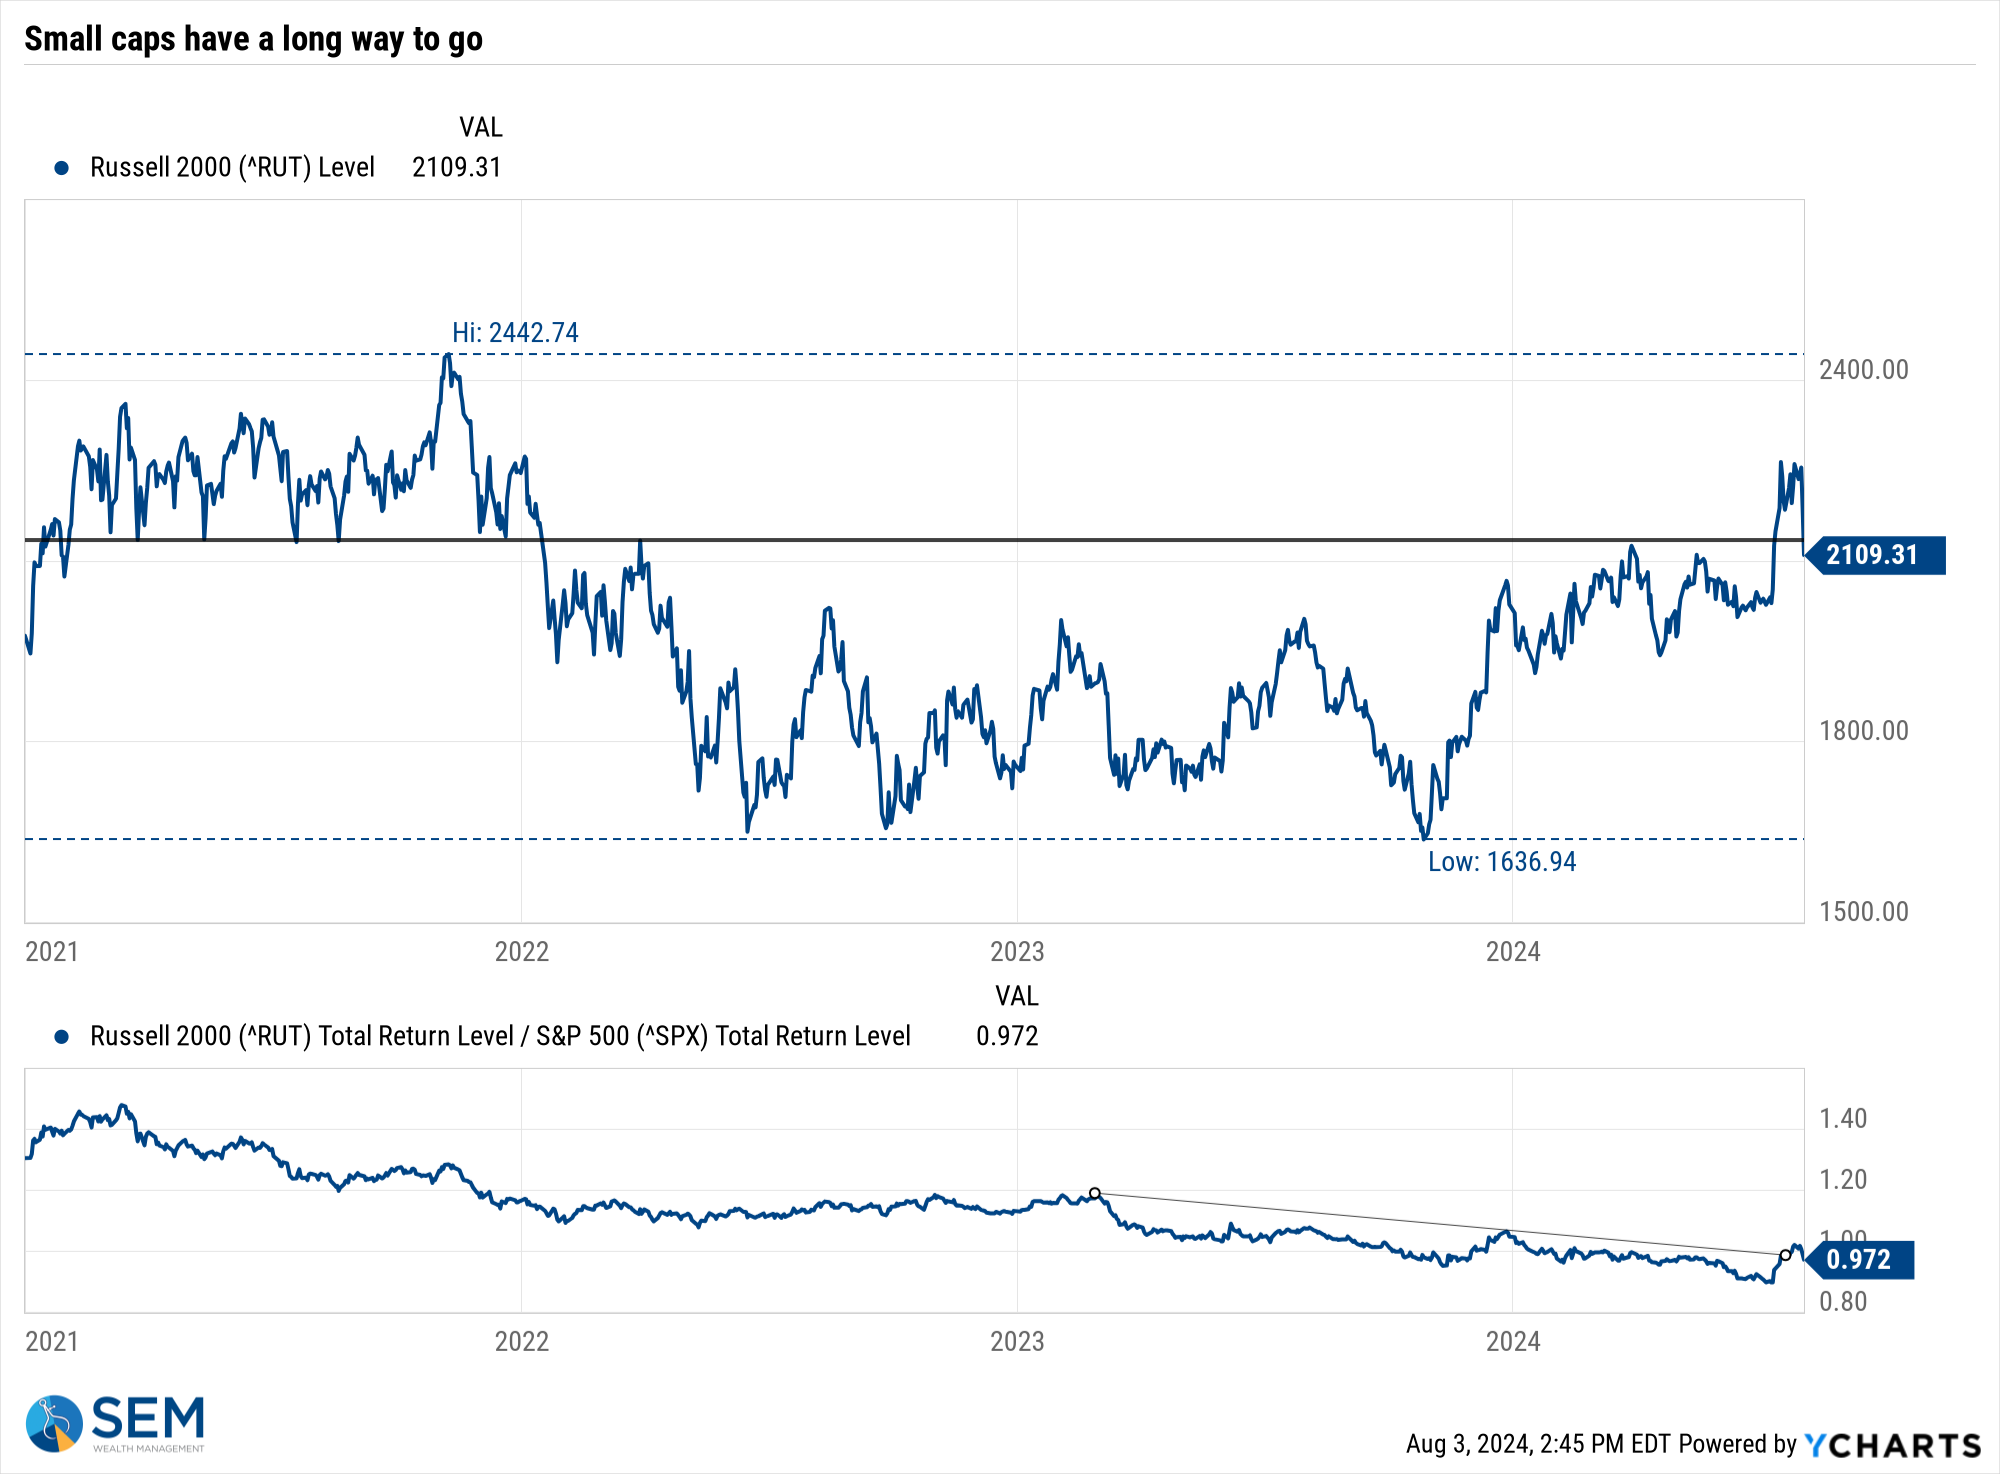
This chart illustrates how quickly the brief "catch-up" rally in small and mid caps ended.
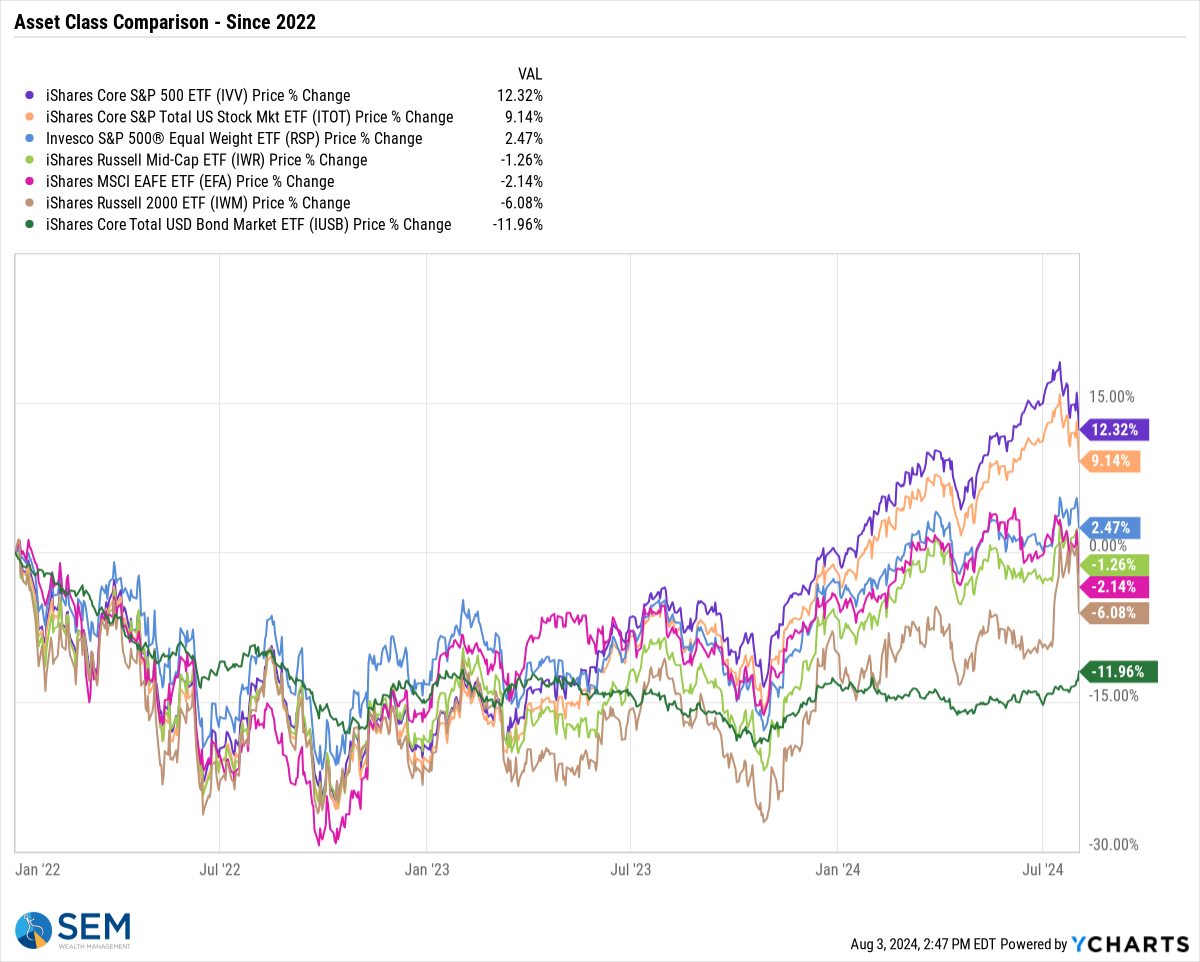
The drawdown chart also illustrates how quickly things can change. Bonds are now down 'just' 6.5% from their 2022 high, just below the current drop in the S&P 500.
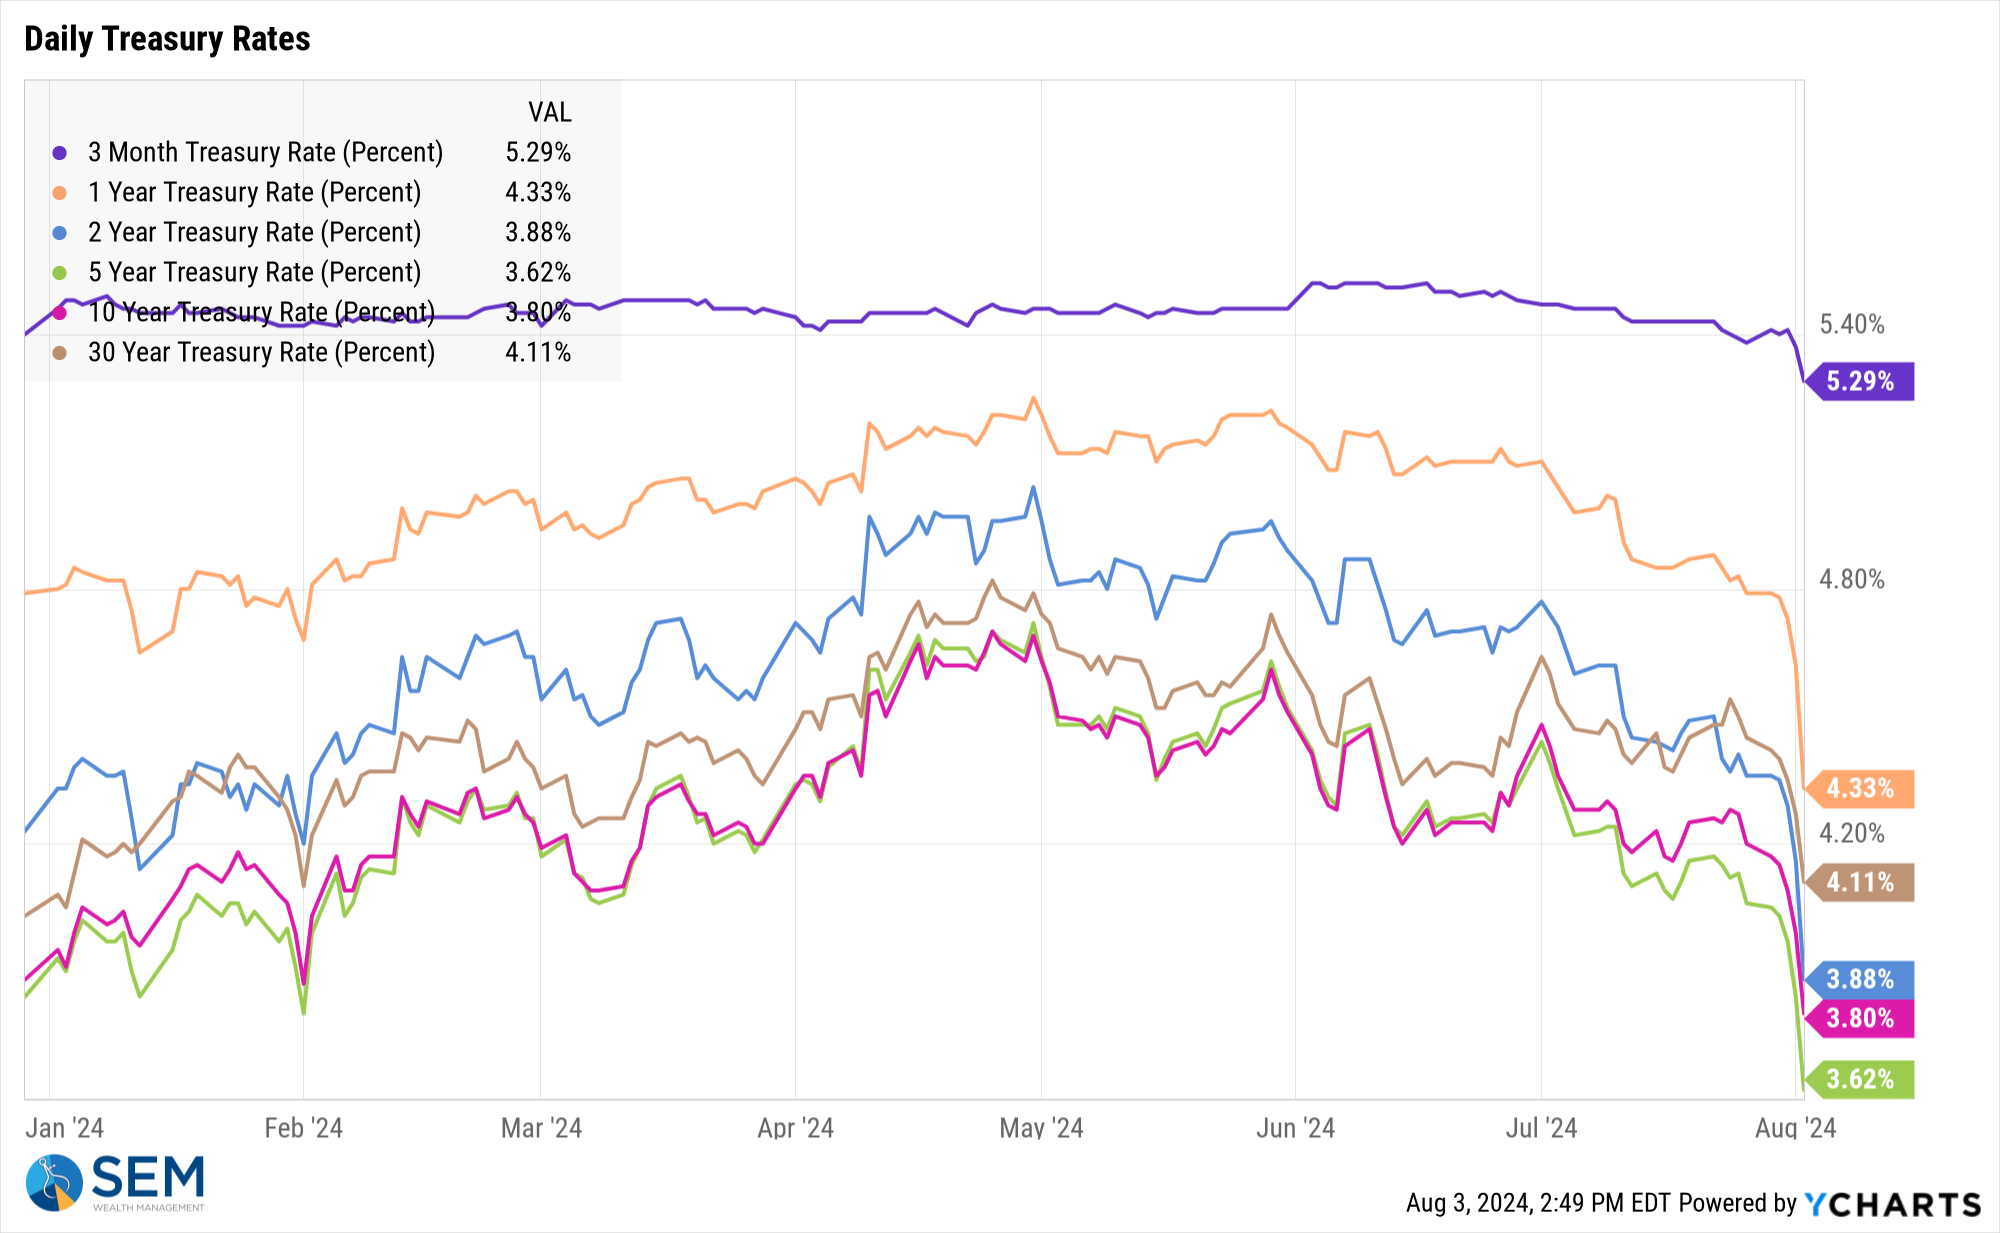
While the Fed has yet to cut rates, the bond market has been busy cutting rates for them. Even the 3-month Treasury saw rates come down last week.
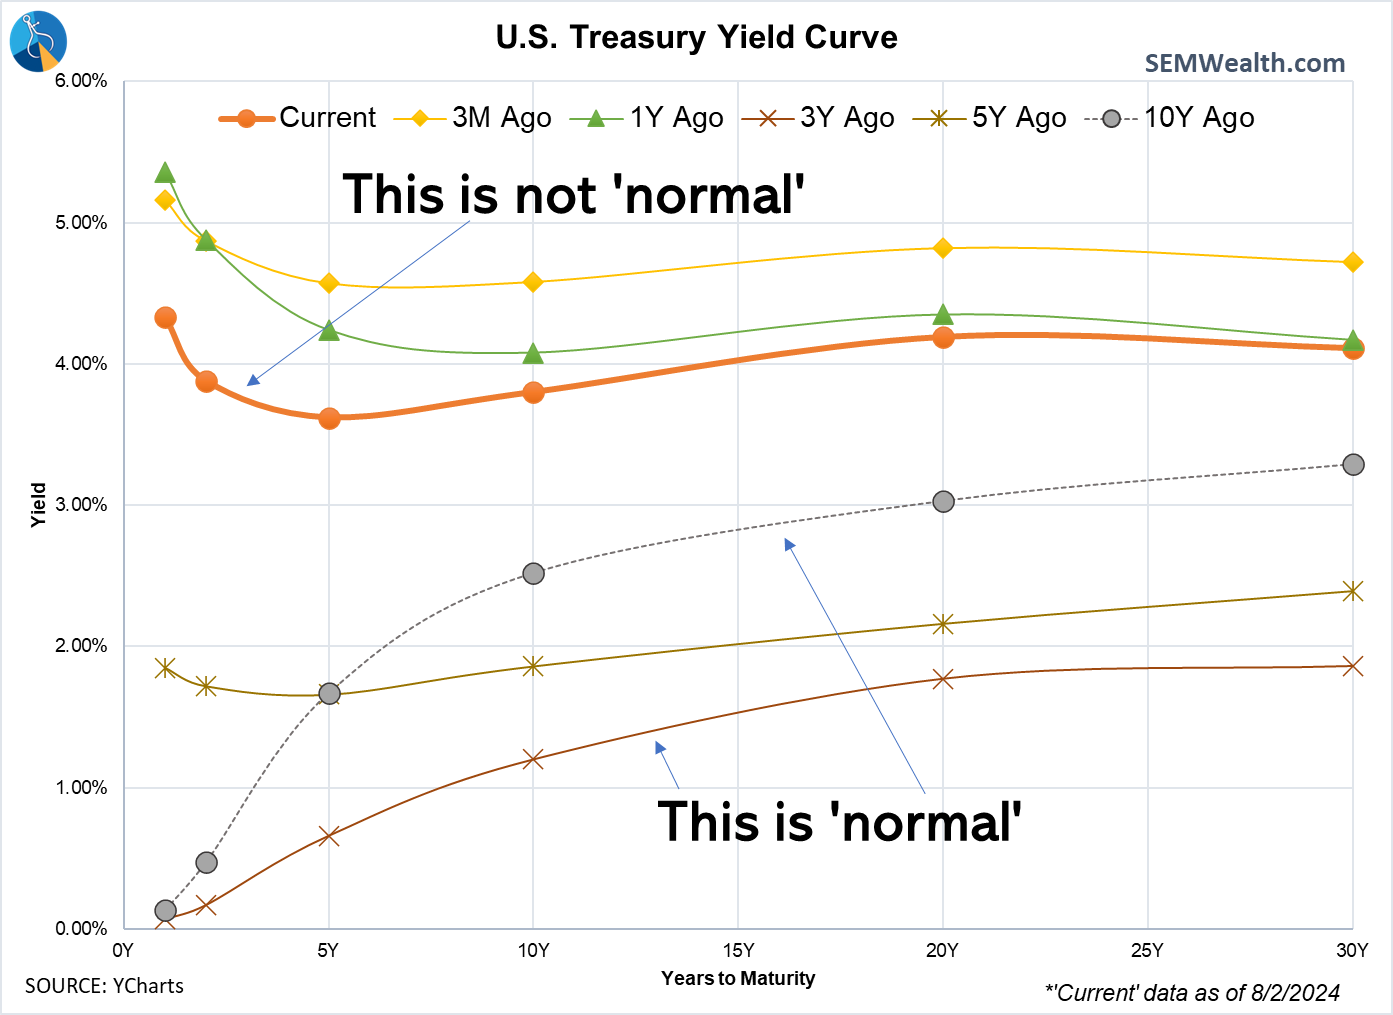
This has led to the 5 to 20 year yield curve somewhat 'normalizing' over the past few weeks.
10-year Treasury yields plummeted last week, pushing yields all the way down to where they started the year.
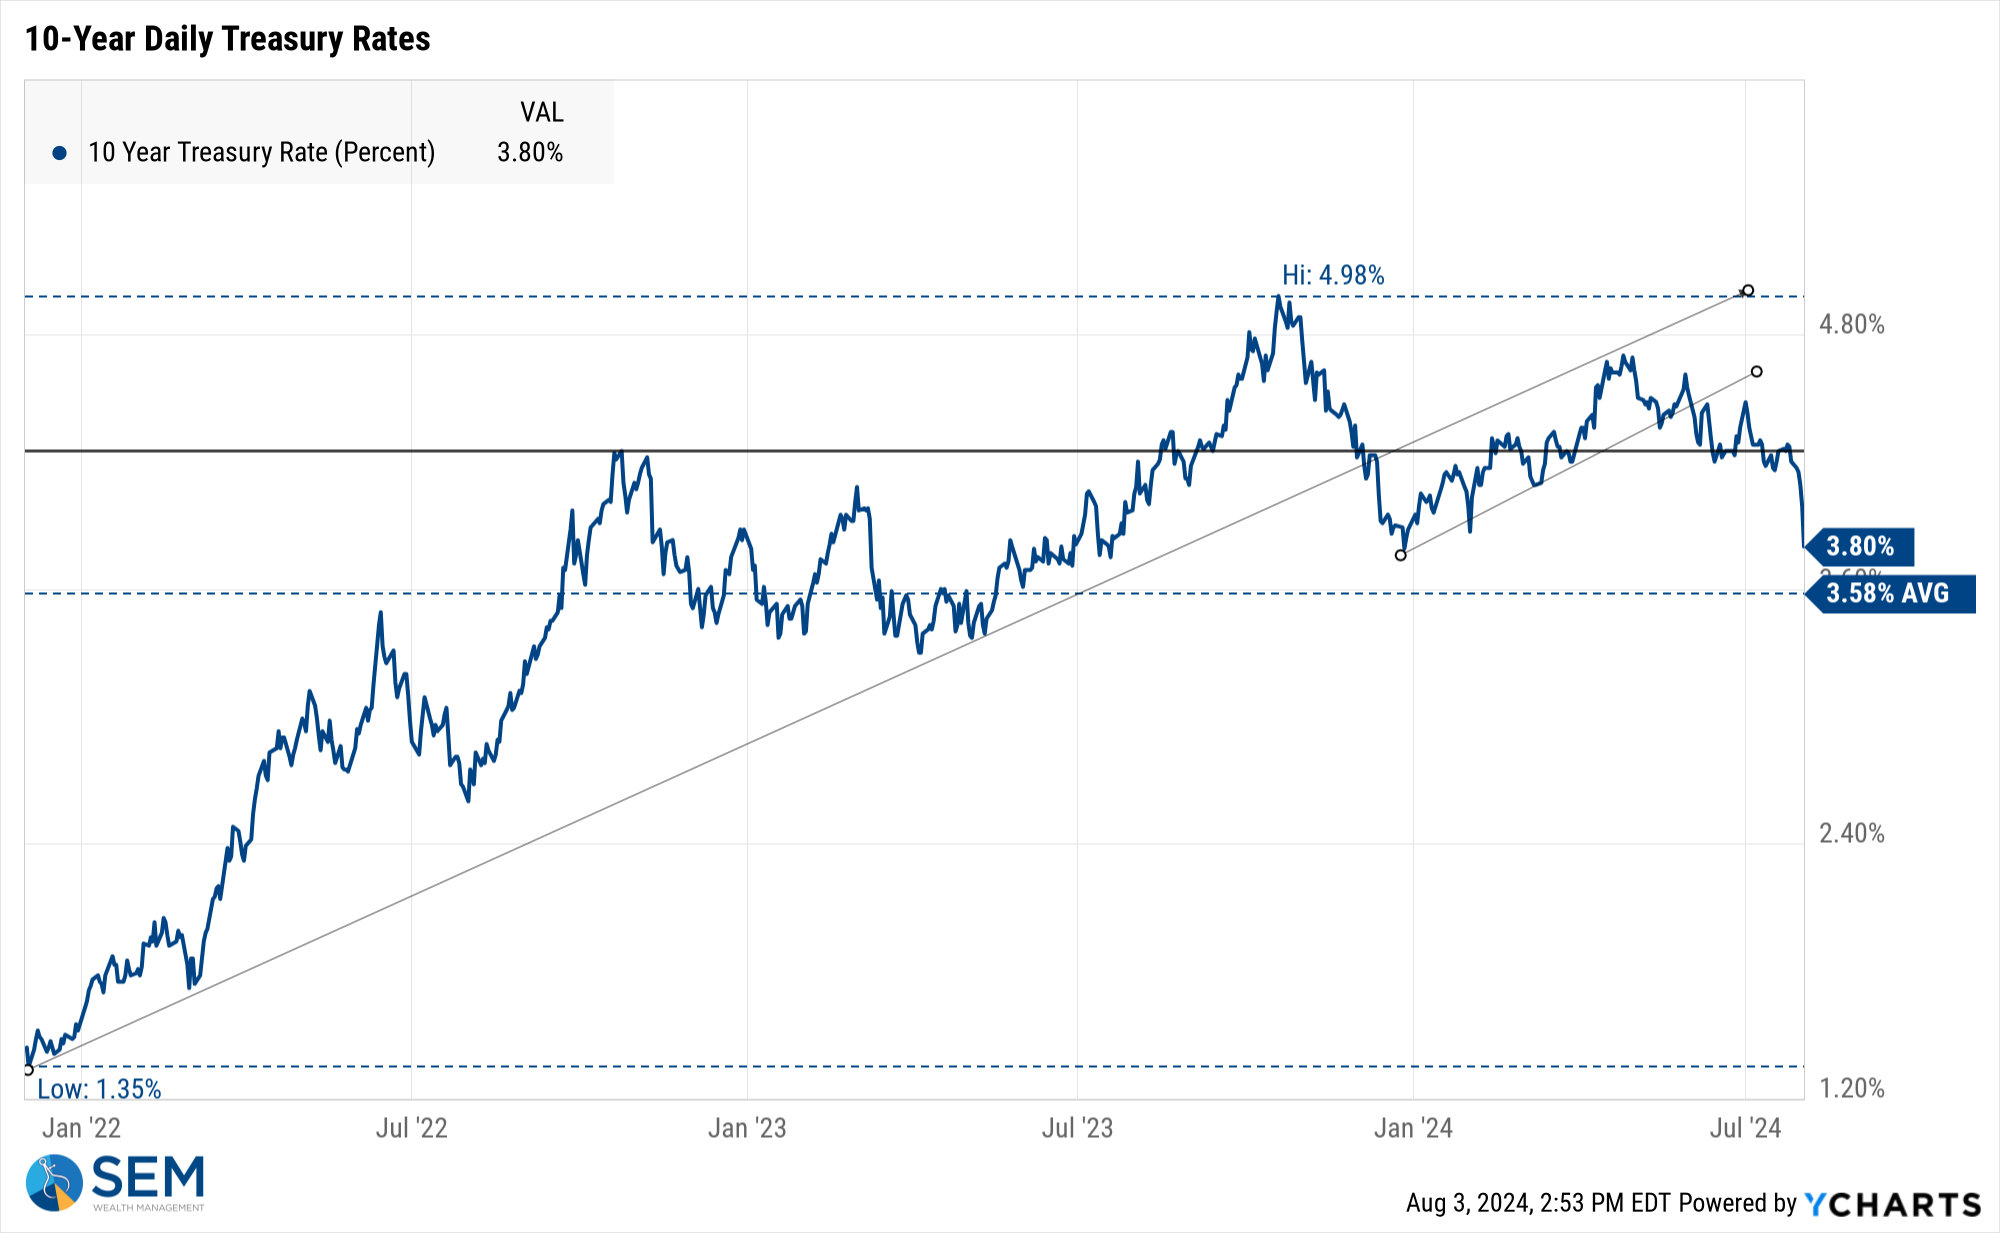
That last sentence is key to understanding the way the markets can overreact in both directions. We started the year with the market baking in 4-6 rate cuts for a total of 1.5%. Bad news was initially greeted as good news as it would push the Fed to cut rates sooner or more aggressively. However, higher interest rates from 2022-2023 are dragging down growth to the point even if the Fed does cut rates it does not mean they will be able to save us from some economic pain.
We haven't had any models make any adjustments just yet. The Tactical and Dynamic models were already 'cautious'. As always, we will allow the data, not our emotions or opinions decided what to do next.
SEM Model Positioning
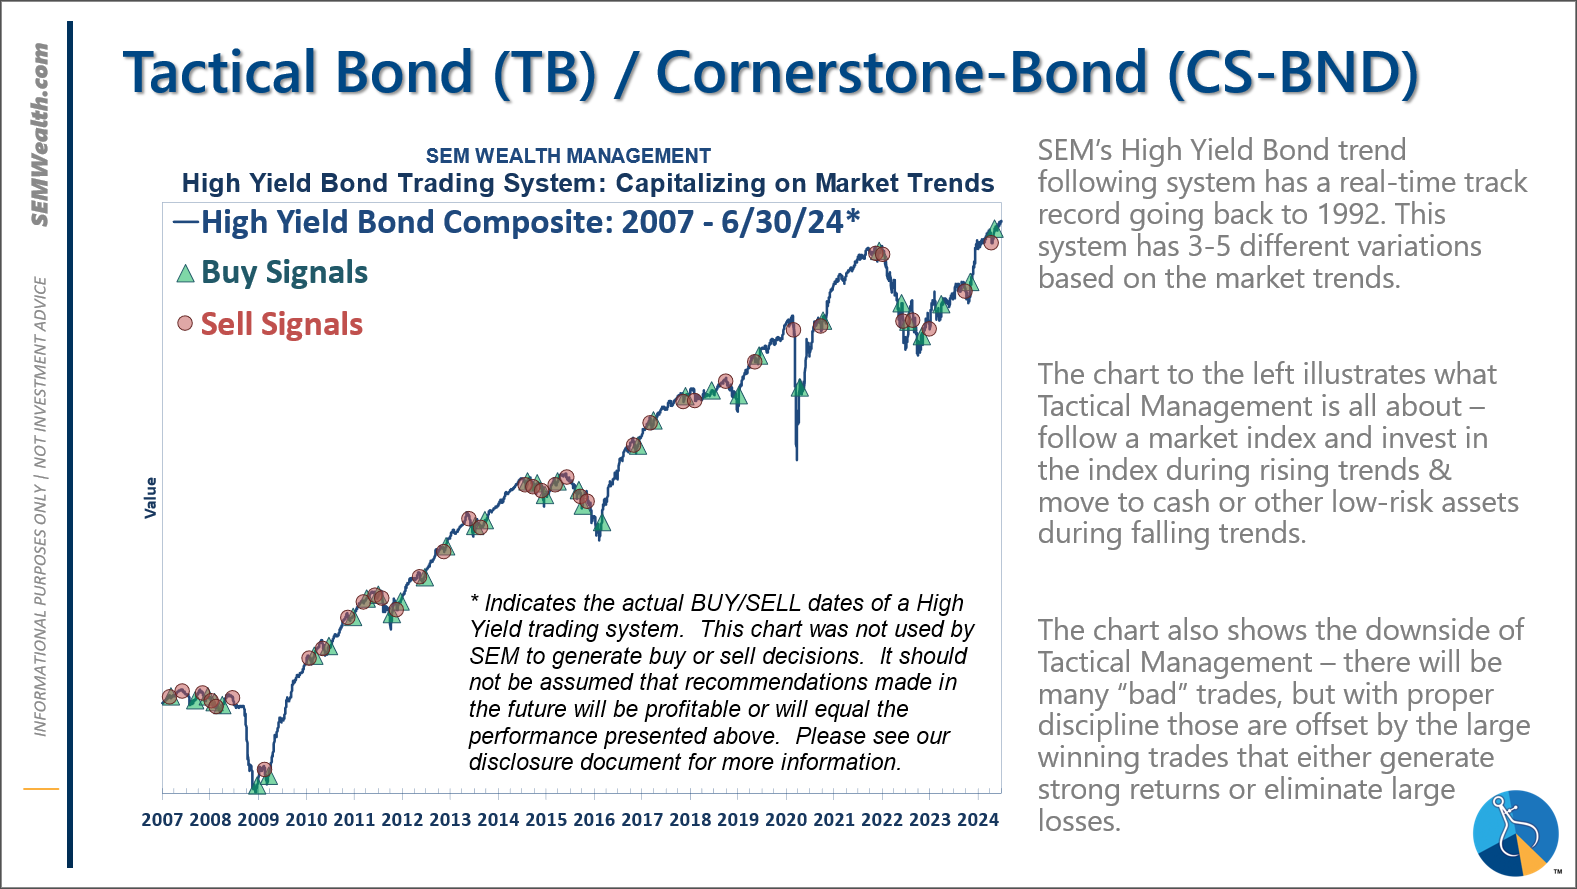
-Tactical High Yield had a partial buy signal on 5/6/24, reversing some of the sells on 4/16 & 17/2024 - the other portion of the signal remains on a sell as high yields continue to oscillate.
-Dynamic Models are 'neutral' as of 6/7/24, reversing the half 'bearish' signal from 5/3/2024. *NEW* 7/8/24 - interest rate model filled from partially bearish to partially bullish (lower long-term rates).
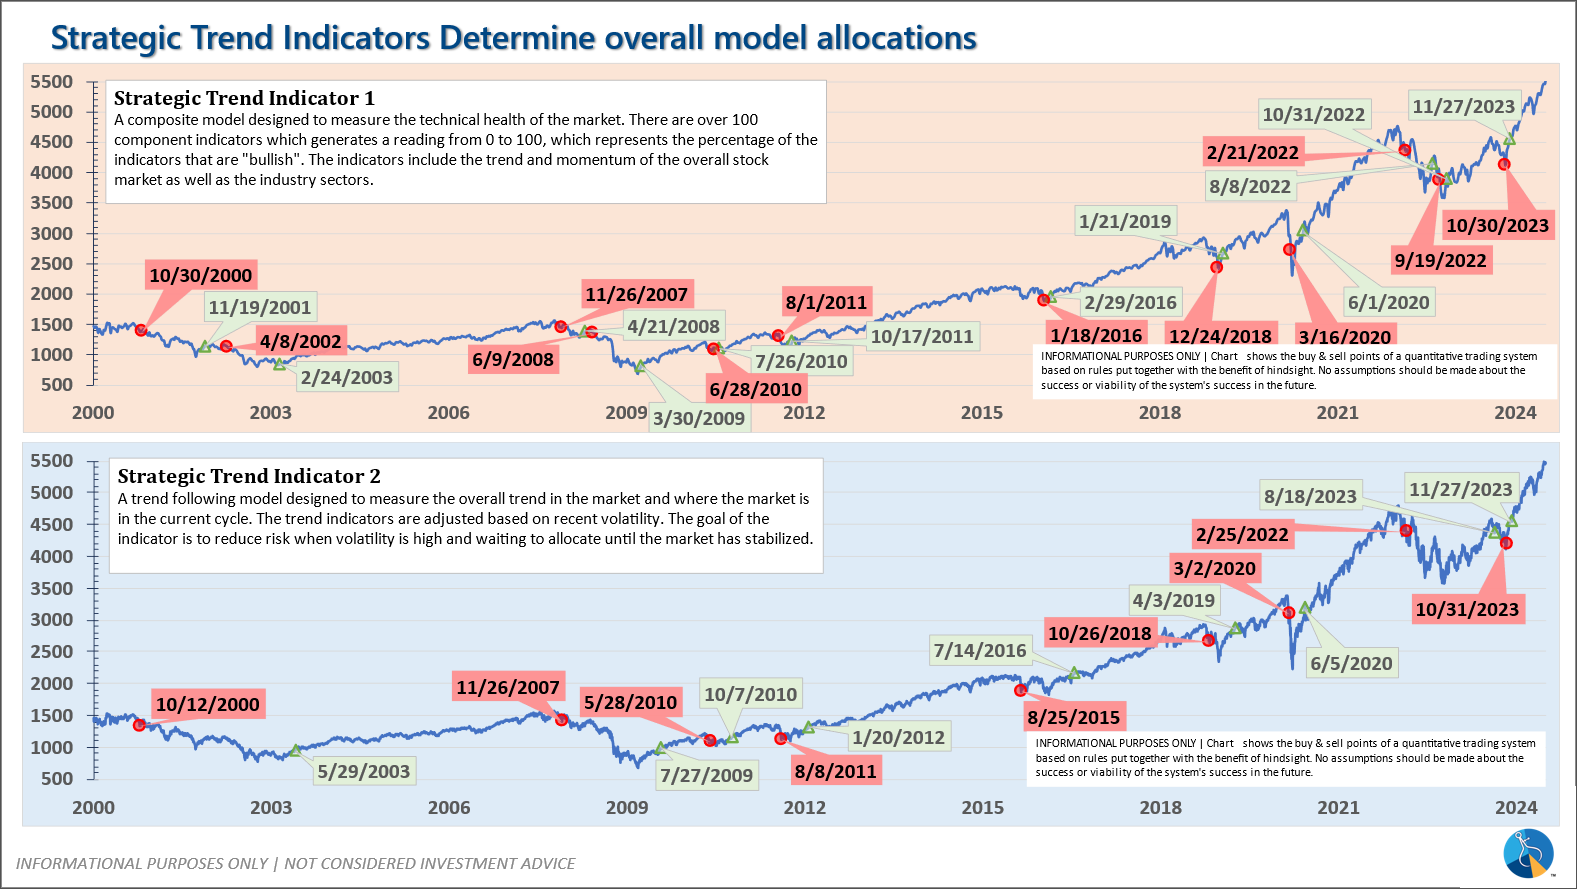
-Strategic Trend Models went on a buy 11/27/2023; *NEW* 7/8/24 – small and mid-cap positions eliminated with latest Core Rotation System update – money shifted to Large Cap Value (Dividend Growth) & International Funds
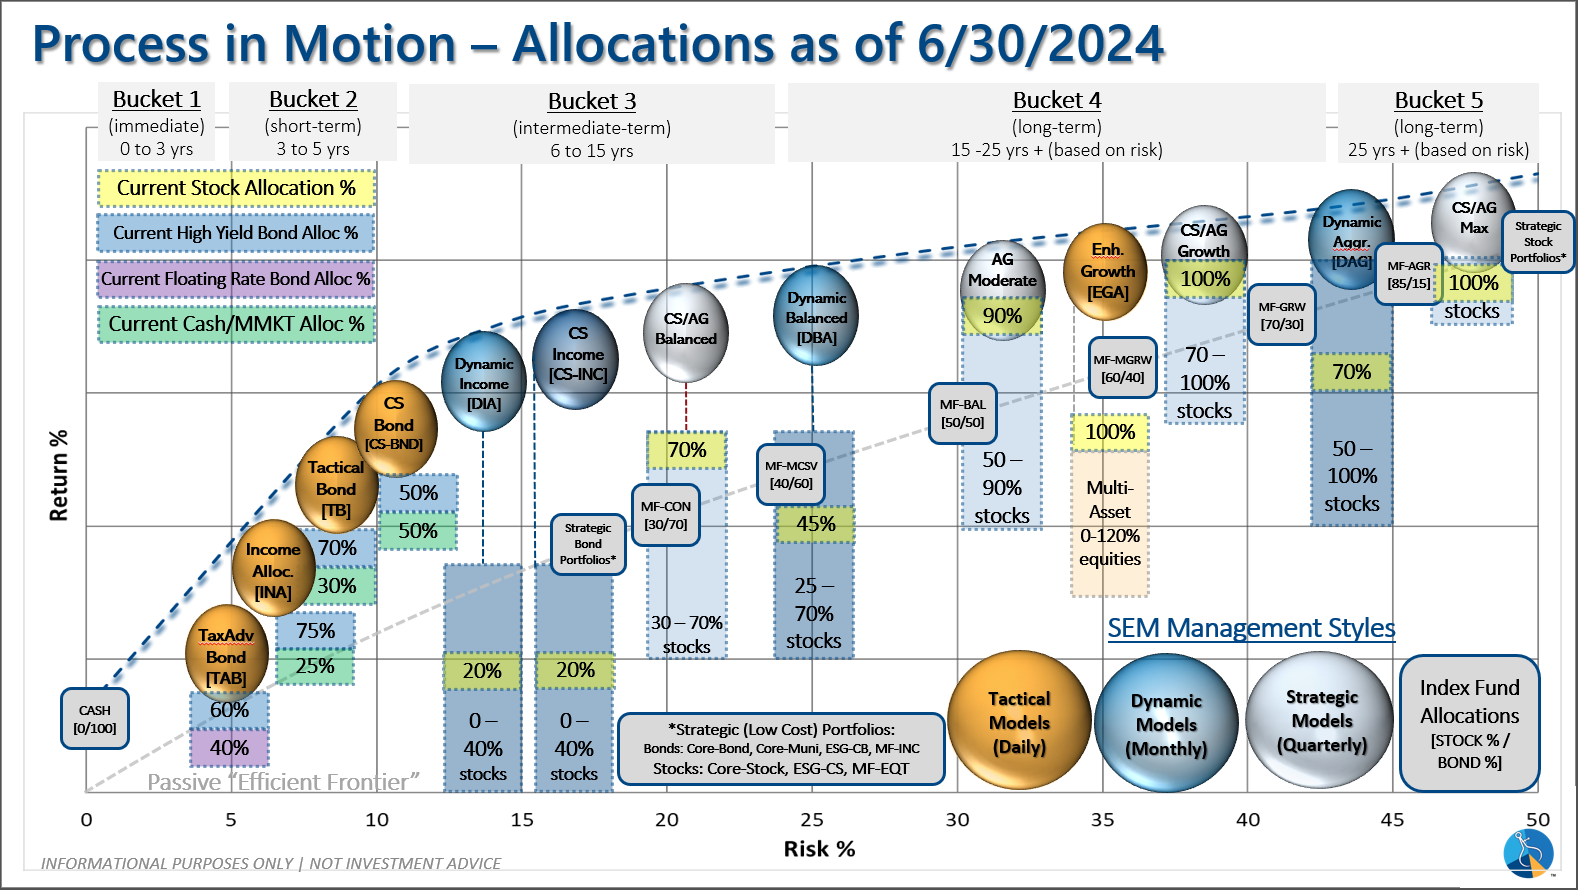
SEM deploys 3 distinct approaches – Tactical, Dynamic, and Strategic. These systems have been described as 'daily, monthly, quarterly' given how often they may make adjustments. Here is where they each stand.
Tactical (daily): On 5/6/24 about half of the signals in our high yield models switched to a buy. The other half remains in money market funds. The money market funds we are currently invested in are yielding between 4.8-5.3% annually.
Dynamic (monthly): The economic model was 'neutral' since February. In early May the model moved slightly negative, but reversed back to 'neutral' in June. This means 'benchmark' positions – 20% dividend stocks in Dynamic Income and 20% small cap stocks in Dynamic Aggressive Growth. The interest rate model is slightly 'bullish'.
Strategic (quarterly)*: BOTH Trend Systems reversed back to a buy on 11/27/2023
The core rotation is adjusted quarterly. On August 17 it rotated out of mid-cap growth and into small cap value. It also sold some large cap value to buy some large cap blend and growth. The large cap purchases were in actively managed funds with more diversification than the S&P 500 (banking on the market broadening out beyond the top 5-10 stocks.) On January 8 it rotated completely out of small cap value and mid-cap growth to purchase another broad (more diversified) large cap blend fund along with a Dividend Growth fund.
The * in quarterly is for the trend models. These models are watched daily but they trade infrequently based on readings of where each believe we are in the cycle. The trend systems can be susceptible to "whipsaws" as we saw with the recent sell and buy signals at the end of October and November. The goal of the systems is to miss major downturns in the market. Risks are high when the market has been stampeding higher as it has for most of 2023. This means sometimes selling too soon. As we saw with the recent trade, the systems can quickly reverse if they are wrong.
Overall, this is how our various models stack up based on the last allocation change:
Questions or comments - drop us a note?
Curious if your current investment allocation aligns with your overall objectives and risk tolerance? Take our risk questionnaire


