
Over the past 10 days, we've seen a lot of headlines which read, "stocks post best (worst) day since (2022 or 2020 or even 2008)." This has obviously created a lot more contact with SEM and our advisors regarding the state of the markets or the economy. We've enjoyed several of the best 12-18 month runs in the market ever over the past four years, so large one, two, or three day drops in the market obviously can cause some anxiety.
The increased concerns over the big moves in the market is completely natural. This is a good time to again look at my favorite chart and quote which describes the movement of the market.
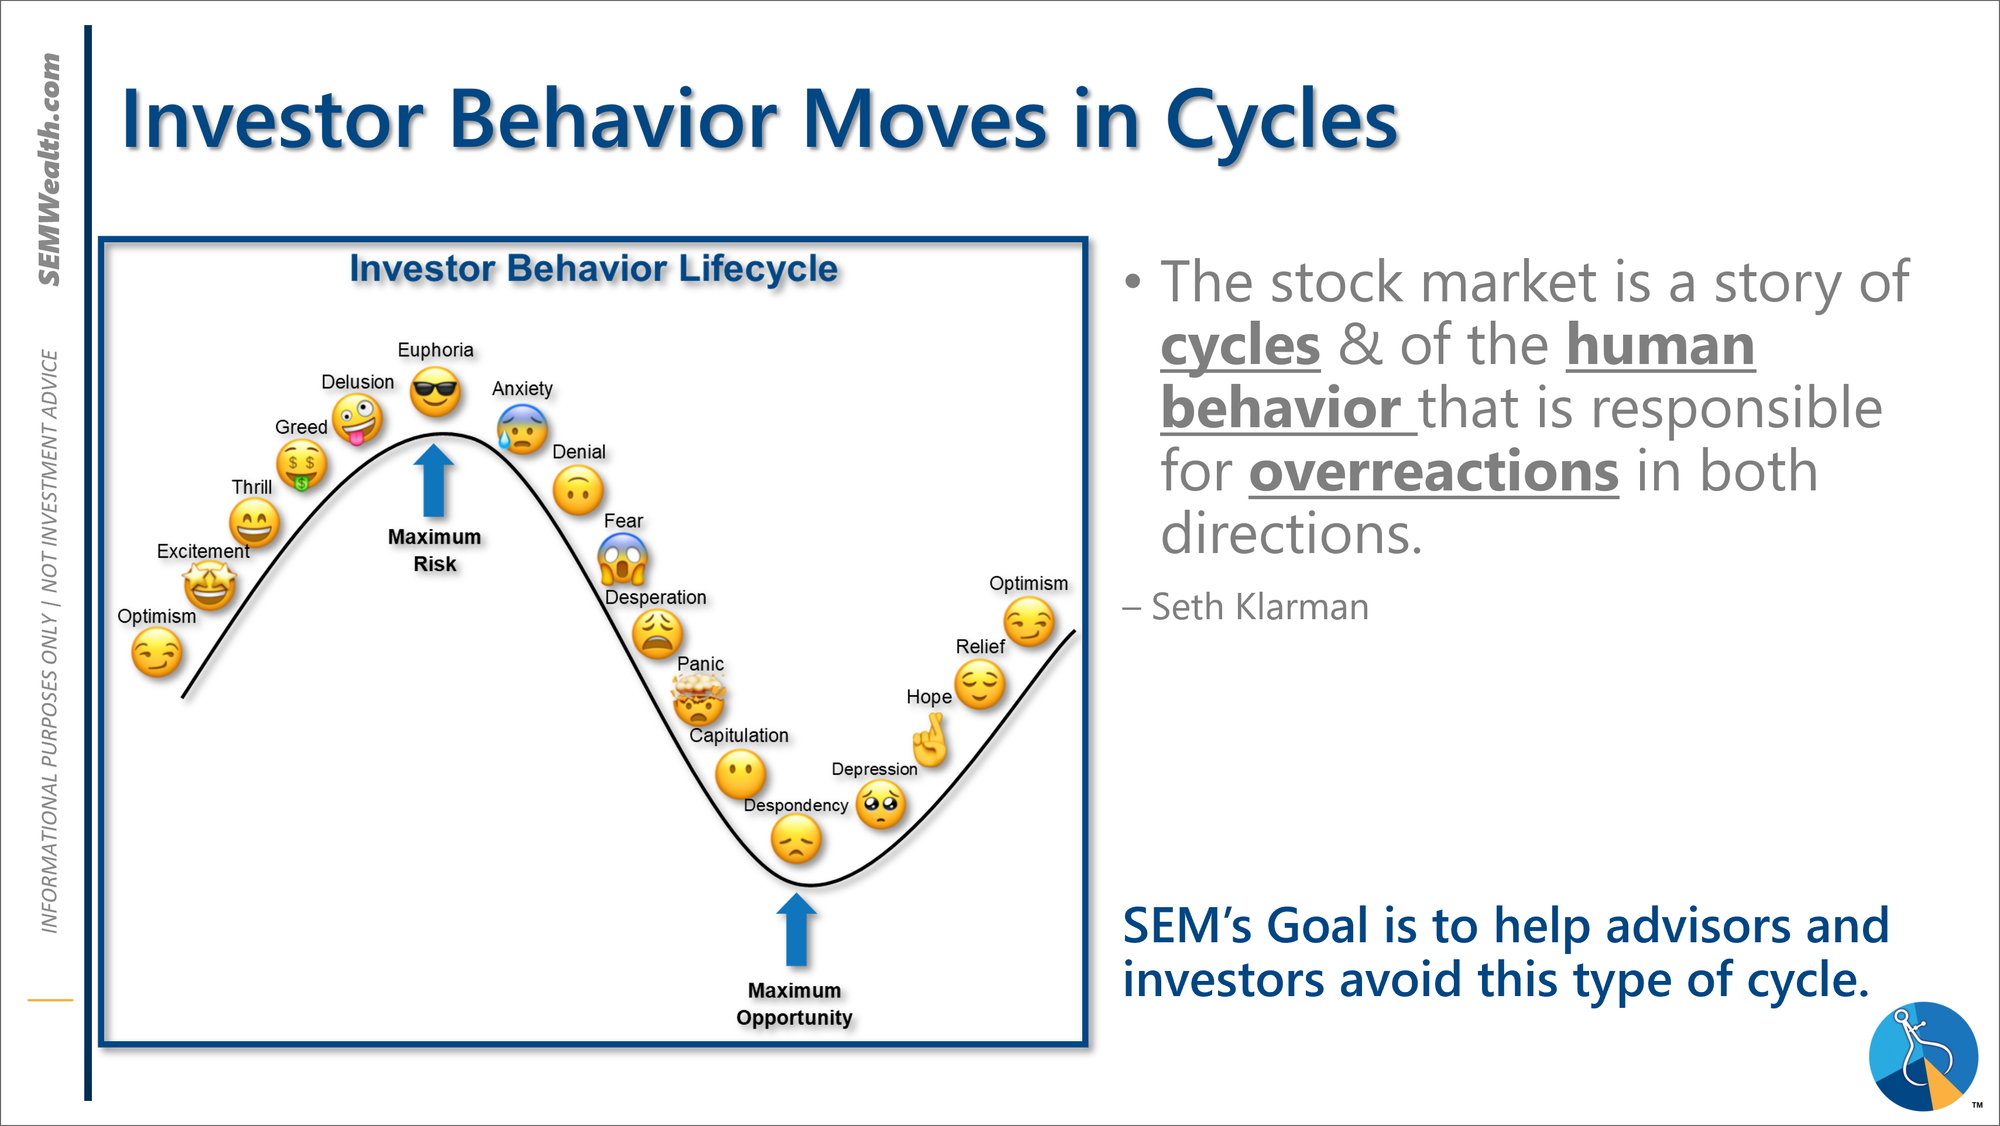
I don't want to minimize any emotions our clients, advisors, or readers are feeling. It is normal to feel stress when we see the market move like this. What is important is to not let this natural behavior impact your decisions. We've seen everything from clients (or advisors) asking why we weren't completely in cash already, to several clients asking if they could allocate some of their managed investments to buying Nvidia stock on this dip. Mostly though the inquires were what our models were seeing and how quickly they might move to a more defensive position.
As I highlighted in last week's blog, the "big" sell-off simply took the stock market back to early May levels. That alone should have reminded us something I've been saying since May – the market rally from April-July was extremely abnormal. It makes sense the market should give some of that back because the reason for the rally was not based on any fundamental changes in the structure or direction of the economy.
The market rally was based on one thing – hope the Fed would start cutting interest rates. Never mind the reason the Fed might be cutting rates – because the economy is slowing – and what that might do to corporate earnings.
We've seen enough articles the past 10 days discussing both why we should be concerned about the economy or the stock market or why this is a "buying opportunity". Instead of wasting your time or my words, let's take a look at a few points:
1.) The economy is not heading towards a recession.
2.) The economy is also not strong enough to support the strong growth in earnings priced into the stock market.
3.) The stock market, especially large cap growth stocks is valued at levels only experienced during past market bubbles.
We discussed the current state of our economic model last week. I also think I should add one more point:
4.) The BEST days often occur in a bear market (or following some of the WORST days for the market.)
We showed the data behind this last December.
So given the 4 points above, we should EXPECT volatility as everyone adjusts to a DIFFERENT environment.
- For those who feel like they missed out on the big rallies the past four years, it is natural to believe any big drop is a buying opportunity.
- For those who probably had too much risk in their portfolio it is natural to believe any big drop is a sign it's time to get out of the market and lock in your gains.
These two opposite feelings lead to more volatility. For more on the current market environment and how SEM is positioned, check out the next two sections below.
Market Charts
I think this chart of the S&P 500 really puts things in perspective. Yes the drop was 'big', but it also did not really hurt anybody who has a long-term perspective. The market has come so far, so fast
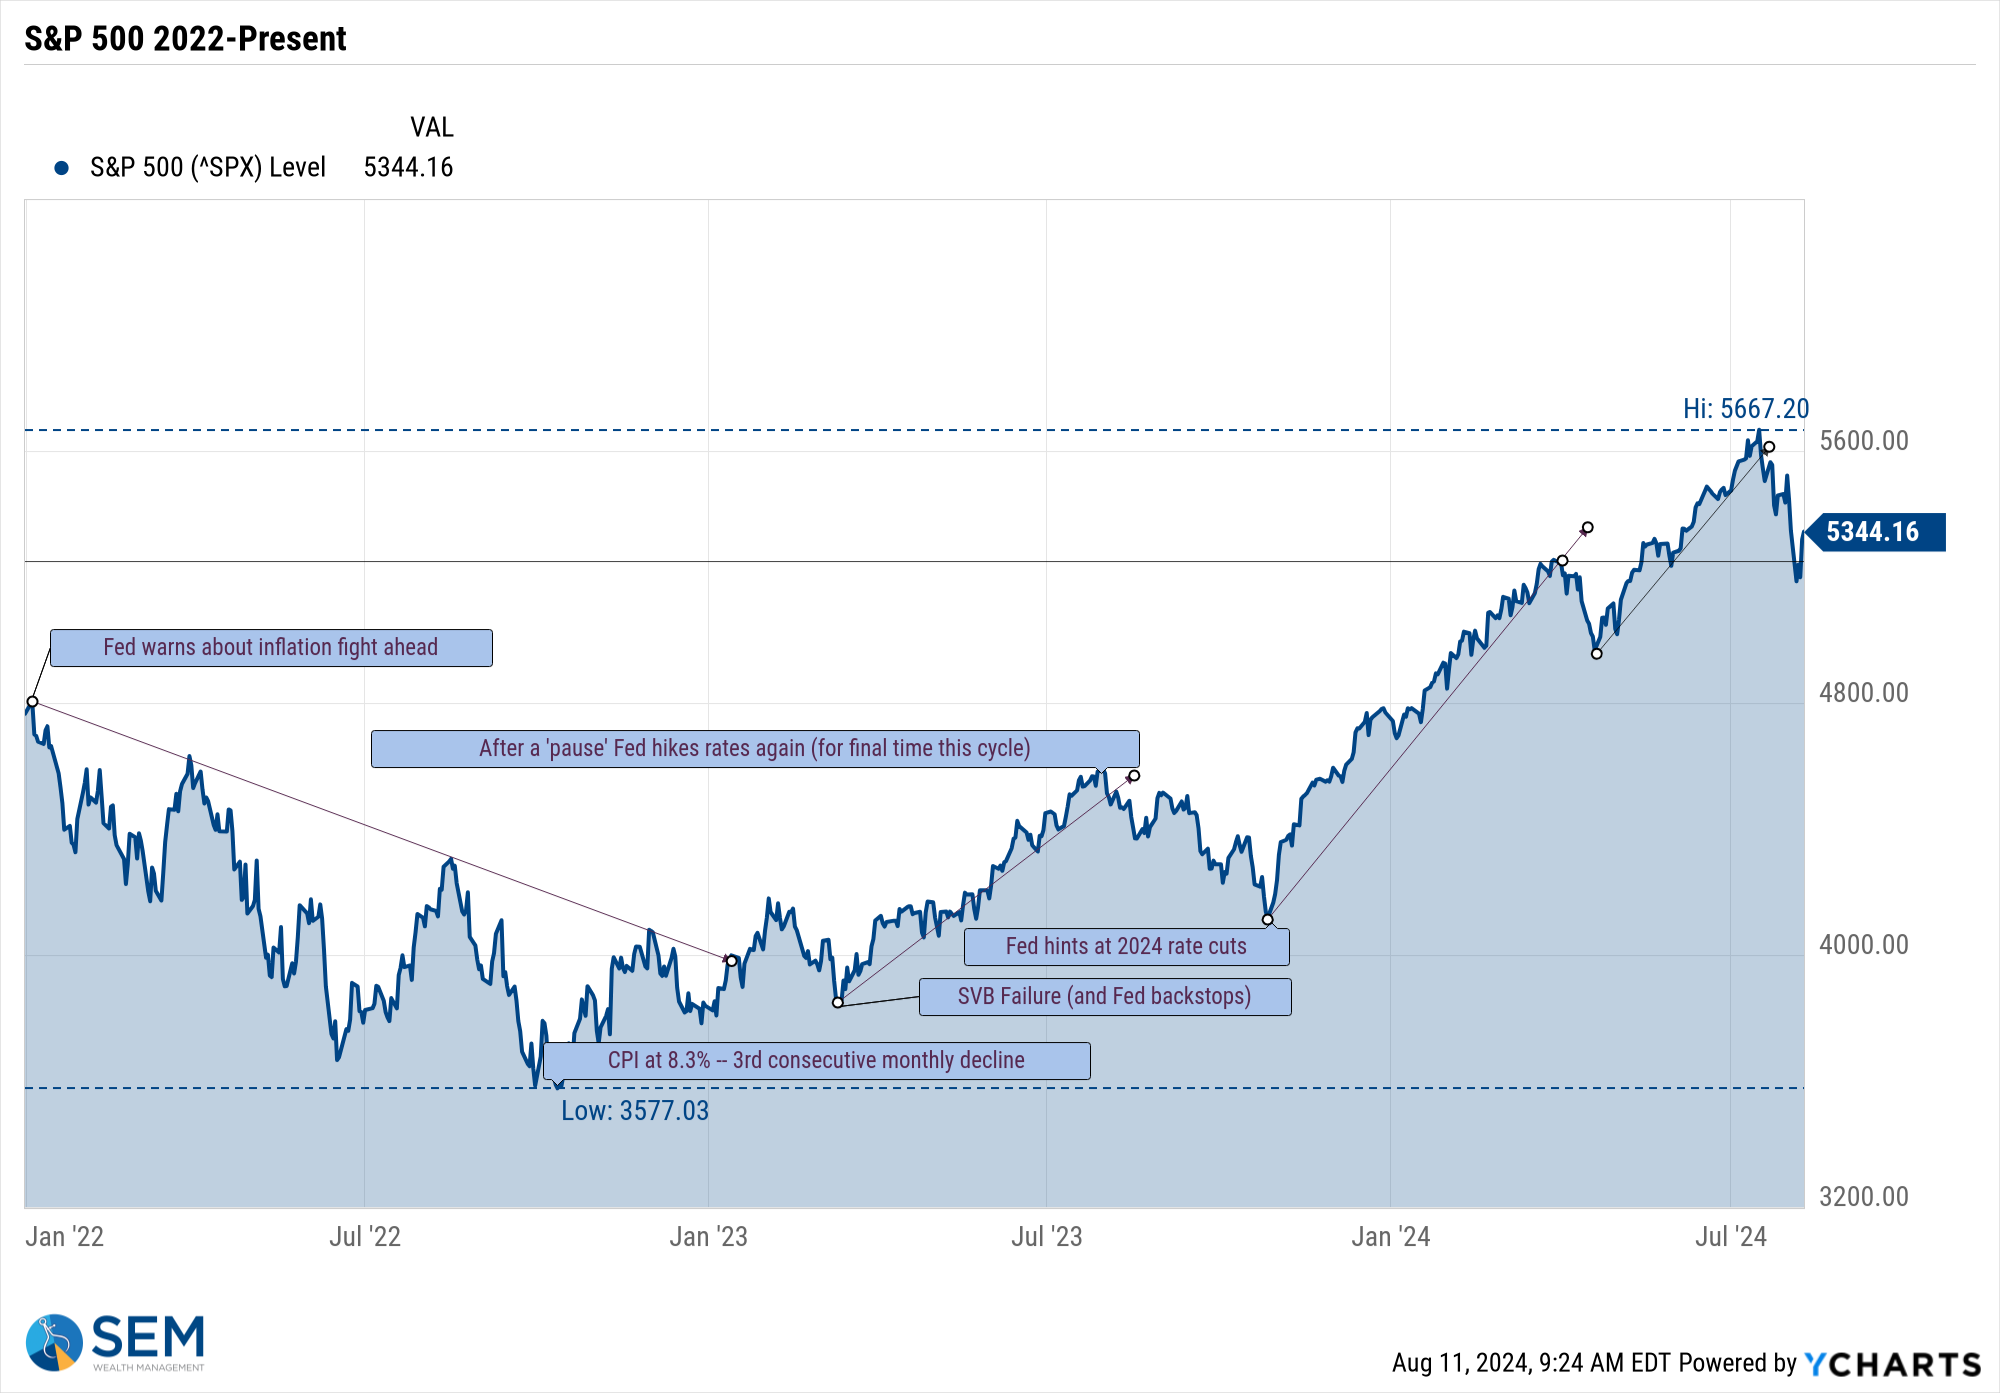
From a technical perspective, the market is 'ok' as long as it stays above approximately 4967 – which is the lows from late last year.
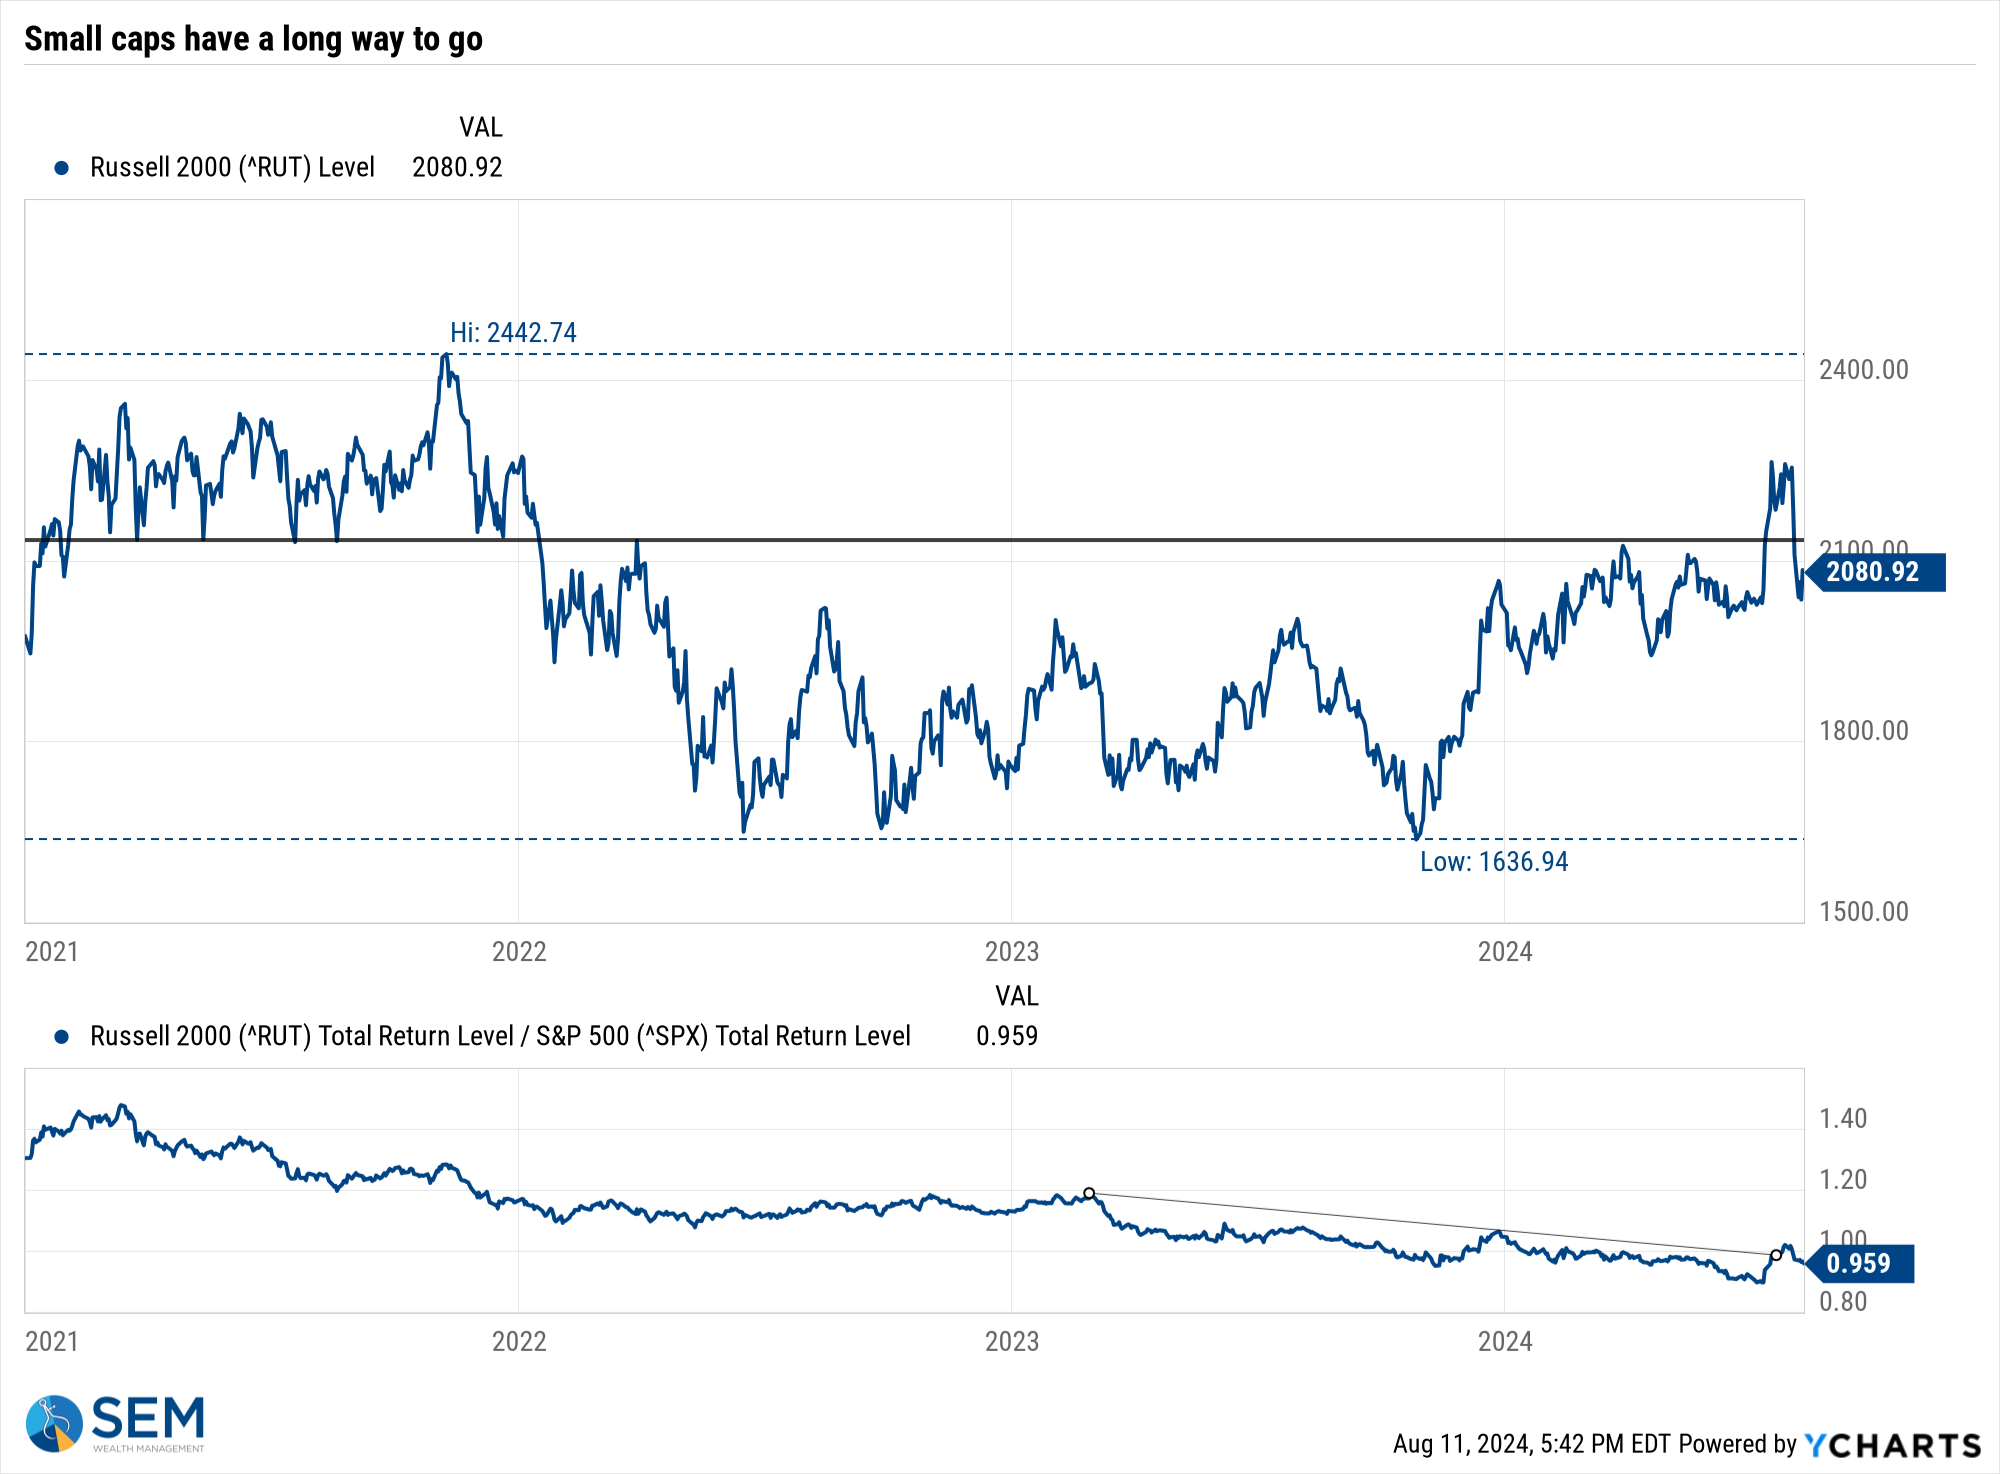
The more important area to watch is the small cap arena. After briefly enjoying some outperformance, small caps were hammered as the consensus of the market shifted to a "broadening" rally to a looming recession.
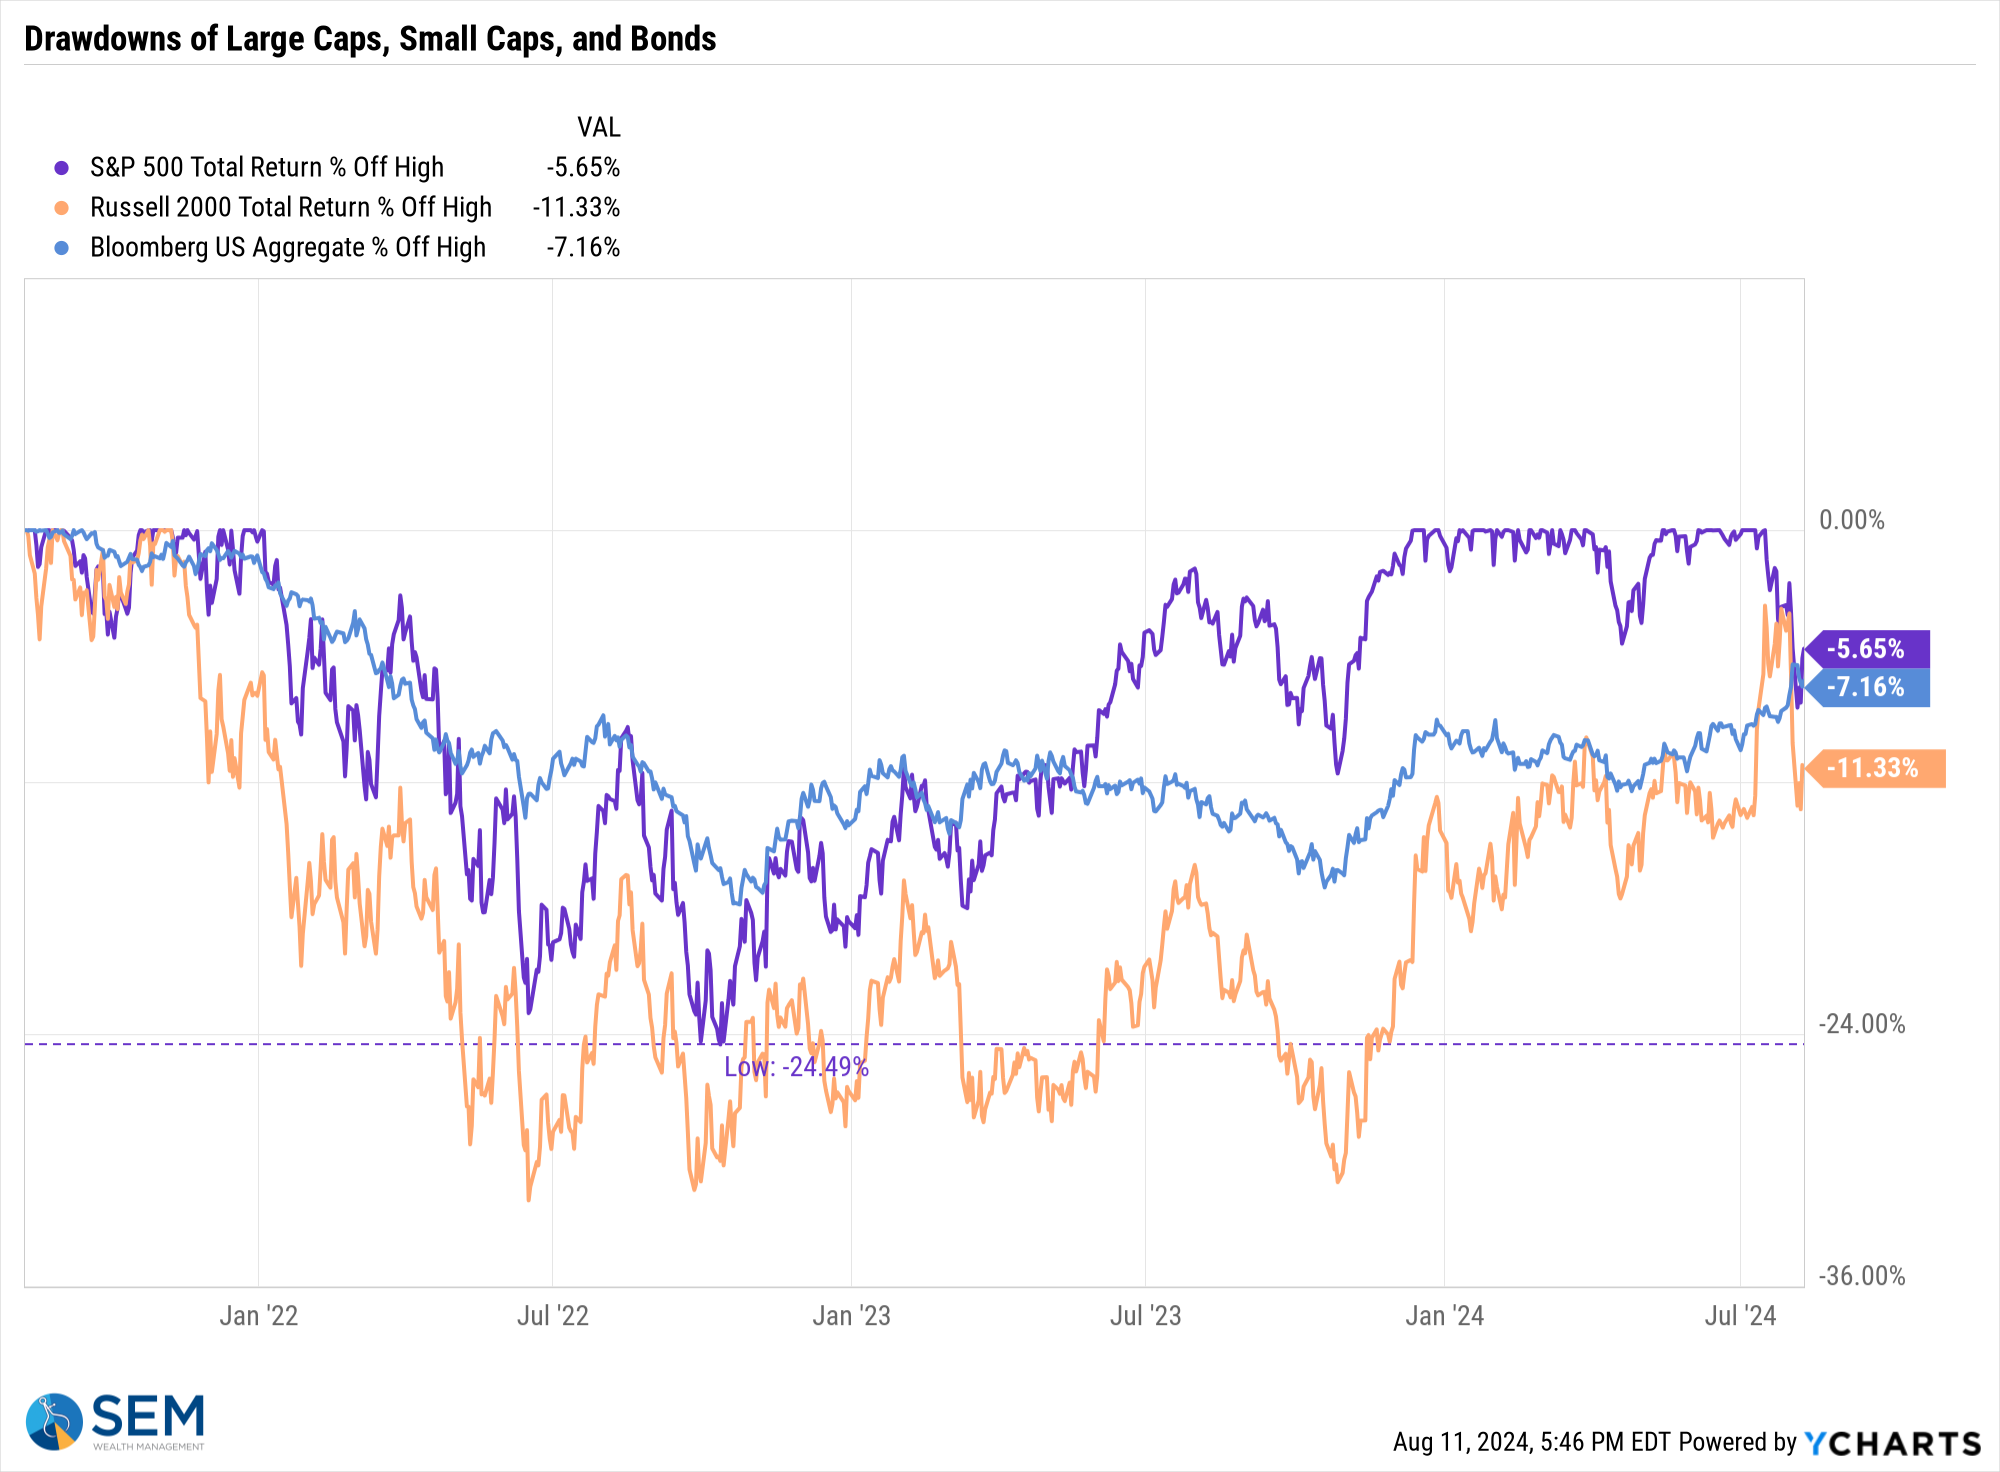
Looking at the various asset class performance since the end of 2021, we can see the huge disparity.
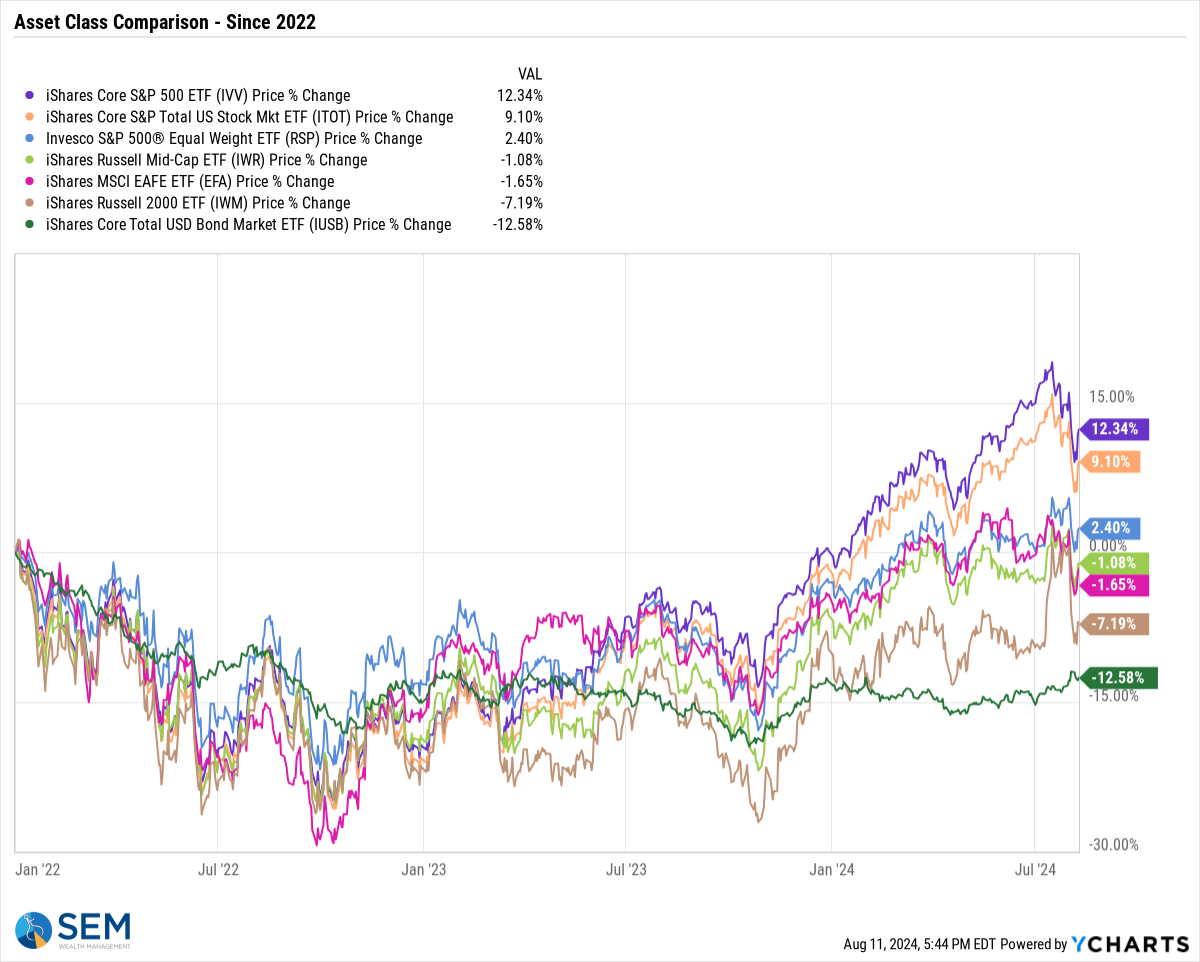
The overall stock market is only down less than 6% from its high.
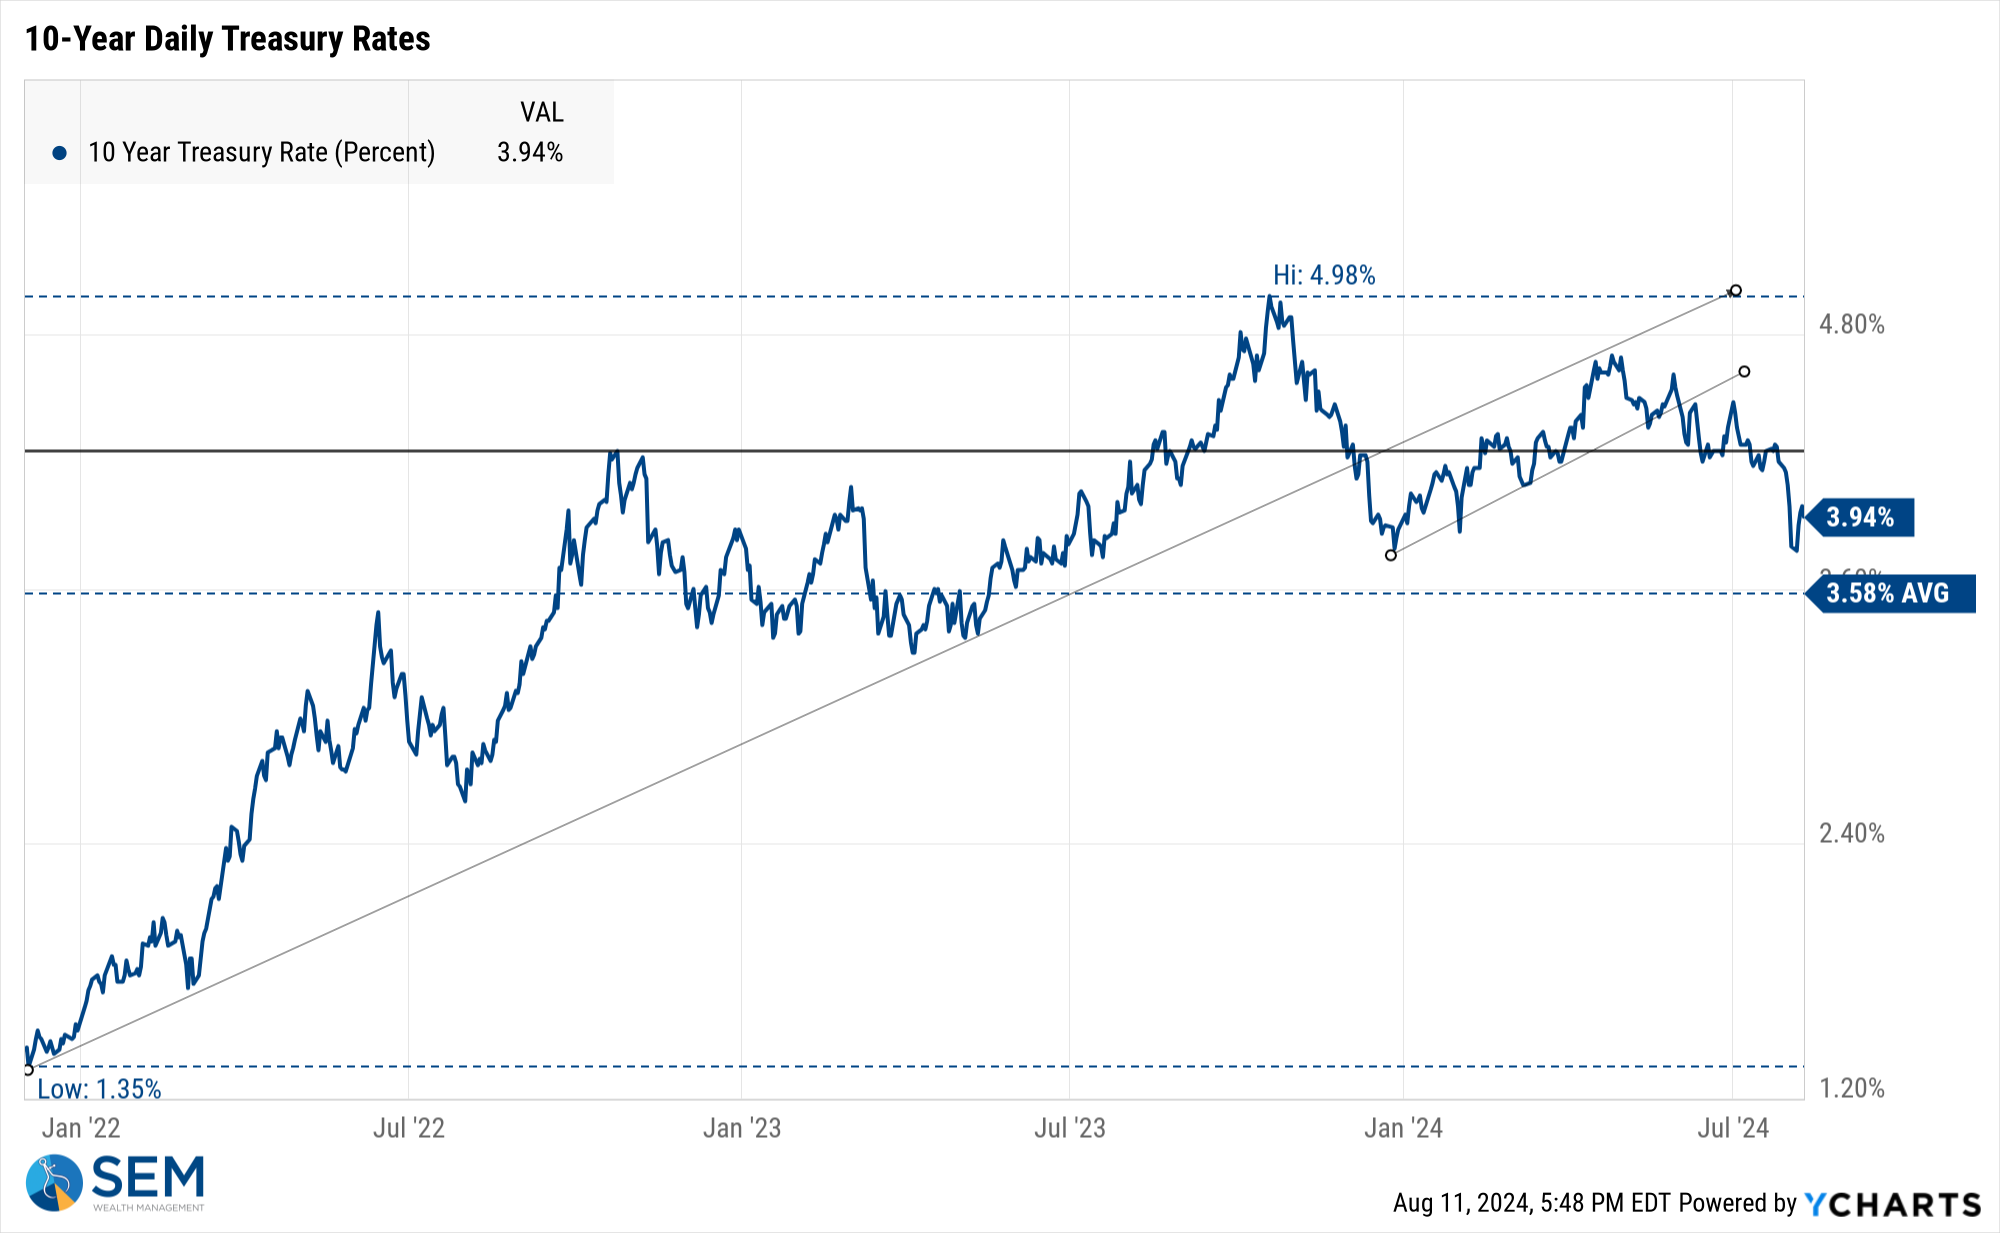
Turning to bonds, we finally saw them serving as a defensive position when stocks sold off over the last two weeks. The bond market has done a lot of the work for the Fed, cutting the rate on the 10-year Treasury nearly 1/2% since the spring.
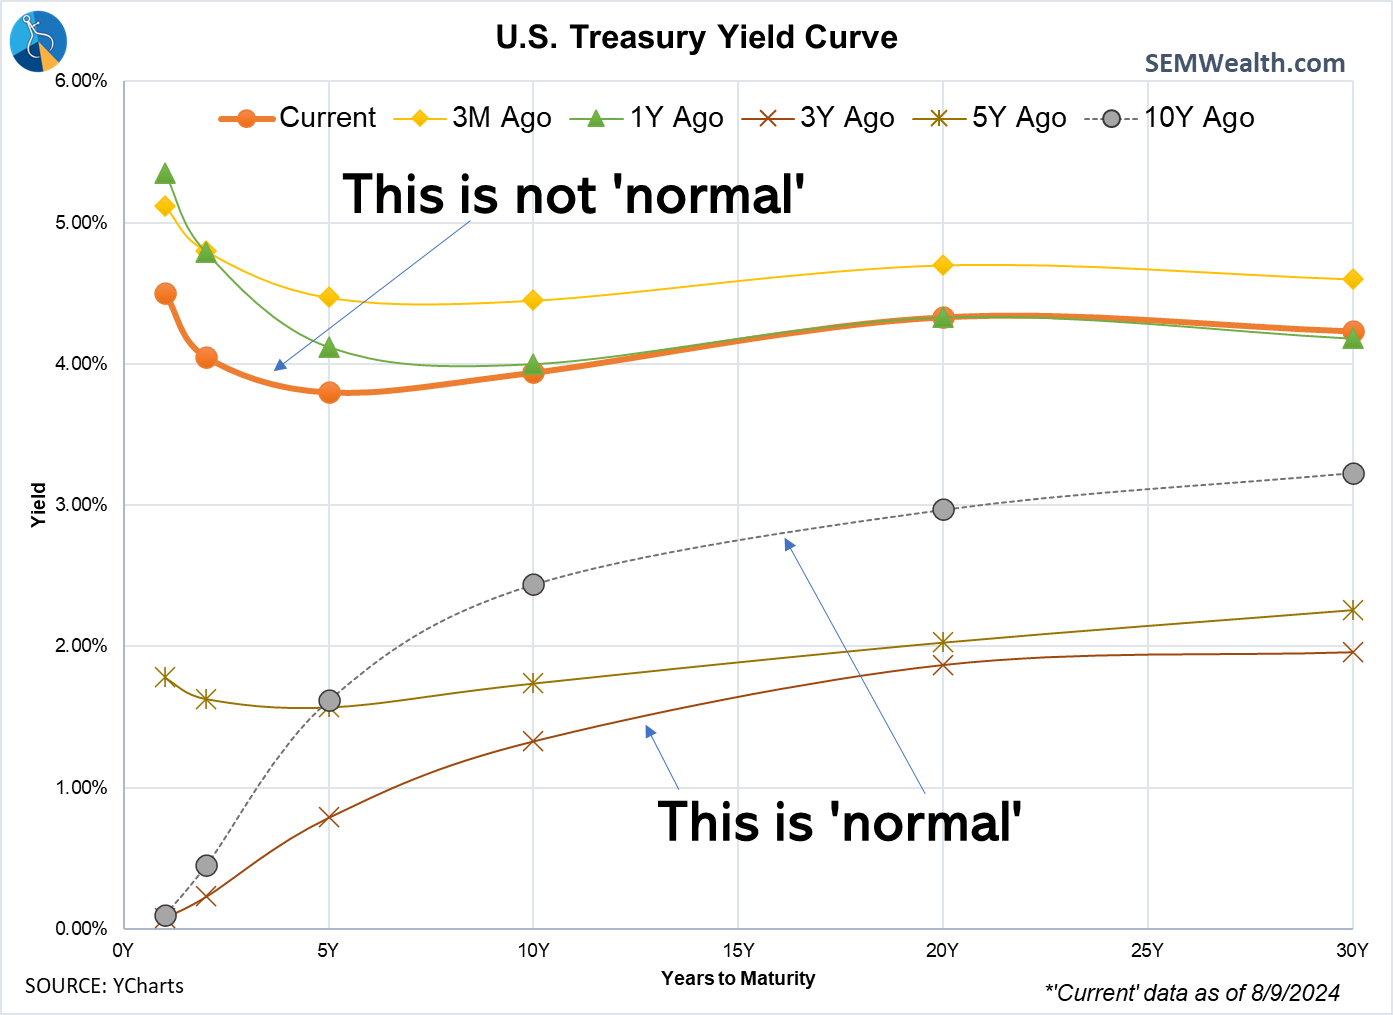
The yield curve remains "abnormal" with short-term rates higher than long-term rates, although it has gotten "less bad" recently.
I had thought going into last week we didn't have any major economic news which could sway the market. Apparently I was wrong as the weekly jobless claims number sparked the best rally since 2022 for stocks. The fact initial claims moved lower last week does not change the fact the trend is higher & more importantly the continuing claims continue to show more strain in the economy.
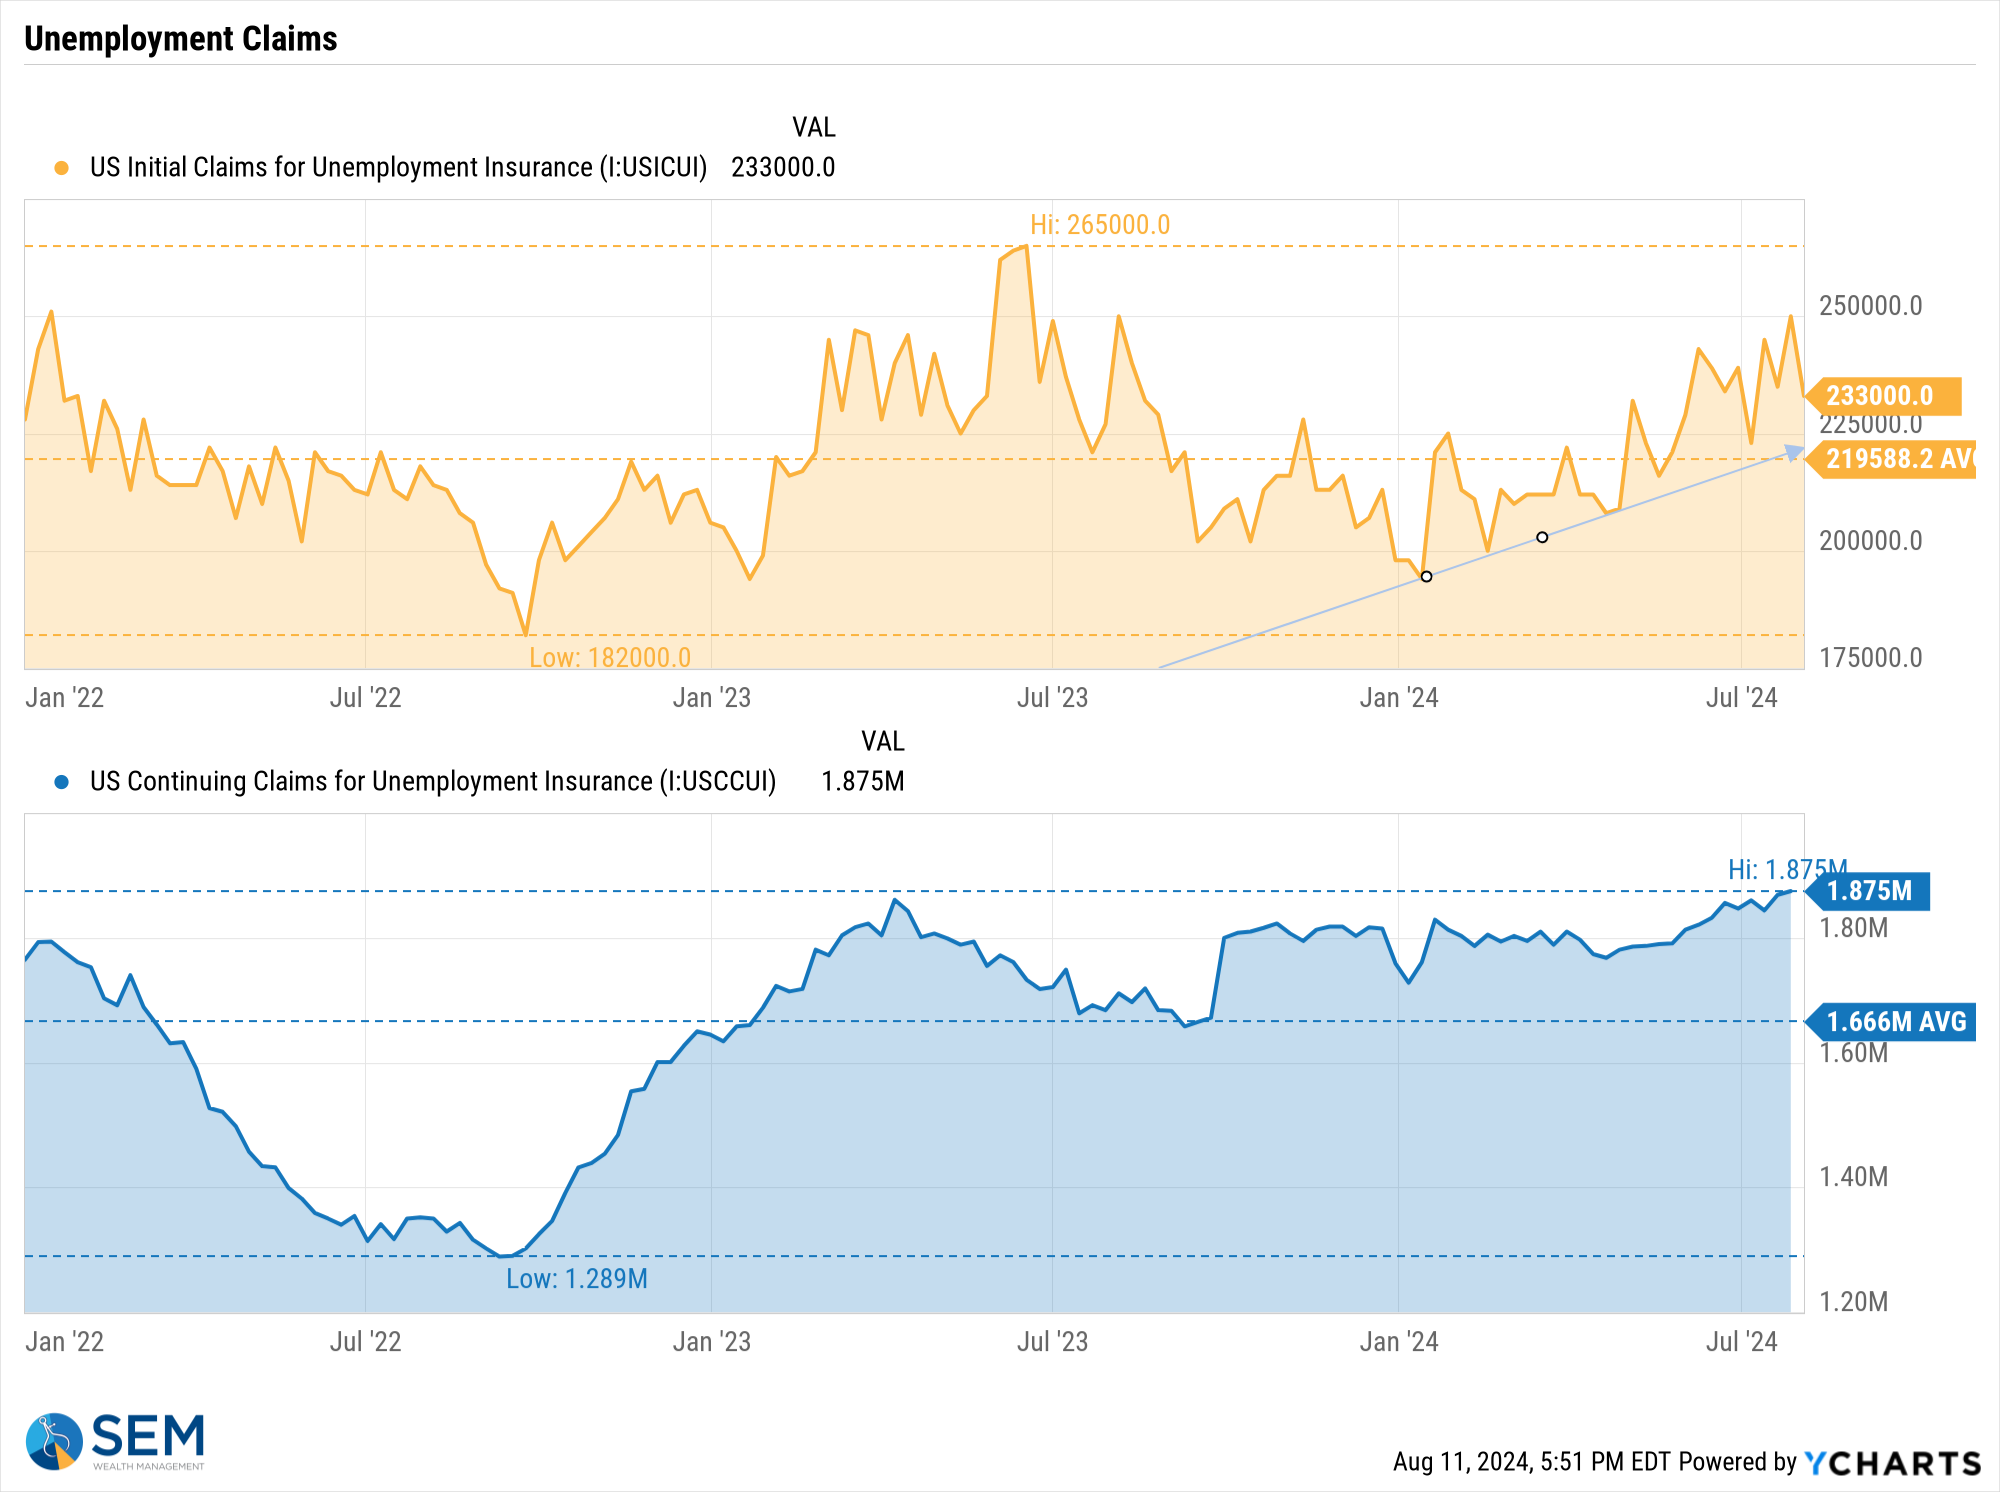
Apparently we'll need to watch this report every Thursday morning until the fears over the Fed waiting too long to cut rates abate.
SEM Model Positioning
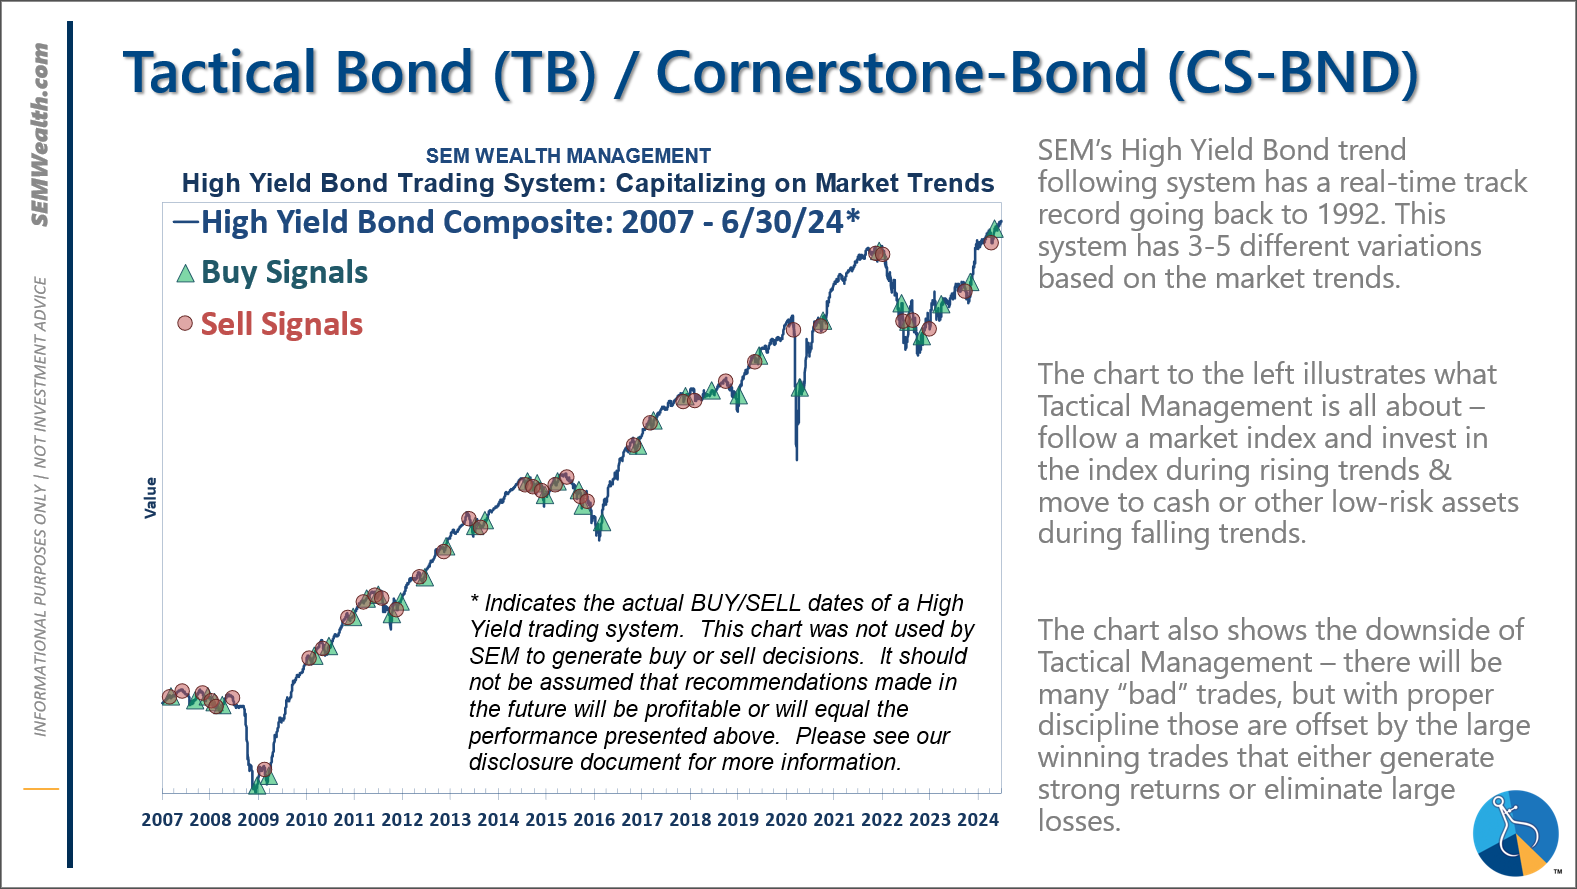
-Tactical High Yield had a partial buy signal on 5/6/24, reversing some of the sells on 4/16 & 17/2024 - the other portion of the signal remains on a sell as high yields continue to oscillate.
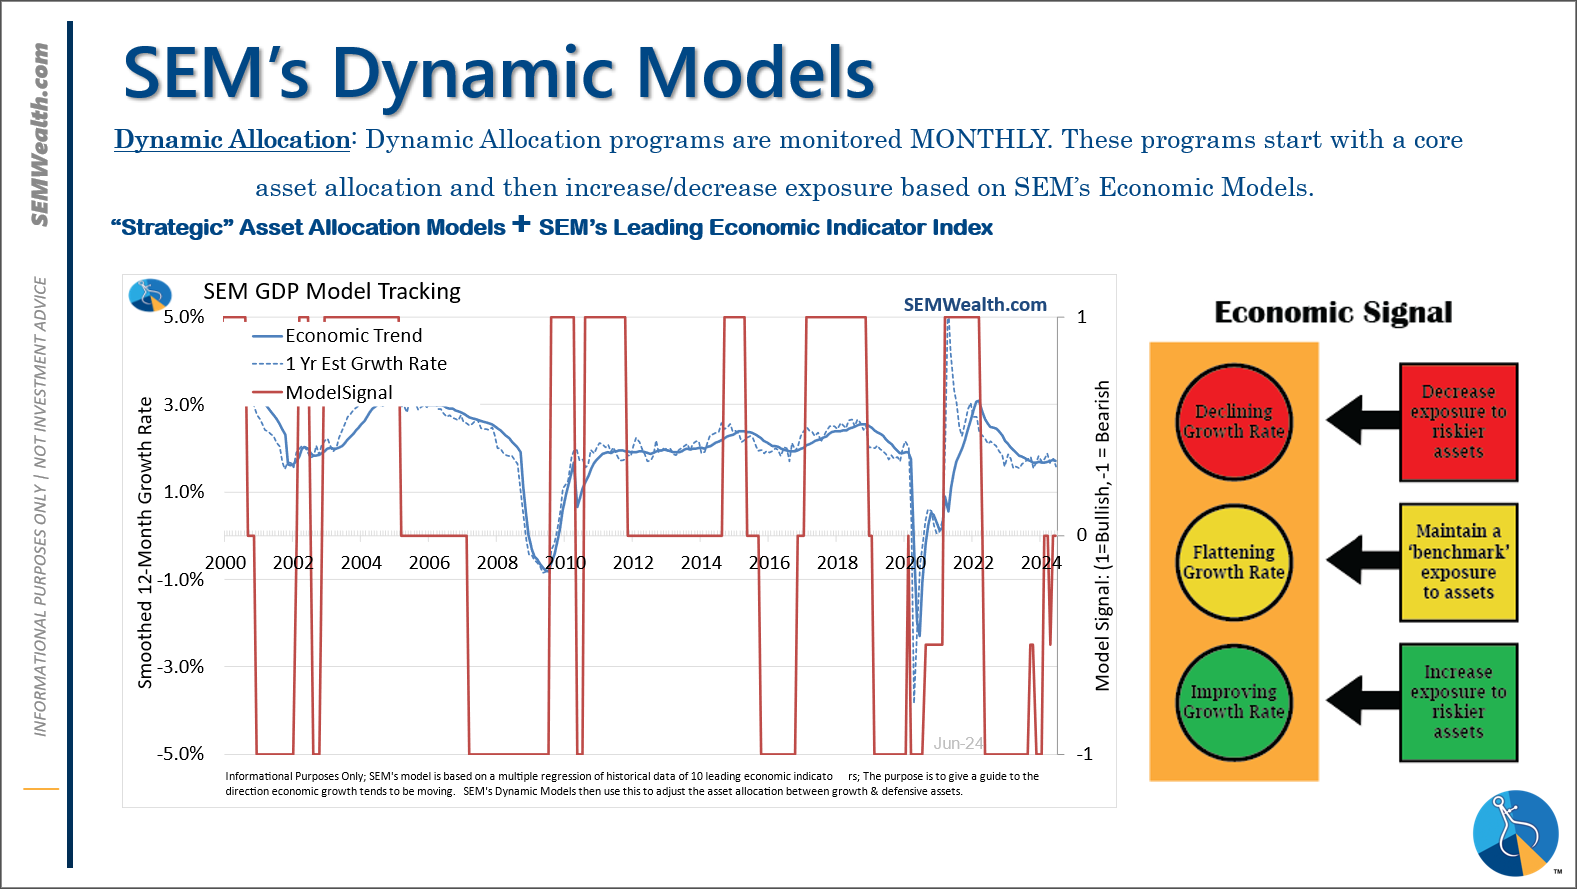
-Dynamic Models are 'neutral' as of 6/7/24, reversing the half 'bearish' signal from 5/3/2024. *NEW* 7/8/24 - interest rate model filled from partially bearish to partially bullish (lower long-term rates).
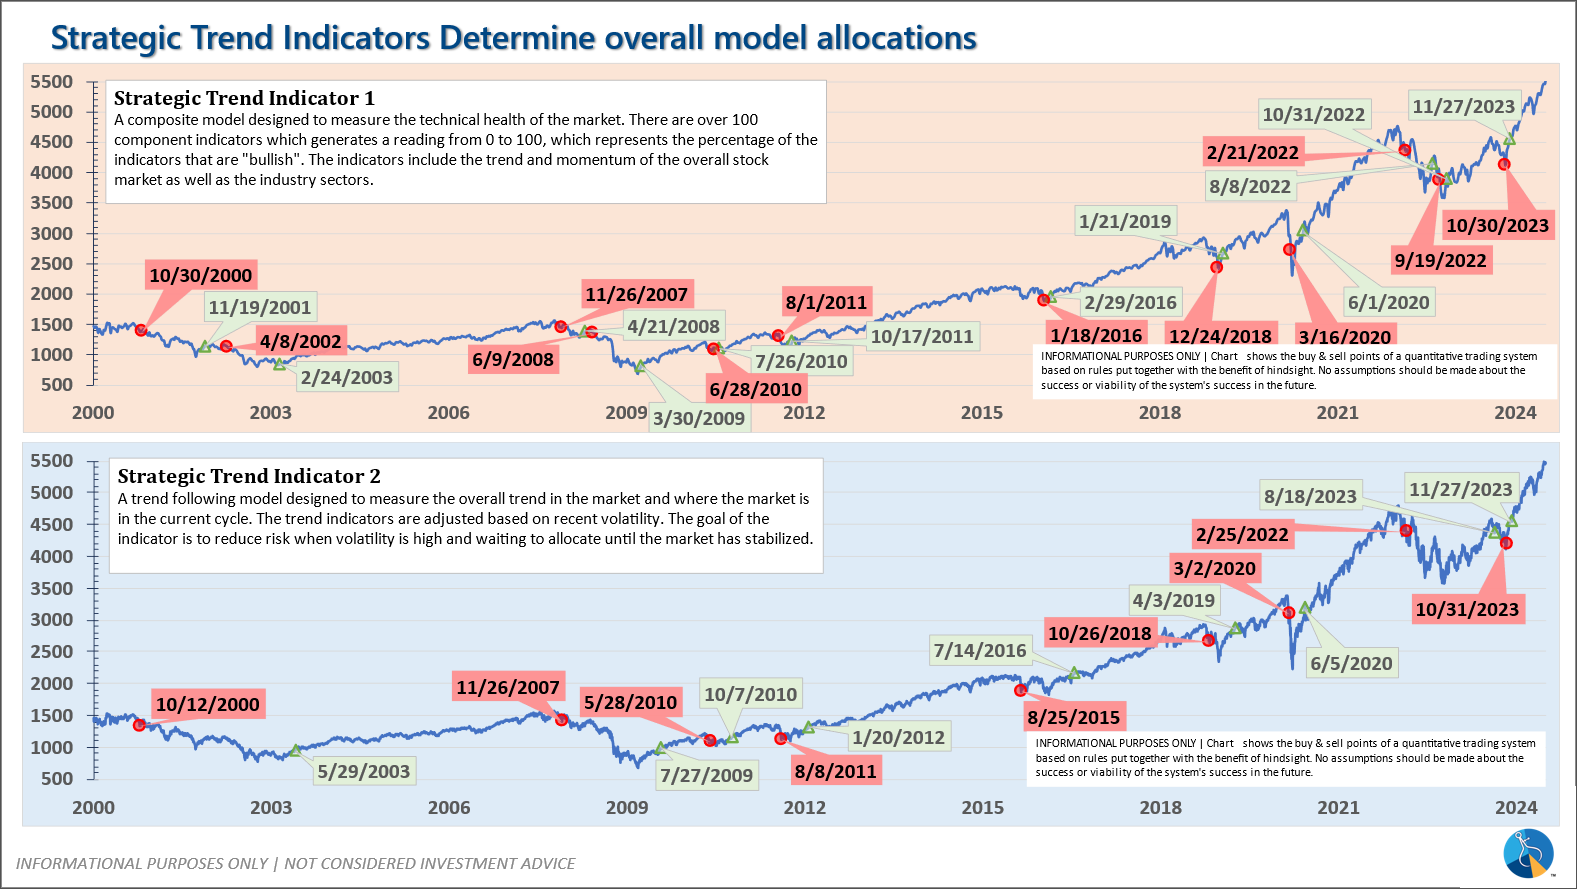
-Strategic Trend Models went on a buy 11/27/2023; *NEW* 7/8/24 – small and mid-cap positions eliminated with latest Core Rotation System update – money shifted to Large Cap Value (Dividend Growth) & International Funds
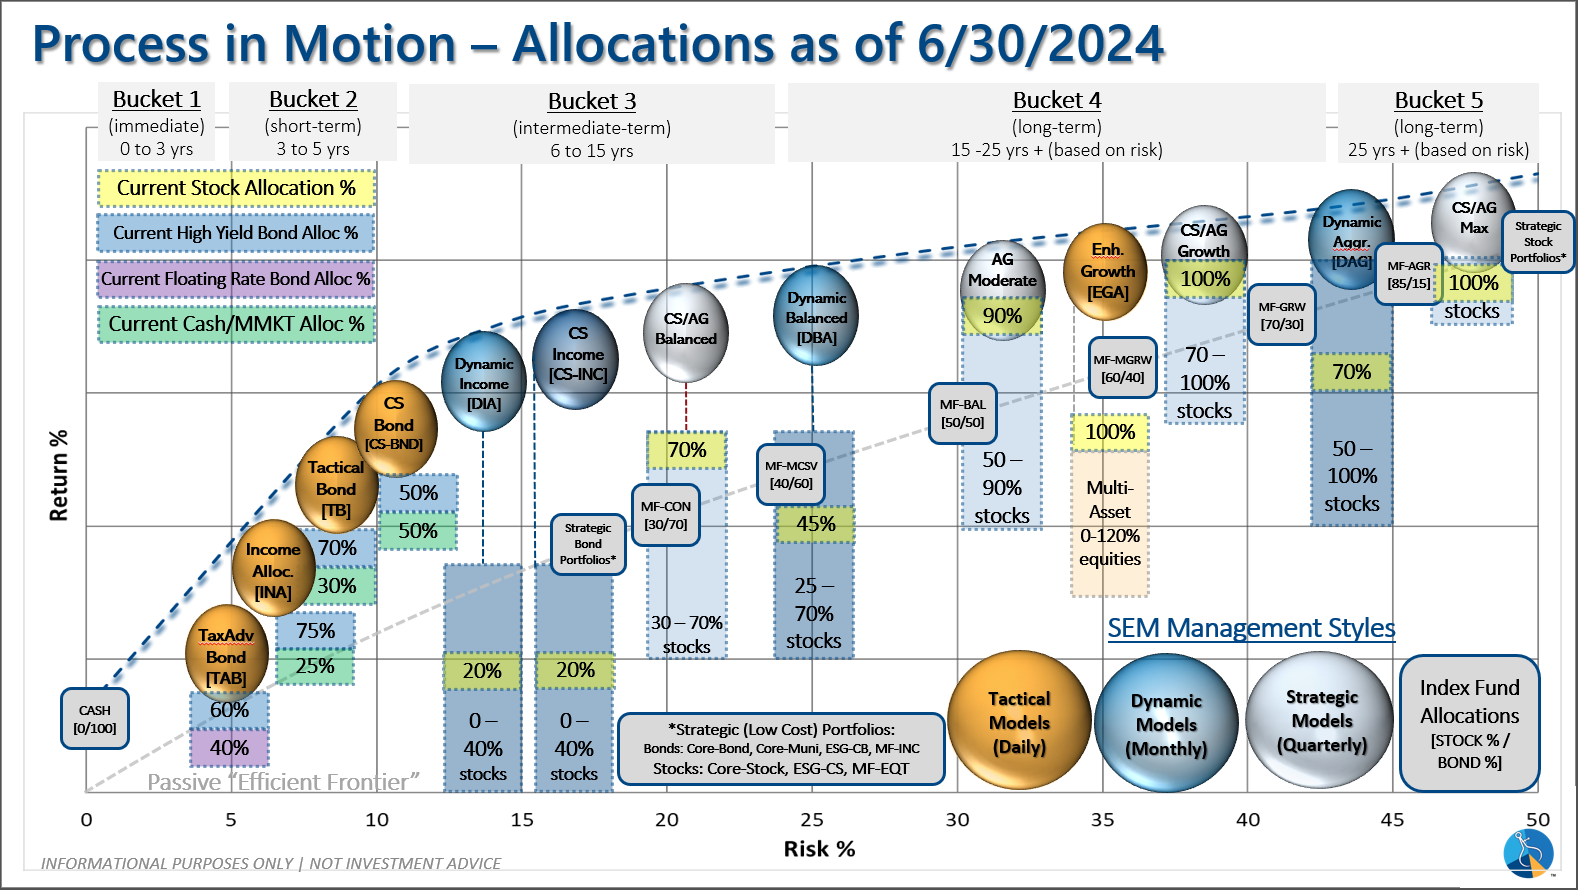
SEM deploys 3 distinct approaches – Tactical, Dynamic, and Strategic. These systems have been described as 'daily, monthly, quarterly' given how often they may make adjustments. Here is where they each stand.
Tactical (daily): On 5/6/24 about half of the signals in our high yield models switched to a buy. The other half remains in money market funds. The money market funds we are currently invested in are yielding between 4.8-5.3% annually.
Dynamic (monthly): The economic model was 'neutral' since February. In early May the model moved slightly negative, but reversed back to 'neutral' in June. This means 'benchmark' positions – 20% dividend stocks in Dynamic Income and 20% small cap stocks in Dynamic Aggressive Growth. The interest rate model is slightly 'bullish'.
Strategic (quarterly)*: BOTH Trend Systems reversed back to a buy on 11/27/2023
The core rotation is adjusted quarterly. On August 17 it rotated out of mid-cap growth and into small cap value. It also sold some large cap value to buy some large cap blend and growth. The large cap purchases were in actively managed funds with more diversification than the S&P 500 (banking on the market broadening out beyond the top 5-10 stocks.) On January 8 it rotated completely out of small cap value and mid-cap growth to purchase another broad (more diversified) large cap blend fund along with a Dividend Growth fund.
The * in quarterly is for the trend models. These models are watched daily but they trade infrequently based on readings of where each believe we are in the cycle. The trend systems can be susceptible to "whipsaws" as we saw with the recent sell and buy signals at the end of October and November. The goal of the systems is to miss major downturns in the market. Risks are high when the market has been stampeding higher as it has for most of 2023. This means sometimes selling too soon. As we saw with the recent trade, the systems can quickly reverse if they are wrong.
Overall, this is how our various models stack up based on the last allocation change:
Questions or comments - drop us a note?
Curious if your current investment allocation aligns with your overall objectives and risk tolerance? Take our risk questionnaire


