The time around Christmas and New Years can be stressful for many people. Thankfully for me, my wife is well organized and takes care of most of the holiday prep work throughout the year. Our workload at SEM is always much busier, but our systematized approach and heavy use of technology allows us to efficiently handle the myriad last-minute requests which inevitably flood in.
This is also a time where most of our advisors take anywhere from 1 to 2 weeks off, which allows me more time to clean-up projects I've had on my to-do list all year or to start focusing on the year ahead. Based on the out-of-office emails I've received over the past week, I'm not sure how many people will be reading this blog, so I'll reserve the detailed 'musings' for next week as we start 2024.
Last week, I was in an advisor's office and saw on the wall one of the most overused and misunderstood tables when it comes to investing. The author of the table was a well-known mutual fund and ETF provider who spends millions of dollars each year telling everyone to stay invested (which directly benefits their funds).
If you miss the 10 Best Days of the Year.......
I've seen this title in many formats the last 25+ years of my career. It is most certainly true that if you missed just those 10 days every year you would have horrible performance and miss out on all the good things about the stock market. However, it completely masks the volatility and risks of investing. Some people simply cannot afford or stomach the wild swings of the stock market while others simply do not need to put themselves through that kind of stress.
Here's a different way to frame the question:
What if you missed the 10 WORST Days of the Year?
Nobody seems to be asking that question. Here's the data:
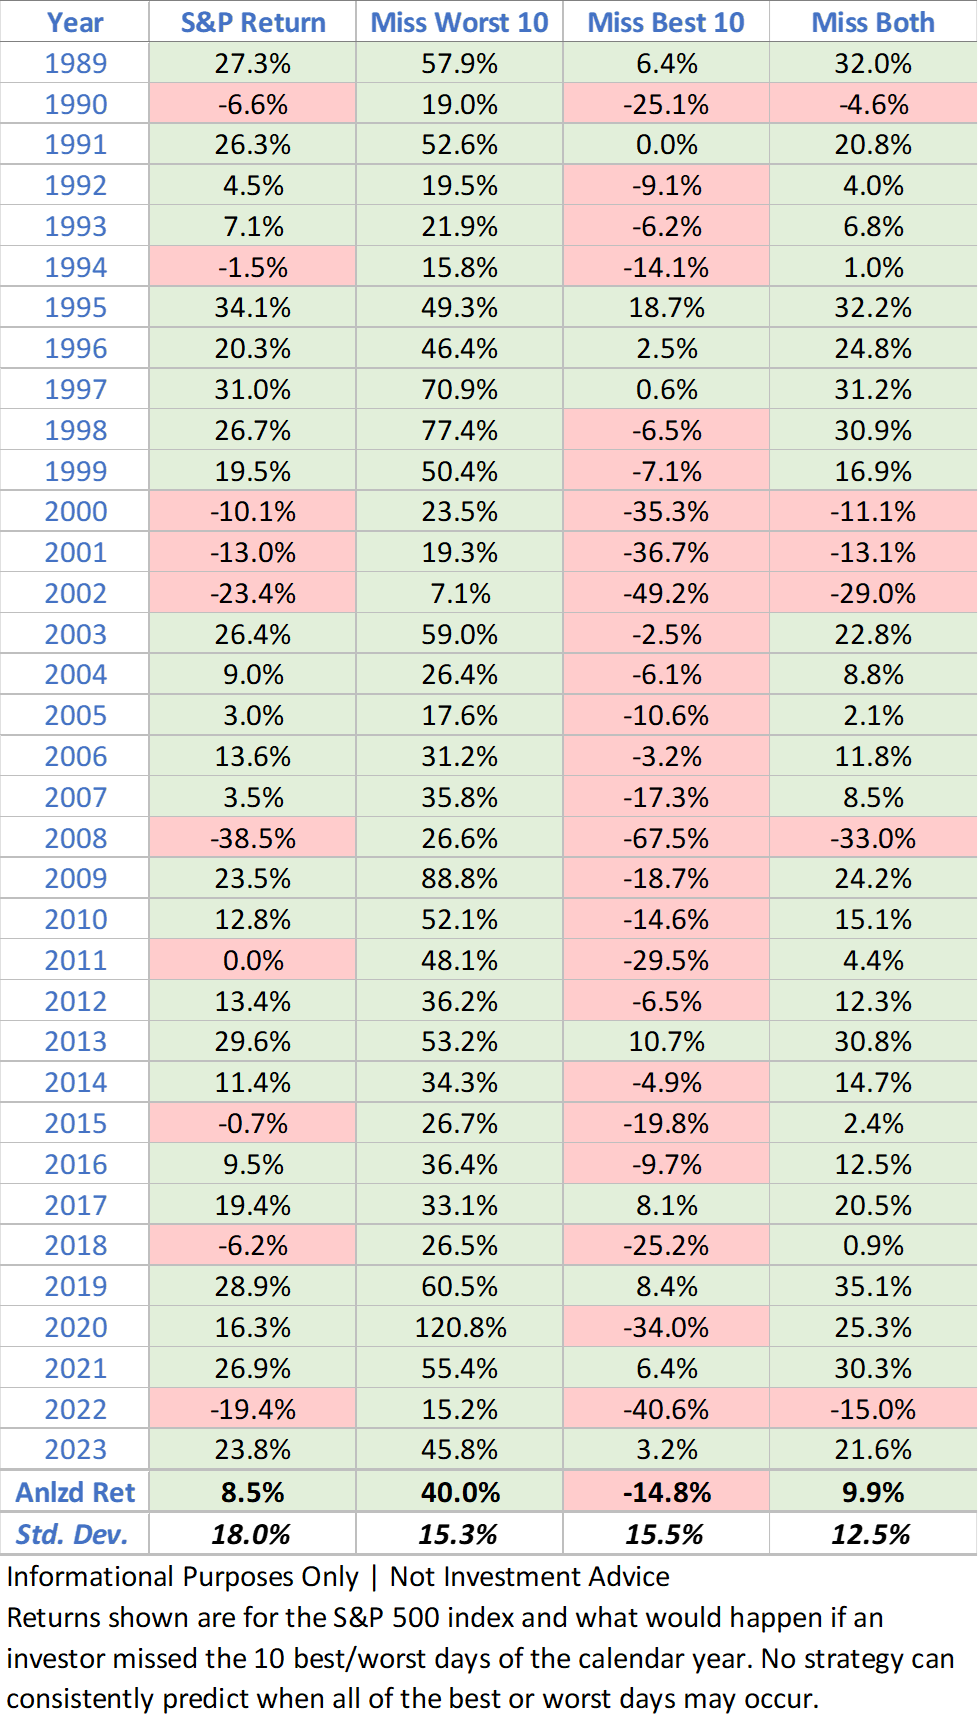
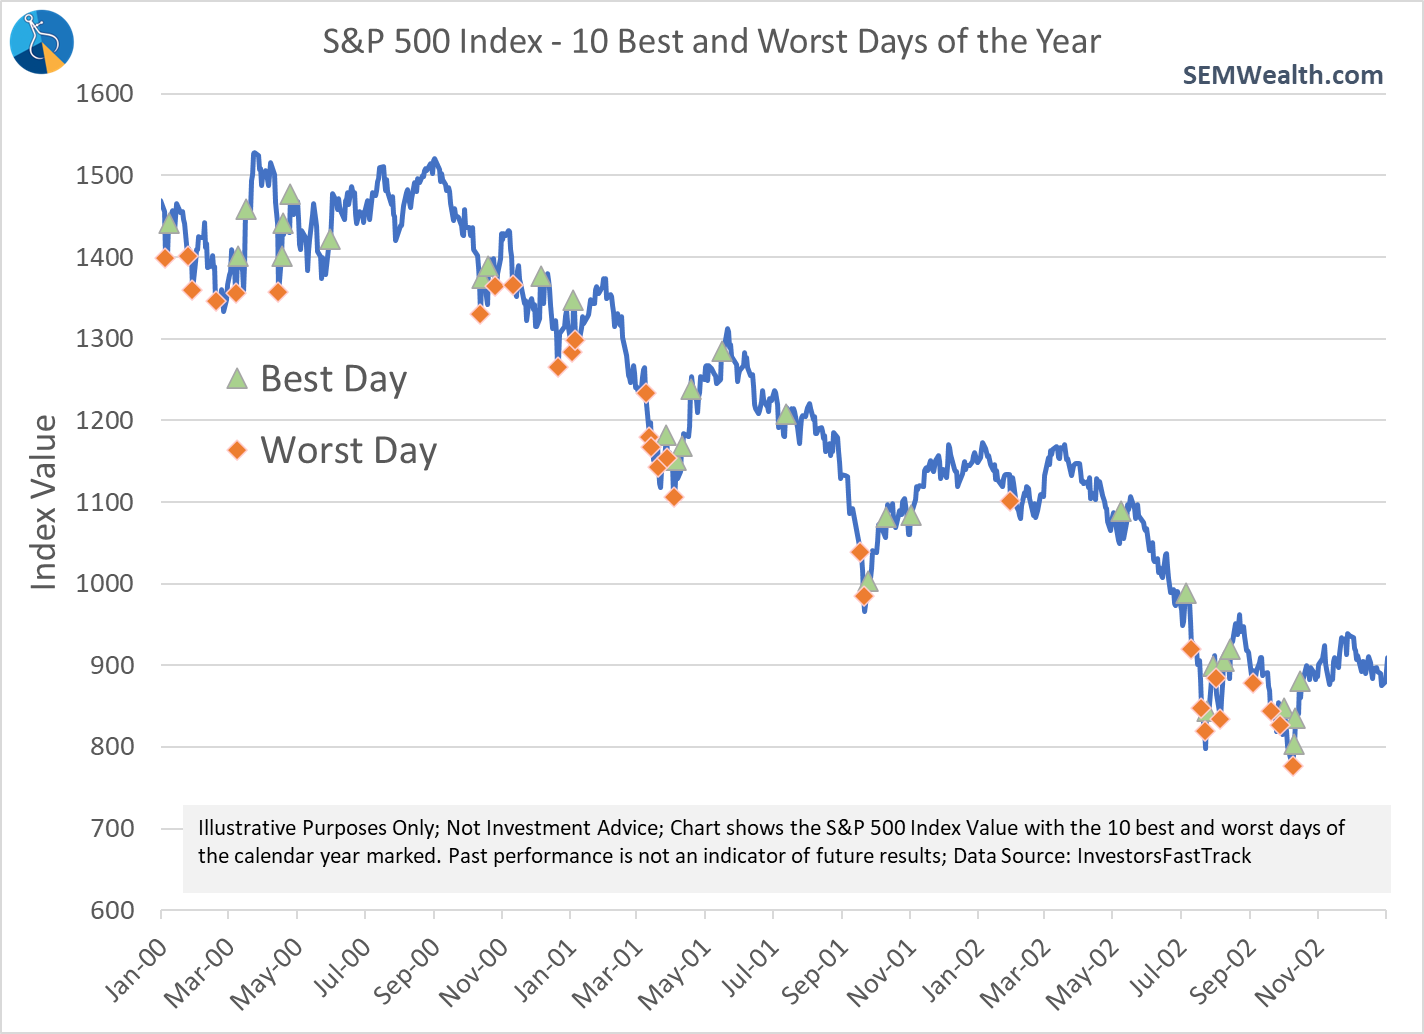
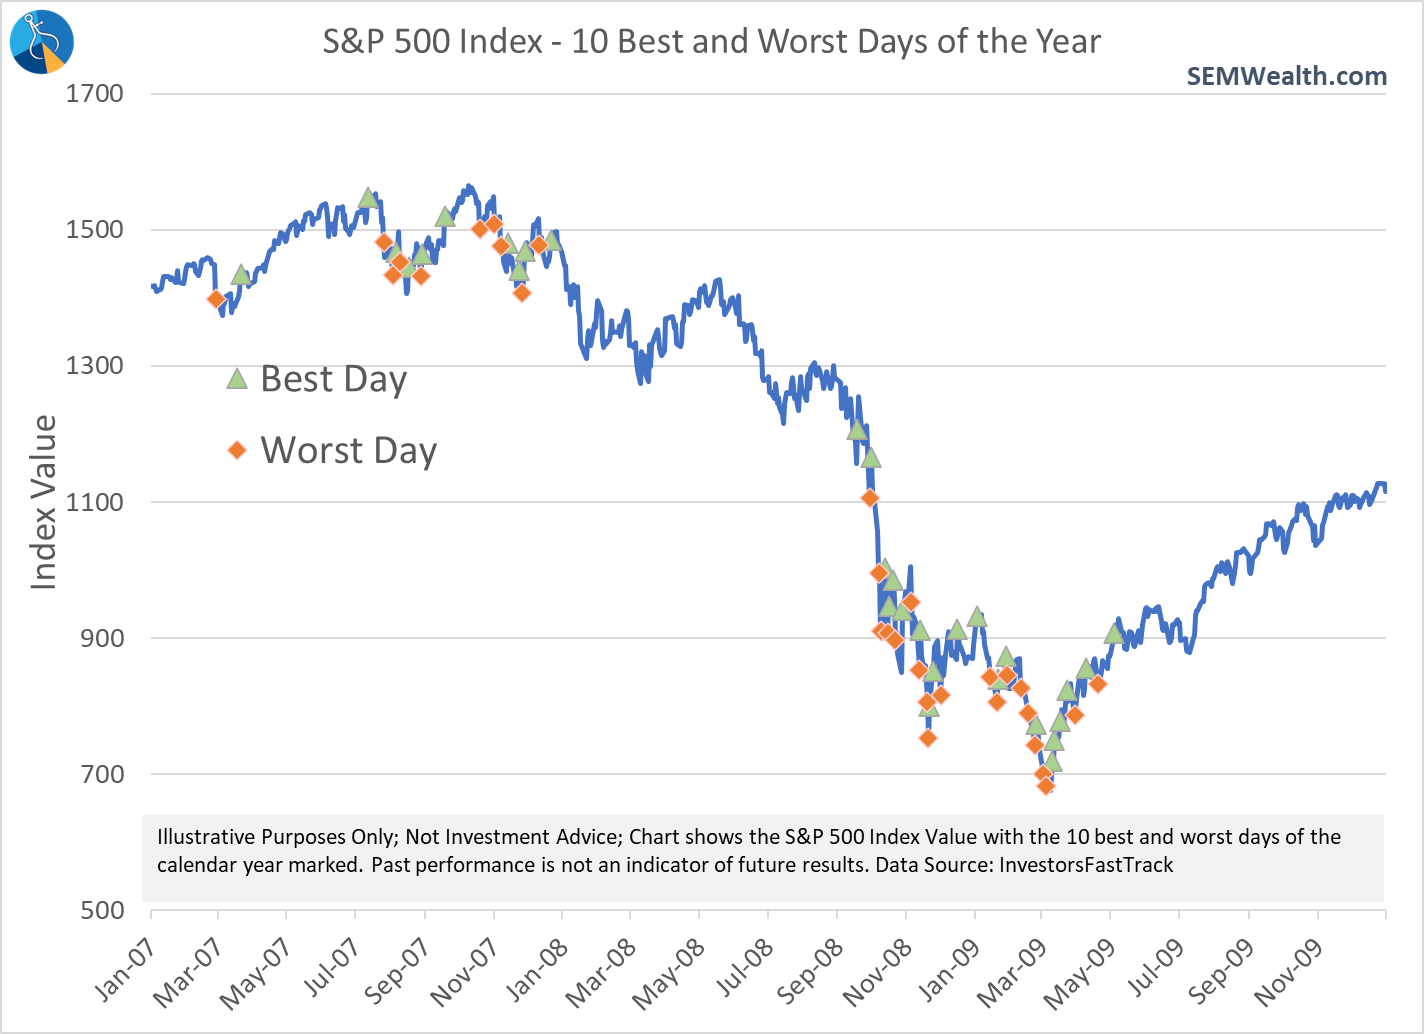
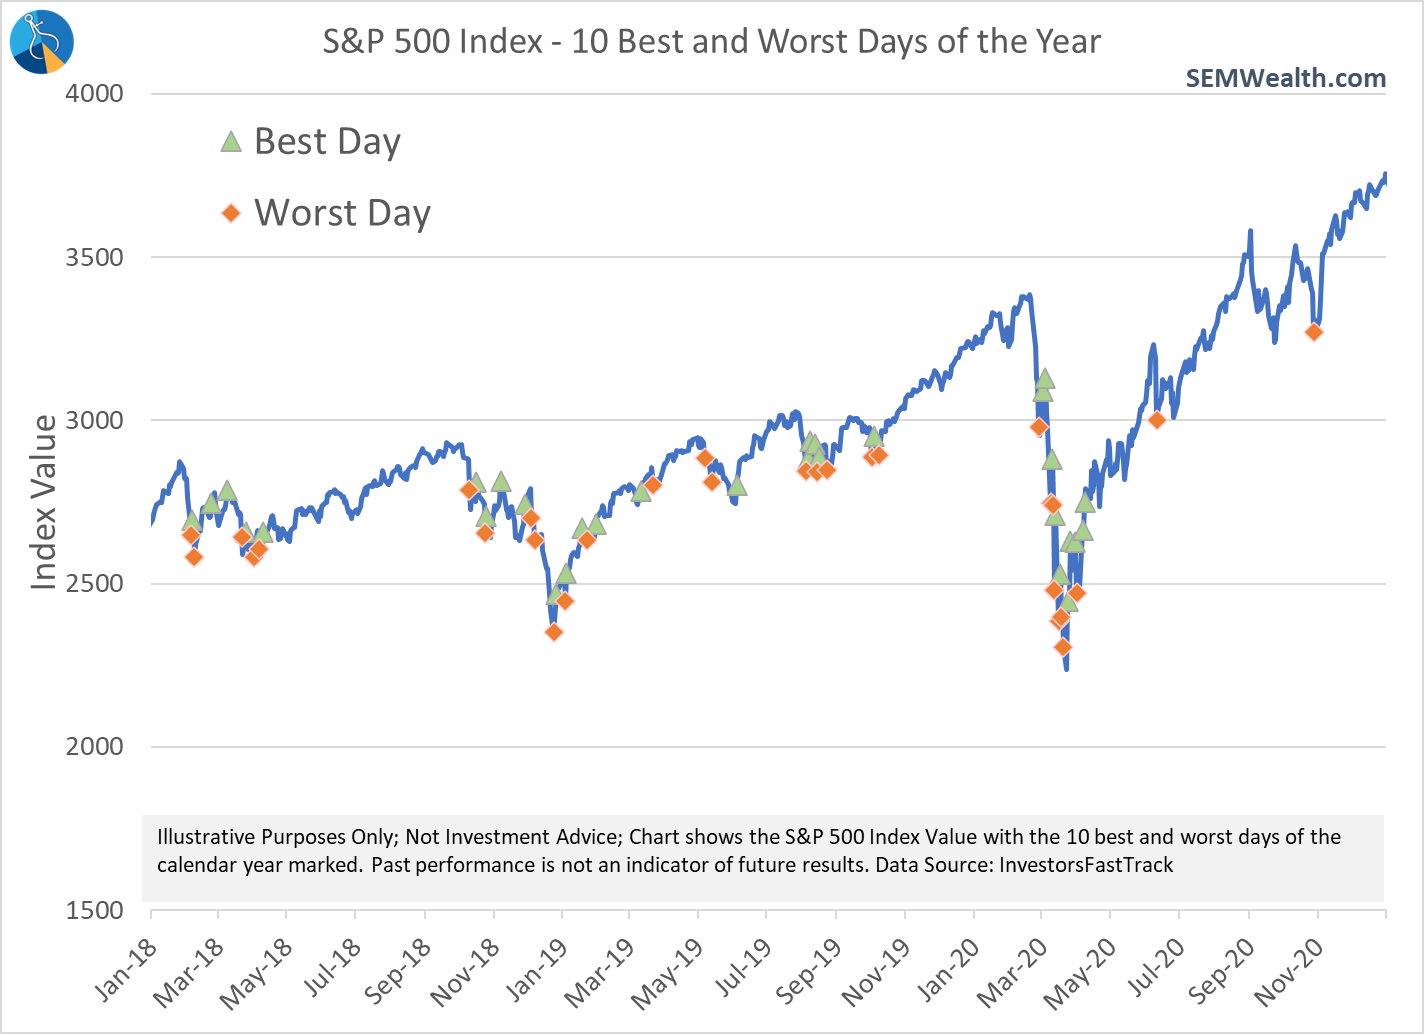
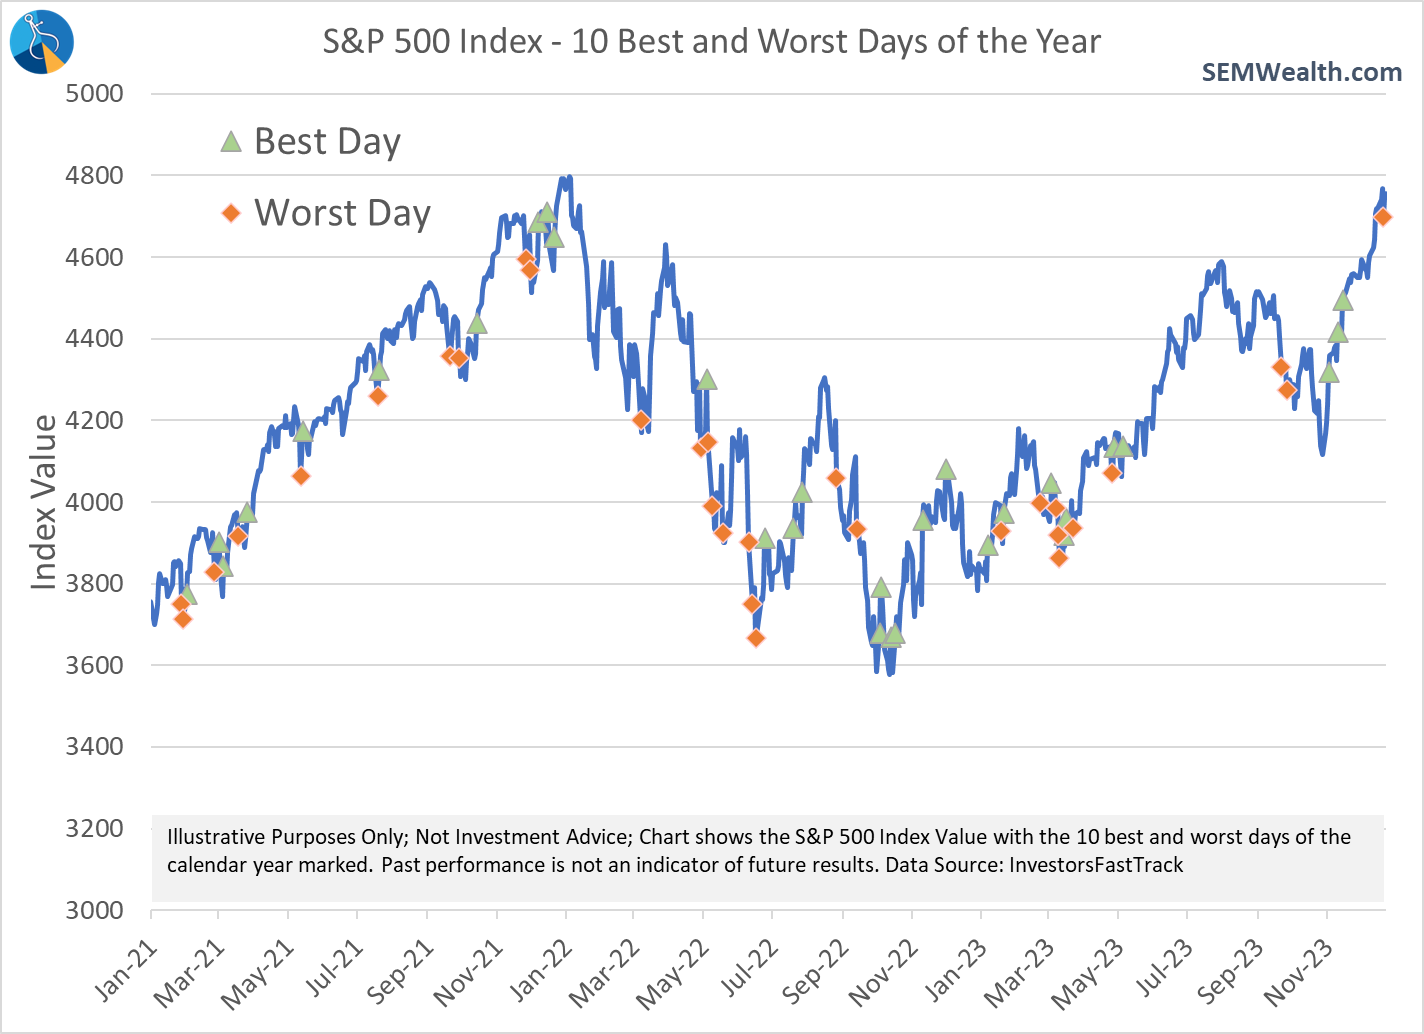
It is obviously very bad to miss the 10 best days of every year. However, the returns are spectacular if you missed the 10 WORST days of the year. I typically turn it around and say, "what if you missed BOTH the 10 BEST days and the 10 WORST days of the year?" While that is not possible to do in reality, what we do find is the BEST days often occur following severe declines in the market. Take a look at some select 3 year periods. Notice how the best and worst days tend to be clumped together.
2000-2002
2007-2009
2018-2020
2021-2023
With the returns clumped like this, in theory a trend following system will generally miss both the best and worst days in the market. While certainly not perfect, this is the goal of our investment models – provide lower stress returns. If you miss the bulk of the worst days, you simply don't need to capture the bulk of the best days.
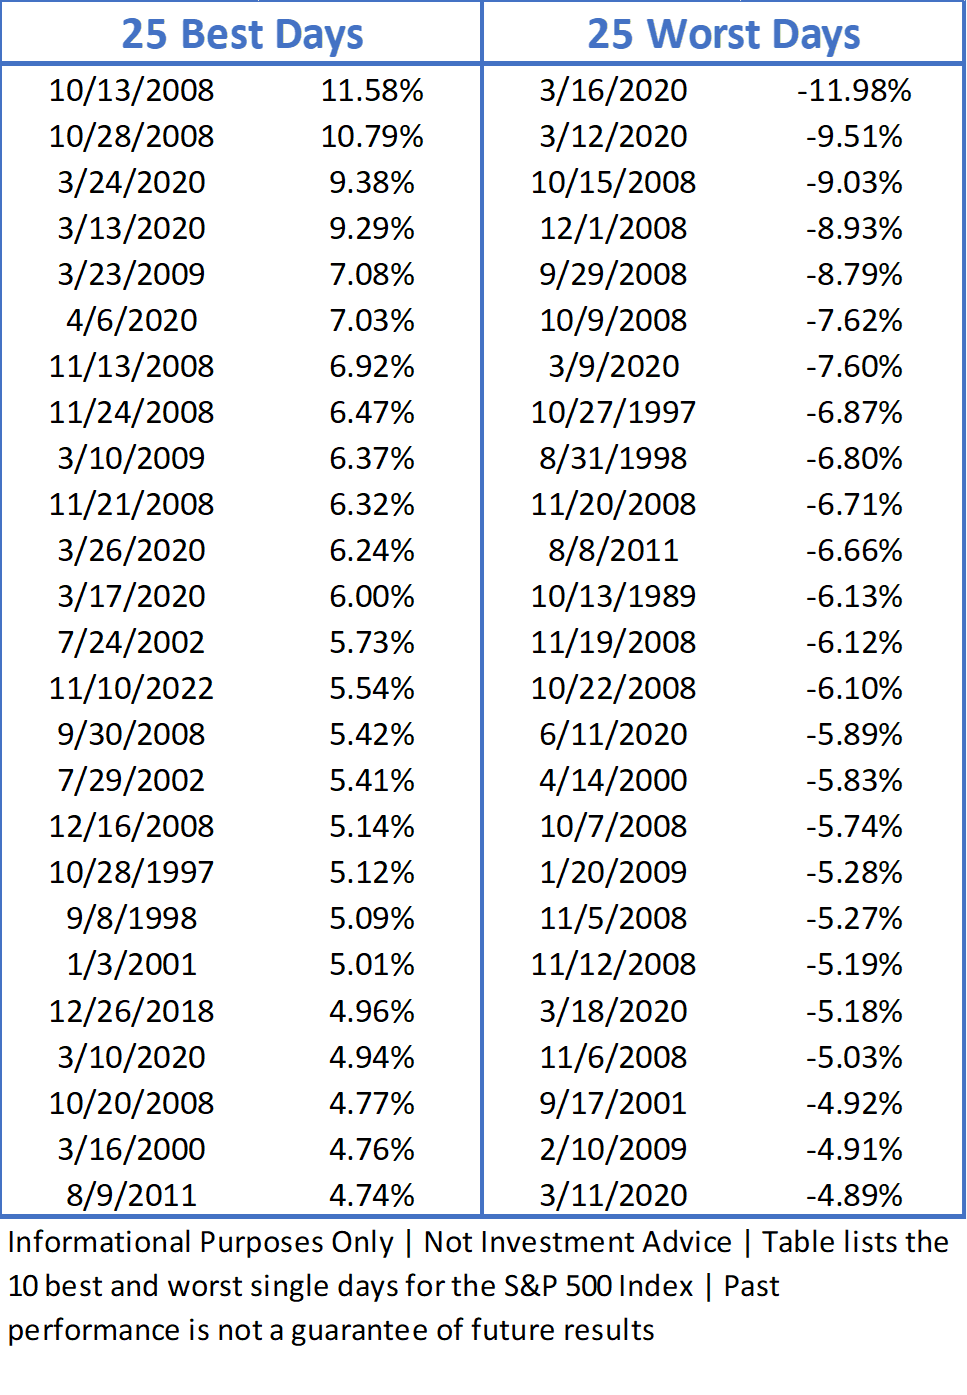
Looking at the 25 best and worst days since 1989 we can see the bulk of them all occurred during the "Asian" crises of 1997 & 1998, the bursting of the dot-com bubble in 2000-2002, the financial crisis from 2007-2009, the debt ceiling circus of 2011, and the pandemic of 2020.
Another advisor called me on Friday to wish me a Merry Christmas and said, "I'm so glad we found you. It allows me and my clients to enjoy the holidays knowing you're watching our back." That is the key to the value SEM brings to our clients and advisors. While we do not have the models to always predict when the best or worst days may occur, we do have a solid track record of sidestepping the majority of the downside. We don't need to participate in the "10 best days" because most of the time those 'good' days occur inside of a scary time in the market. We have the data on our side.
Side stepping most of the downside means we don't NEED to be invested all the time, while still giving us the ability to participate in most of the upside the market has to offer. This provides a much lower stress investment experience.
Market Charts
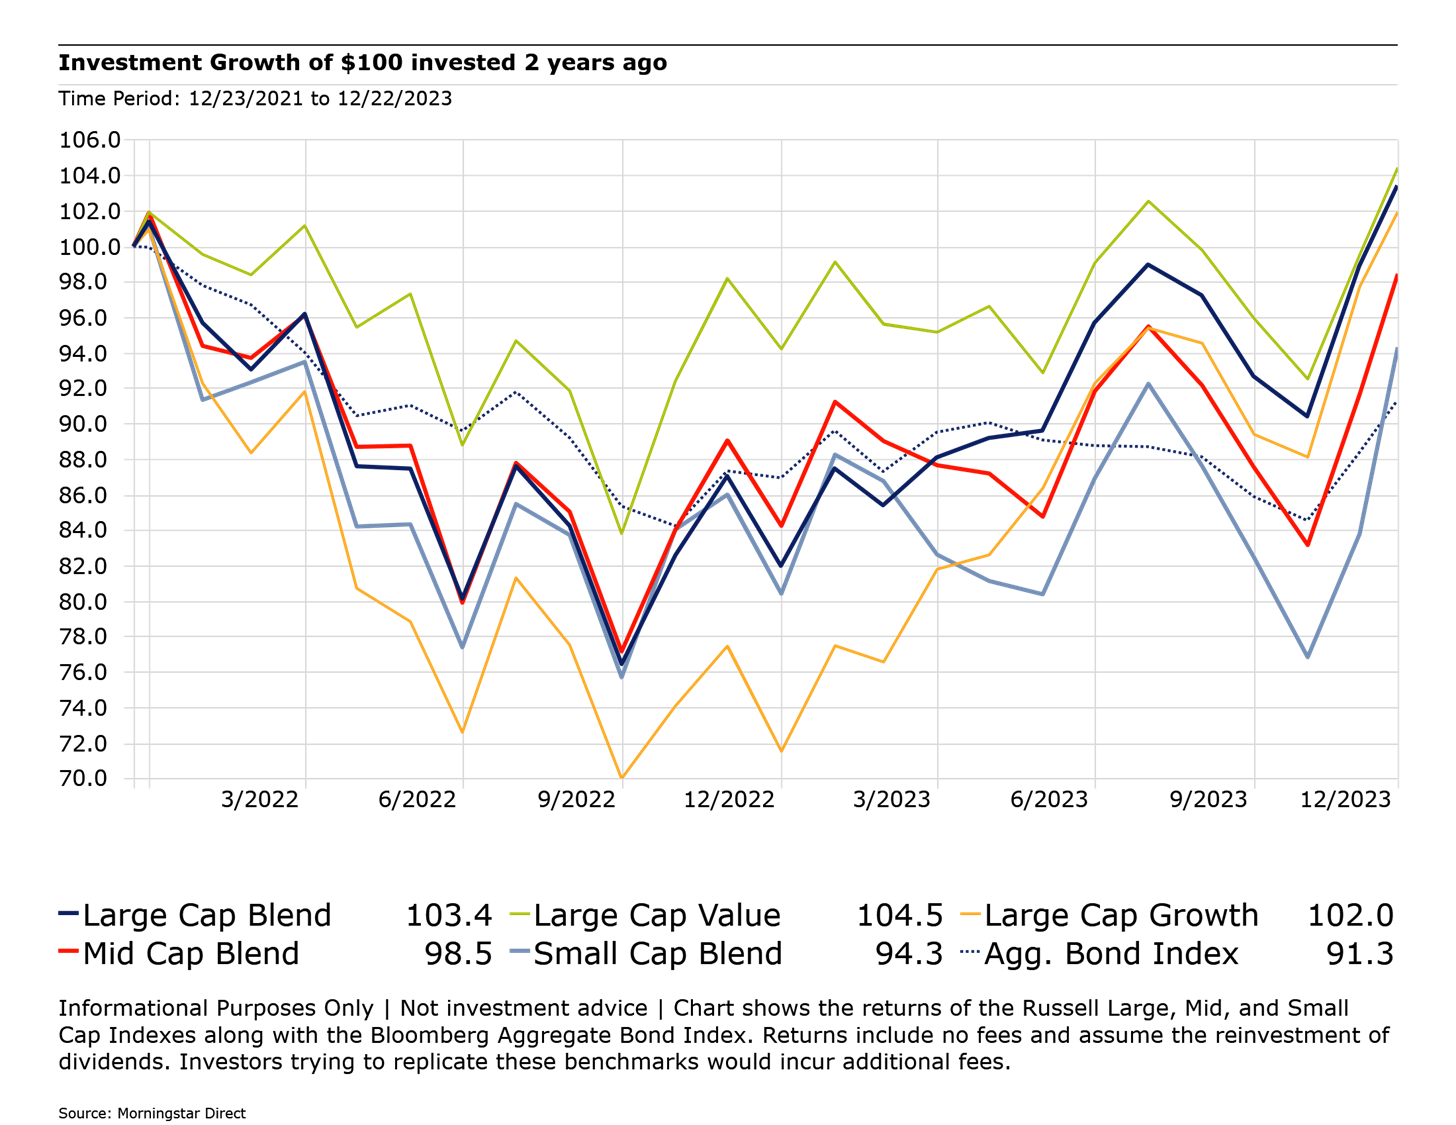
Rather than posting the usual market charts this week, I thought I would include a look back at the past 2 years for some of the market benchmarks. Despite the spectacular returns for the mega-cap growth stocks in 2023, Large Cap Value stocks are the best performers when we go back 2 years.
Growth stocks have essentially done a full round-trip – dropping 30% and then rallying back to where they were at the end of 2021.
Mid-cap stocks are still about 1.5% behind there 2021 end point. Small Cap stocks are down nearly 6%. The big story remains the bond market, which is still down nearly 9% over the past 2 years.
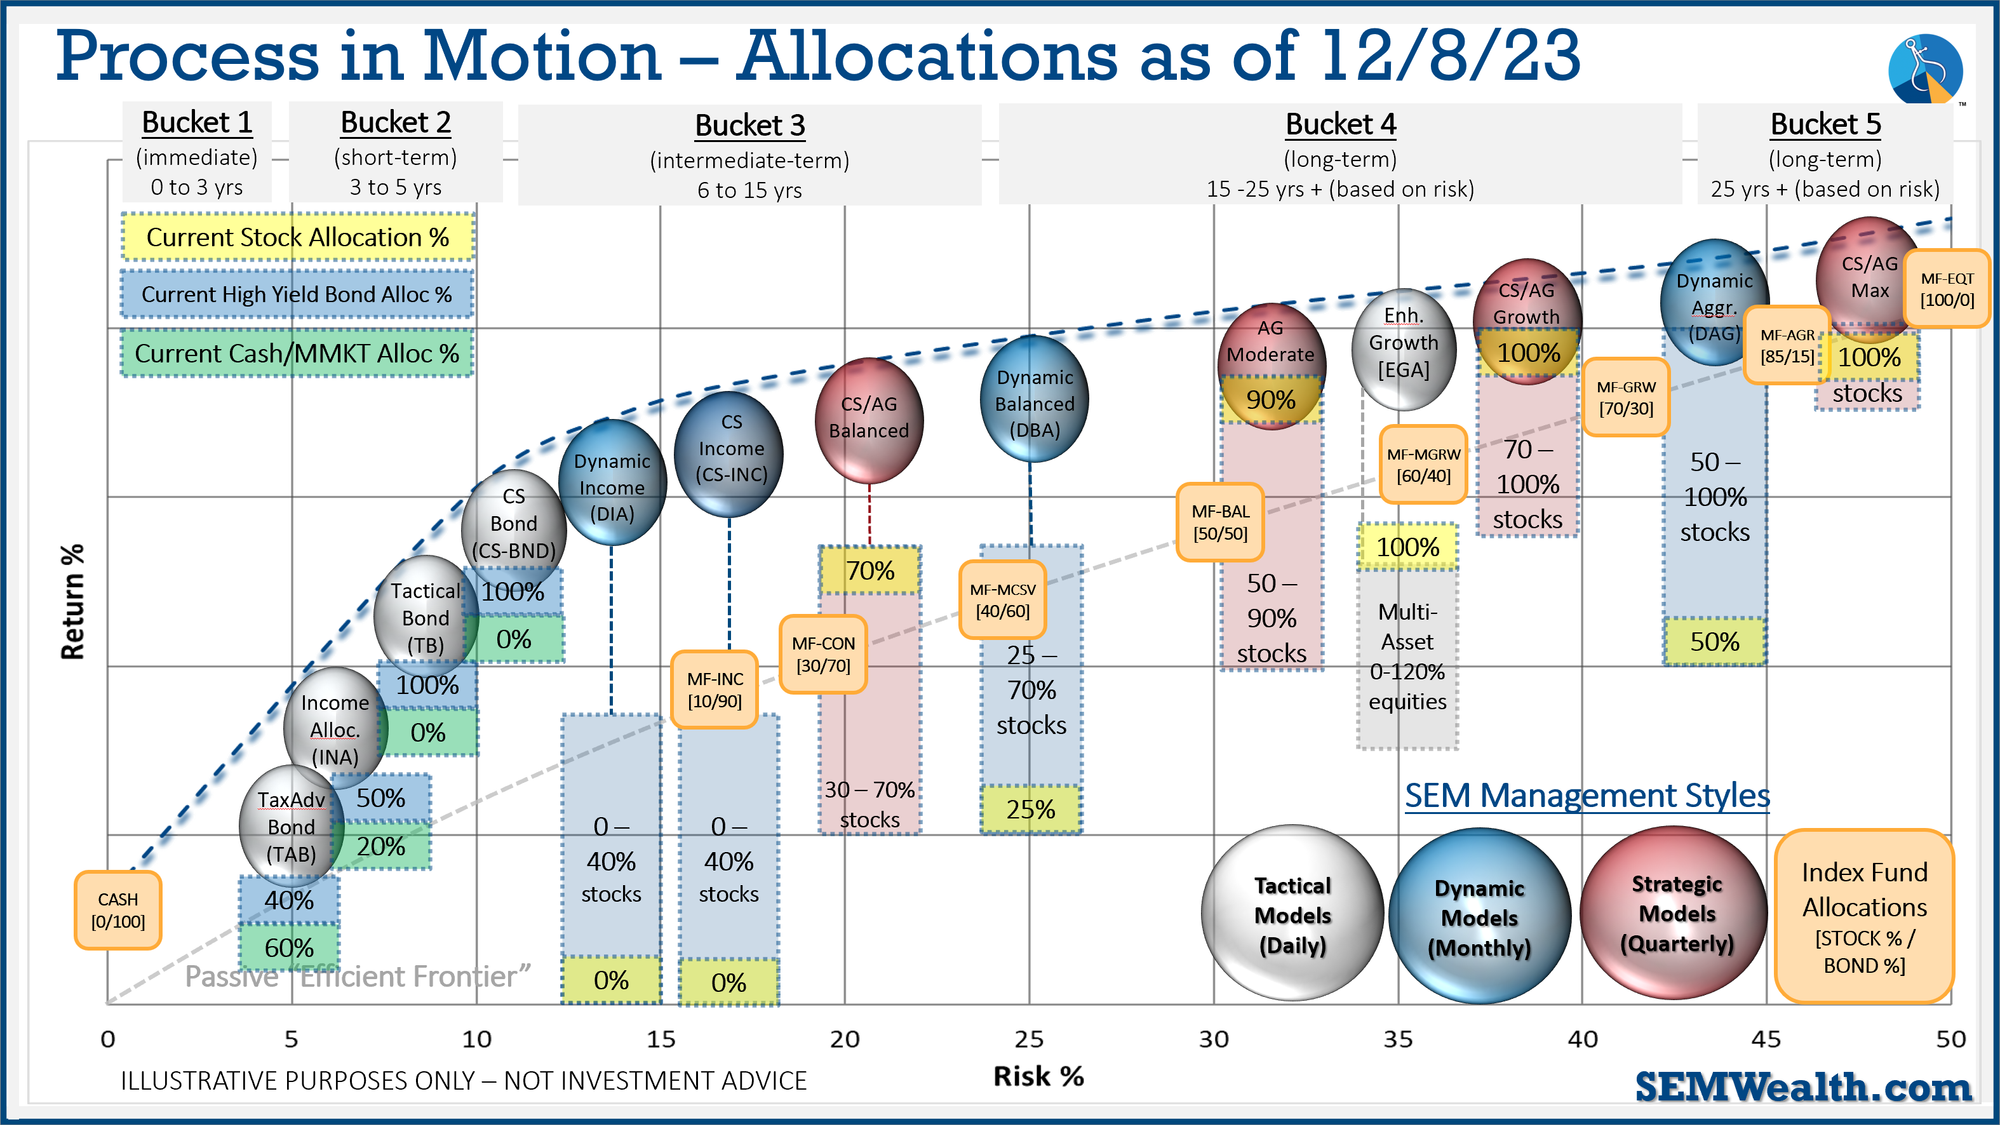
SEM Model Positioning
-Tactical High Yield went on a buy 11/3/2023
-Dynamic Models reverted back to 'bearish' 12/8/2023
-Strategic Trend Models went on a buy 11/27/2023
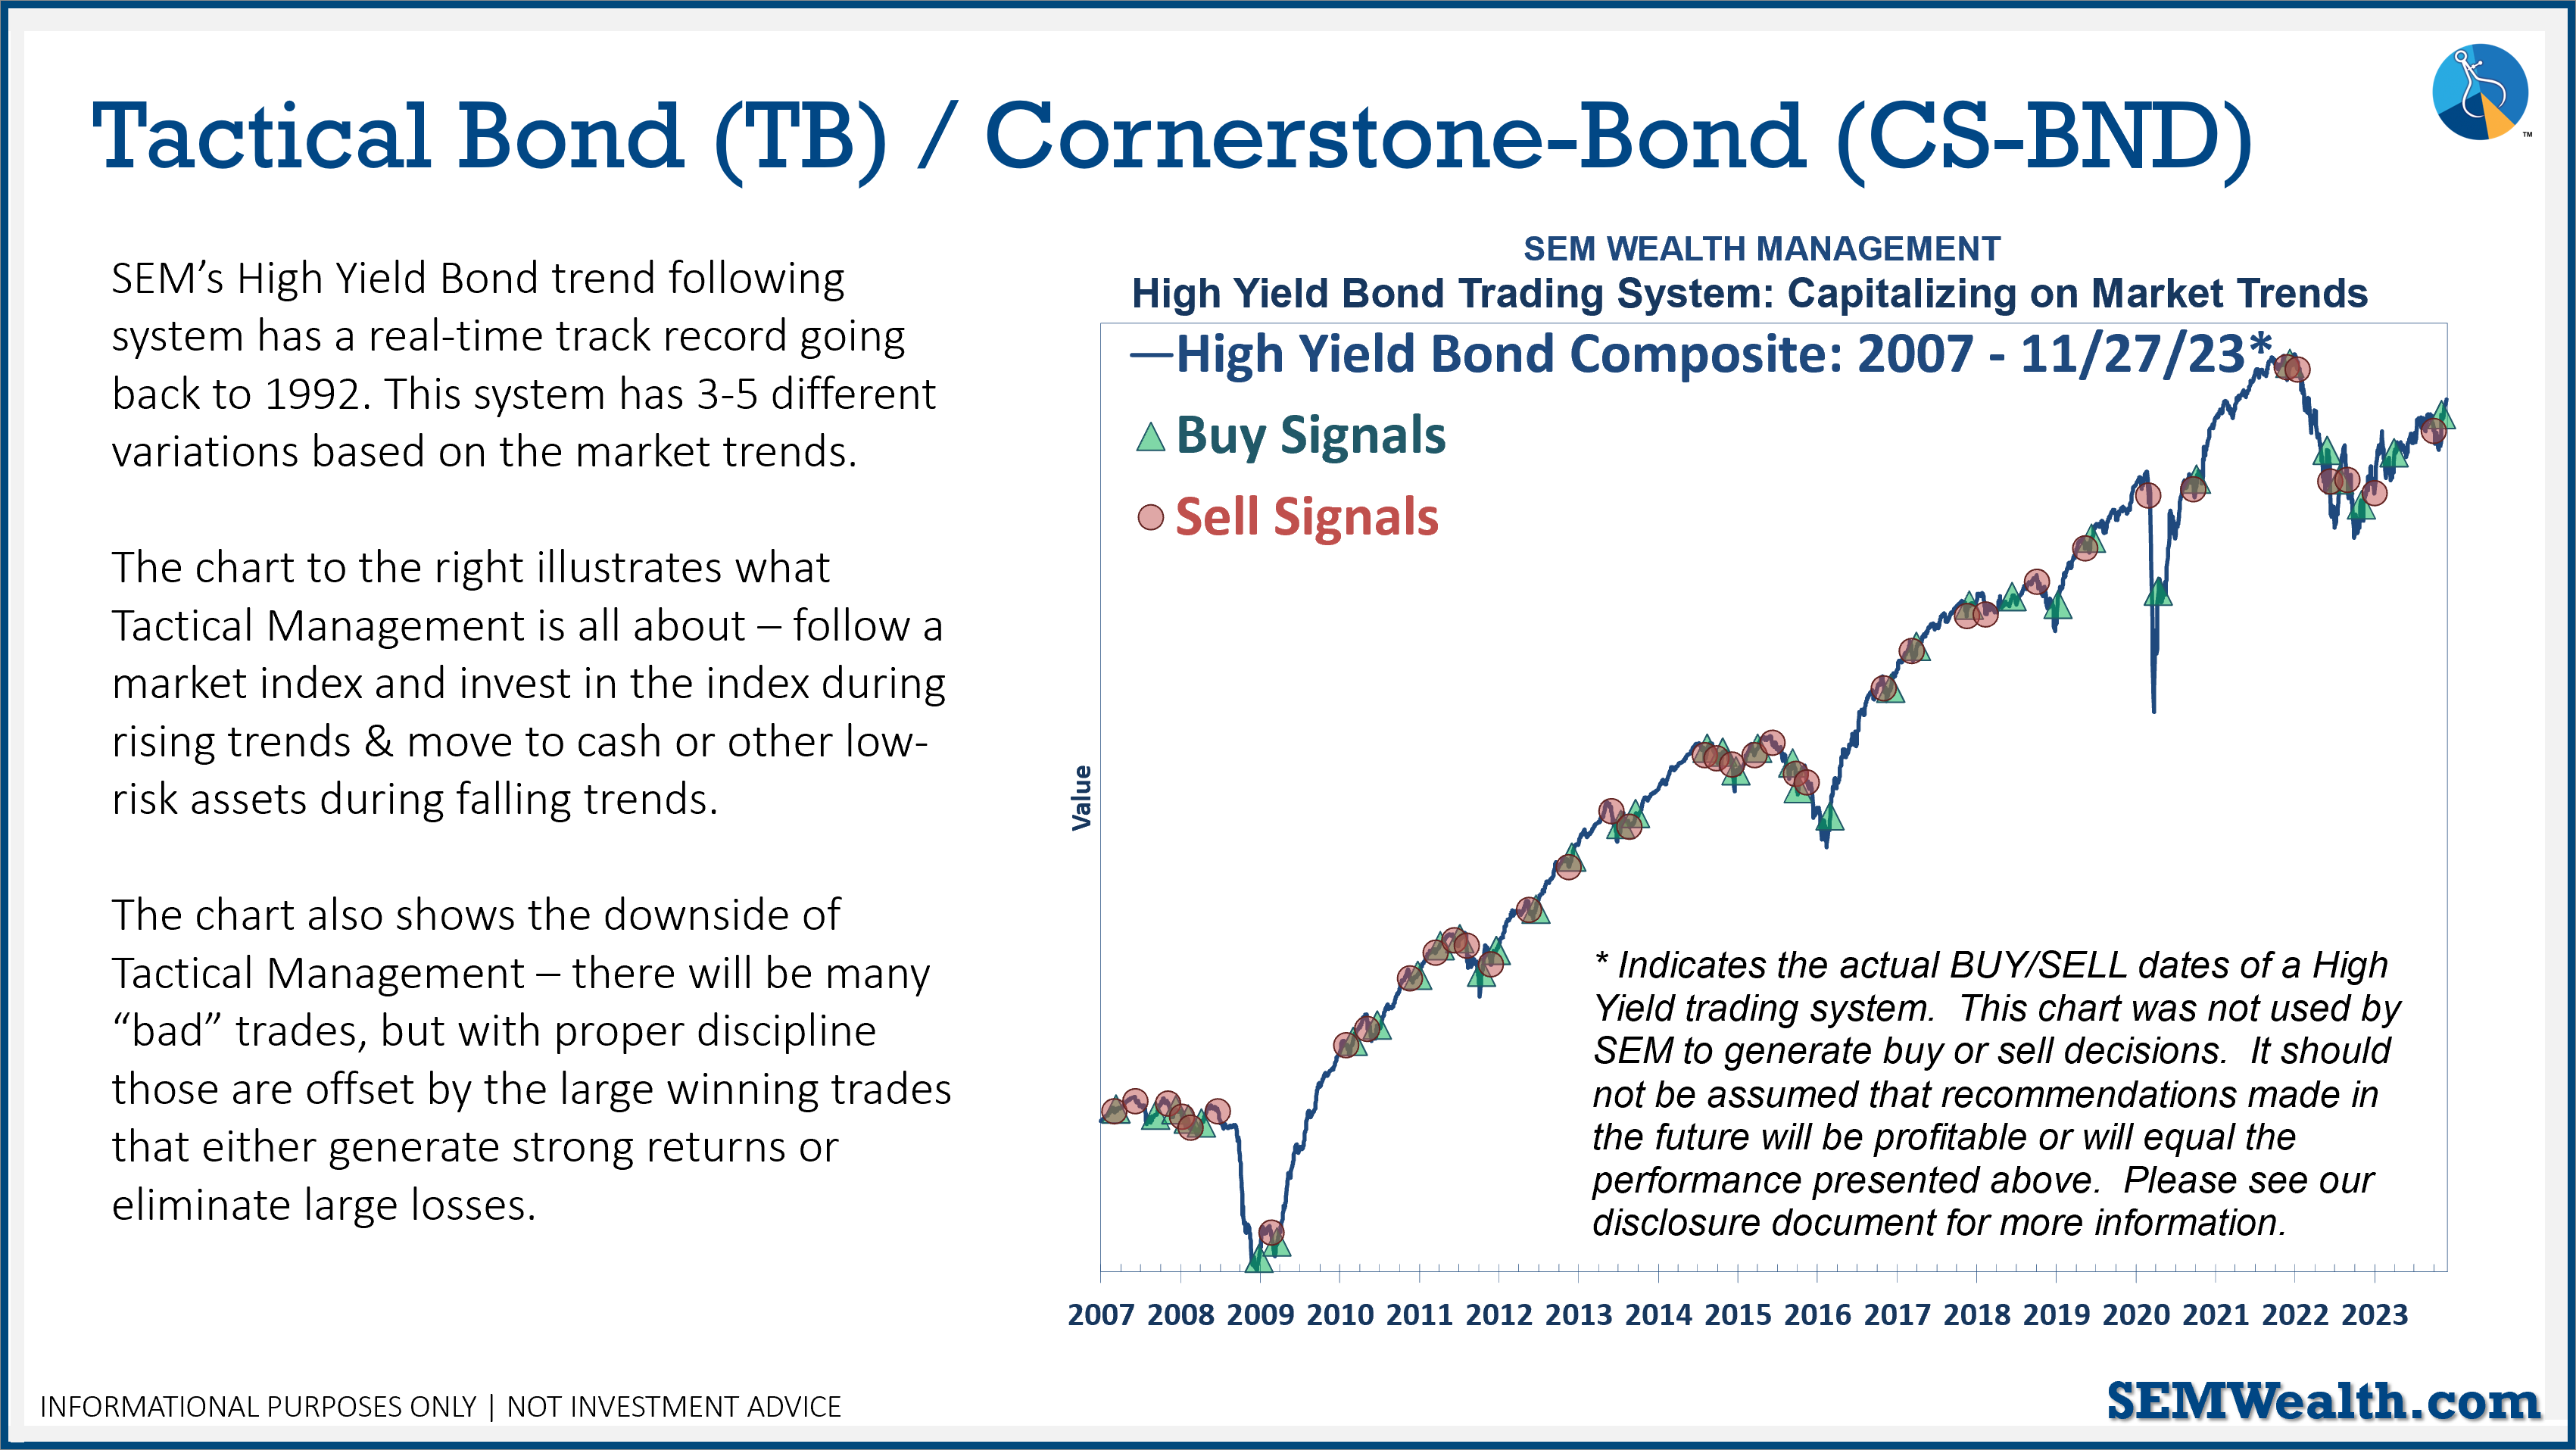
SEM deploys 3 distinct approaches – Tactical, Dynamic, and Strategic. These systems have been described as 'daily, monthly, quarterly' given how often they may make adjustments. Here is where they each stand.
Tactical (daily): The High Yield Bond system bought the beginning of April and issued all 3 sell signals 9/28/2023. All 3 systems were back on buy signals by the close on 11/3/2023. The bond funds we are invested in are a bit more 'conservative' than the overall index, but still yielding between 7.5 -8.5% annually.
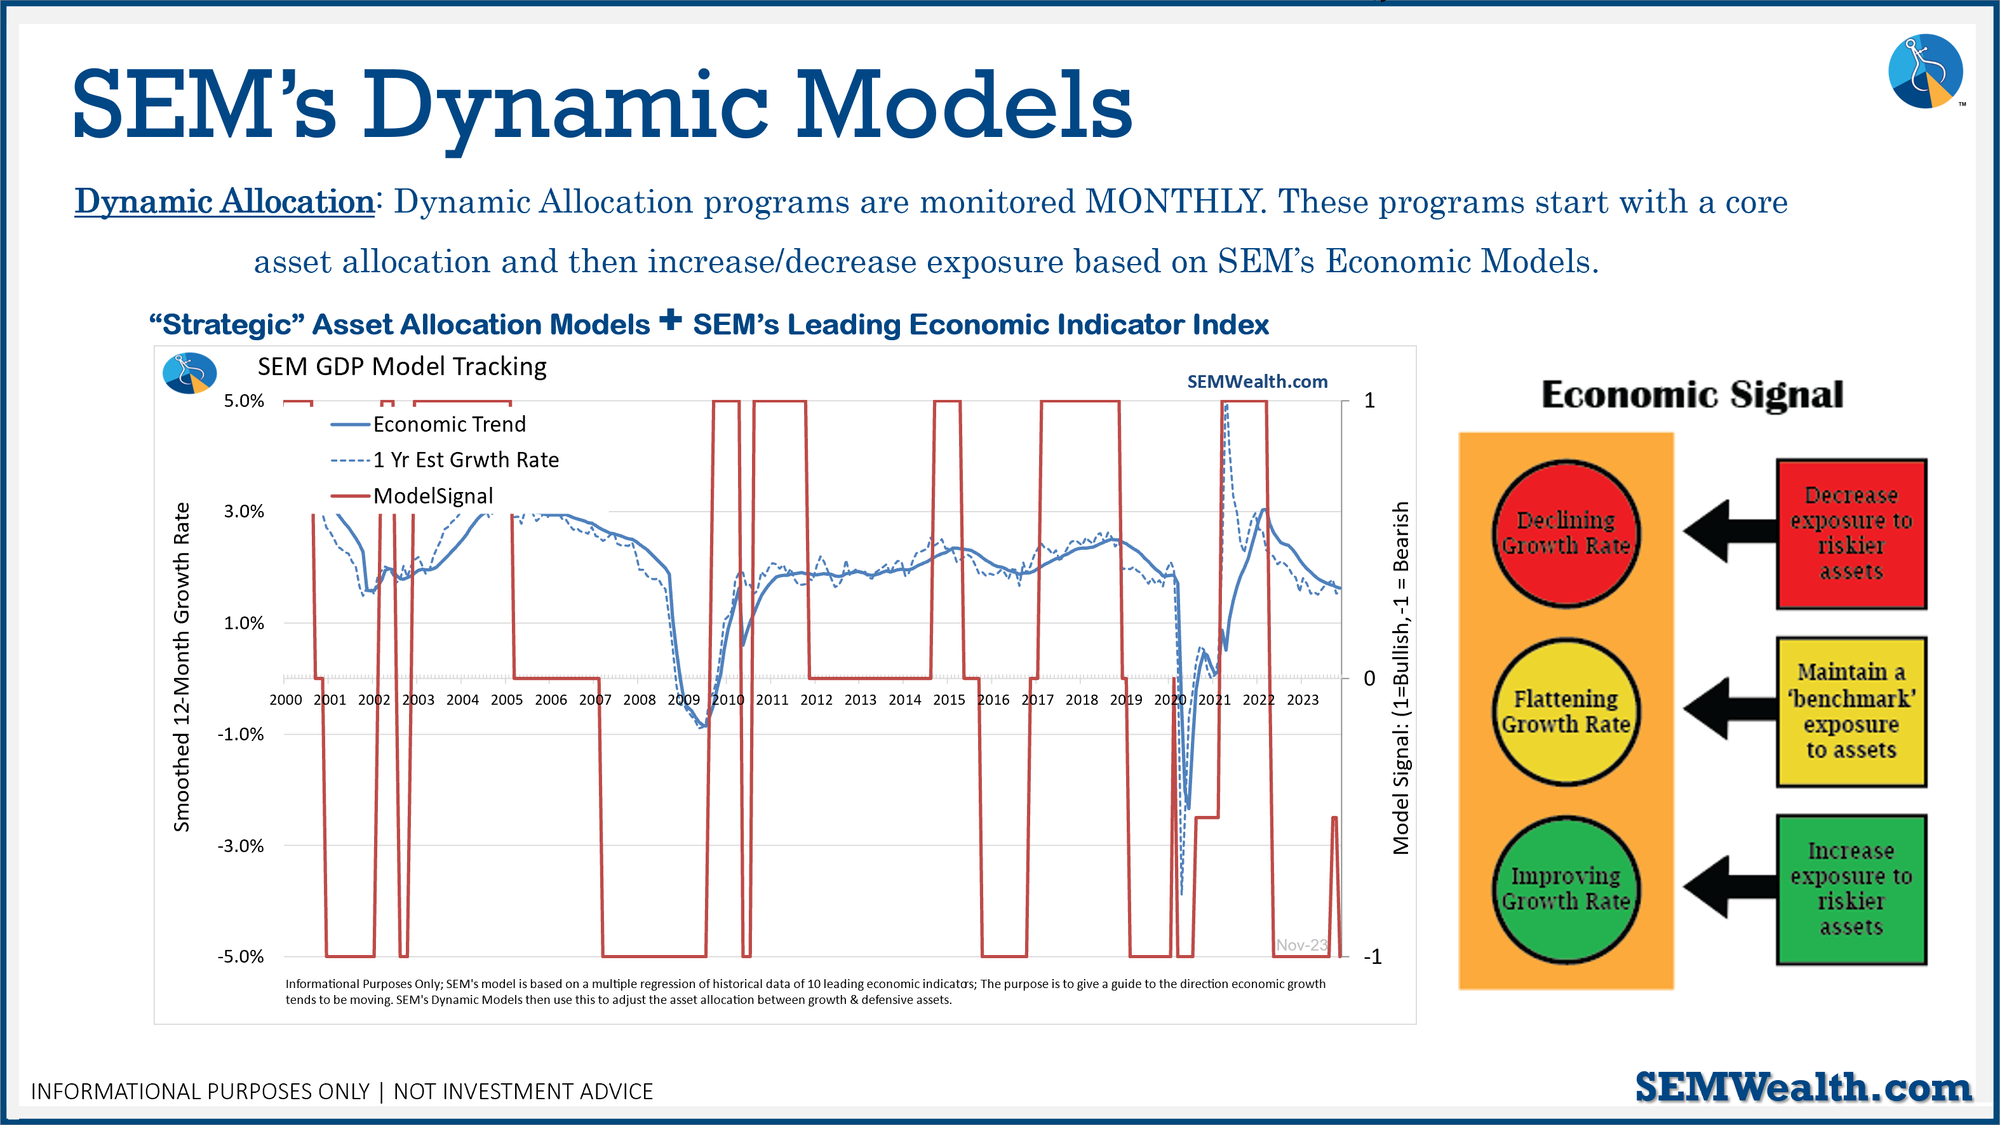
Dynamic (monthly): At the beginning of October the model moved slightly off the "bearish" signal we've had since April 2022. At the beginning of December it reverted back to "bearish". This means no positions in dividend stocks (Dynamic Income) or small cap stocks (Dynamic Aggressive Growth).
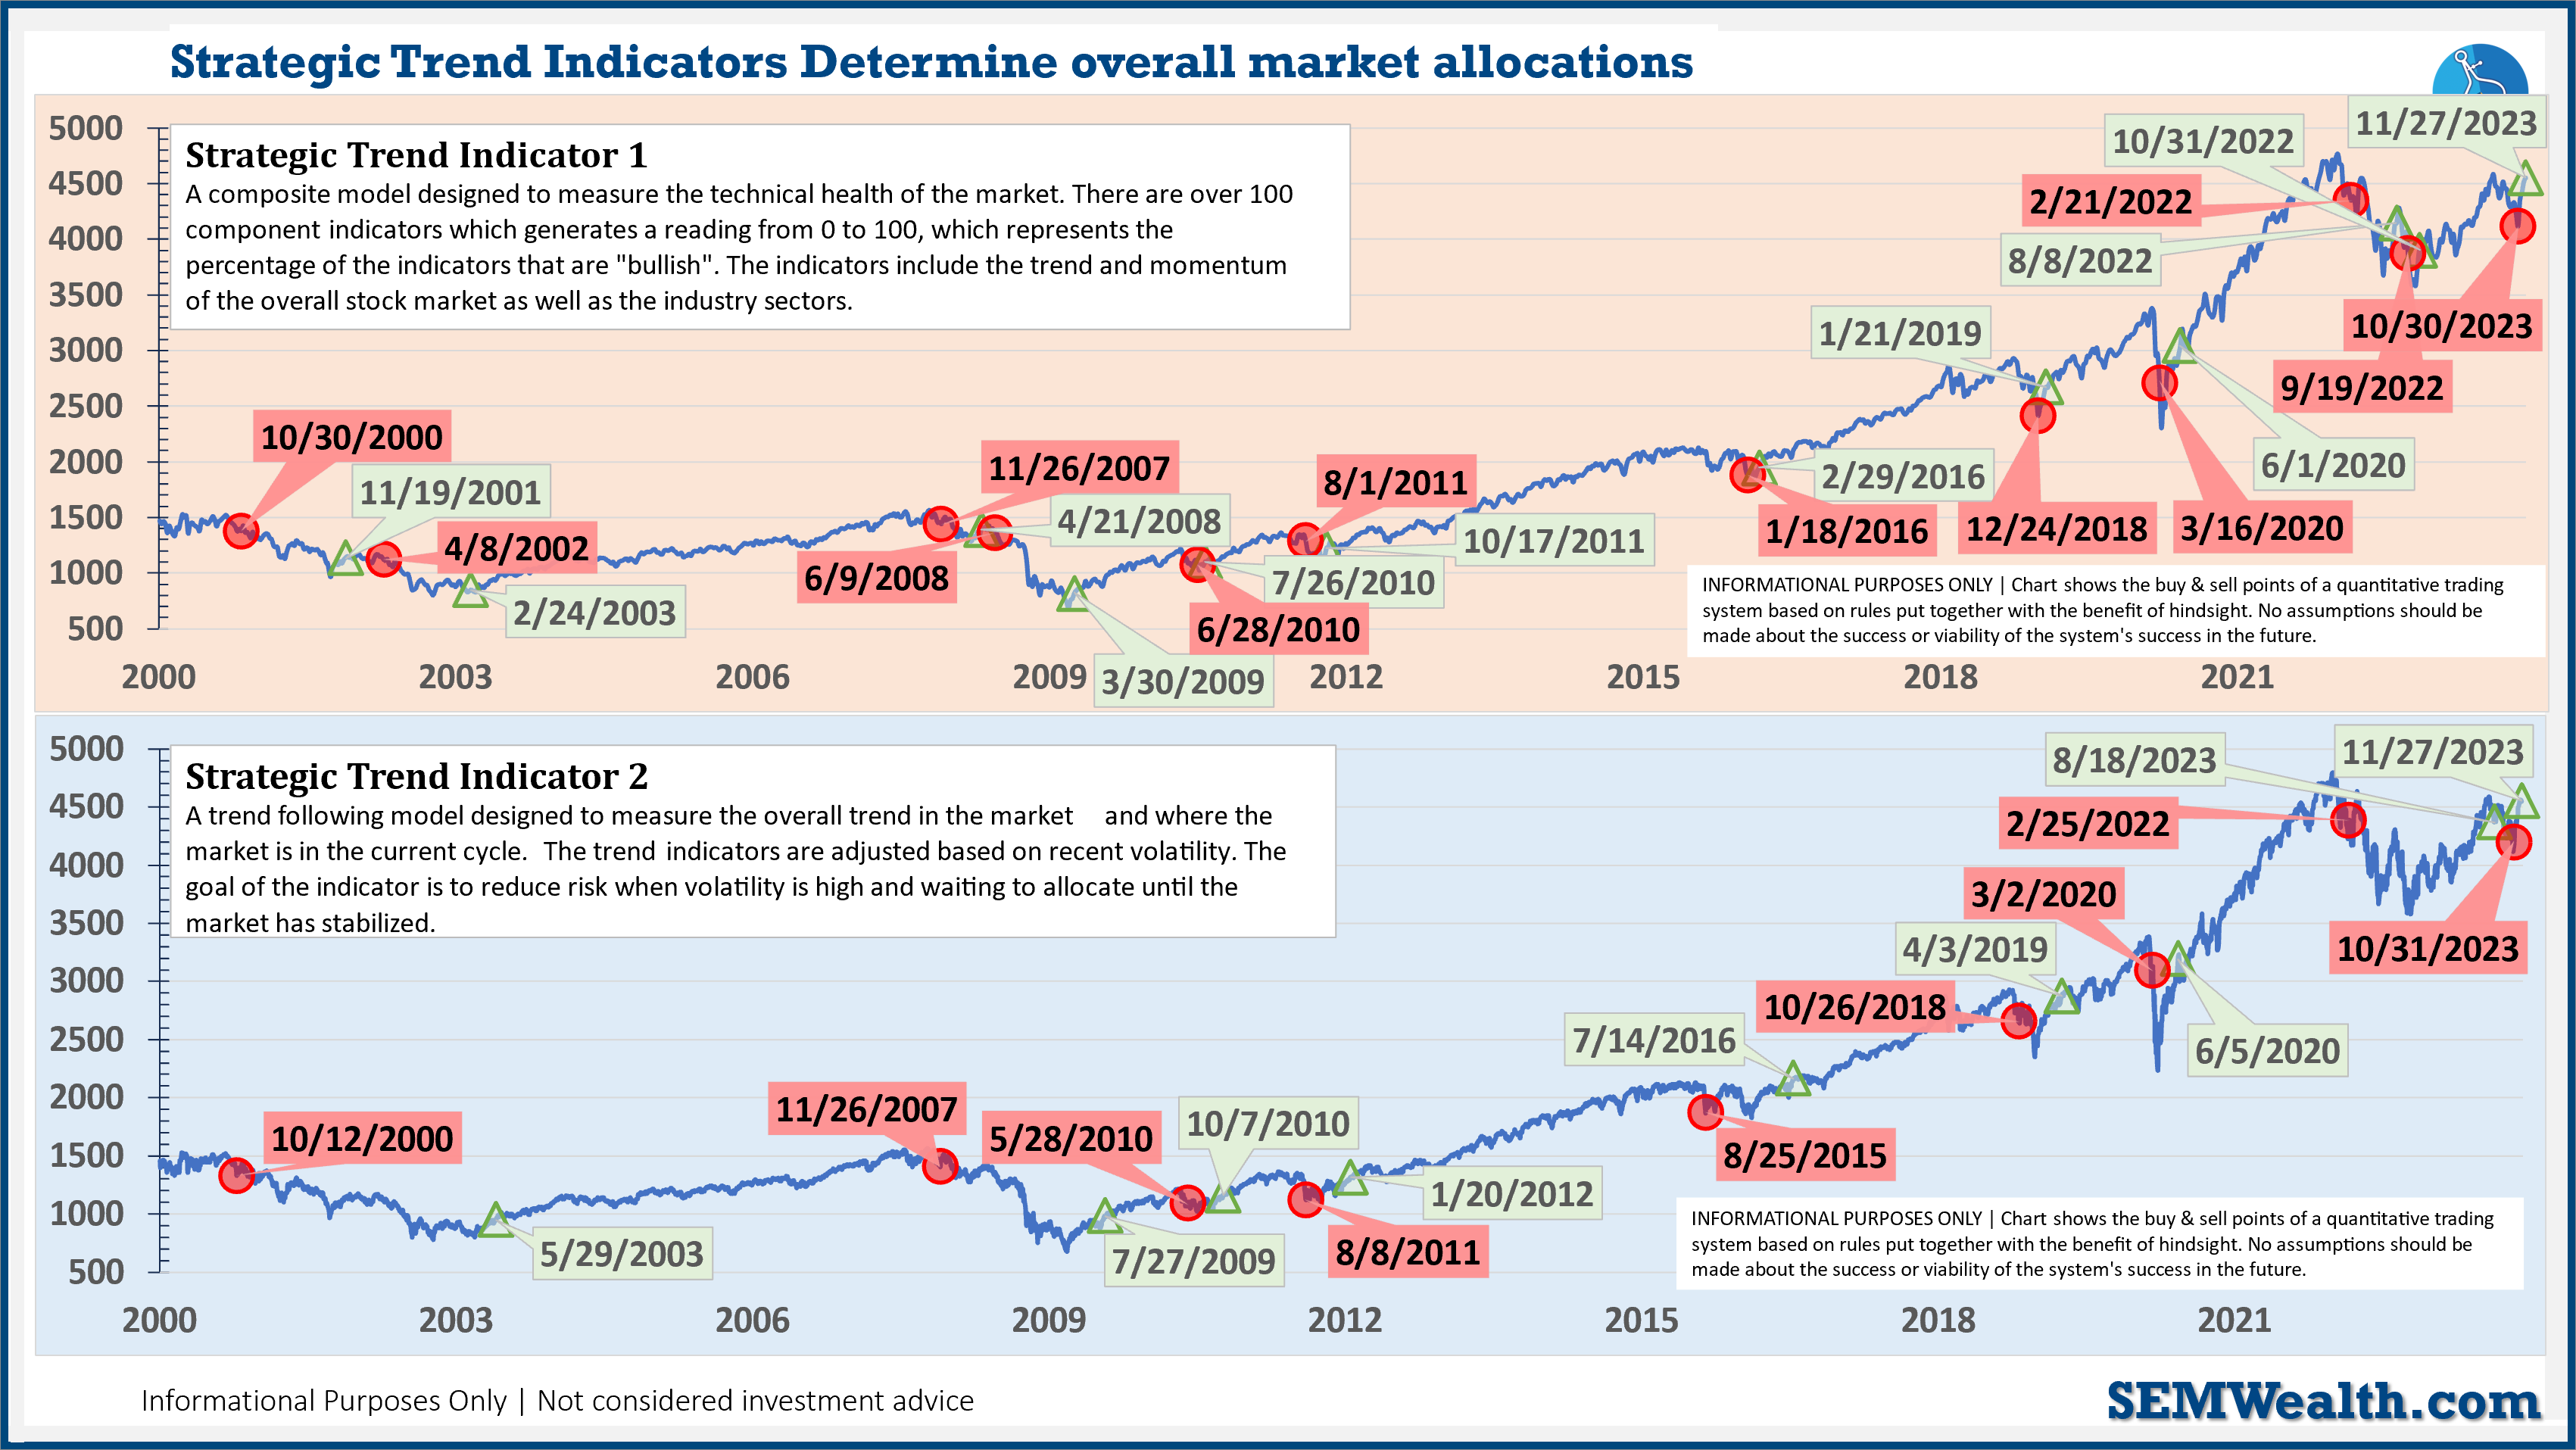
Strategic (quarterly)*:
BOTH Trend Systems reversed back to a buy on 11/27/2023
The core rotation is adjusted quarterly. On August 17 it rotated out of mid-cap growth and into small cap value. It also sold some large cap value to buy some large cap blend and growth. The large cap purchases were in actively managed funds with more diversification than the S&P 500 (banking on the market broadening out beyond the top 5-10 stocks.)
The * in quarterly is for the trend models. These models are watched daily but they trade infrequently based on readings of where each believe we are in the cycle. The trend systems can be susceptible to "whipsaws" as we saw with the recent sell and buy signals at the end of October and November. The goal of the systems is to miss major downturns in the market. Risks are high when the market has been stampeding higher as it has for most of 2023. This means sometimes selling too soon. As we saw with the recent trade, the systems can quickly reverse if they are wrong.
Overall, this is how our various models stock up: