The Federal Reserve made a major pivot last week in their policy. After declaring 'mission accomplished' in their inflation fight, the Fed almost immediately shifted to stimulation mode over growth concerns and a slowdown in the labor market. As we stated in our most recent economic update, yes growth is slowing, but we are nowhere near a slowdown that warrants this type of shift.
What are they seeing that we aren't?
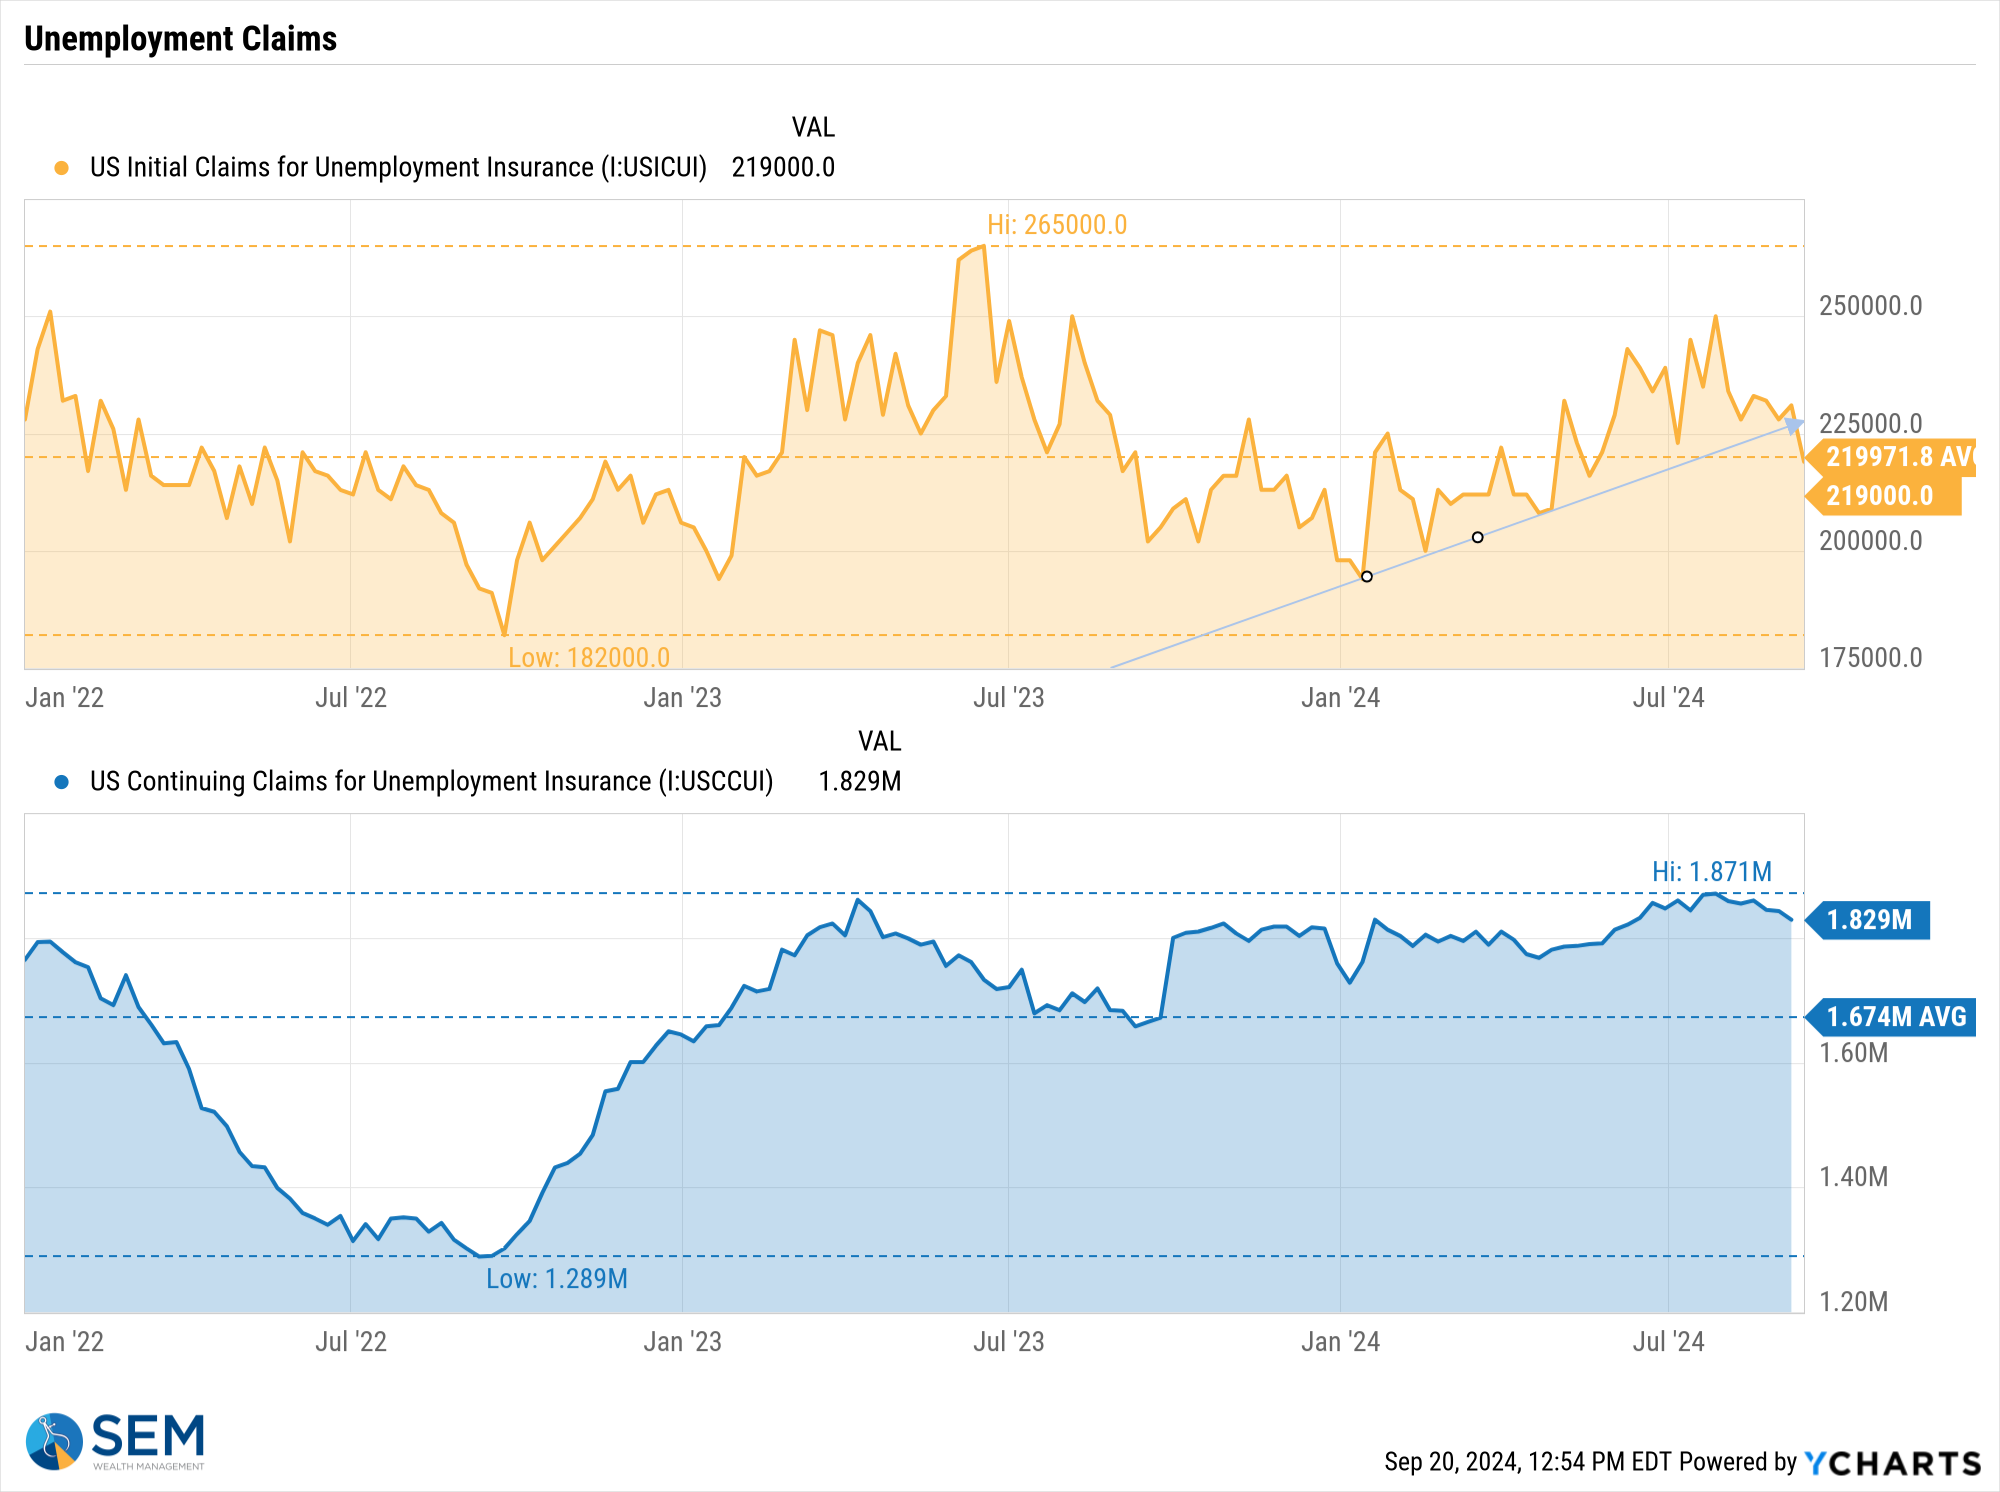
Over the summer, jobless claims and especially continuing claims for unemployment were moving in an uncomfortable direction. That has since been mitigated and claims are back in their record low range we've enjoyed for the past 24 months.
The only thing I can think of is the Fed bankers are seeing signs of stress in the actual banking system which led to this rapid reversal. The stock market sees no signs of risk and has already priced in the Fed Funds rate falling from just under 5% to start last week all the way down to 2.75% next April (125 basis points of cuts in 9 months). They anticipate another 1/2% in cuts before the end of the year.
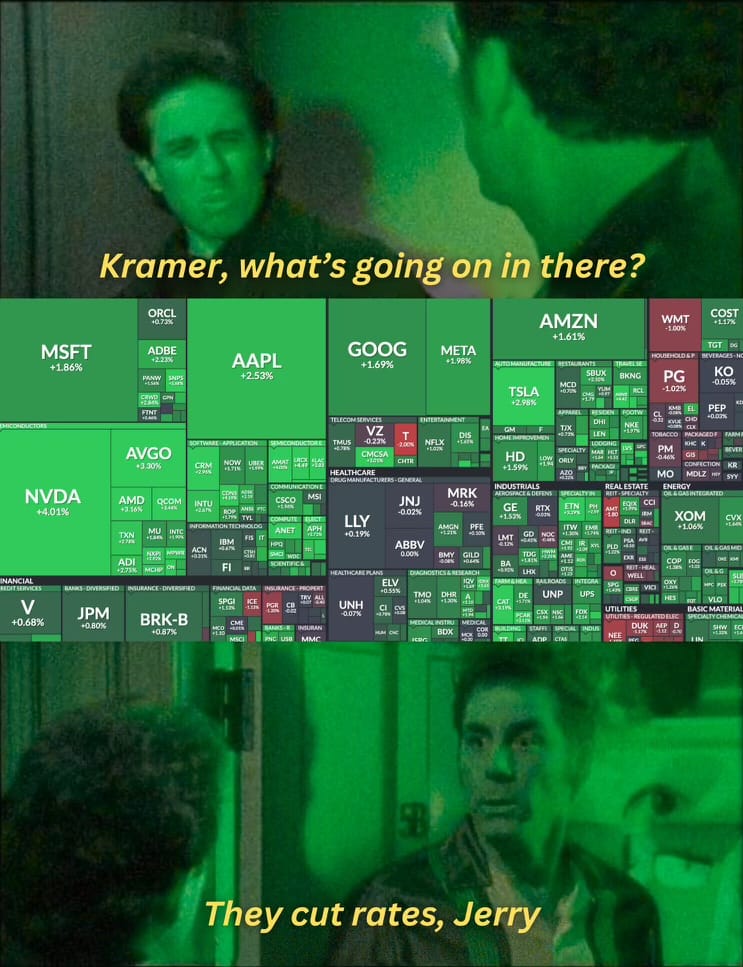
While stocks hesitated the day of the announcement, they took off the following day like a rocket ship. Cody sent me this meme to sum up the market last Thursday.
Last week we provided the DATA (not our guess) about what a Fed rate cutting cycle really means. The conclusion was the direction of the market during the rate cutting cycle will be dependent on the strength of the economy (and thus earnings growth). For more, check out last week's post, which also included a link to our data-driven analysis of the economy at the beginning of the month:

Reading between the lines, the Fed either sees a problem in the banking system, the employment market, or simply believes inflation is under control. One reason for the pause on Wednesday was Chair Jerome Powell using the phrase "recalibrating" multiple times. That left everyone wondering what that really means for the future. Overnight, the (temporary) answer was clear – the stock market believes this is overwhelmingly positive news.
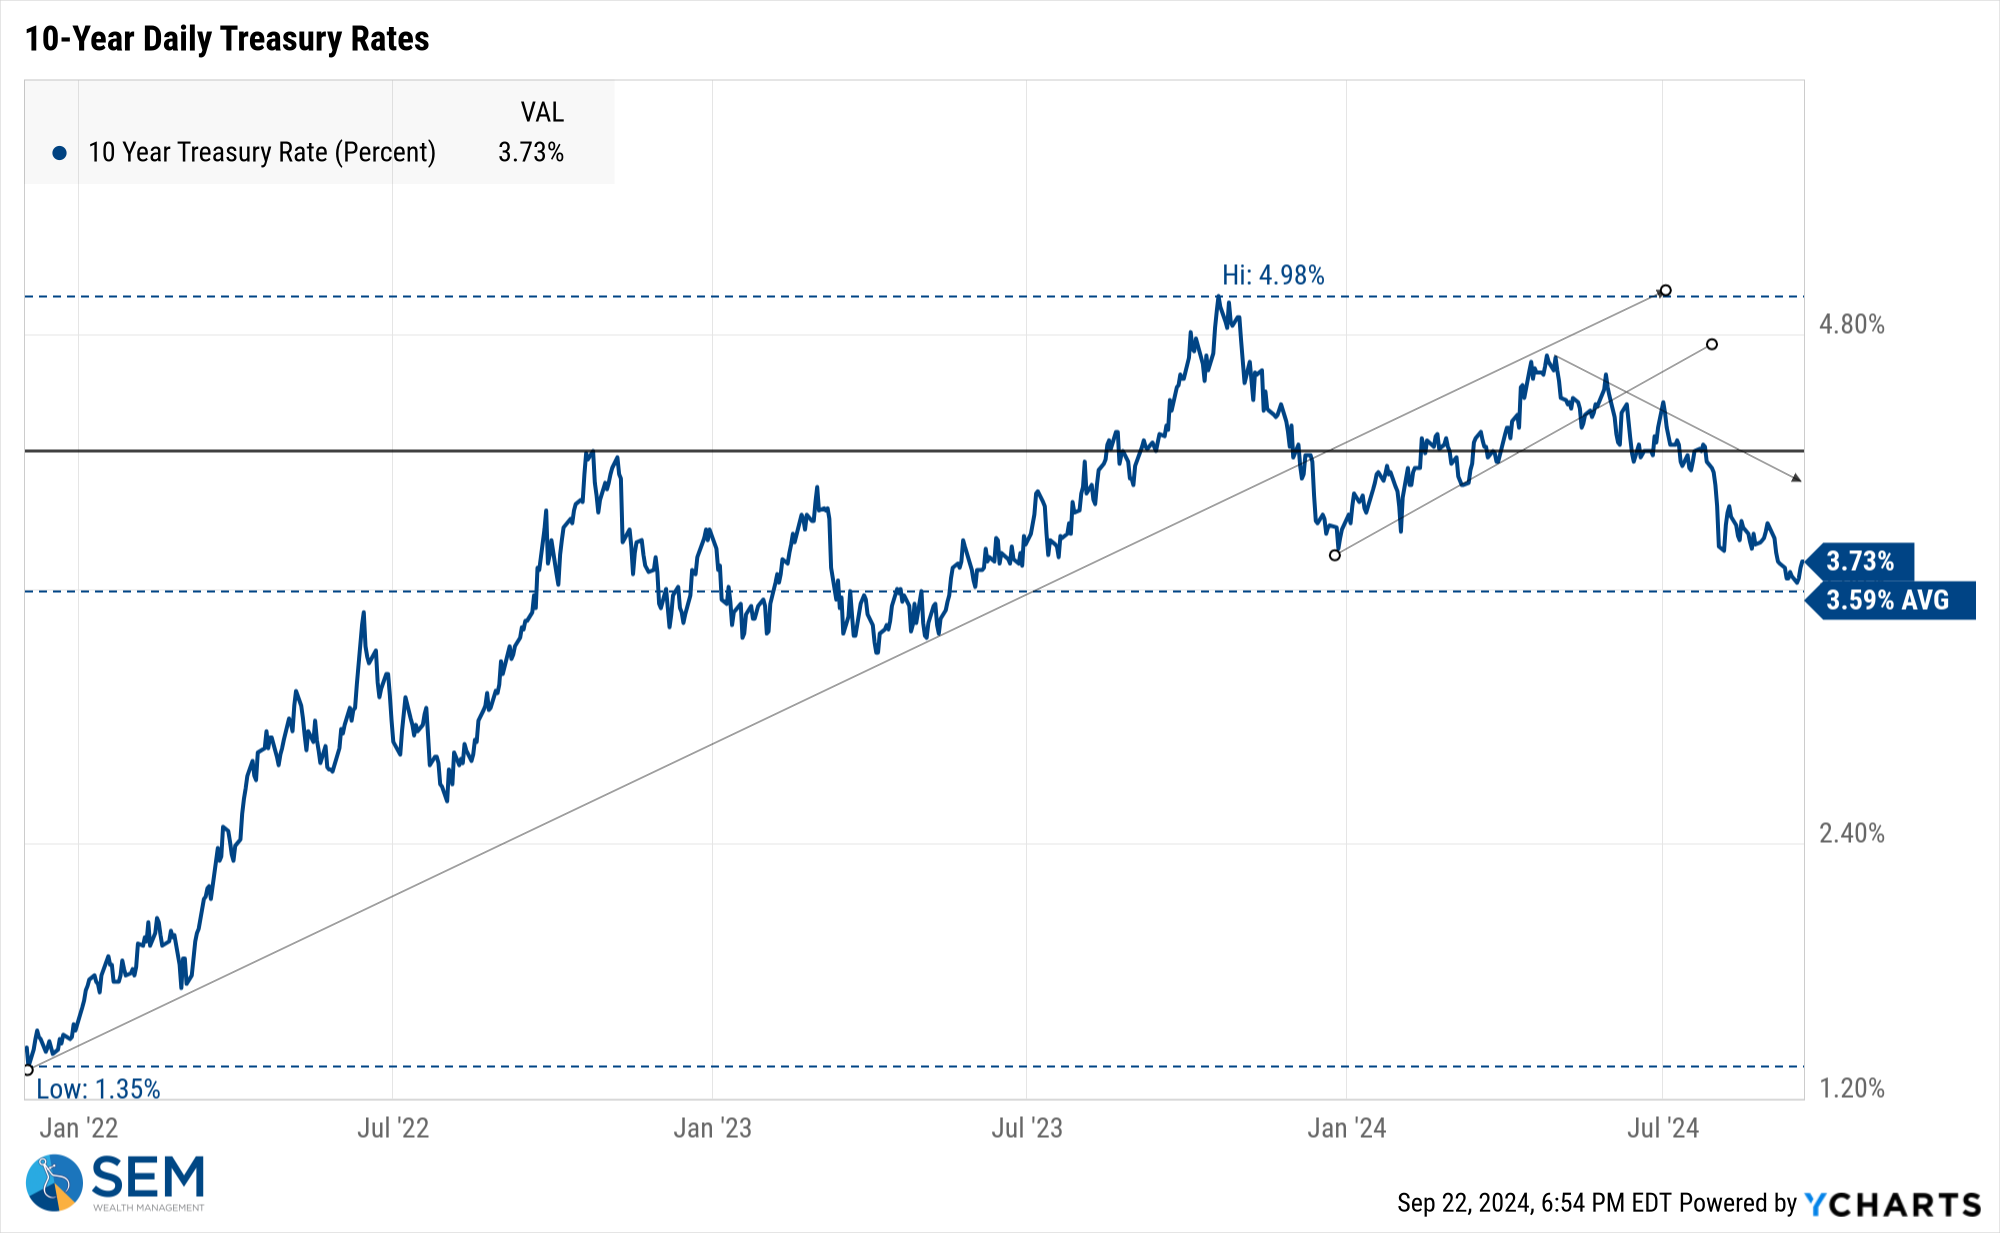
But not so fast, the bond market actually RAISED rates last week based on the yield of the 10-year Treasury bond. Here are a few quick musings from what I saw last week:
- The primary thing the Fed accomplished was encouraging (some) investors to sell their money market and short-term debt investments to buy stocks under the belief that a stock market rally is about to take off as rates come down.
- 1/2% decrease in credit card loans is not going to matter in the whole scheme of things if you're already paying 12-18% on your balances.
- A 1/2% drop in auto loan rates is not going to suddenly spur demand for new vehicle purchases and if demand does go up, prices will also go up (which is inflationary).
- Likewise, big ticket items suddenly being 1/2% cheaper if using debt are not going to be more attractive. If they are, this would also be inflationary.
- More importantly, mortgage rates are likely to go UP unless the Treasury market views this differently in the weeks ahead. Mortgages are tied to long-term Treasury moves, which are set by the 'free' market, not the Federal Reserve.
- One reason Treasury yields increased could be the bond market sees this move as INFLATIONARY. If they are right (like they usually are) the euphoria and anticipation of much lower rates by the stock market could be very short-lived.
- If Treasury rates actually were to come down that could be BAD news for stocks because it means the bond market is concerned it's too late to avoid a recession.
- Lower mortgage rates could also stimulate more housing inflation.
In other words, all of the above means (to me) the euphoria in the stock market could be short-lived. I won't mind if the rally continues in stocks – we are enjoying the gains. However, we should be ready for the bubble to end, possibly suddenly.
On a somewhat related note – my message to everyone expecting this rate cut to save their personal finances – the only person that can save your finances is you – A few months ago we launched a new video series "Money Talks with Dad". It's conversations with our oldest daughter talking about personal finances. Here's the full 2nd episode. If you like it or find it useful we'd love for you to share it with your network.
For more on the current market environment and our positioning, see the next two sections.
Market Charts
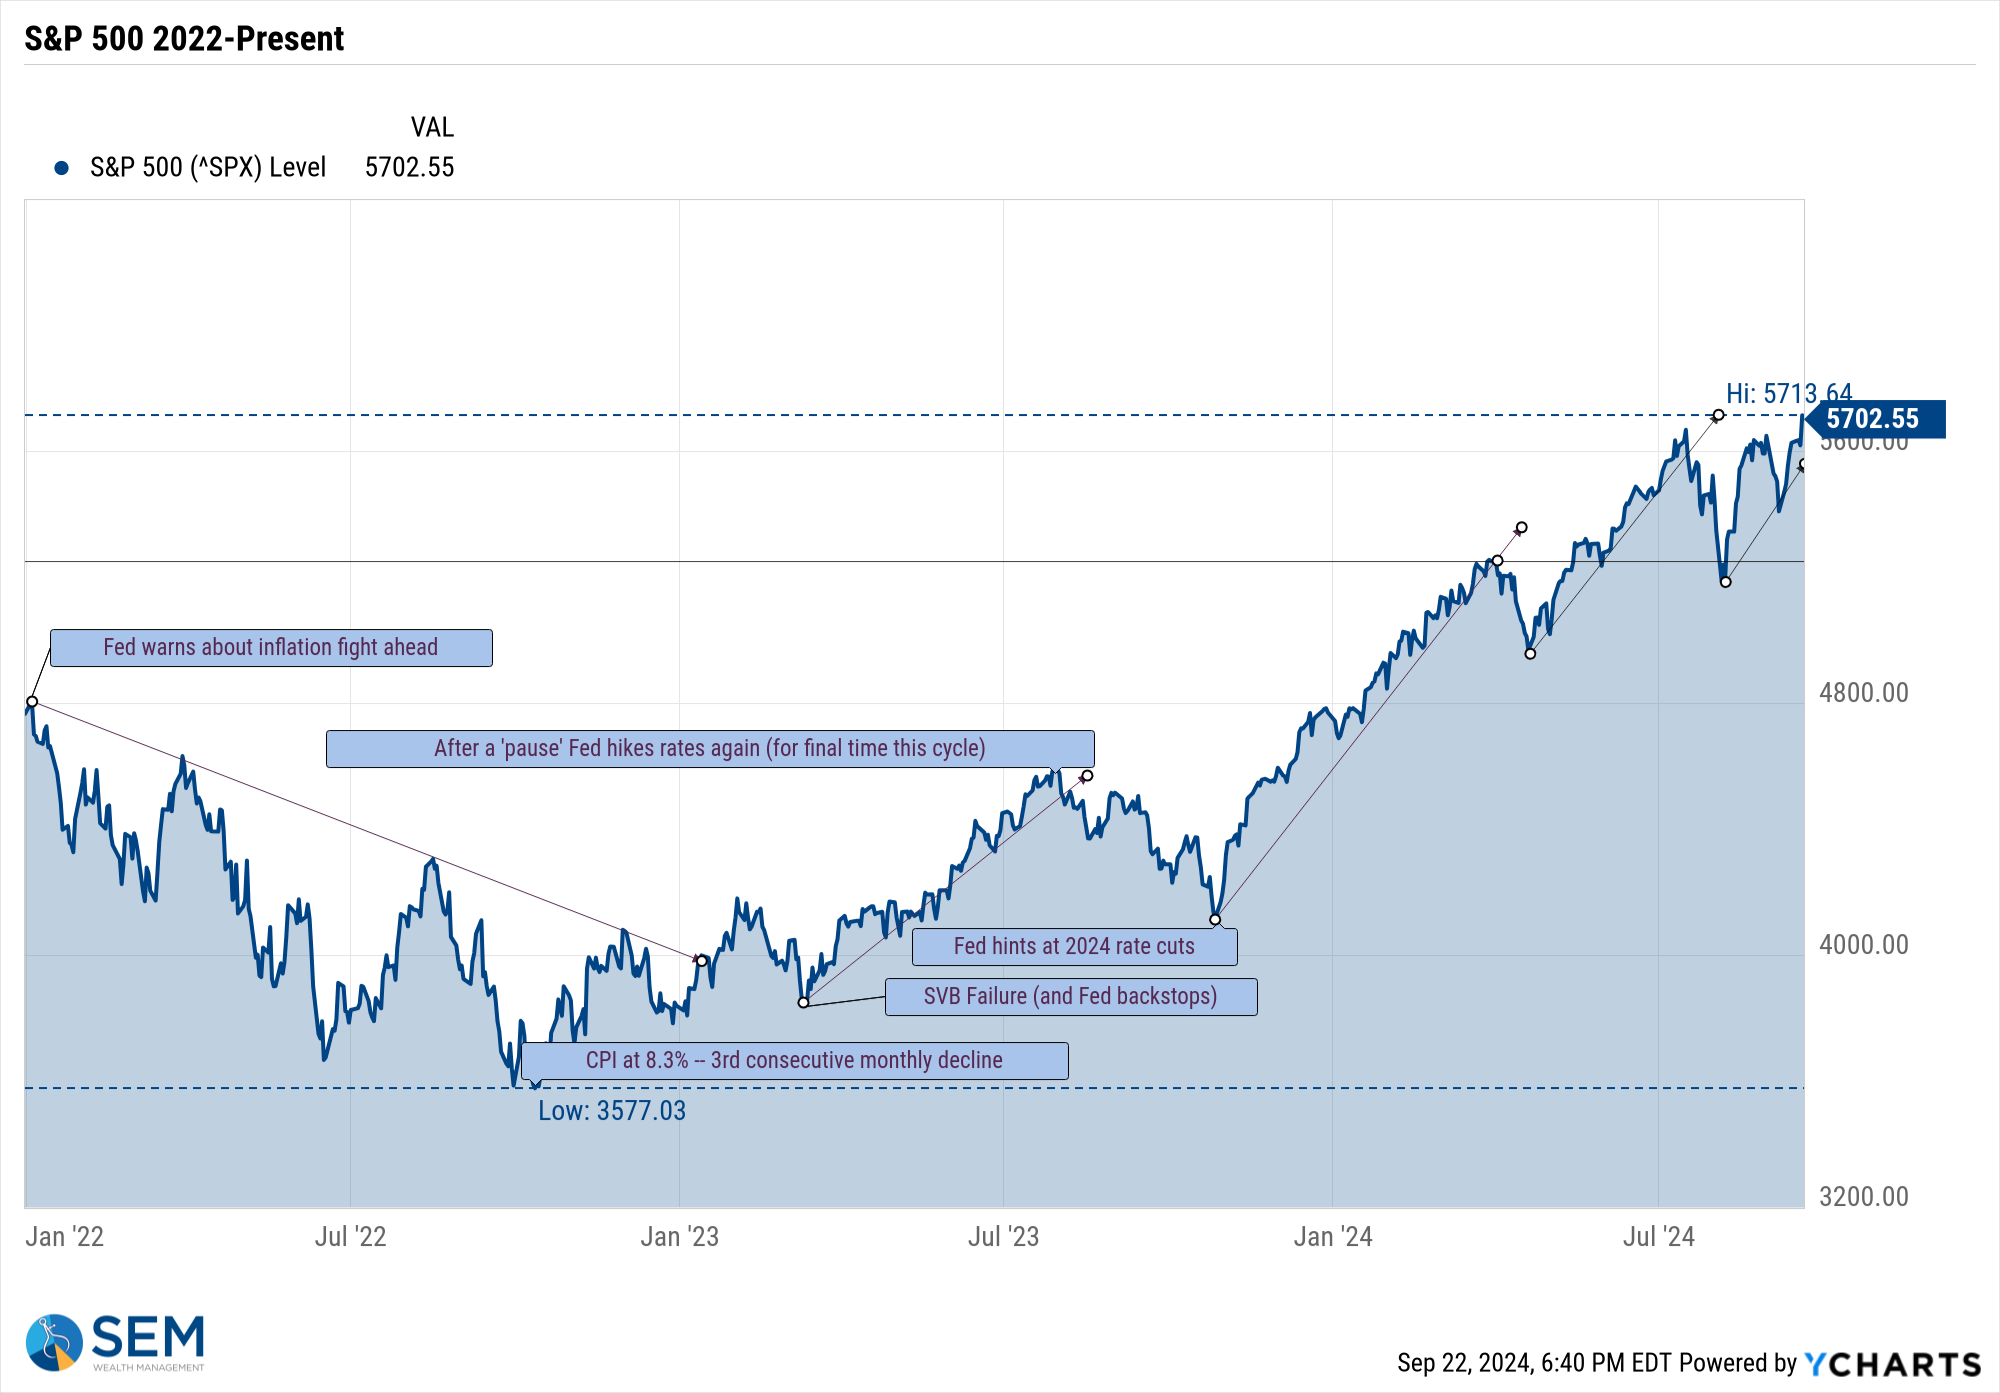
I've said this many times in 2024 – higher highs tend to lead to higher highs — until something significant comes along to change the momentum. A few weeks ago it was a weak payrolls report. For now the Fed has calmed the nerves about a looming recession so we are back to a market that wants to move higher.
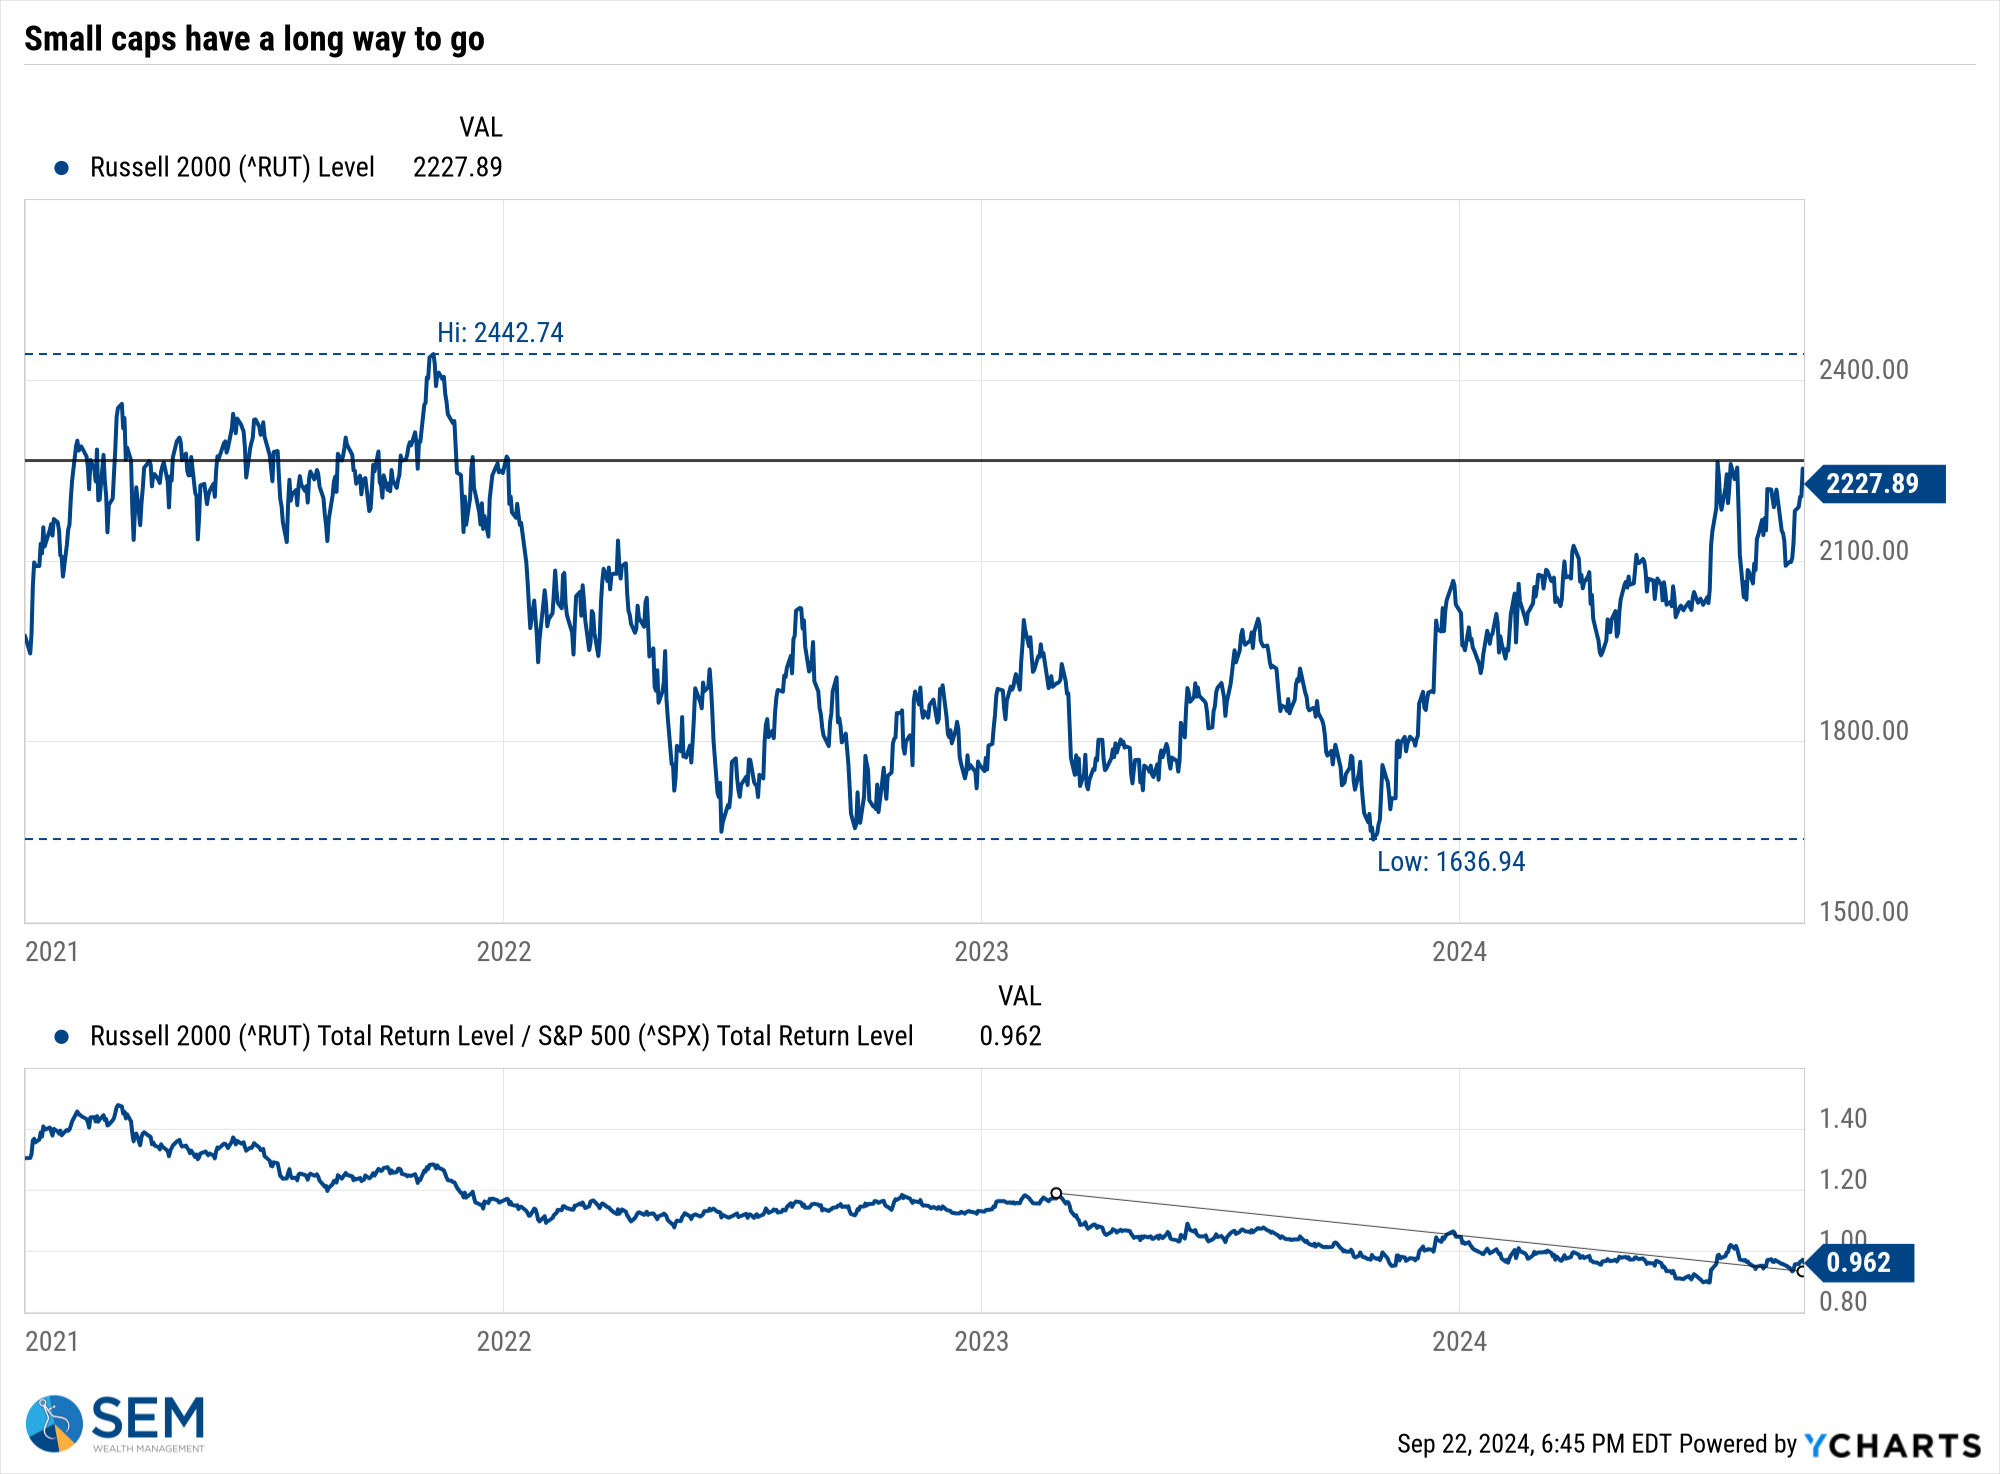
Given the market's rosy outlook, small caps SHOULD be at a point where we see them play catch-up to the mega-cap stocks which have led the way since the end of 2022. This makes this chart one to keep an eye on:
A more important chart to watch is the yield curve. With the Fed "recalibrating" their interest rate policies we should expect the yield curve to move to a more normal position. This means short-term rates need to come down by about 1% with long-term rates staying the same. If short-term rates do not come down enough, we'd expect long-term rates to INCREASE which is bad news for those banking on bonds. It's also bad news for those hoping the Fed rate cuts do anything more than inflate a temporary stock bubble. As noted above, the only way rate cuts actually help is if LONG-TERM rates actually move lower.

Long-term yields have come down significantly, but the reaction after the Fed cut rates last week has been for rates to drift higher.
SEM Model Positioning
-Tactical High Yield had a partial buy signal on 5/6/24, reversing some of the sells on 4/16 & 17/2024 - the other portion of the signal remains on a sell as high yields continue to oscillate.
-Dynamic Models are 'neutral' as of 6/7/24, reversing the half 'bearish' signal from 5/3/2024. 7/8/24 - interest rate model flipped from partially bearish to partially bullish (lower long-term rates).
-Strategic Trend Models went on a buy 11/27/2023; 7/8/24 – small and mid-cap positions eliminated with latest Core Rotation System update – money shifted to Large Cap Value (Dividend Growth) & International Funds
SEM deploys 3 distinct approaches – Tactical, Dynamic, and Strategic. These systems have been described as 'daily, monthly, quarterly' given how often they may make adjustments. Here is where they each stand.
Tactical (daily): On 5/6/24 about half of the signals in our high yield models switched to a buy. The other half remains in money market funds. The money market funds we are currently invested in are yielding between 4.8-5.3% annually.

Dynamic (monthly): The economic model was 'neutral' since February. In early May the model moved slightly negative, but reversed back to 'neutral' in June. This means 'benchmark' positions – 20% dividend stocks in Dynamic Income and 20% small cap stocks in Dynamic Aggressive Growth. The interest rate model is slightly 'bullish'.

Strategic (quarterly)*: BOTH Trend Systems reversed back to a buy on 11/27/2023
The core rotation is adjusted quarterly. On August 17 it rotated out of mid-cap growth and into small cap value. It also sold some large cap value to buy some large cap blend and growth. The large cap purchases were in actively managed funds with more diversification than the S&P 500 (banking on the market broadening out beyond the top 5-10 stocks.) On January 8 it rotated completely out of small cap value and mid-cap growth to purchase another broad (more diversified) large cap blend fund along with a Dividend Growth fund.
The * in quarterly is for the trend models. These models are watched daily but they trade infrequently based on readings of where each believe we are in the cycle. The trend systems can be susceptible to "whipsaws" as we saw with the recent sell and buy signals at the end of October and November. The goal of the systems is to miss major downturns in the market. Risks are high when the market has been stampeding higher as it has for most of 2023. This means sometimes selling too soon. As we saw with the recent trade, the systems can quickly reverse if they are wrong.

Overall, this is how our various models stack up based on the last allocation change:

Questions or comments - drop us a note?
Curious if your current investment allocation aligns with your overall objectives and risk tolerance? Take our risk questionnaire


