
Everything becomes more clear as we gain the benefit of hindsight. My experience and SEM's use of quantitative models which remove emotion from the decision making certainly makes it a bit easier for me to see things a bit more clearly in real-time, but I am also human and there are times where I too believe the latest "big" news event is the very thing which will drive growth (or lack of it) for the foreseeable future.
The first 10 weeks of this year have been mentally exhausting, even for SEM where we base decisions on DATA not expected changes based on the latest headlines. Multiple times a day this year we have some type of headline that moves markets up or down. Sometimes those moves are quickly reversed, others start a mini up or down trend.
NOTE: I realize in today's world we are politically divided. When we hear things which may disagree with our opinions, we instantly become defensive. That's natural. The purpose of this blog is to provide a look at EVERYTHING which is moving the markets and economy. Unfortunately, sometimes it is POLITCS which are the primary focus. I do my best to keep my personal opinions out of it and focus simply on the DATA, including market history.
More importantly, NO DECISONS AT SEM ARE BASED ON OUR OPINIONS. The data behind our systems is apolitical. We do not care WHAT is moving the markets or make guesses about what may change. If the data says to buy/sell we follow the data.
If anything in this blog or others offends you, I'd love to hear from you. There is a comment box at the bottom of the page. As I say often when I discuss what's happening with other investment managers – help me make sense of this. I'm always trying to learn and see everyone's point of view.
Following the re-election of Donald Trump I warned that while there are plenty of "good" economic policies that likely will come to fruition, NOBODY can predict how many "bad" economic policies will also be implemented and in which order they will arrive. He made so many campaign promises it would be impossible to take action on all of them in the first few weeks or months of the presidency.
A few things are becoming more clear. The top priorities for the President seem to be centered around immigration, fentanyl deaths, the trade deficit, DEI, and cutting as much of the government bureaucracy as possible. Lost in the background is the promise to cut prices and push through not only his 2017 tax cuts, which are set to expire at the end of this year, but to expand them. We also haven't seen much in the way of de-regulation.
The problem for the markets, is they BANKED on lower regulations and EXPANDED tax cuts to be the vehicle to drive ABOVE AVERAGE growth in 2025. 3 months into the year corporations are reporting SLOWER revenue growth and INCREASING costs. Consumer sentiment is approaching the lows of the Biden years as inflation is moving UP. I always remind people the way we measure a president's success is flawed. It takes YEARS for policies to fully be reflected in the economy and thus the stock market. The problem is the market somehow expected it to be different this time.
One thing we've learned from Trump 1.0 and even the first few months of Trump 2.0 is this — the priorities can quickly change and we should not make big bets on what we think is going to happen next.
As I've said many times the past 10 weeks – I am glad SEM follows a data driven, quantitative approach. I'm not sure how ANYBODY can confidently make a prediction on what will happen with economic or earnings growth this year.
With that said, here's some of my notes on what happened last week:
Tariff Whipsaw (Again)
I don't know how anybody keeps track of what tariffs have been implemented, what products they cover, what companies or products are exempt, and how long any of the exemptions last. I will leave that to the experts, but it is becoming clear that tariffs will be MUCH higher than anything we saw during Trump 1.0 (which Biden kept in place). Here is StoneX's tracking of the possible tariff rate based on the various tariffs already implemented along with those promised by President Trump.
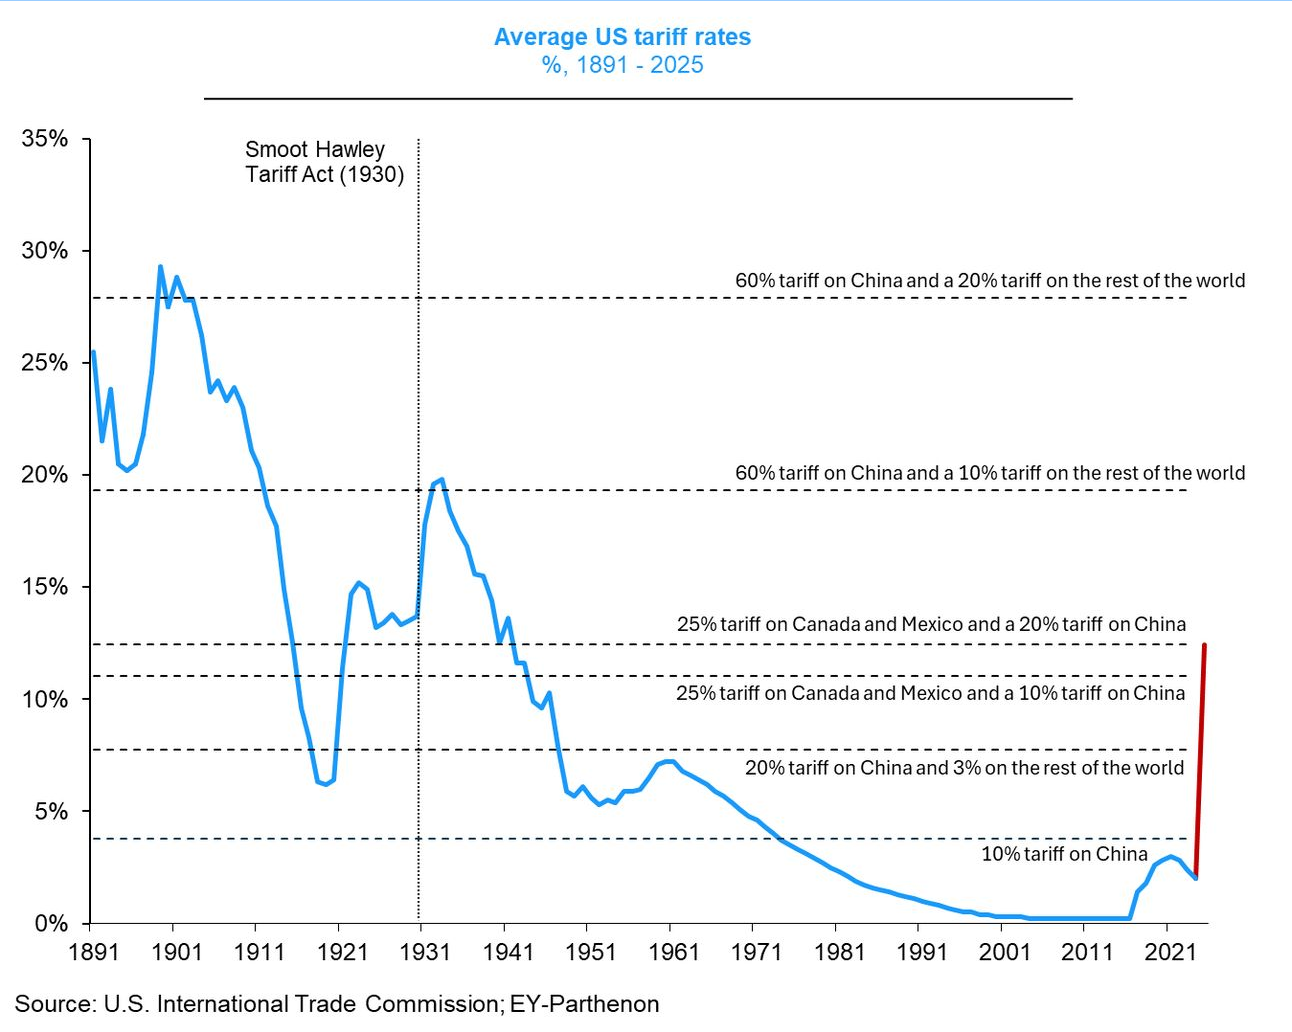
The red line reflects what was implemented on Tuesday (and then partially removed for US automakers the next day for 20 days......again). We are rapidly approaching the Tariff levels of the 1930s. History tells us that this was a terrible mistake. Anybody remember this scene from Ferris Bueller?
By the way, the person playing the teacher, Ben Stein is actually an economist.
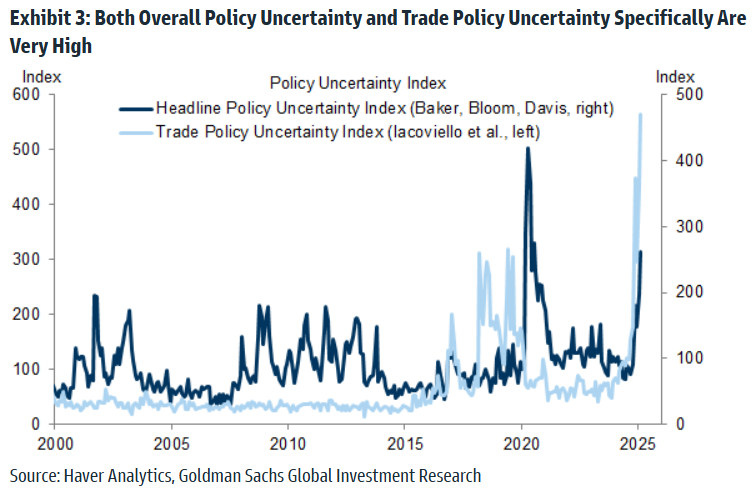
The constant whipsaw on trade is creating the highest level of uncertainty for markets since 2020. Markets to not like uncertainty, especially when we are coming off of two fantastic year for (large cap) stocks with expectations of more of the same under the Trump administration.
The biggest issue the market has with these tariffs is the stated purpose (reducing illegal immigrants and fentanyl from crossing the Canadian and Mexican borders) does not make sense to most and seems to be a moving target. Yes, we had a growing problem during the Biden administration, but we have seen a significant decline in border activity with the most recent data through 2024.
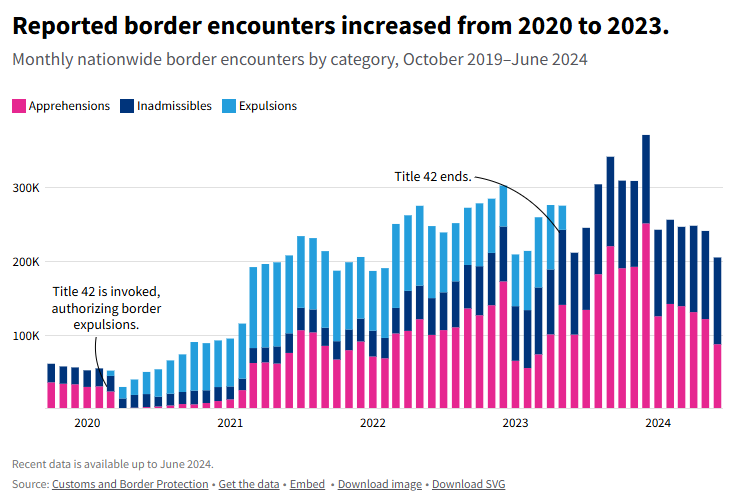
According to the Trump administration, the Border Patrol arrested 8,300 migrants at the southern border in 2024. That's a shocking drop when you consider 141,000 migrants were arrested at the border in February 2024. 29,000 were arrested in January. The trend is going in the right direction on illegal immigration.
Fentanyl deaths in the US dropped from just under 80,000 in 2023 to 58,000 in 2024. To put that number in perspective, 186,000 Americans died in the past year from COVID-19. Heart disease kills over 700,000 Americans each year with another 600,000 dying from cancer. 165,000 Americans die from strokes each year and Diabetes kills over 100,000 people in the US. Liver disease claimed 55,000 lives, about the same number of people who died from a fentanyl overdose.
Our economy was improving over the back half of 2024. Inflation was trending down. Now all of that is threatened to fight something that at least according to the data should not be in the top 10 list of things that our country needs to fix immediately.
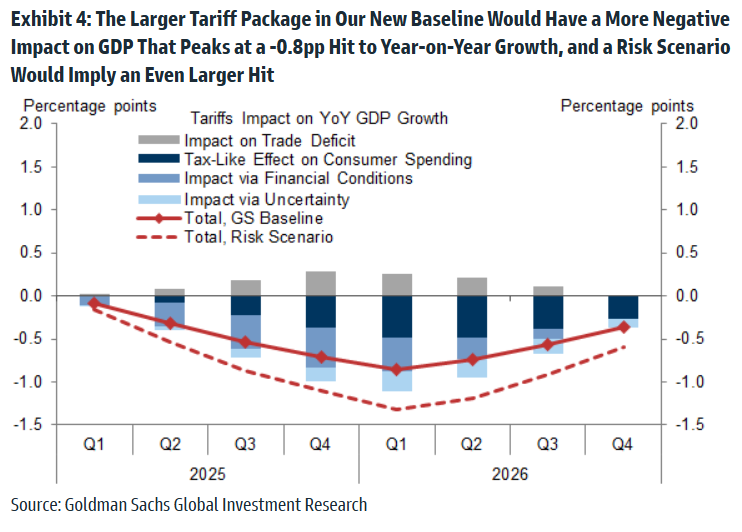
Goldman's new inflation baseline has core inflation rising to nearly 3%, with a risk it could push above that.
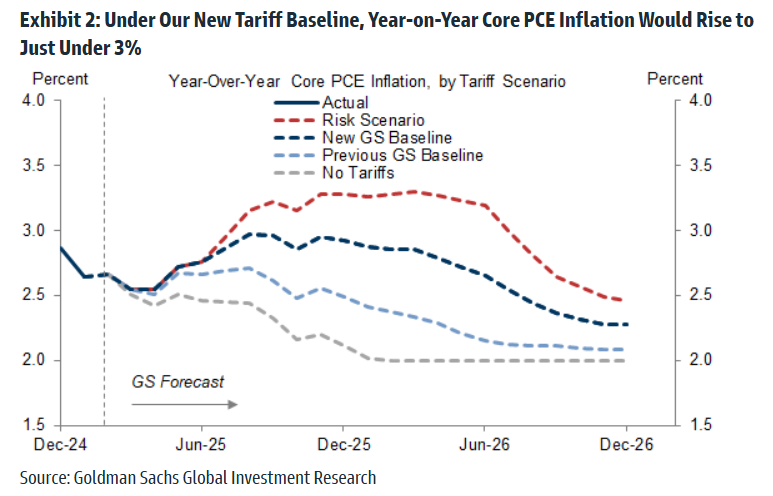
Goldman's new assessment on the latest tariff news has them expecting GDP to be down more than 3/4% from the previous estimate.
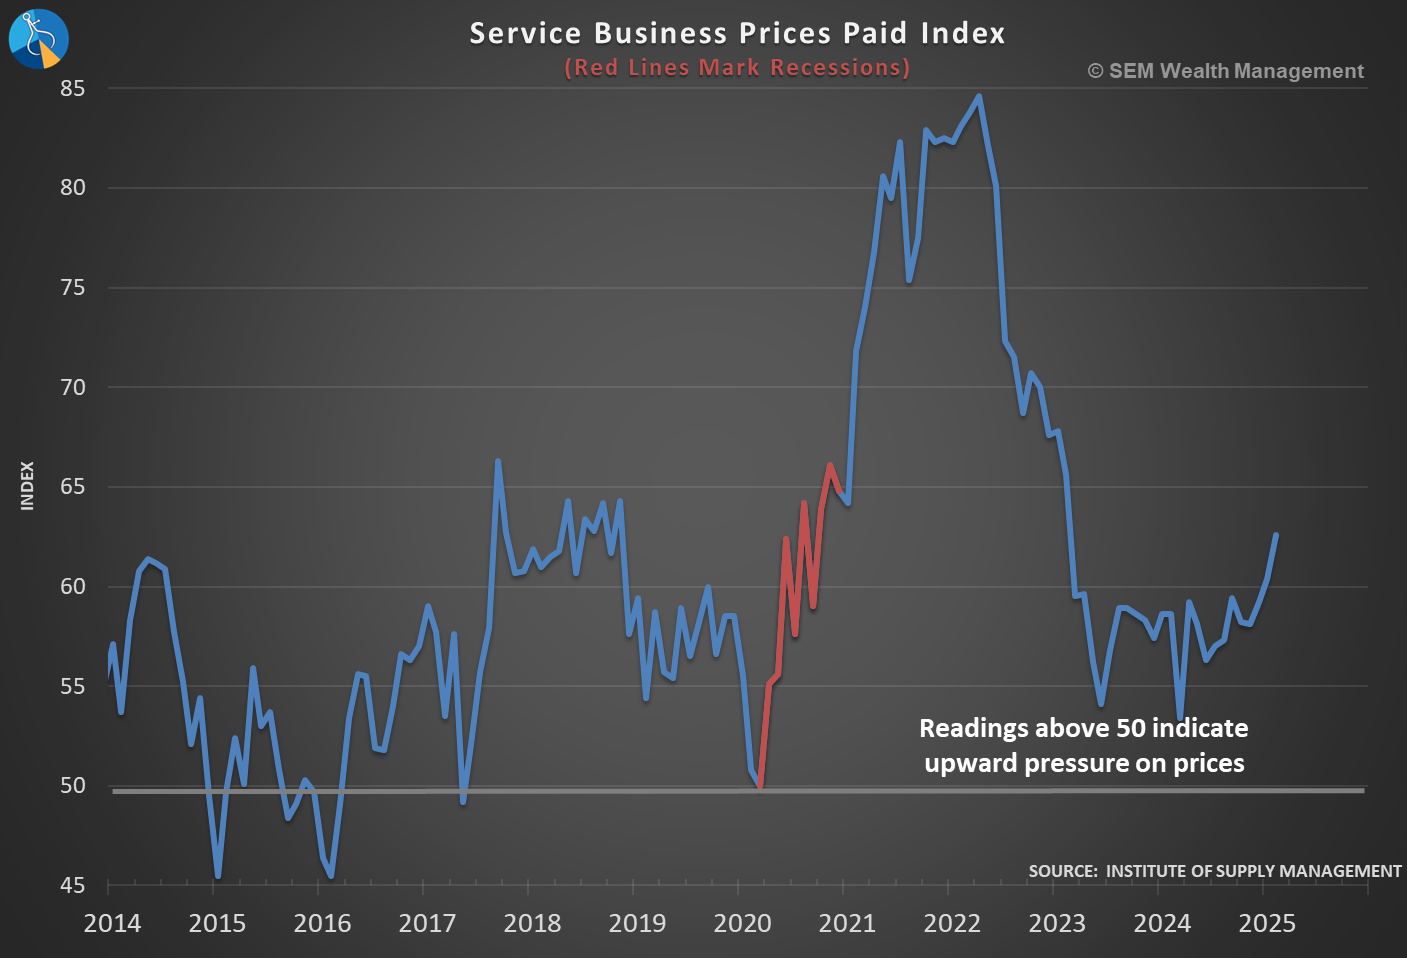
Pricing Pressure Increasing
It is too early to tell if the expectations for an increase in inflation come to fruition, but we area already seeing both manufacturing and service business reporting a sharp increase in prices.
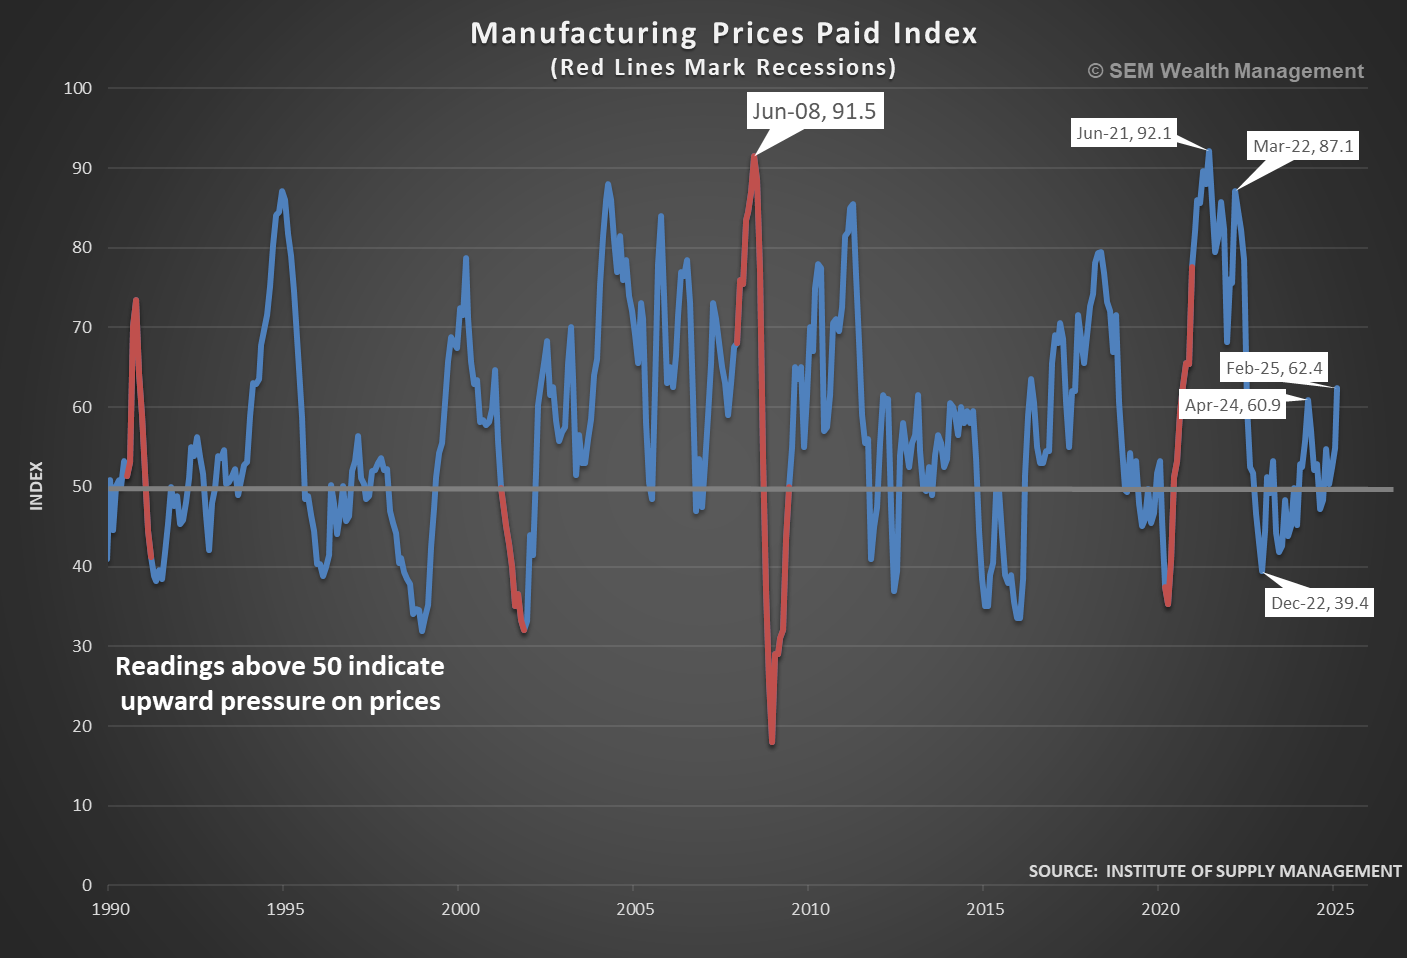
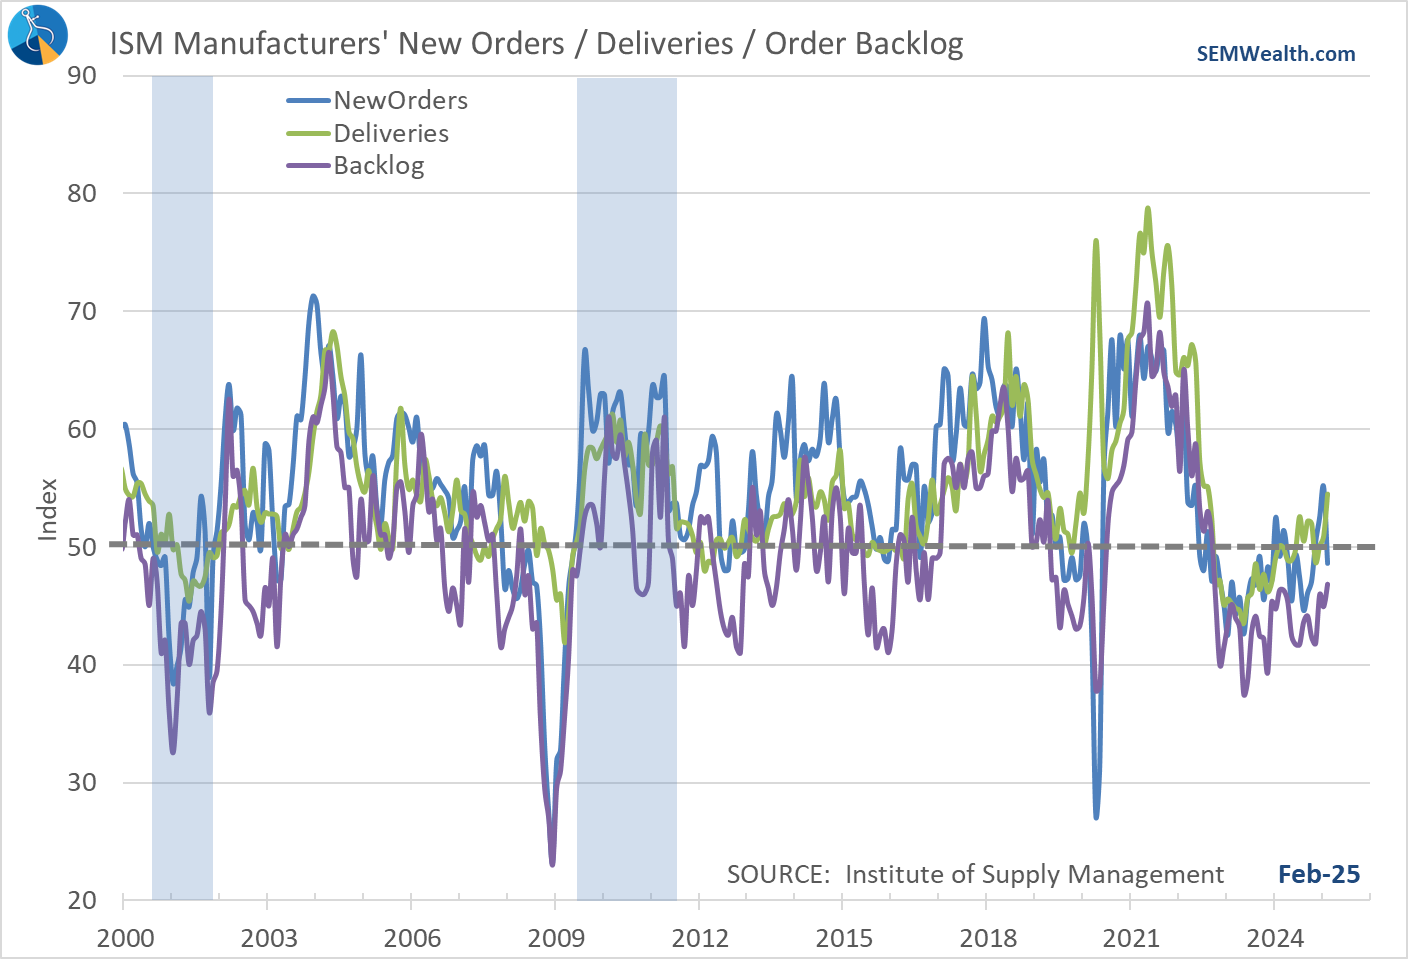
This is the earliest sign of the impact tariffs could cause for US companies and consumers. Normally, prices are driven by supply and demand. This increase in prices could be due to companies trying to get ahead of any tariffs by pushing their inventory purchases up, which is something we saw show up in a few economic reports including the ISM Manufacturing one where Supplier Deliveries grew the Order Backlog increased a bit and New Orders fell.
It is far too early to know the what, how much, who, and why behind any tariff increases, but this is something that does raise caution for anybody who believes there will not be a significant impact on our economy (and the Fed's ability to continue lowering interest rates.)
Consumers are Anxious
The final reading of Consumer Sentiment showed the preliminary reading for February was understating how anxious consumers had become. Consumer Sentiment has now fallen to the lowest levels since October 2023 (just before the stock market bottomed).
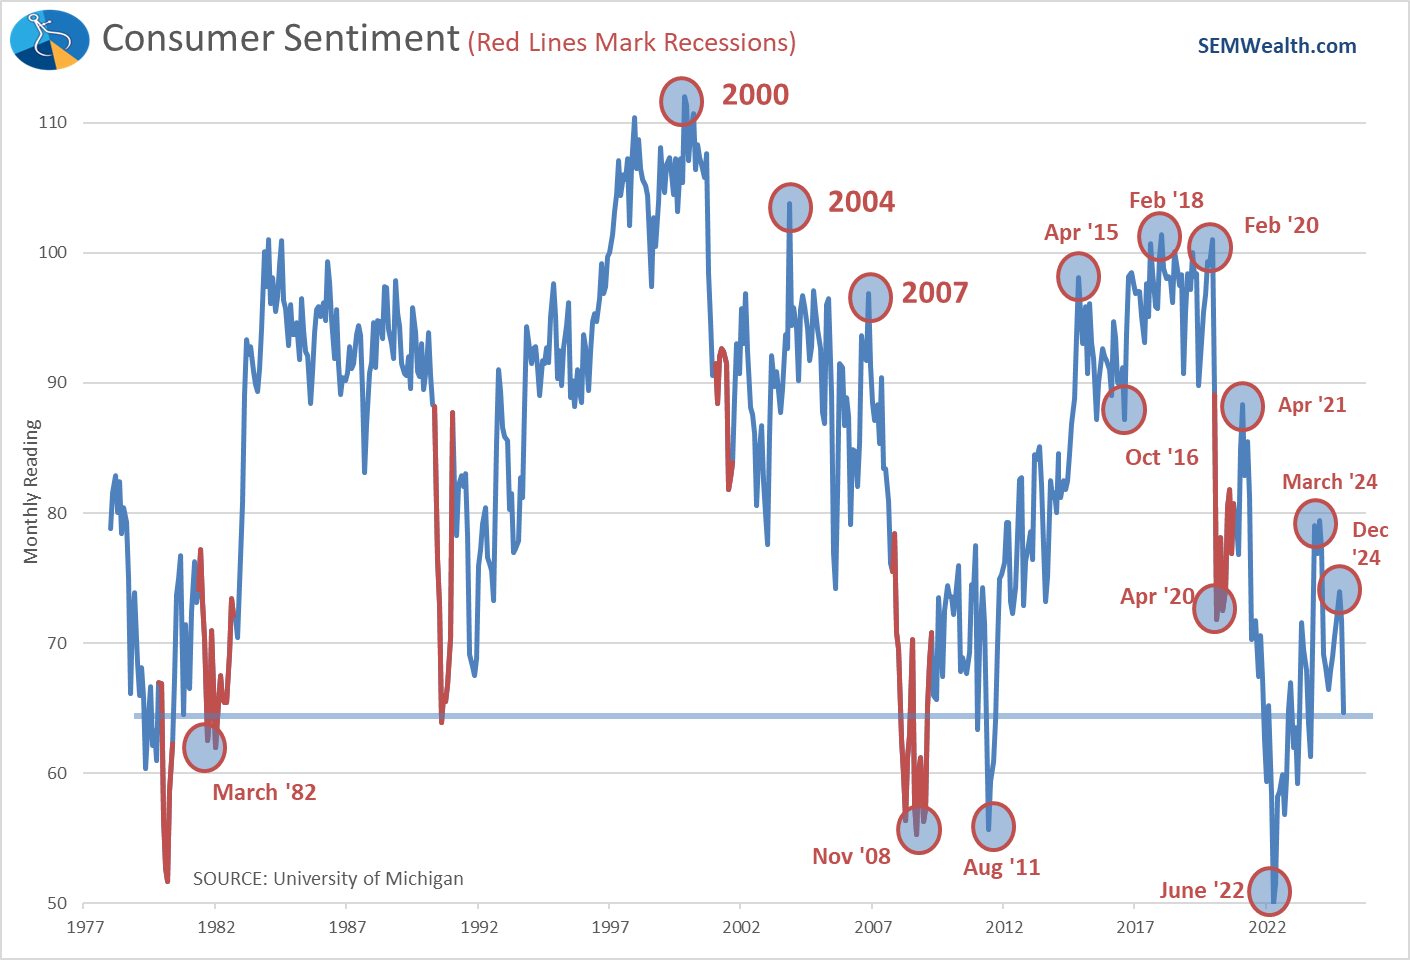
The chart shows this could quickly reverse, but it is an indication that the base of our economy (consumer spending) is weakening.
Capacity Utilization Up
One benefit from the Trade War and what should be the stated purpose (to make more things in the US, not stopping fentanyl or illegal immigration) is to make more things in the US. The data through January showed a slight move in the right direction with Utilization growing for the first time in a year.
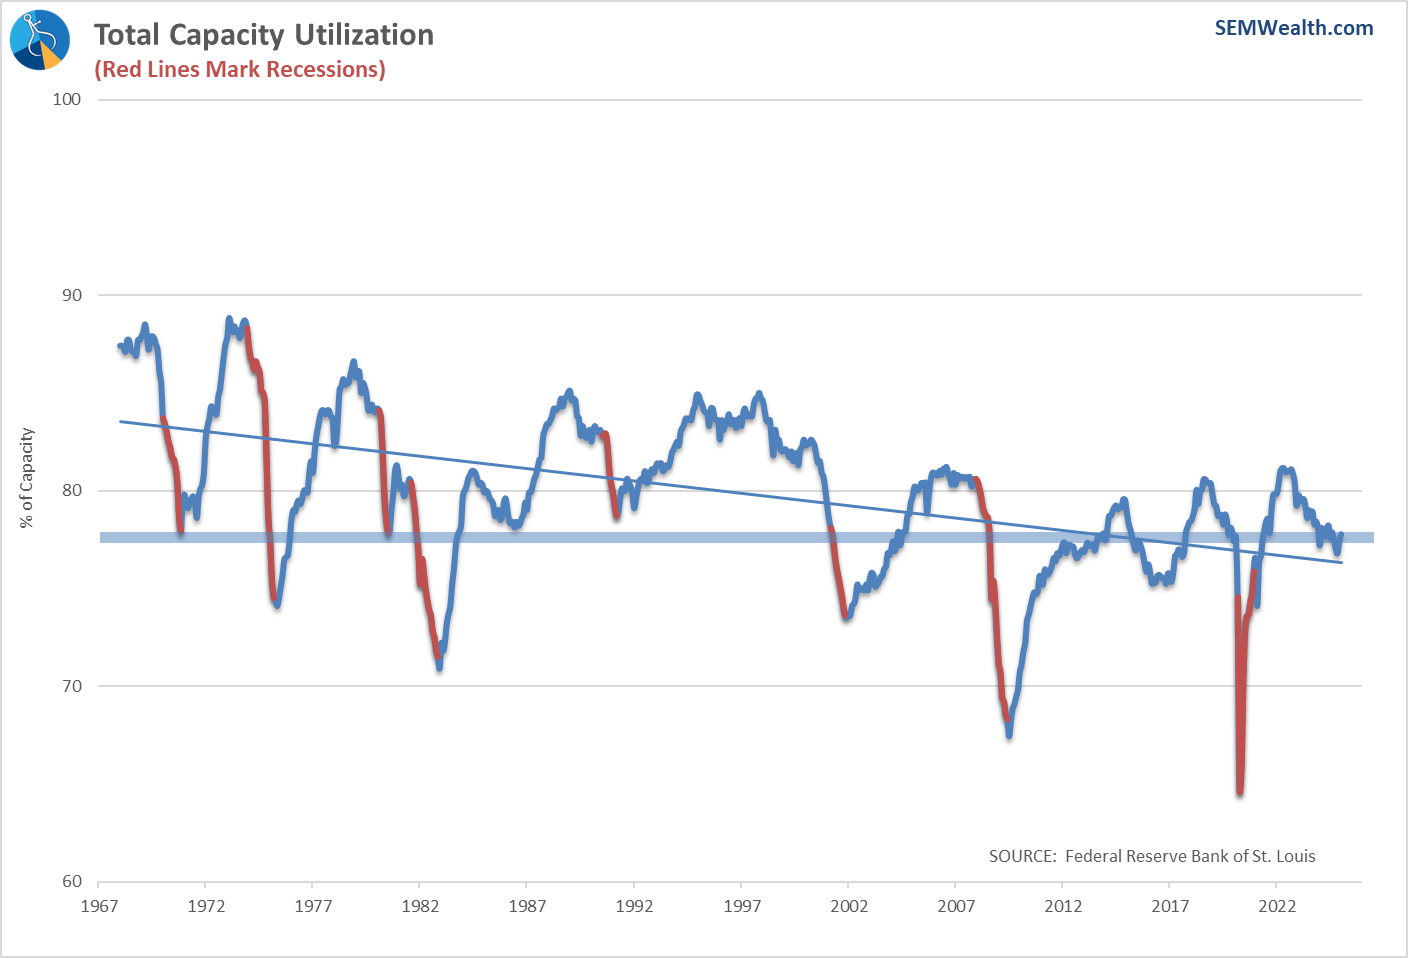
It is obviously way down from the peak in 2021, but is a critical leading indicator we should be watching for early signs of success during the trade war.
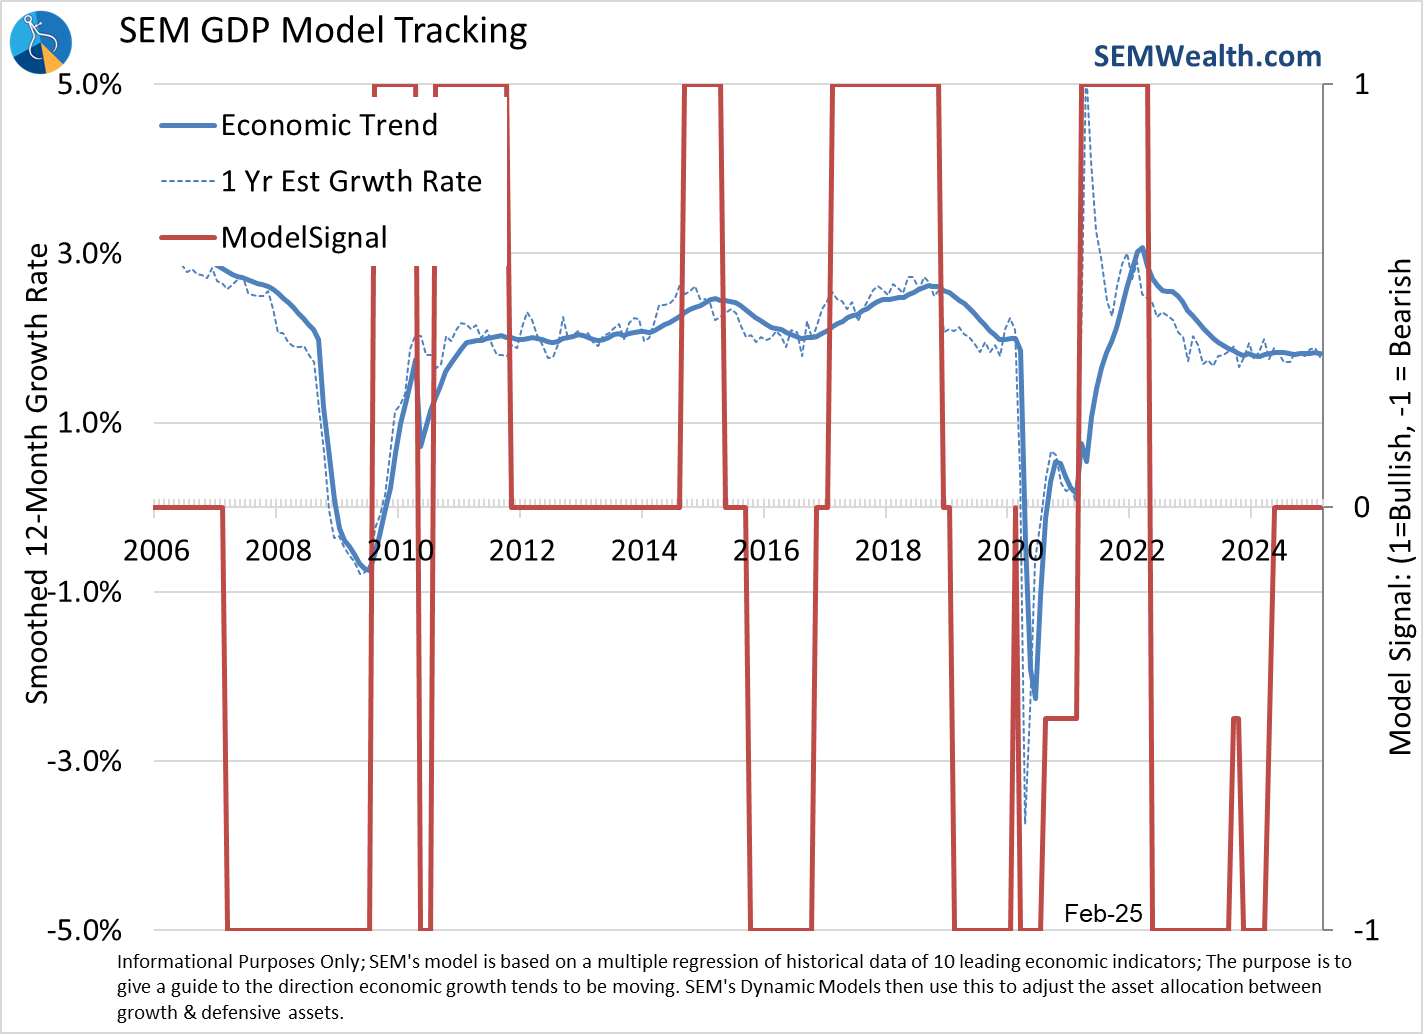
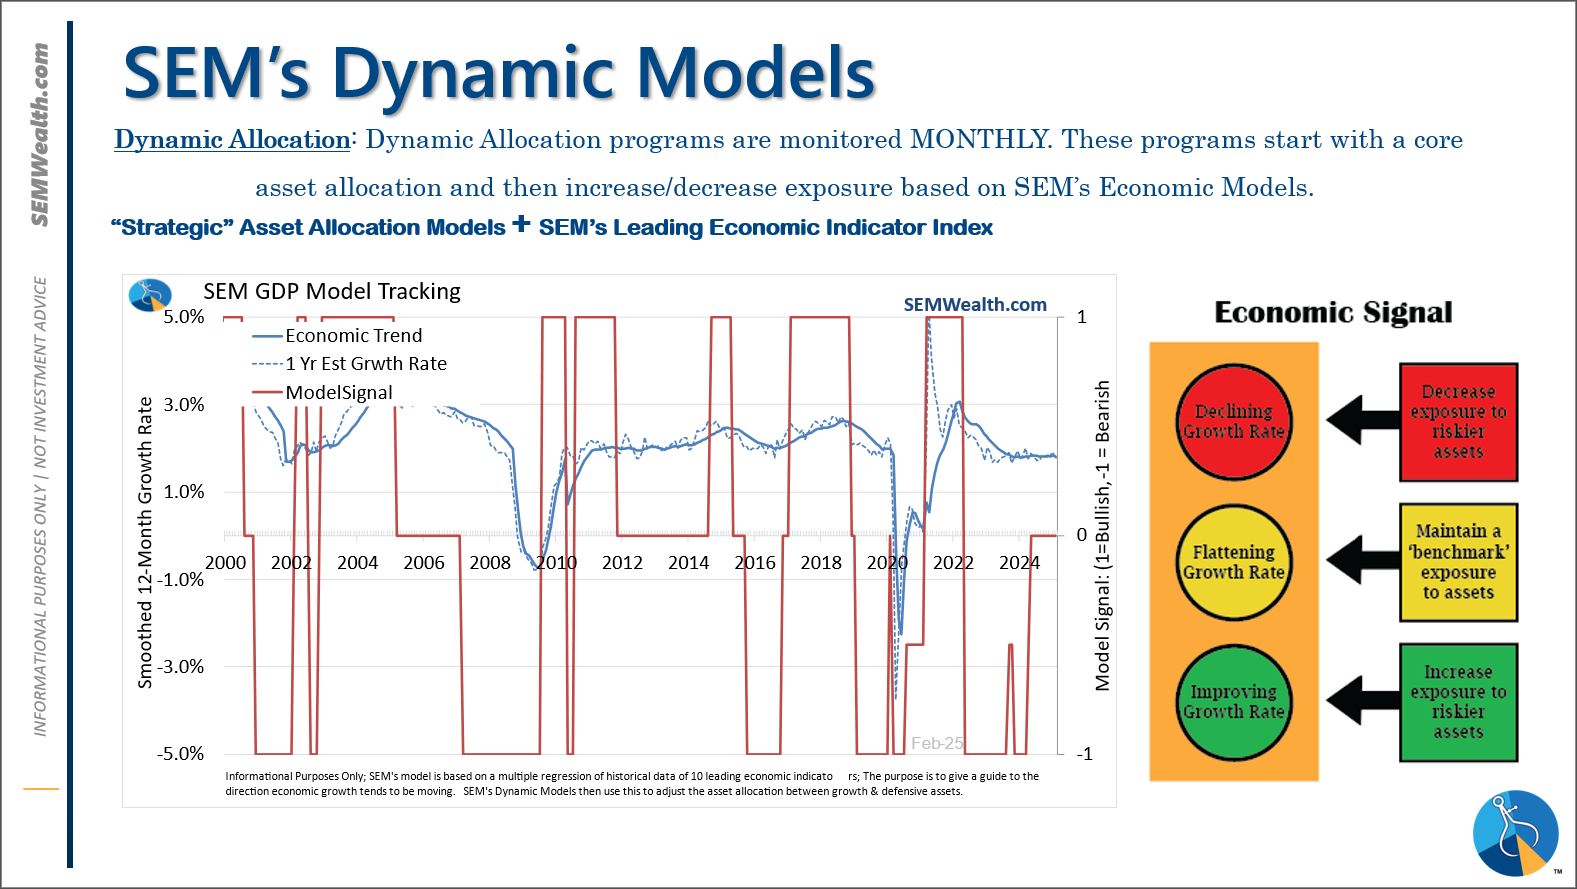
SEM's Economic Model still Neutral
The past few months during our economic update I mentioned how our quantitative economic model, while still neutral was trending towards "bullish" (higher than average growth). That has since reversed. We are still neutral, but now the model is (slightly) leaning towards the "bearish" side (lower than average growth).
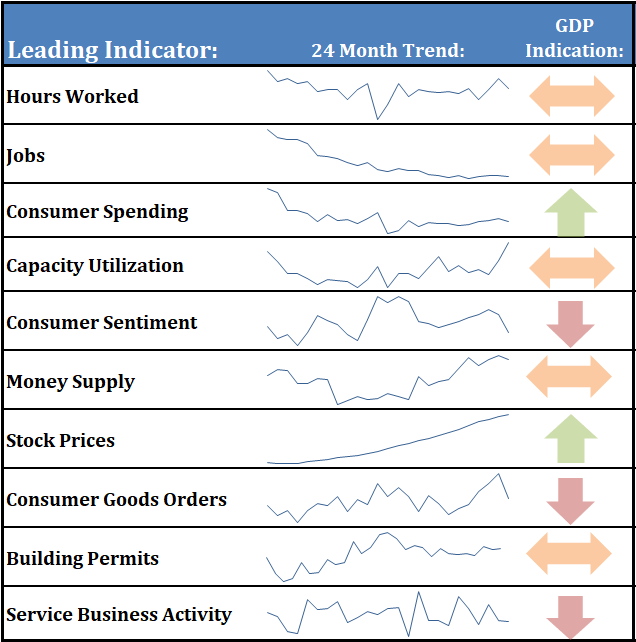
I created a new heatmap to go along with our monthly dashboard. It allows us to see which parts of the economy are doing well and which may be weakening.
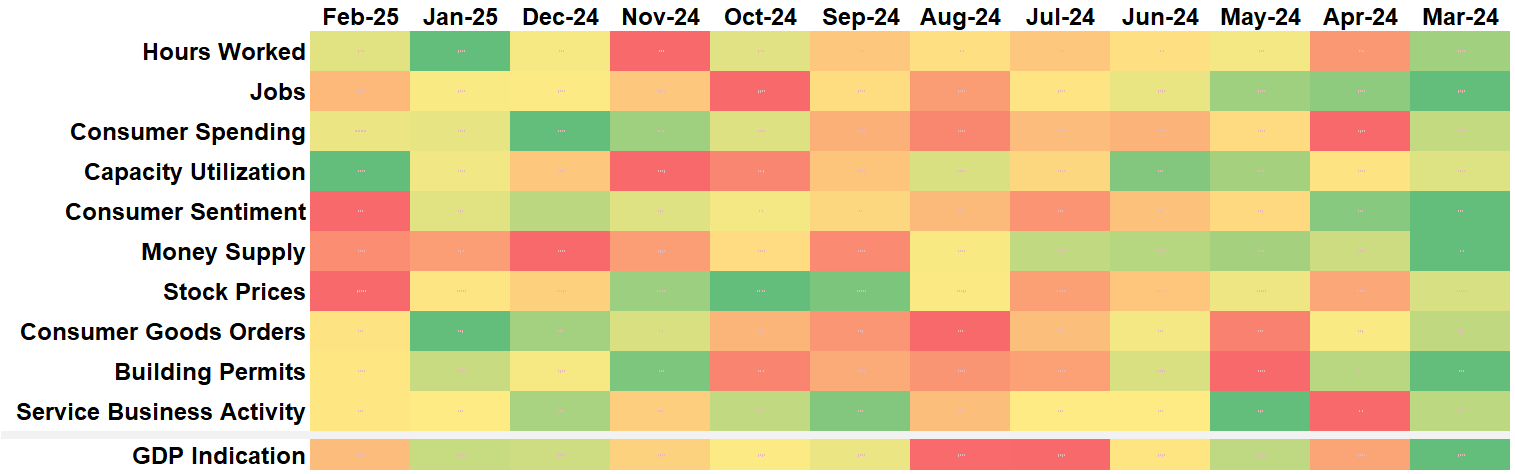
Overall, things are not great, but they are also not bad.
Market Charts
Many people, myself included thought President Trump was so interested in using the stock market as a benchmark towards his success that he would reverse his policies if the market went down too much. So far, that does not seem to be the case. Stocks closed the week last week just below the closing level of election day.
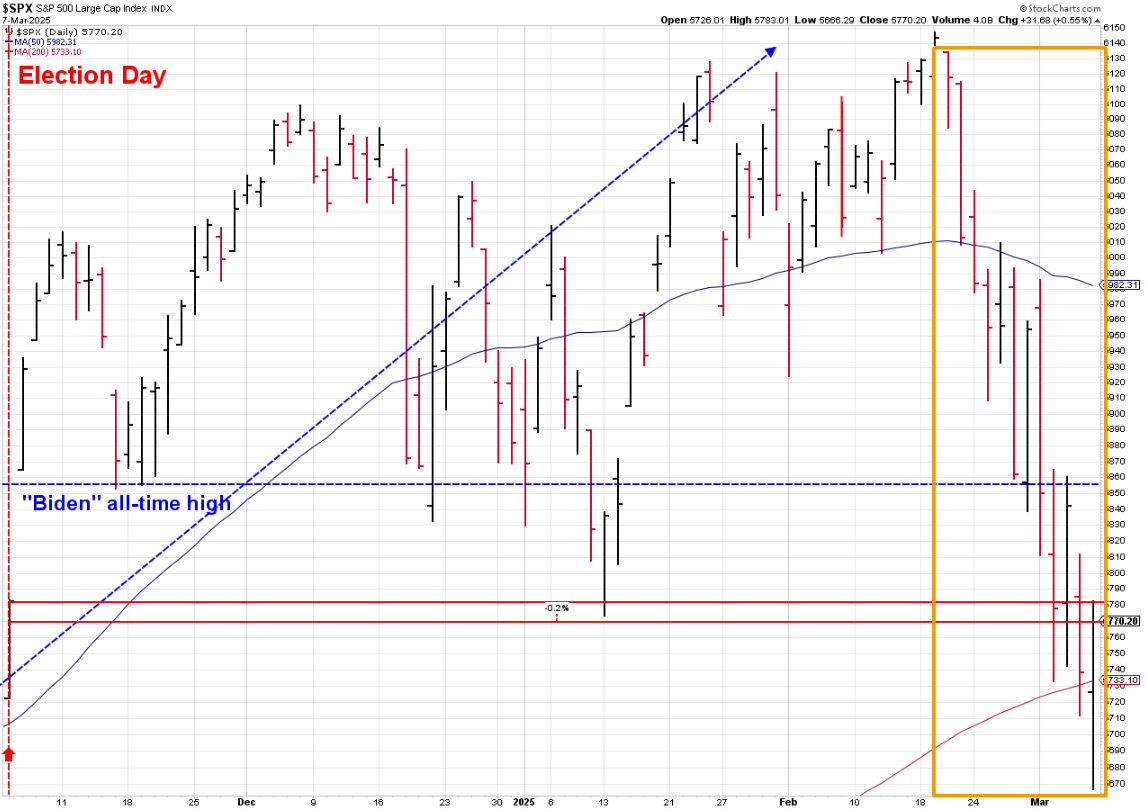
We talked about the uncertainty the market is facing and how much they hate it above. Note the range of daily prices in the orange box above compared to what we saw from election day up until mid-February.
More importantly, the uptrend started in the fall of 2023 when the Fed ended their interest rate hikes has been violated. The 200-day moving average, a measure of longer-term trends, is still holding and there could be some buying support between here (election day close) and 5700 (election day opening price).
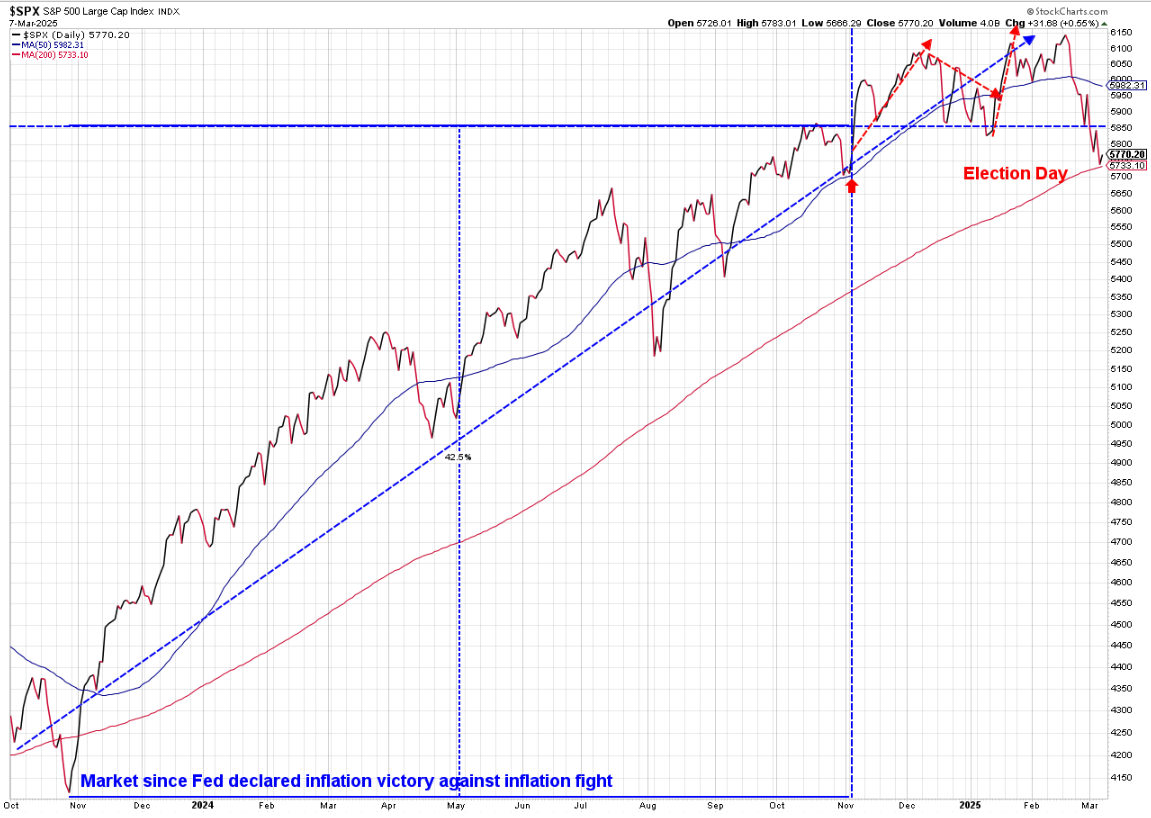
Below that it could get dicey. We all know with back-to-back years of well above average returns and expectations for more of the same (and higher than average earnings growth), there is an extreme risk of a much bigger correction regardless of who is President or what the policies will be.
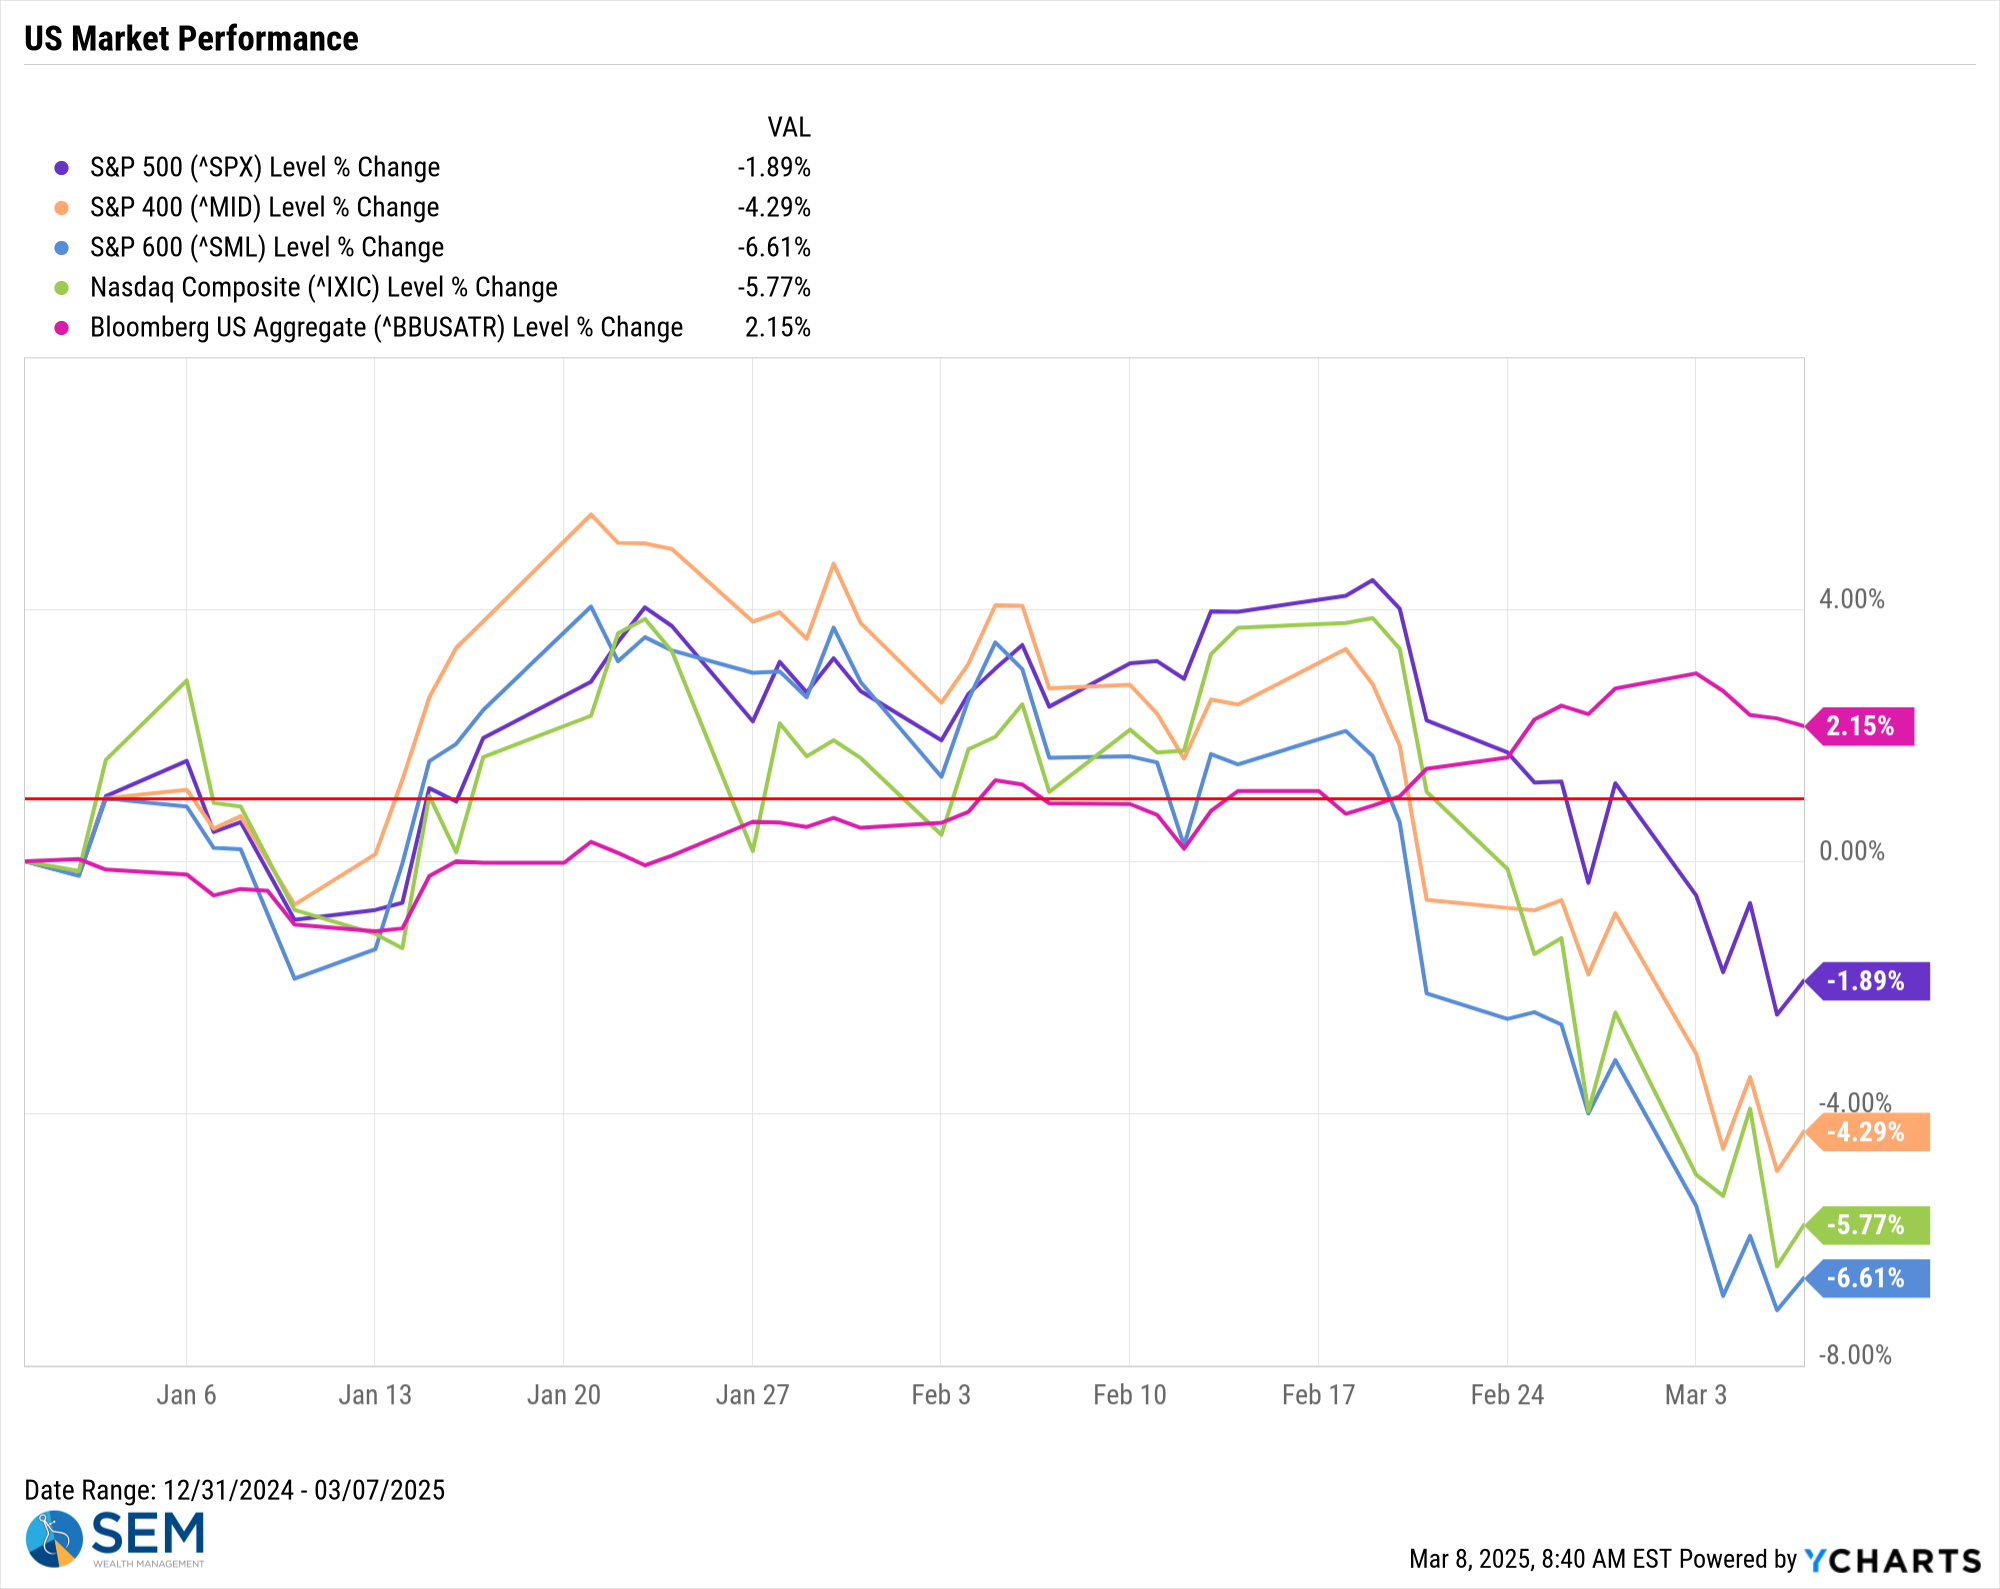
The sell-off since mid-February has now put every asset class other than bonds into the red for the year. Remember early in the year when small and mid-caps were finally outperforming the mega caps. That is once again no longer the case.
Looking at just that, you would think there is a big concern about a looming recession. However, looking at corporate bond spreads there seems to be little to no concern about a recession. If the bond market was concerned, we'd see the spreads increase as bond investors would be asking for more compensation for taking on risk. That's just not the case right now.
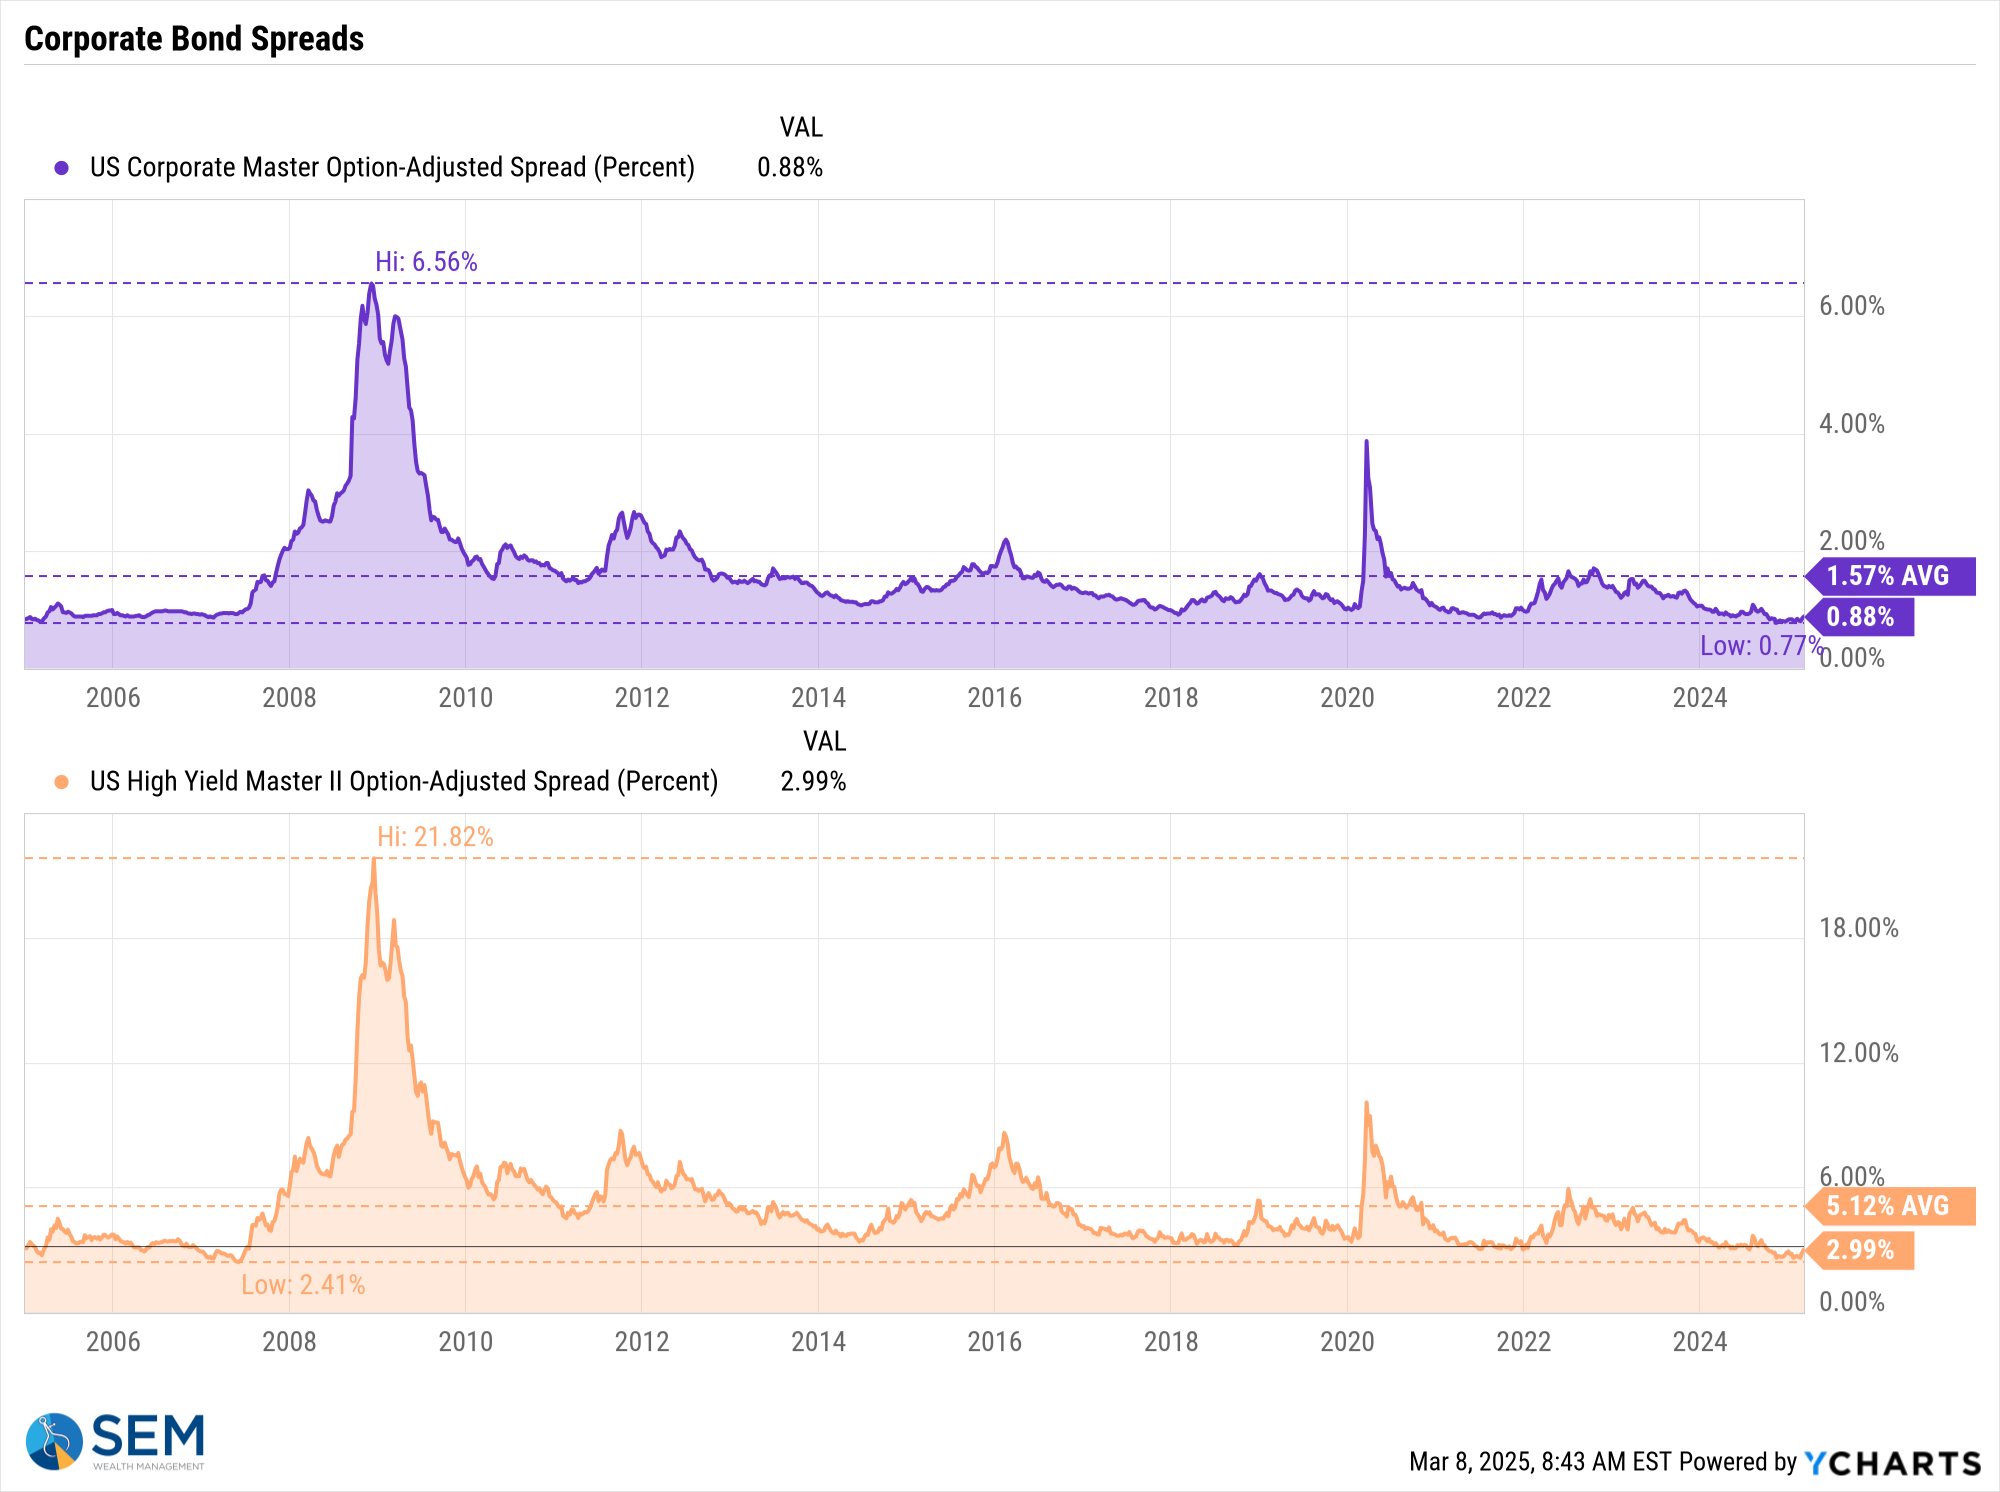
Treasury Bond yields are also not giving any clear signs of panic.
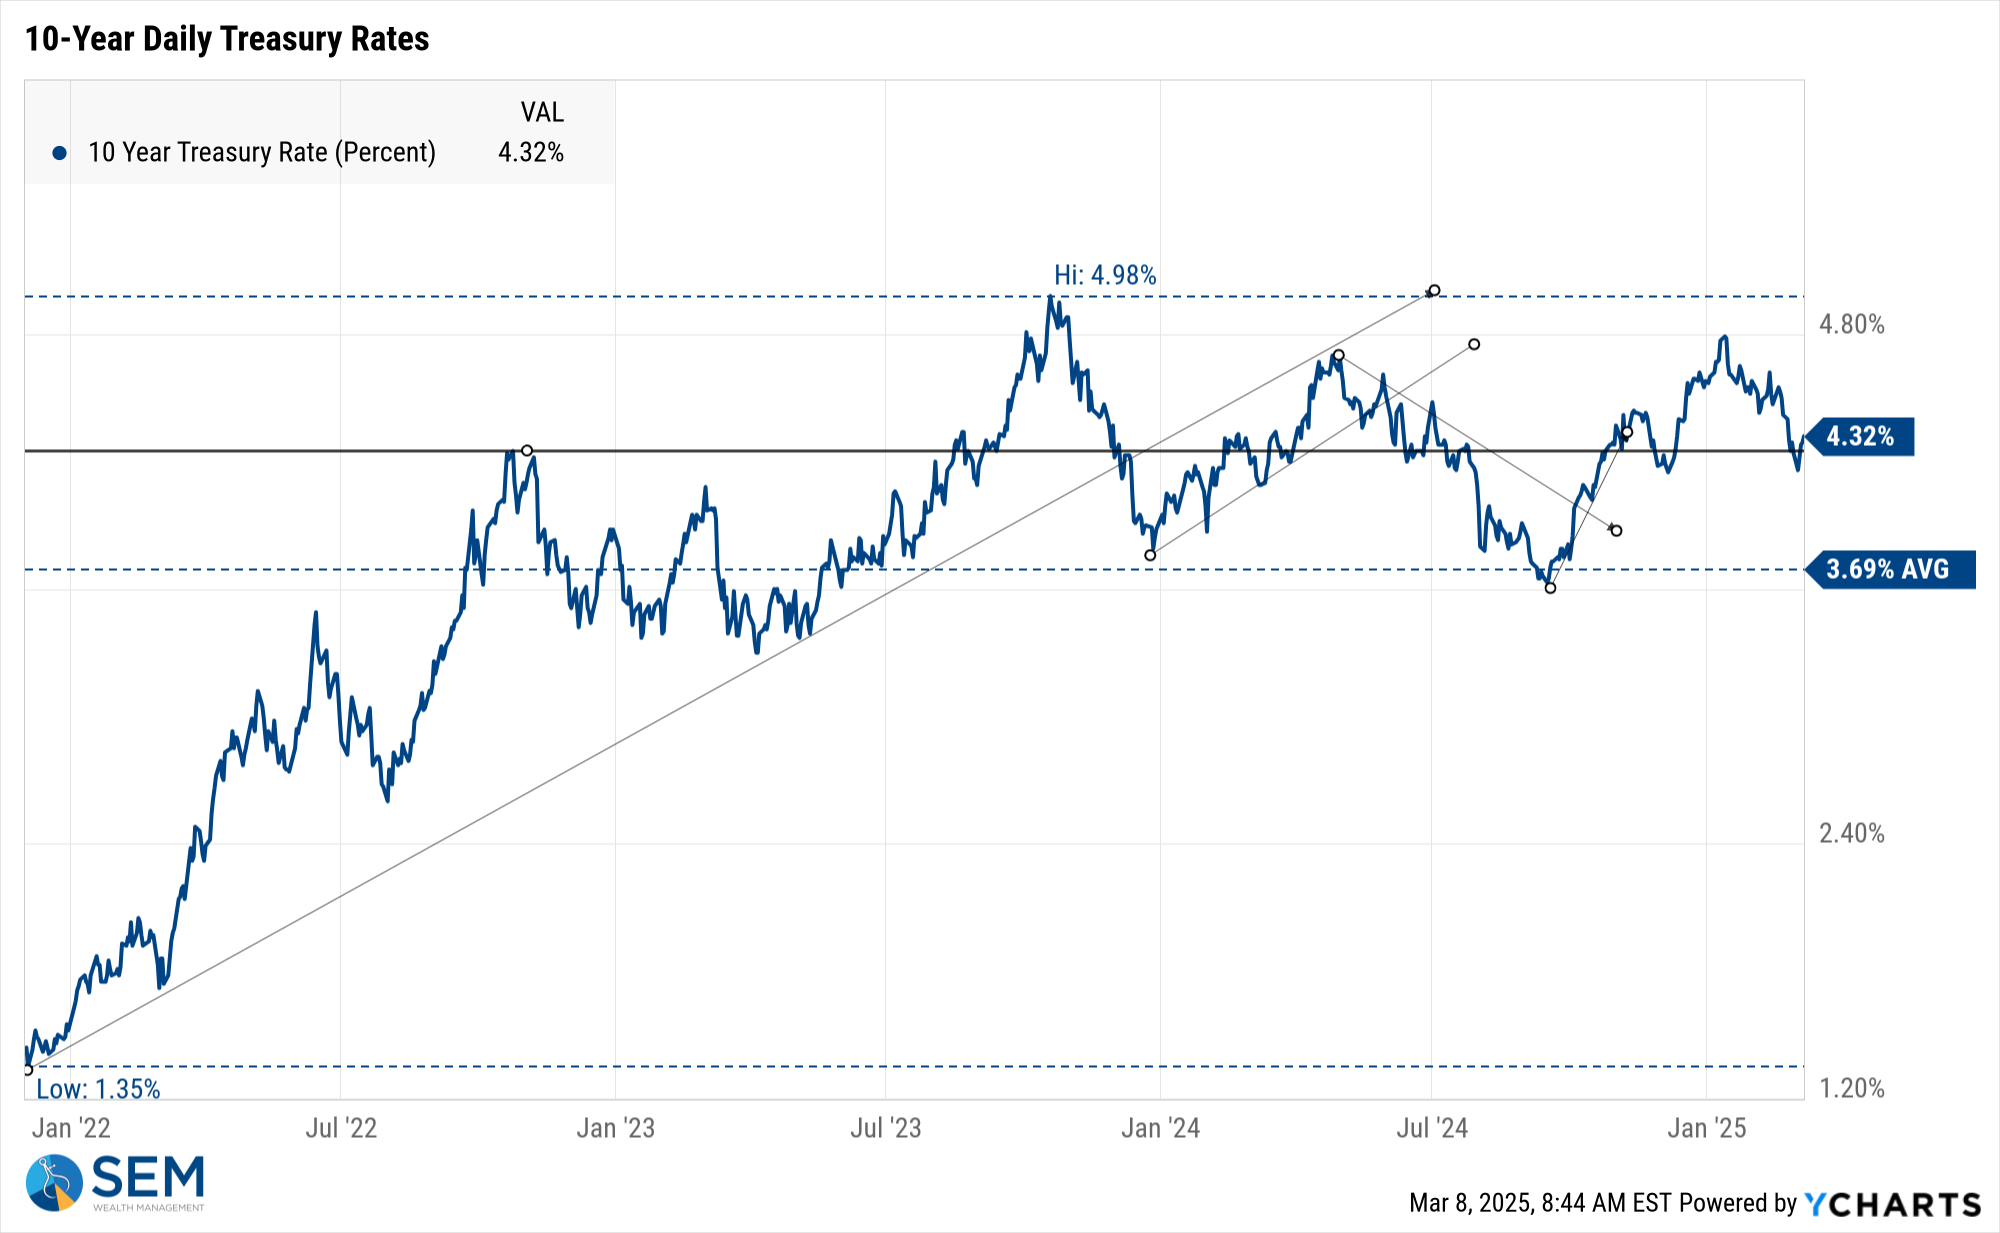
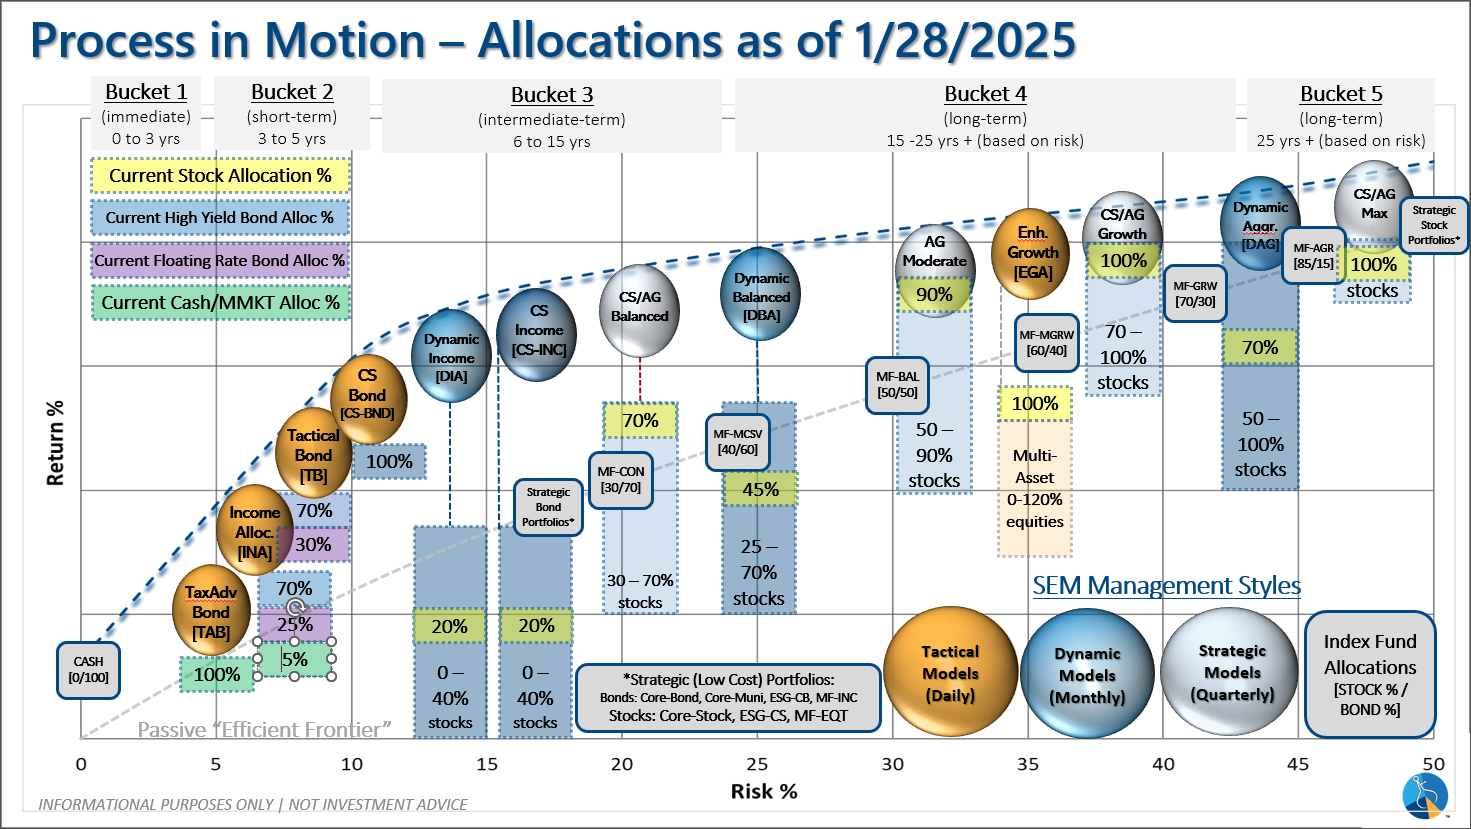
What this means for us is no change to our asset allocation, as noted below.
SEM Model Positioning
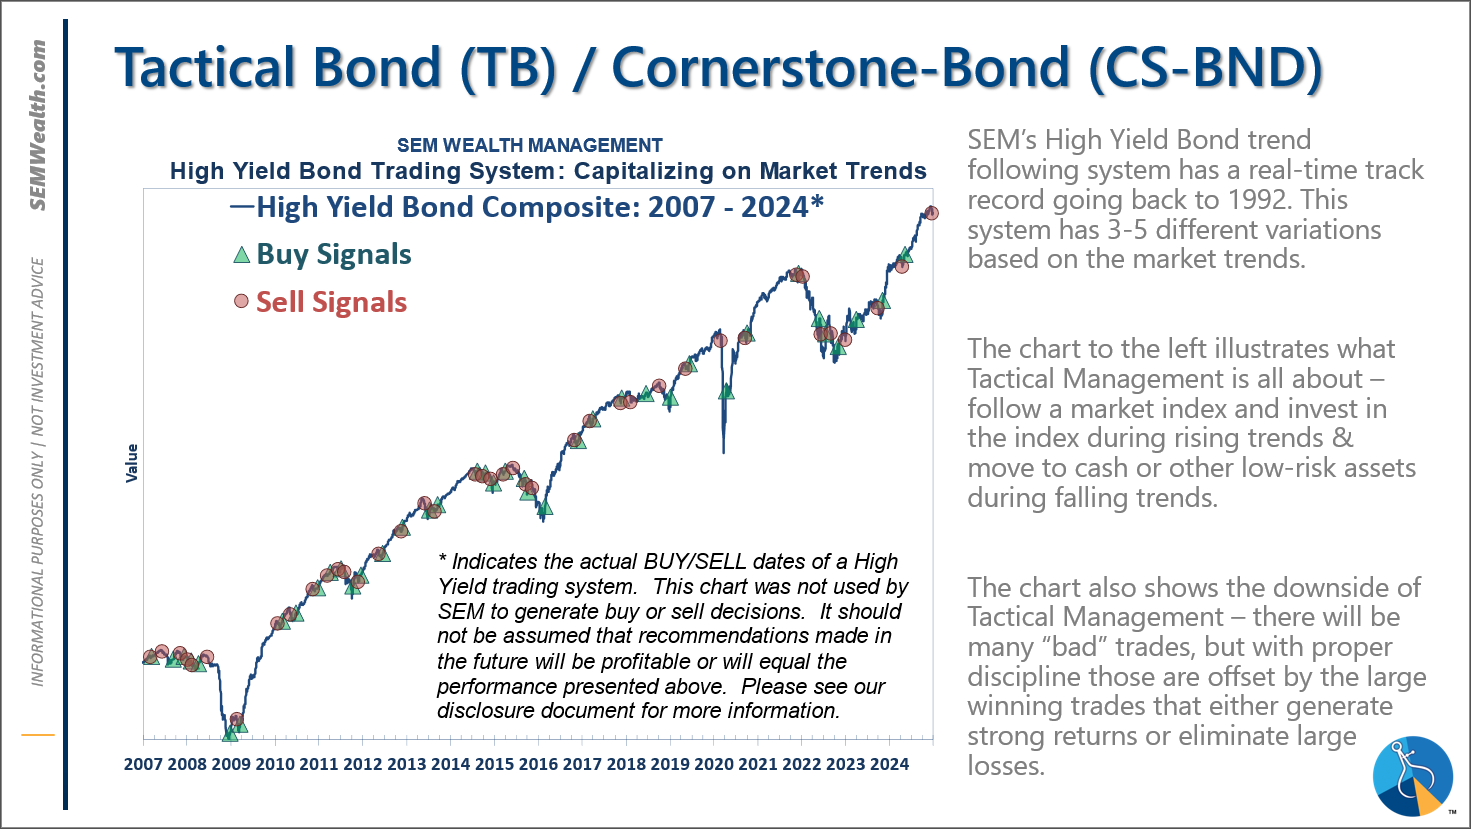
-Tactical High Yield reentered the high yield bond market on 1/27/25 after about 5 weeks on the sidelines. We had added a 30% position in floating rate bonds on 12/6/24, which currently have a 9% yield compared to a 6% yield in high yields and 4.6% in money markets.
-Dynamic Models are 'neutral' as of 6/7/24, reversing the half 'bearish' signal from 5/3/2024. 7/8/24 - interest rate model flipped from partially bearish to partially bullish (lower long-term rates).
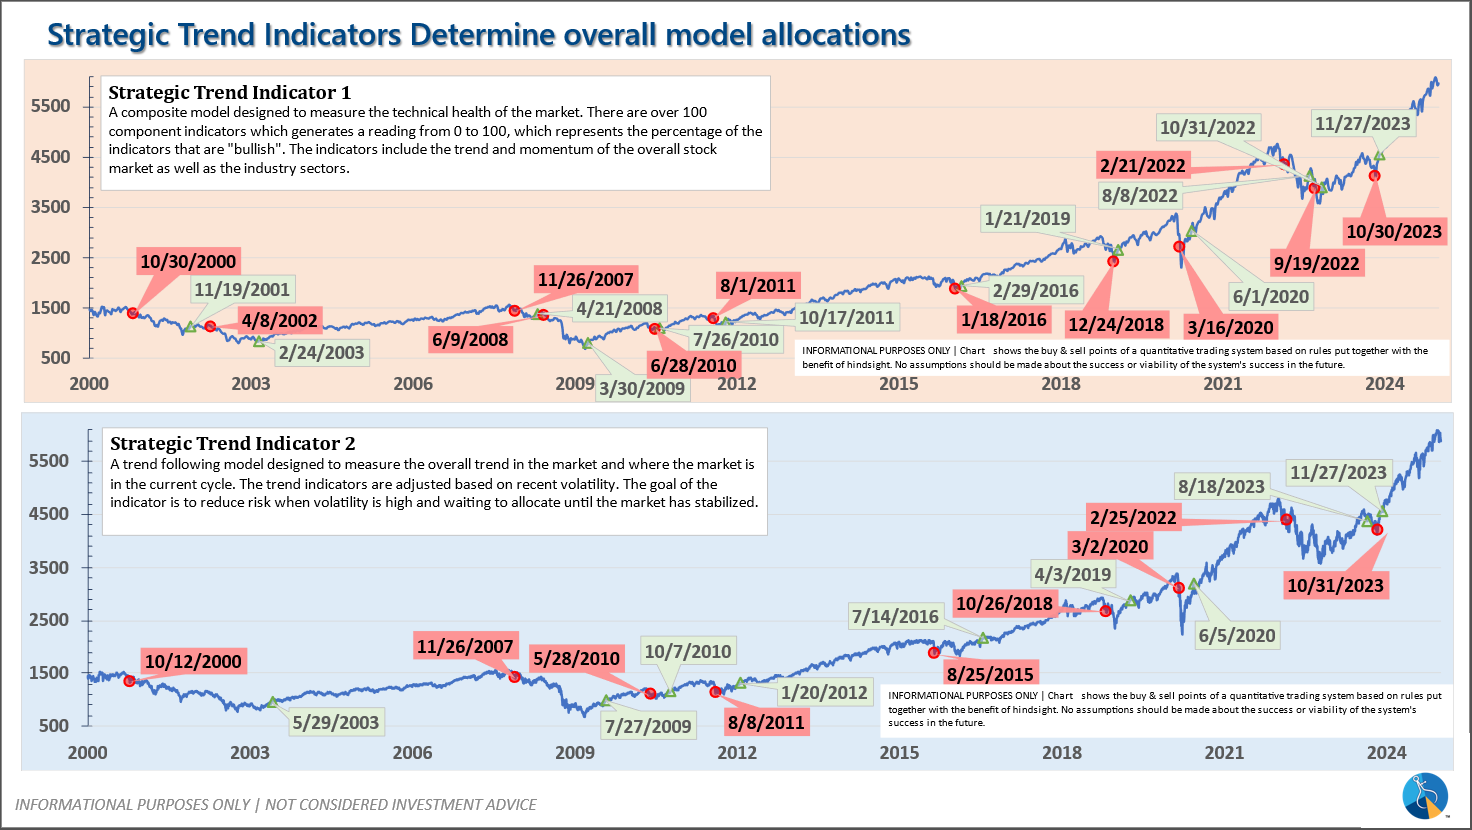
-Strategic Trend Models went on a buy 11/27/2023; 7/8/24 – small and mid-cap positions eliminated with latest Core Rotation System update – money shifted to Large Cap Value (Dividend Growth) & International Funds
SEM deploys 3 distinct approaches – Tactical, Dynamic, and Strategic. These systems have been described as 'daily, monthly, quarterly' given how often they may make adjustments. Here is where they each stand.
Tactical (daily): On 12/20/2024 our tactical high yield model sold out of high yield bond (about 70% of our holdings) into money market. The other 30% is invested in shorter duration, higher yielding floating rate bonds. These instruments are not as sensitive to credit risk and are typically allocated to in the early and late stages of a high yield bond move in our model.
Dynamic (monthly): The economic model was 'neutral' since February. In early May the model moved slightly negative, but reversed back to 'neutral' in June. This means 'benchmark' positions – 20% dividend stocks in Dynamic Income and 20% small cap stocks in Dynamic Aggressive Growth. The interest rate model is slightly 'bullish'.
Strategic (quarterly)*
: BOTH Trend Systems reversed back to a buy on 11/27/2023
The core rotation is adjusted quarterly. On August 17 it rotated out of mid-cap growth and into small cap value. It also sold some large cap value to buy some large cap blend and growth. The large cap purchases were in actively managed funds with more diversification than the S&P 500 (banking on the market broadening out beyond the top 5-10 stocks.) On January 8 it rotated completely out of small cap value and mid-cap growth to purchase another broad (more diversified) large cap blend fund along with a Dividend Growth fund.
The * in quarterly is for the trend models. These models are watched daily but they trade infrequently based on readings of where each believe we are in the cycle. The trend systems can be susceptible to "whipsaws" as we saw with the recent sell and buy signals at the end of October and November. The goal of the systems is to miss major downturns in the market. Risks are high when the market has been stampeding higher as it has for most of 2023. This means sometimes selling too soon. As we saw with the recent trade, the systems can quickly reverse if they are wrong.
Overall, this is how our various models stack up based on the last allocation change:
Questions or comments - drop us a note?
Curious if your current investment allocation aligns with your overall objectives and risk tolerance? Take our risk questionnaire


