
Markets move in cycles. This is obvious to anybody who has tracked the market for more than a few years. Part of each cycle is the "driver" of the move (up or down). The bulk of 2023 and 2024 was on mega-cap tech stocks and AI in particular. Following the election of Donald Trump the theme centered around a Reganesque growth environment that was about to be unlocked. This continued until mid-February when the reality of Donald Trump's conflicting goals seemed to take hold.
Ironically enough, on February 10 the title of the blog was "Quieting Down". I guess I jinxed it because it has been anything but quiet since then. Since then we've documented the complexities facing the Trump Administration and thus the markets as they attempt to implement the dozens of campaign promises made. Note the headlines over the past 6 weeks since the market hit its peak for the year.


For readers of this blog, the shift in sentiment should not be a surprise. Take a look back to what I wrote on November 11, highlighting the policies which could hurt the economy and thus the stock market over the short to intermediate-term.

Last week I attempted to explain the impact on the short-term of policies being discussed that are necessary to reach the long-term goals. I'm not sure the market has fully understood this as Wall Street is still expecting the Reganesque growth to still happen based on their current year-end market forecasts. For the time being, though the market is heavily focused on the impact tariffs will have on both inflation and economic growth.
This week (Wednesday) we have "liberation day", the day President Trump is announcing what is expected to be far reaching, large tariffs against most of our trade partners. It is not worth identifying or speculating what will be implemented or how long they will remain in place until they happen. My hope (wish) would be we find out what they are, the market adjusts and we move on. Constantly worrying about additional and higher tariffs is bad for stocks.
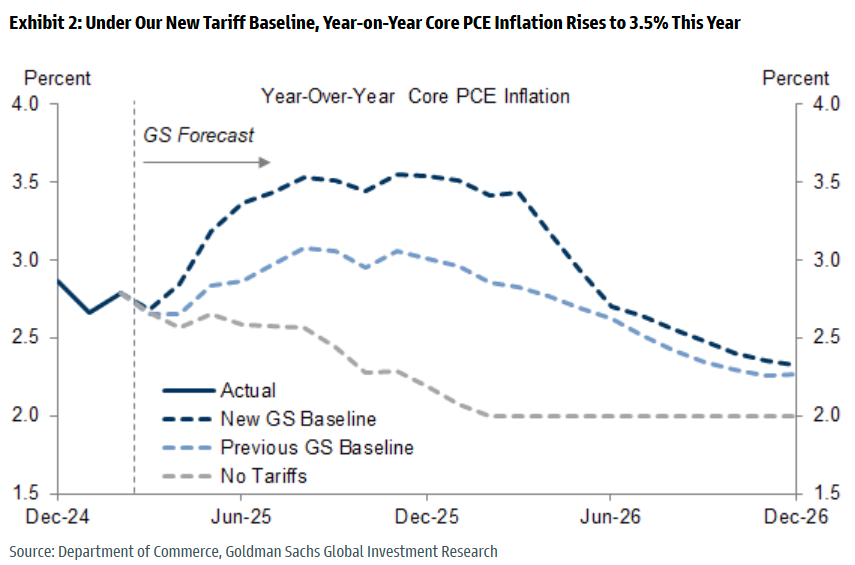
Regardless of what happens on Wednesday or what the administration says tariffs will do for our country long-term, short-term we are seeing both hard data and survey data indicate tariffs are causing both higher inflation and lower growth.
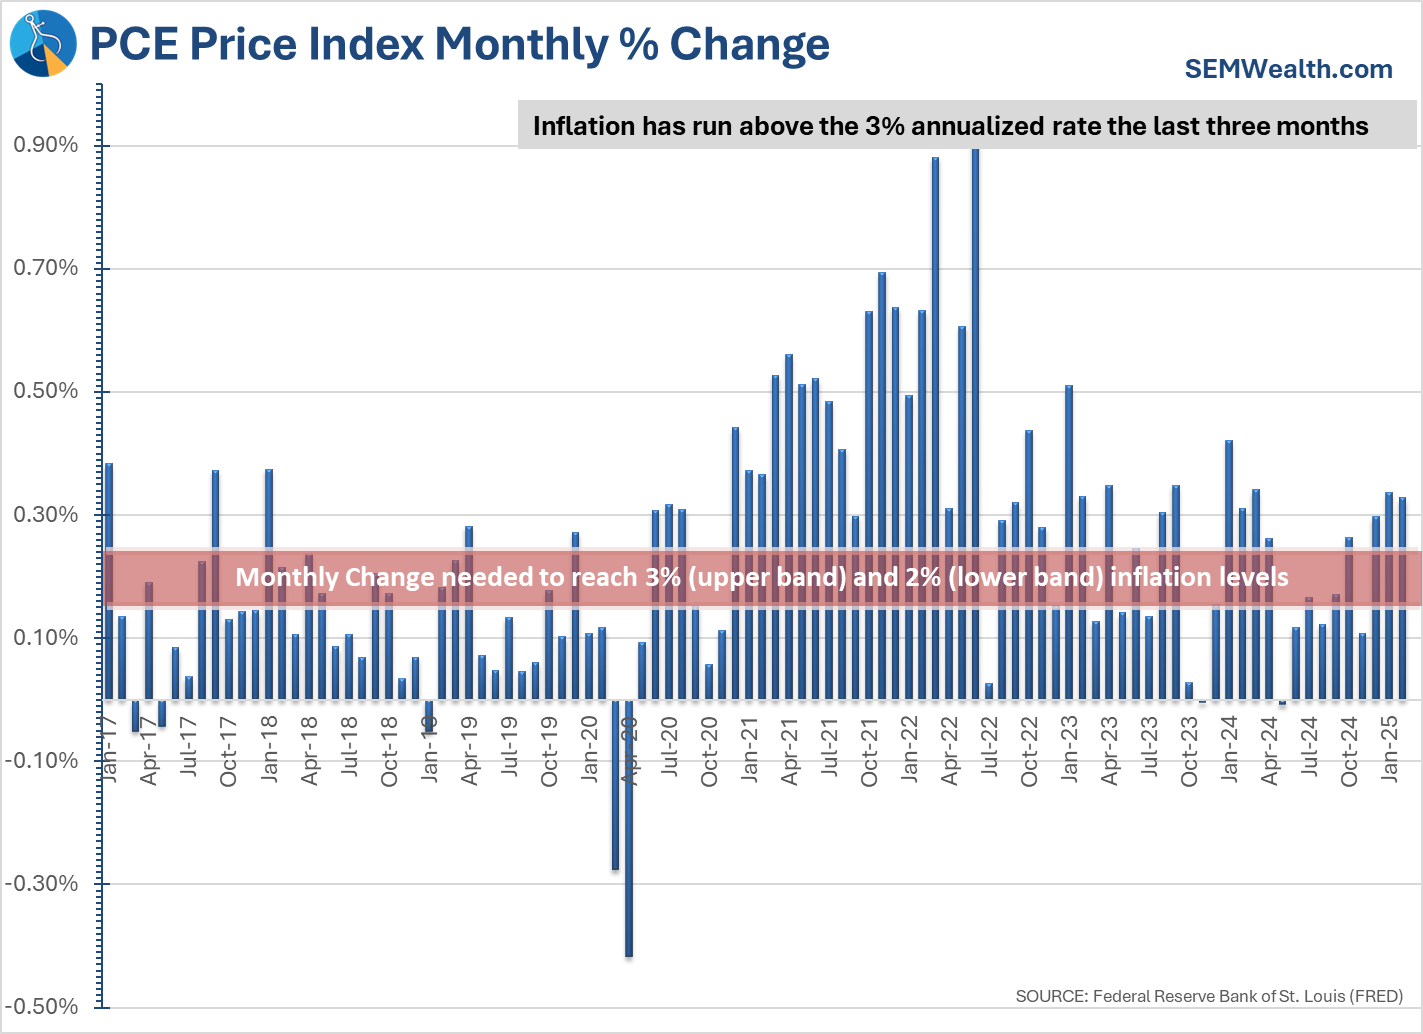
On Friday, the Fed's 'preferred' inflation measure, the PCE Price Index, came in "hotter than expected". This was the third consecutive month where the rate was tracking above a 3% annualized rate. This makes it highly unlikely the Fed will be able to cut rates in the coming months.
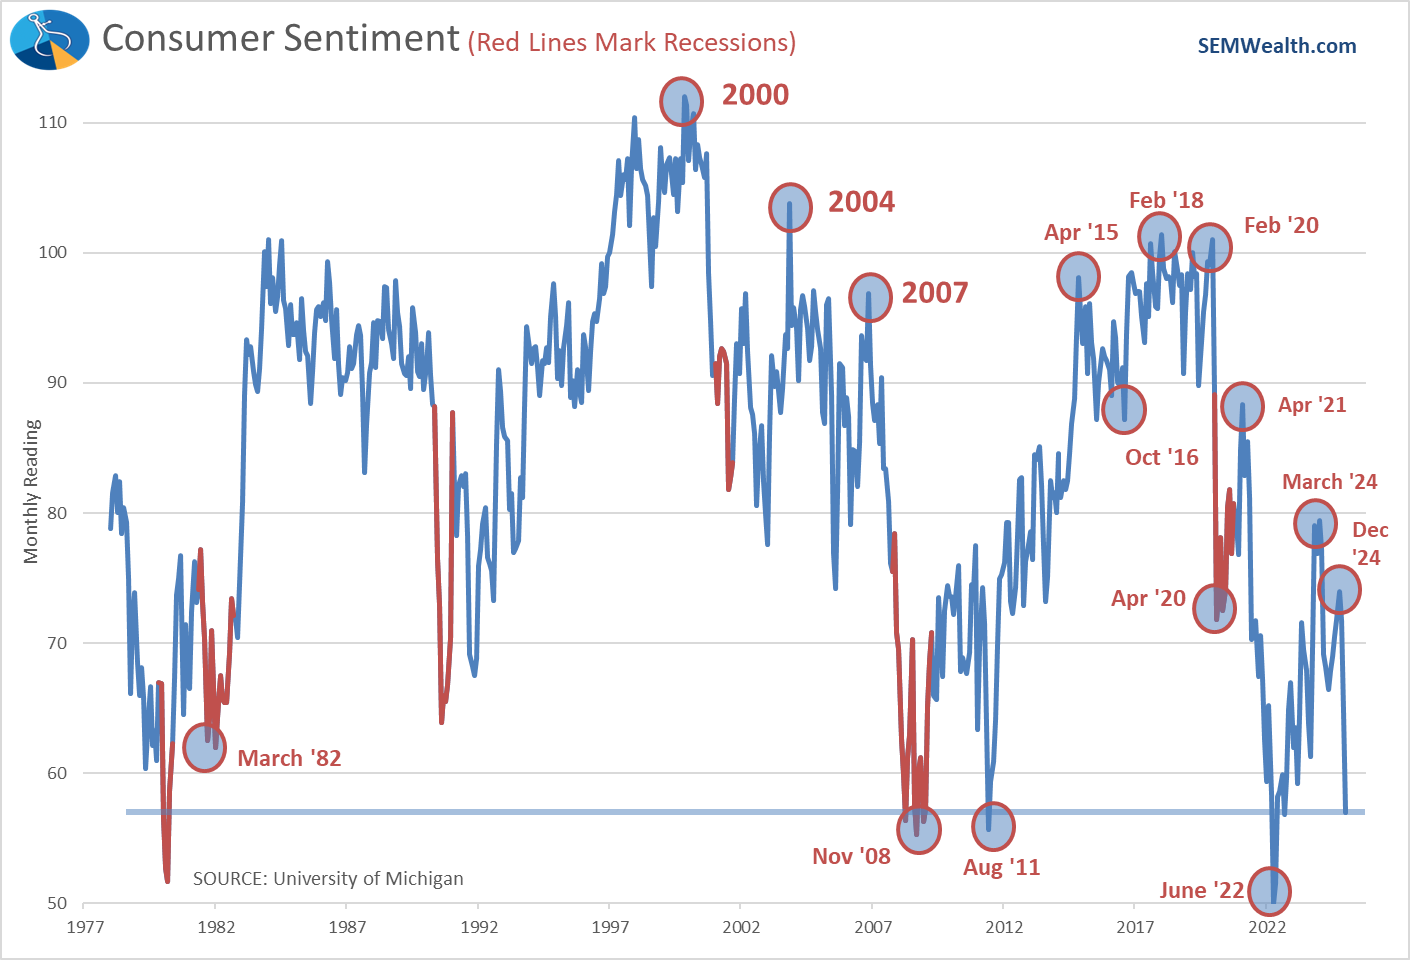
We're seeing prices being increased pre-emptively and consumers saying they are tightening their spending.
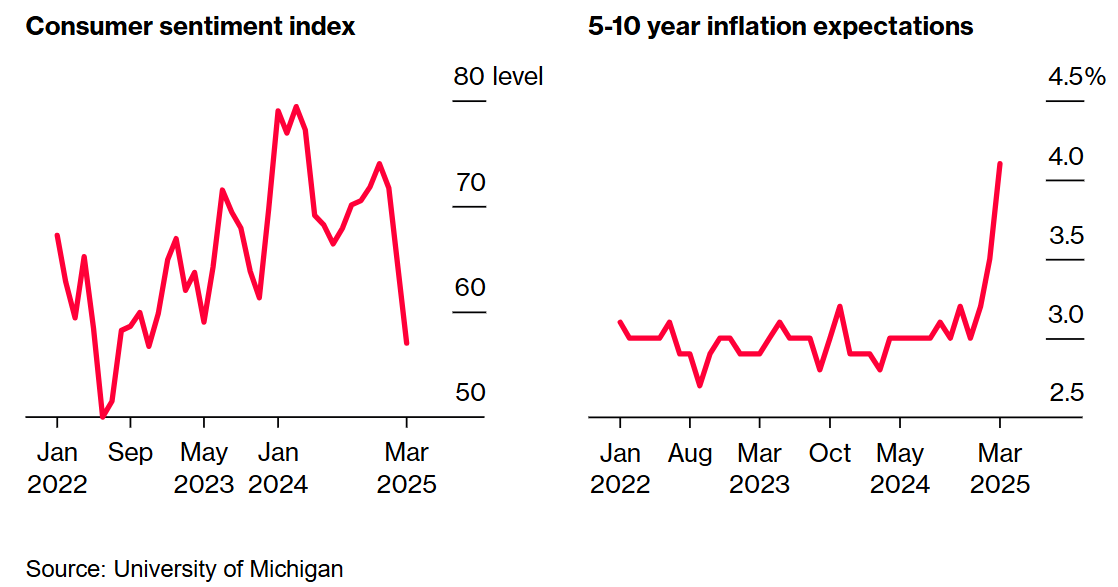
The biggest concern is inflation. Consumers are now expecting inflation to rise over the next 5-10 years at a 4% rate. This could most certainly lead to a slow down in spending.
It's not just consumers expecting much higher inflation levels. Wall Street firms are also both raising their inflation expectations and reducing their growth estimates.
A CNBC survey out this morning shows Wall Street economists have reduced their GDP estimates significantly over the past quarter. One reason for the drop is a surge in imports this quarter, which as we mentioned last week DECREASES GDP since the proceeds of those sales leave our country. Economists say the surge is due to businesses trying to bump up their inventory ahead of tariff increases.
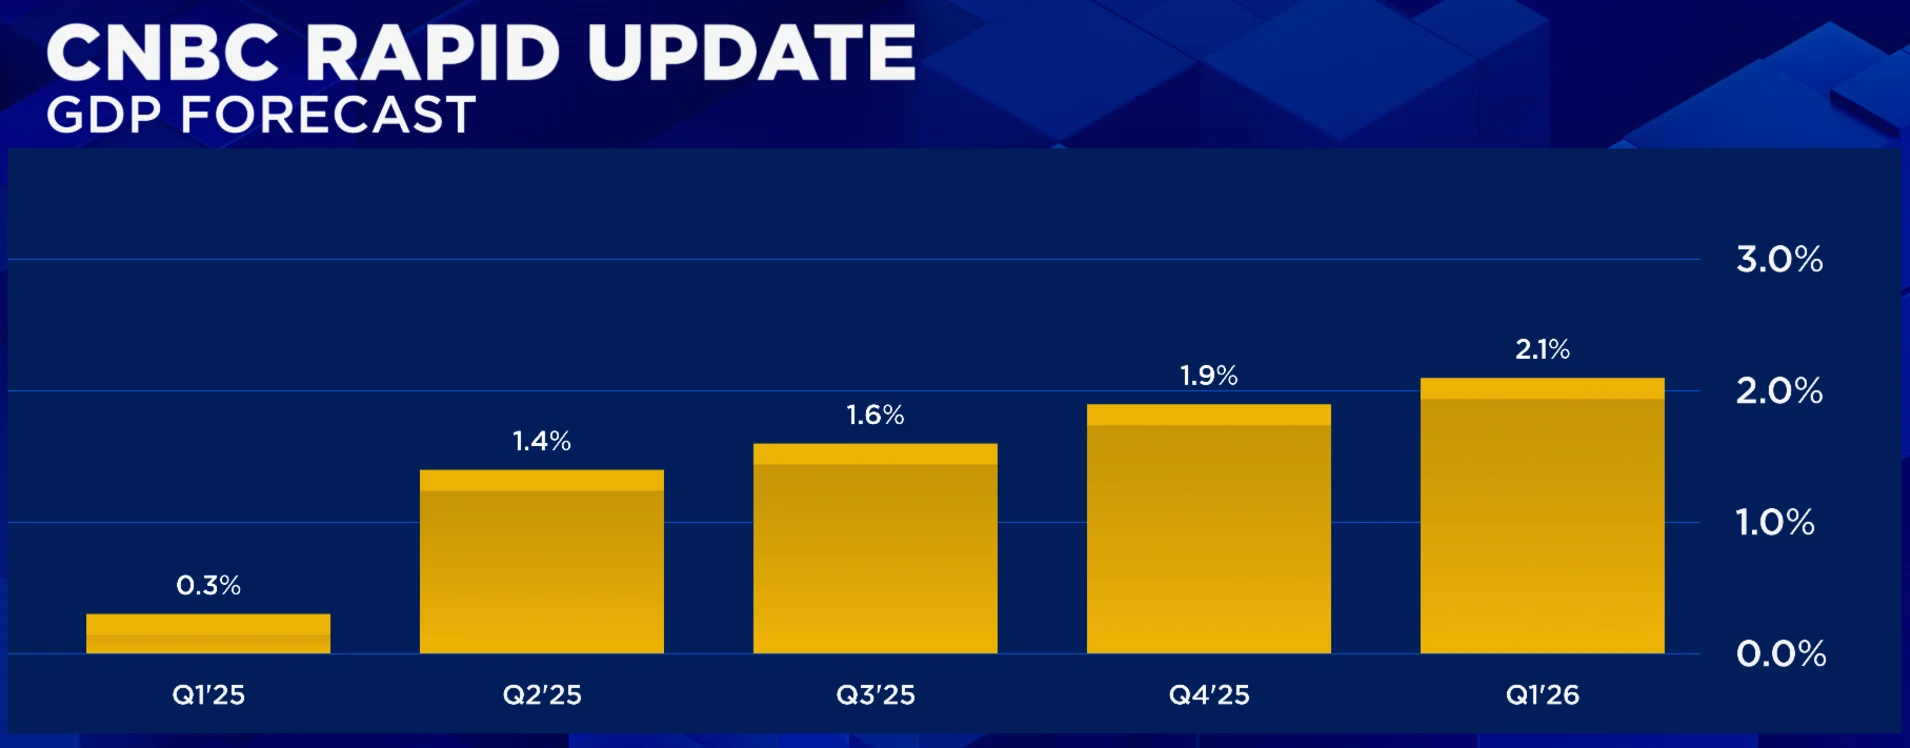
While these levels do not signal a recession, the drop in expectations is significant. In January Wall Street economists expected GDP to grow at a 2% annualized rate throughout the year. For now, the forecast appears to be a temporary dip below 2% before moving back up to their previous estimates.
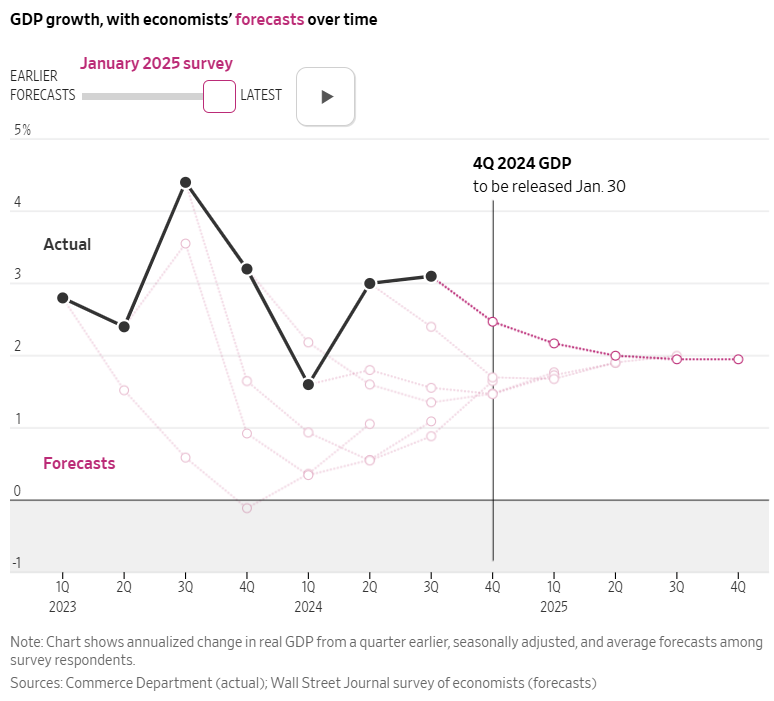
If they are correct, this dip COULD be a buying opportunity. If they are wrong, things will obviously get much worse. Thankfully we do not have to make those calls. We will wait for the DATA to tell us which way to go.
'Drill, baby drill' or lower oil prices? We can't have both
Two of the things President Trump promised was to unlock US oil production and to lower oil prices. The problem is in a free market, oil producers are less likely to produce more oil if prices are too low. The Dallas Federal Reserve survey released last week highlighted the problem the president will have in meeting his goals.
The firms in the survey reported the "break even" point for them to increase production is $65/barrel. The day of the survey oil was at $70/barrel. Here is a summary from Bloomberg of the survey, which included 130 oil and gas firms from Texas, Louisiana, and New Mexico.
Cost of components:
“The administration’s tariffs immediately increased the cost of our casing and tubing by 25 percent even though inventory costs our pipe brokers less. U.S. tubular manufacturers immediately raised their prices to reflect the anticipated tariffs on steel.”
Moving manufacturing:
“Uncertainty around tariffs and trade policy continues to negatively impact our business, both for mid- to long-term planning and near-term costs. Because of trade tension, especially with Canada, a large operator requested we look to potentially move manufacturing out of the U.S. to support their work in Canada and other international markets.”
Costly Capital:
“The threat of $50 oil prices by the administration has caused our firm to reduce its 2025 and 2026 capital expenditures. ‘Drill, baby, drill’ does not work with $50 per barrel oil. Rigs will get dropped, employment in the oil industry will decrease, and U.S. oil production will decline as it did during COVID-19.”
The only certainty right now is uncertainty. With that in mind, we are approaching this economic cycle with heightened capital discipline and a focus on long-term resilience. I don't believe the tariffs will have a significant effect on drilling and completion plans for 2025, although I would imagine most managers are developing contingency plans for the potential effects of deals (Russia-Ukraine deal, Gaza-Israel-Iran deal) on global crude or natural gas flows. Now these contingency plans probably have more downside price risk baked in than initial drilling plans did for 2025.”
Decline Instead of Dominance?
“The key word to describe 2025 so far is ‘uncertainty’ and as a public company, our investors hate uncertainty. This has led to a marked increase in the implied cost of capital of our business, with public energy stocks down significantly more than oil prices over the last two months. This uncertainty is being caused by the conflicting messages coming from the new administration. There cannot be "U.S. energy dominance" and $50 per barrel oil; those two statements are contradictory. At $50-per-barrel oil, we will see U.S. oil production start to decline immediately and likely significantly (1 million barrels per day plus within a couple quarters). This is not ‘energy dominance.’ “
There is a long-standing saying in the energy industry – "the solution for higher prices is higher prices". Capitalistic companies will produce MORE if they believe prices will be higher (because they will make more money). With increased production flooding the markets, prices would then drop (which would lead to producers to CUT production.)
Ironically, if we want true US energy dominance, we first would need to see HIGHER oil prices (without collapsing economic growth). With prices coming down and the costs of drilling equipment and components going up, there is little incentive to INCREASE production.
How long will the current cycle of volatility surrounding tariffs, inflation, and a growth slow down last? Thankfully we don't have to guess. We will do what we always do - stick to the data and let it dictate how we adjust.
Market Charts
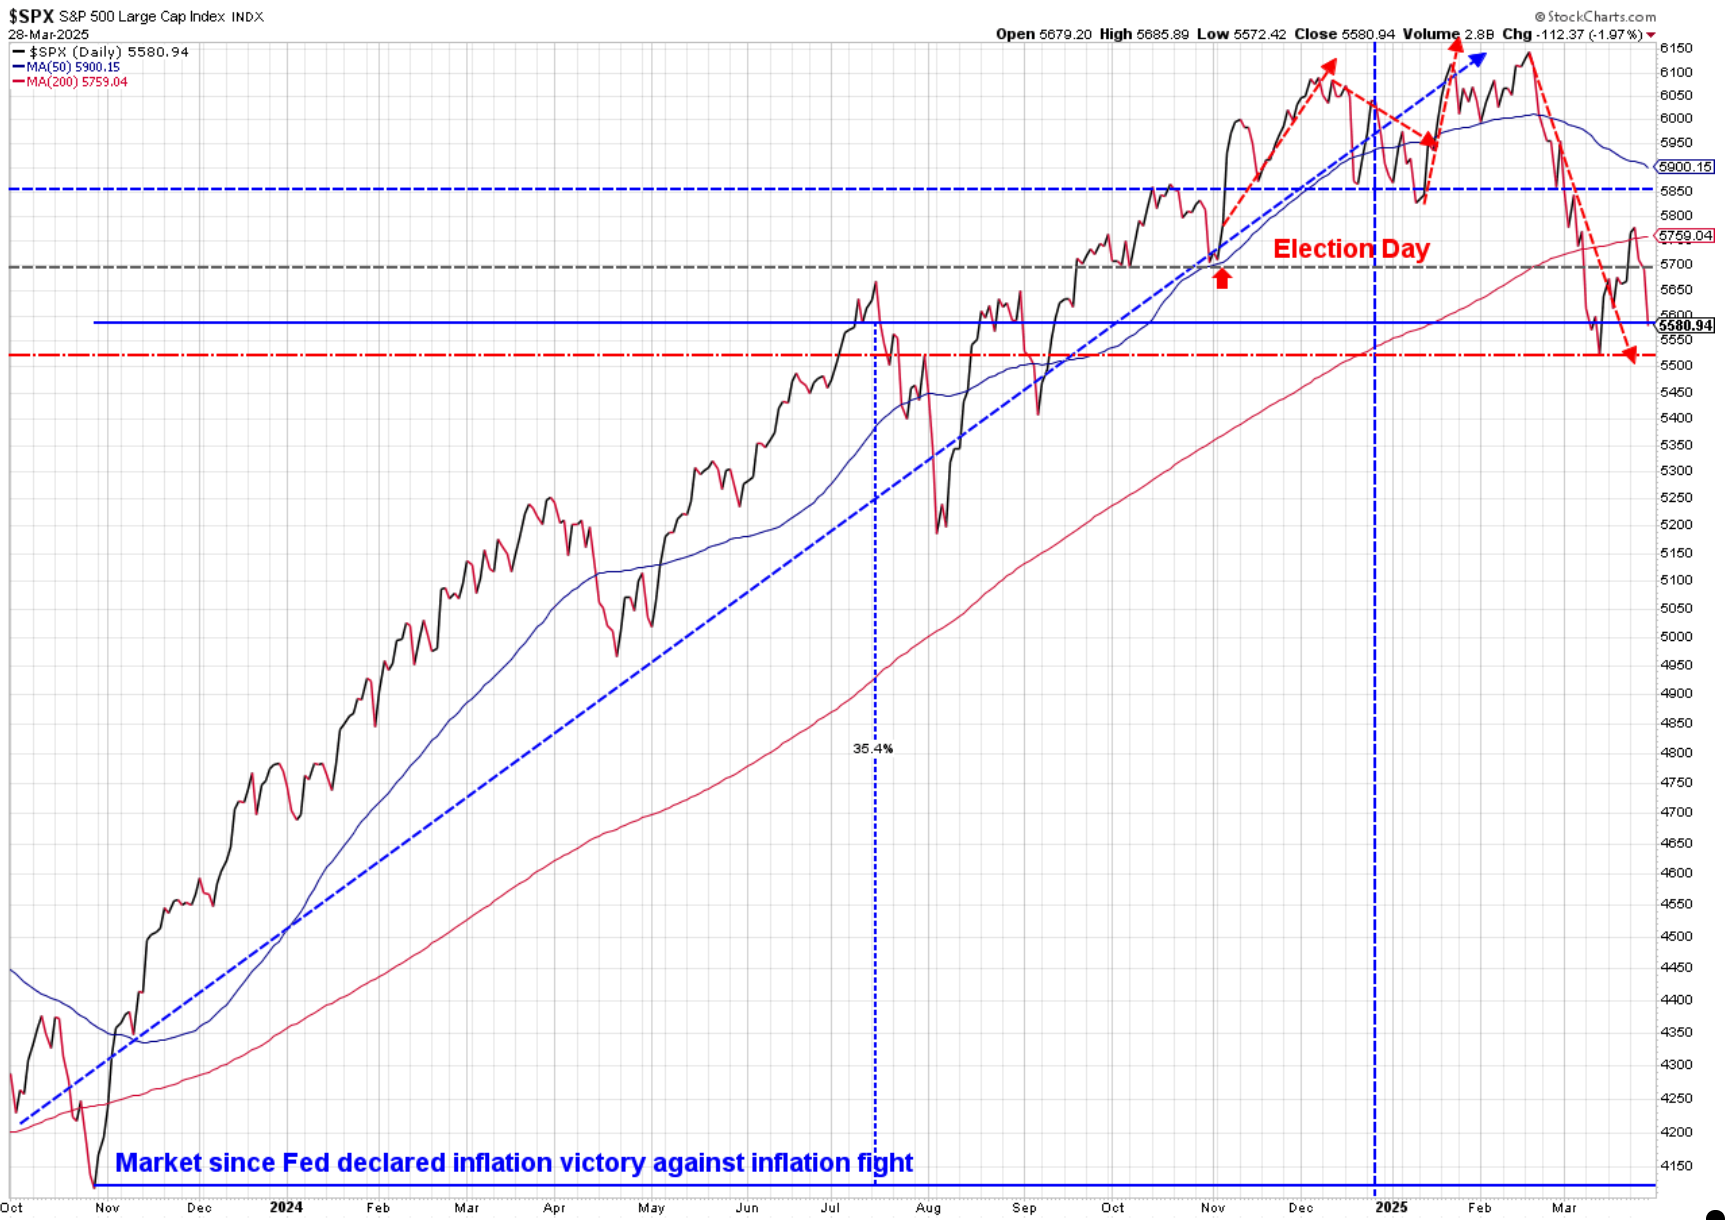
The "everything is awesome" rally which started on election day has completely evaporated with the market now down 3.5% from election day and 9.2% from the peak in mid-February.
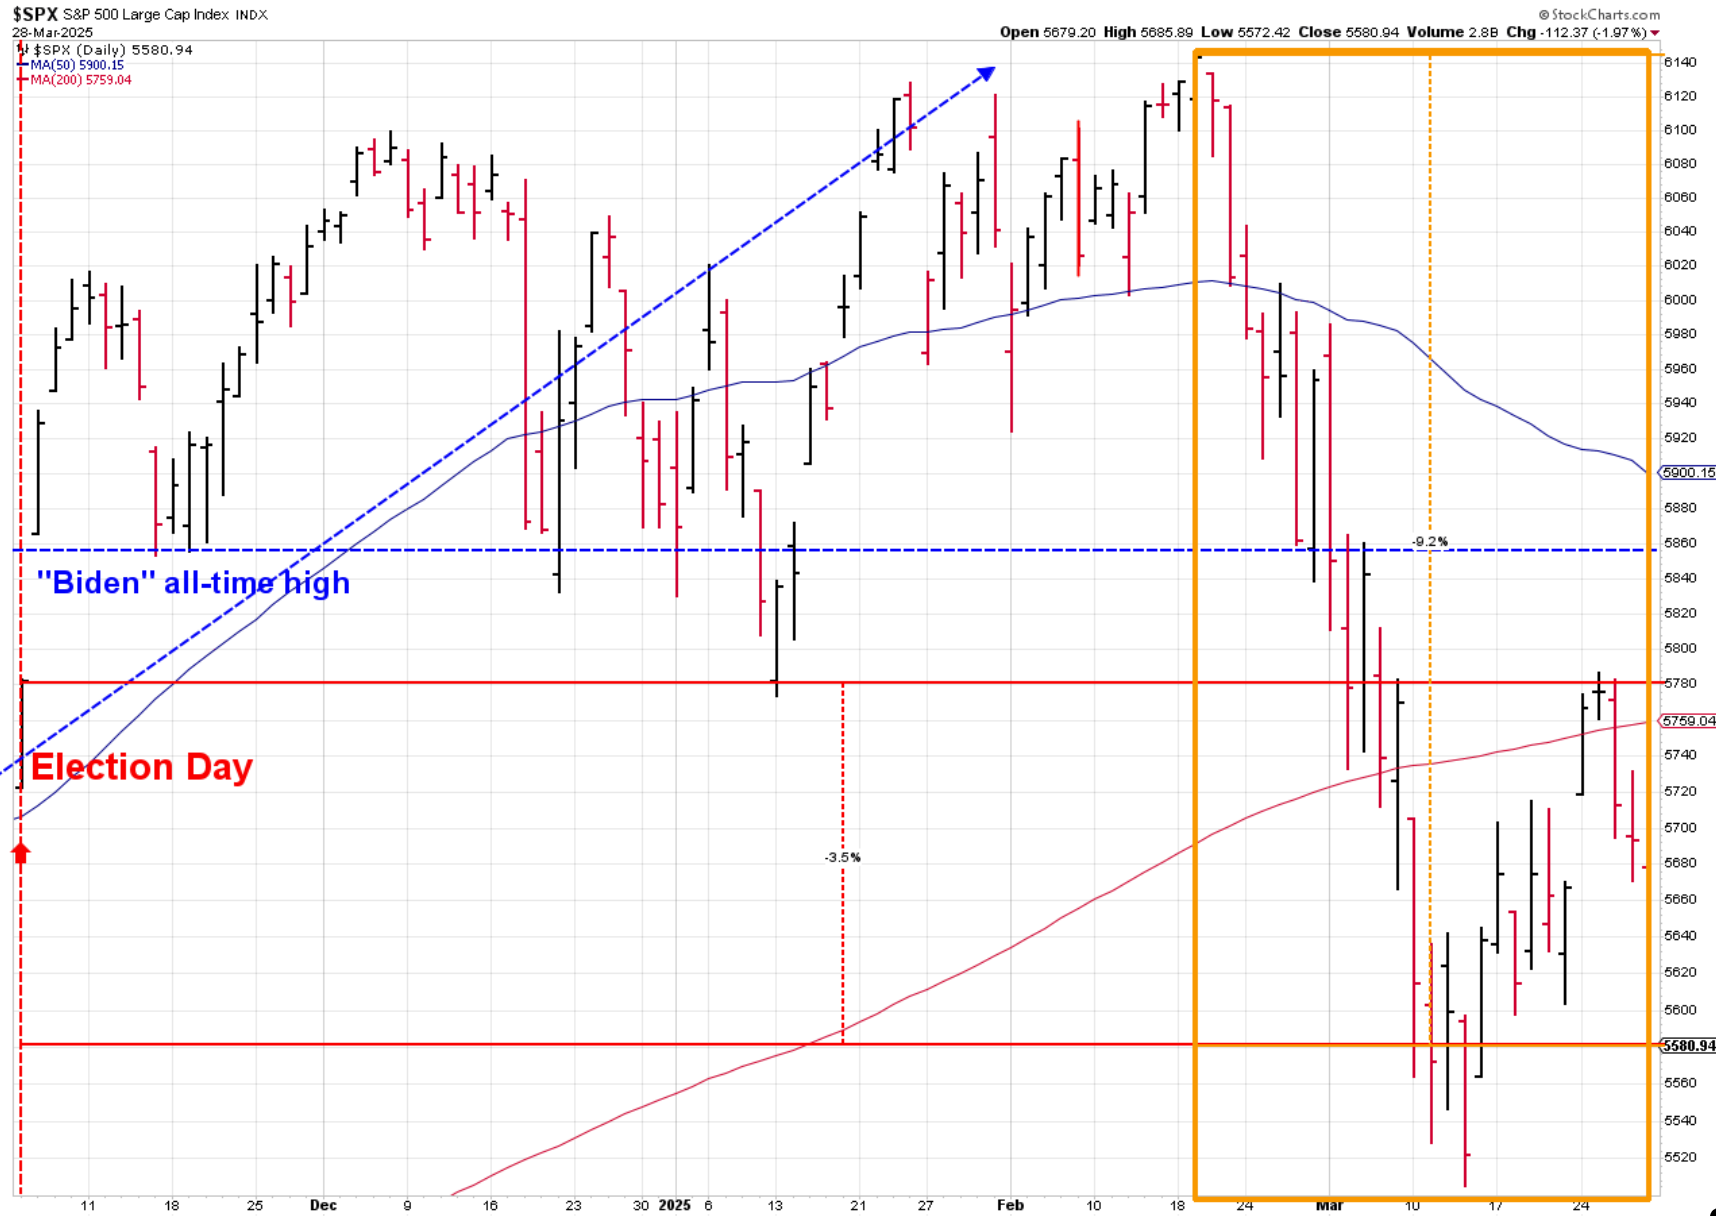
Zooming out we can see a few things:
1.) The uptrend from October 2023 has clearly been broken
2.) We are again moving close to a much bigger breakdown if the 5500-5520 level is violated
3.) Stocks are still up an astounding 35% since late October 2023 (which is a 24% annualized return!)
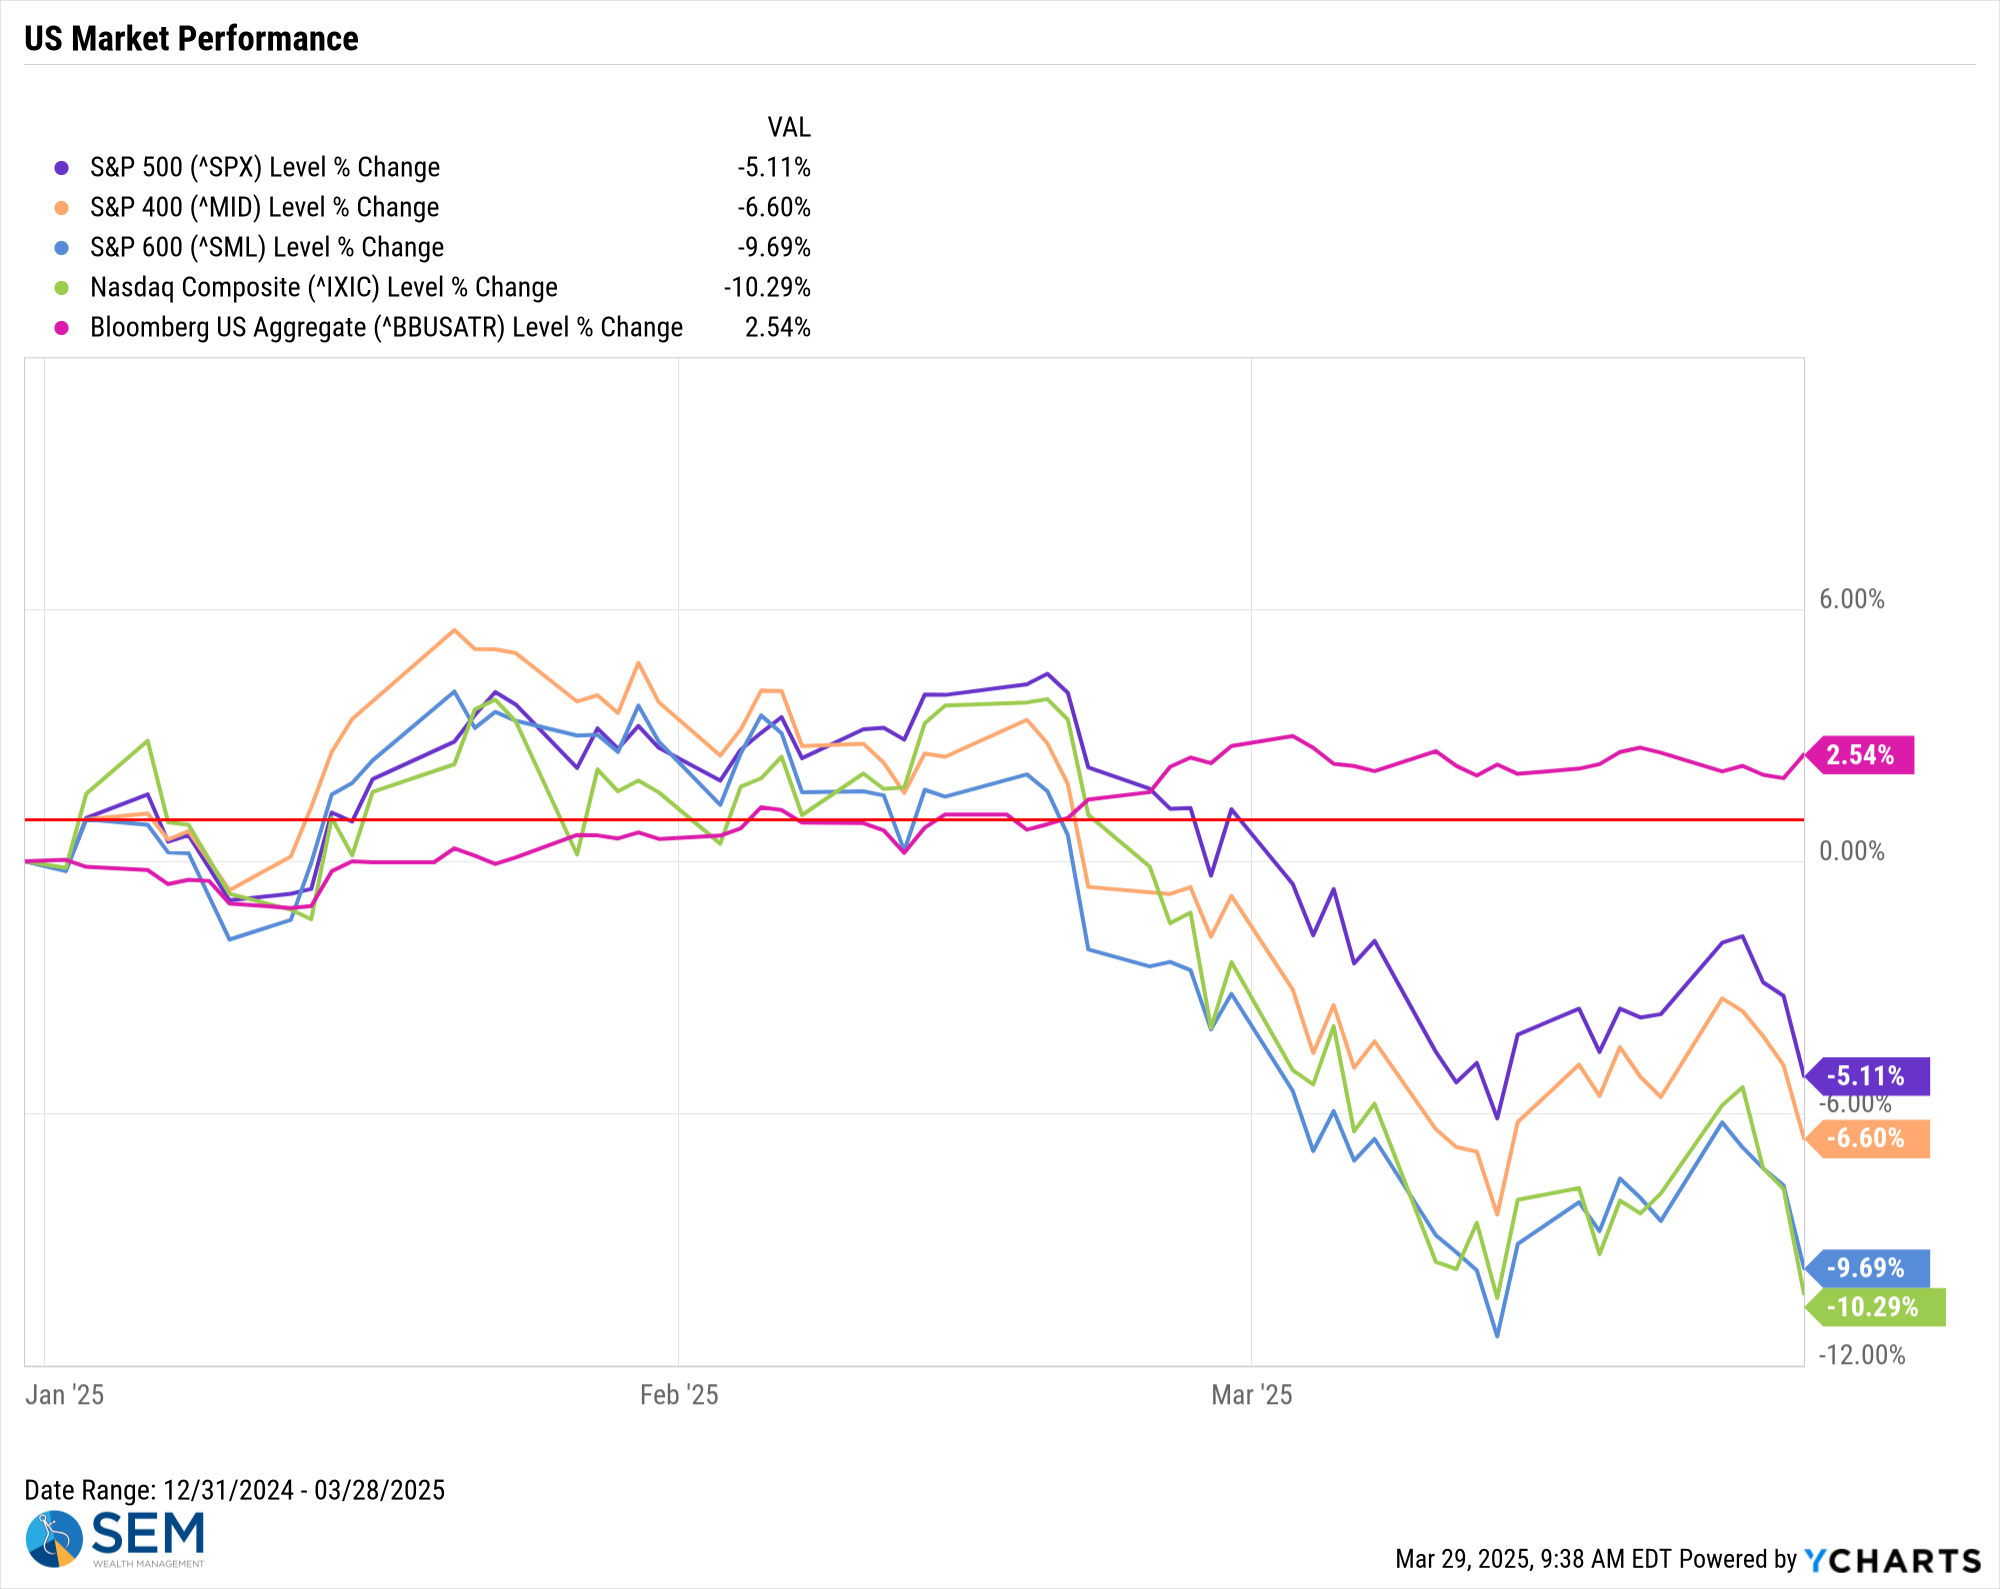
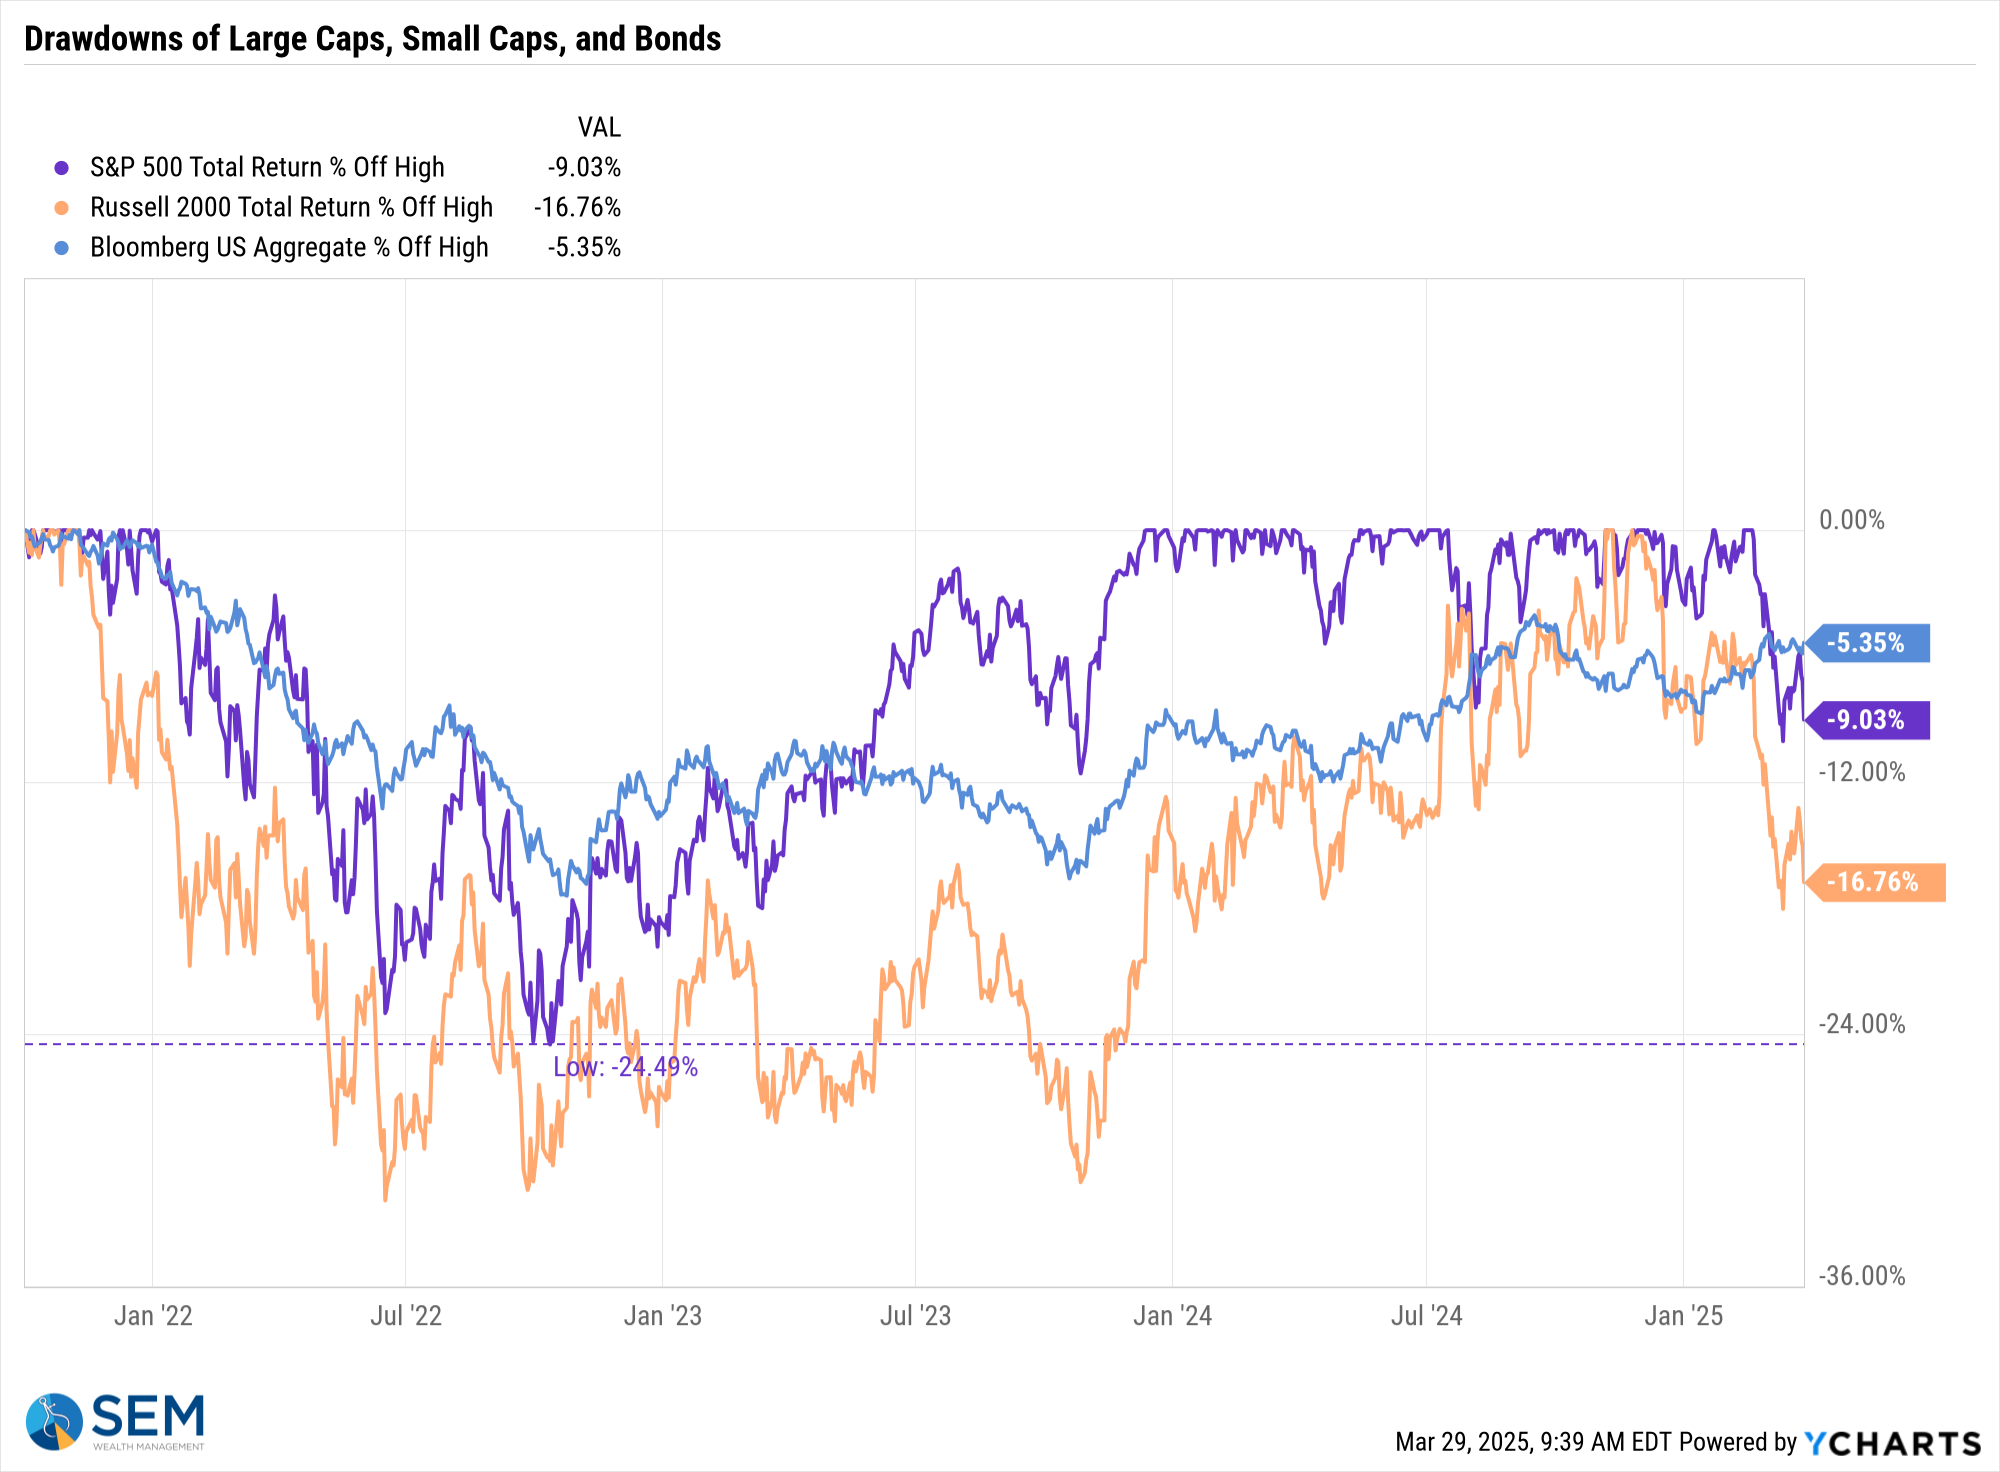
Yes, the last 5 or 6 weeks have been tough, but it is important to keep things in perspective. Tech stocks and small cap stocks have taken the brunt of the punishment in 2025.
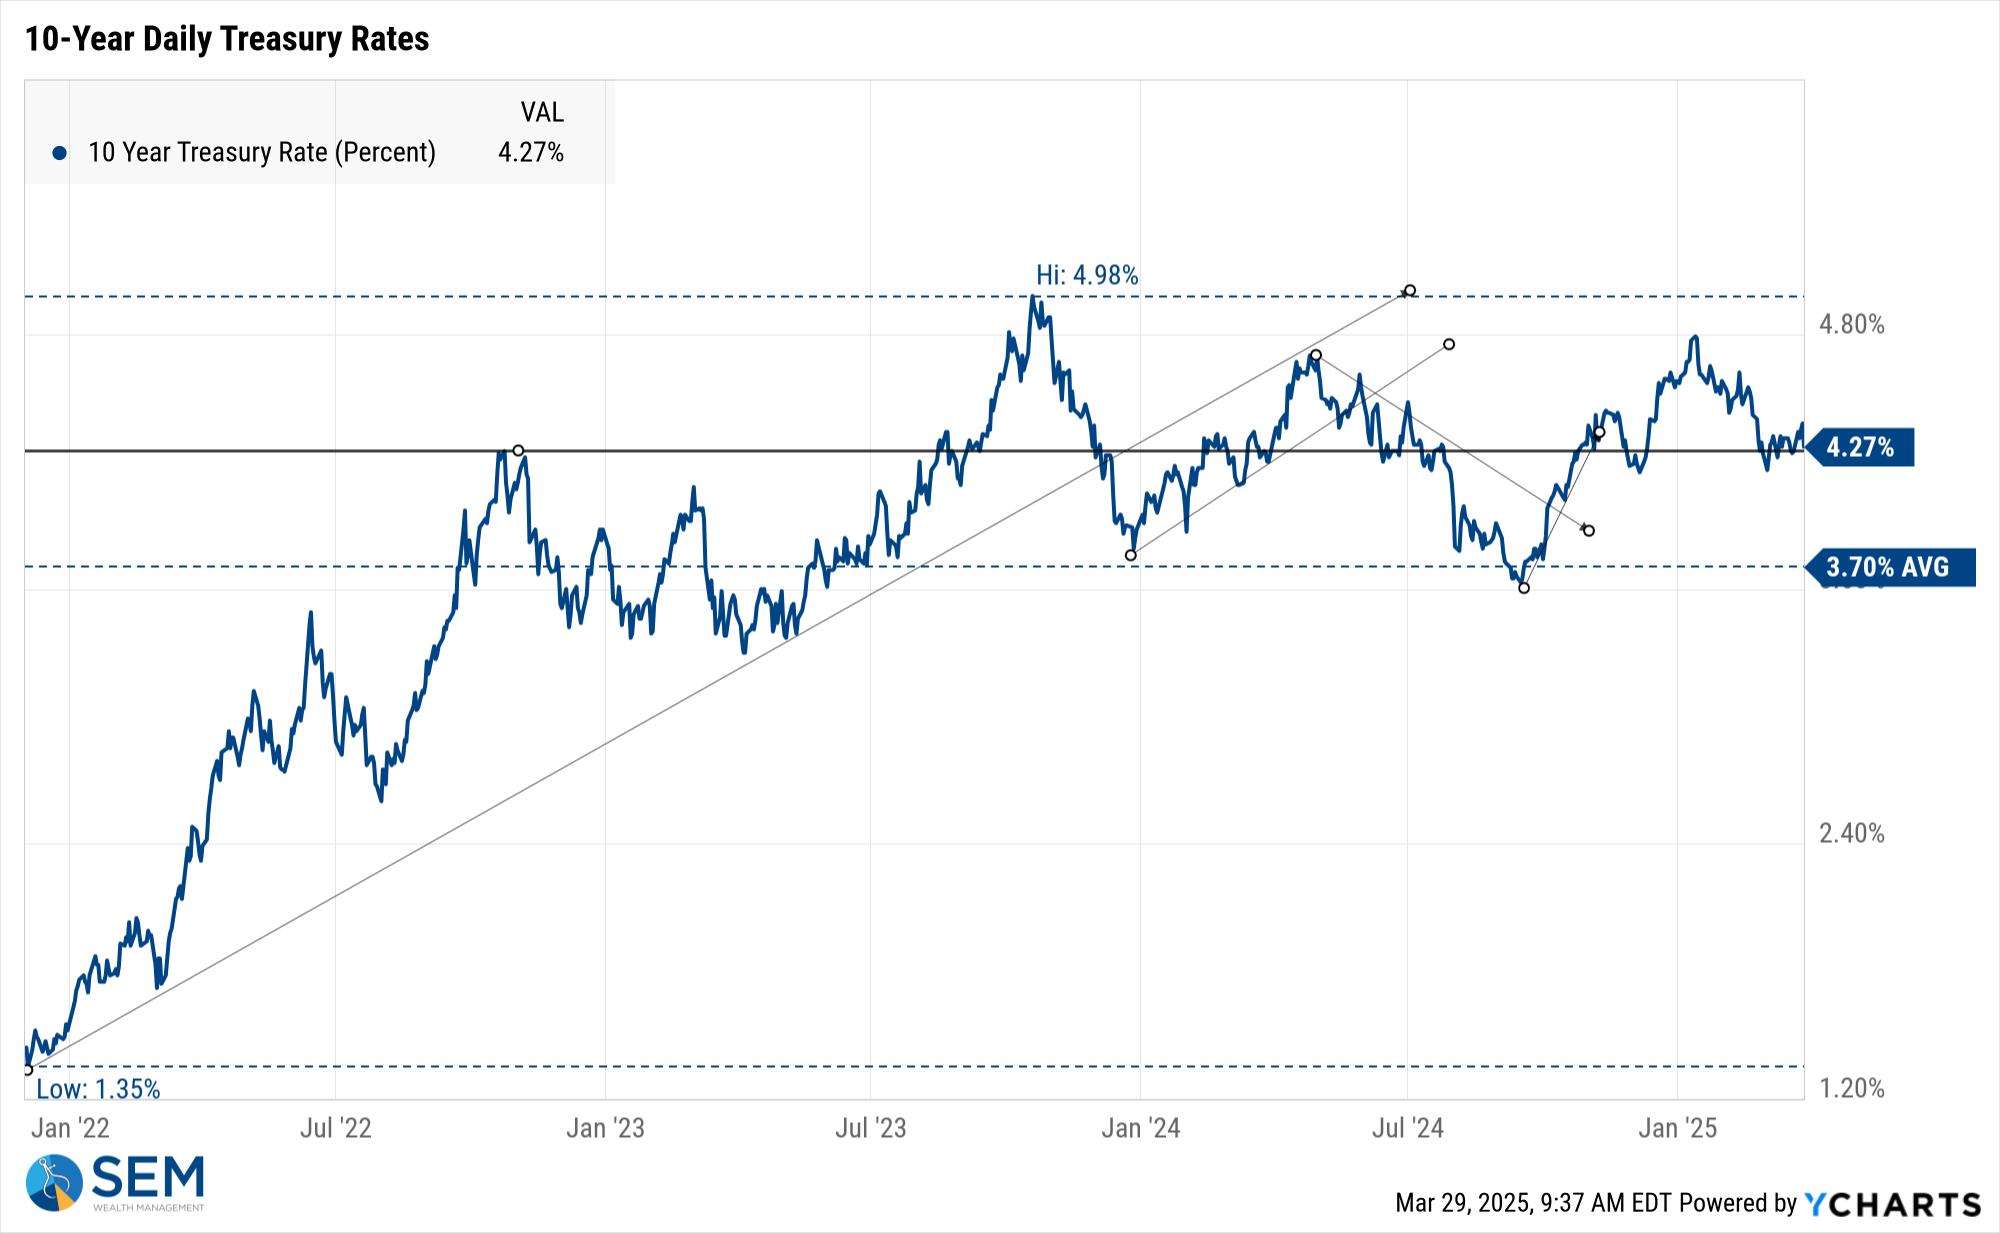
Treasury yields are not showing any sign of panic and remain in a comfortable range around 4.25% on the 10-year bond.
More importantly, we aren't yet seeing any sign of economic stress. While Continuing Claims remain near the highs, an indication that if you lost your job you are having a hard time finding a new one, initial claims have not spiked.
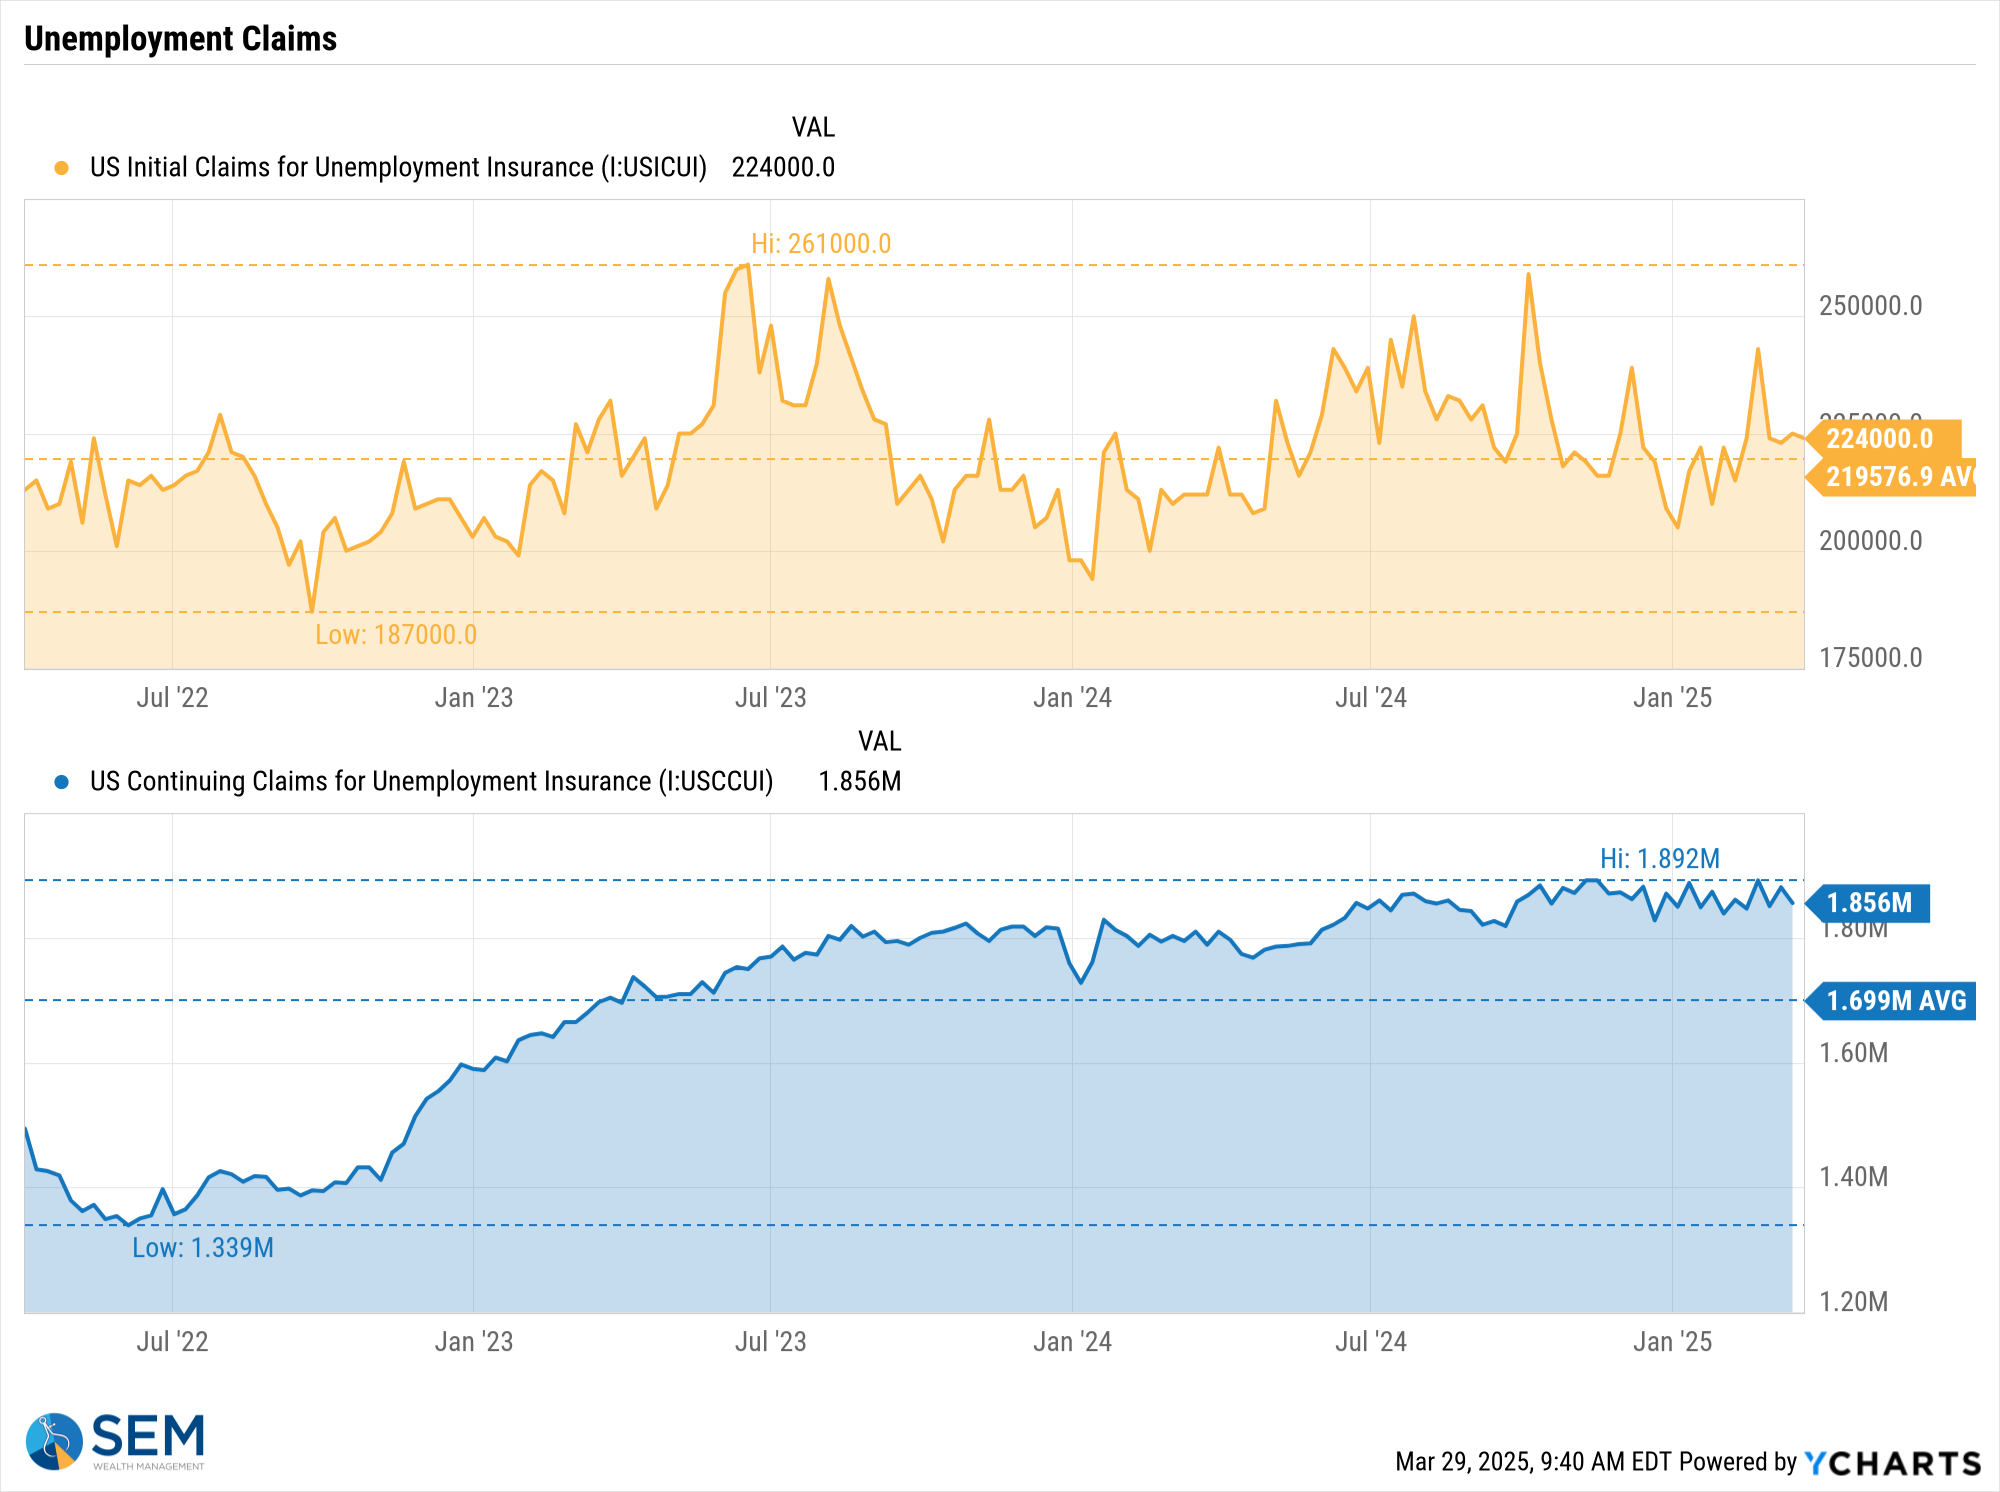
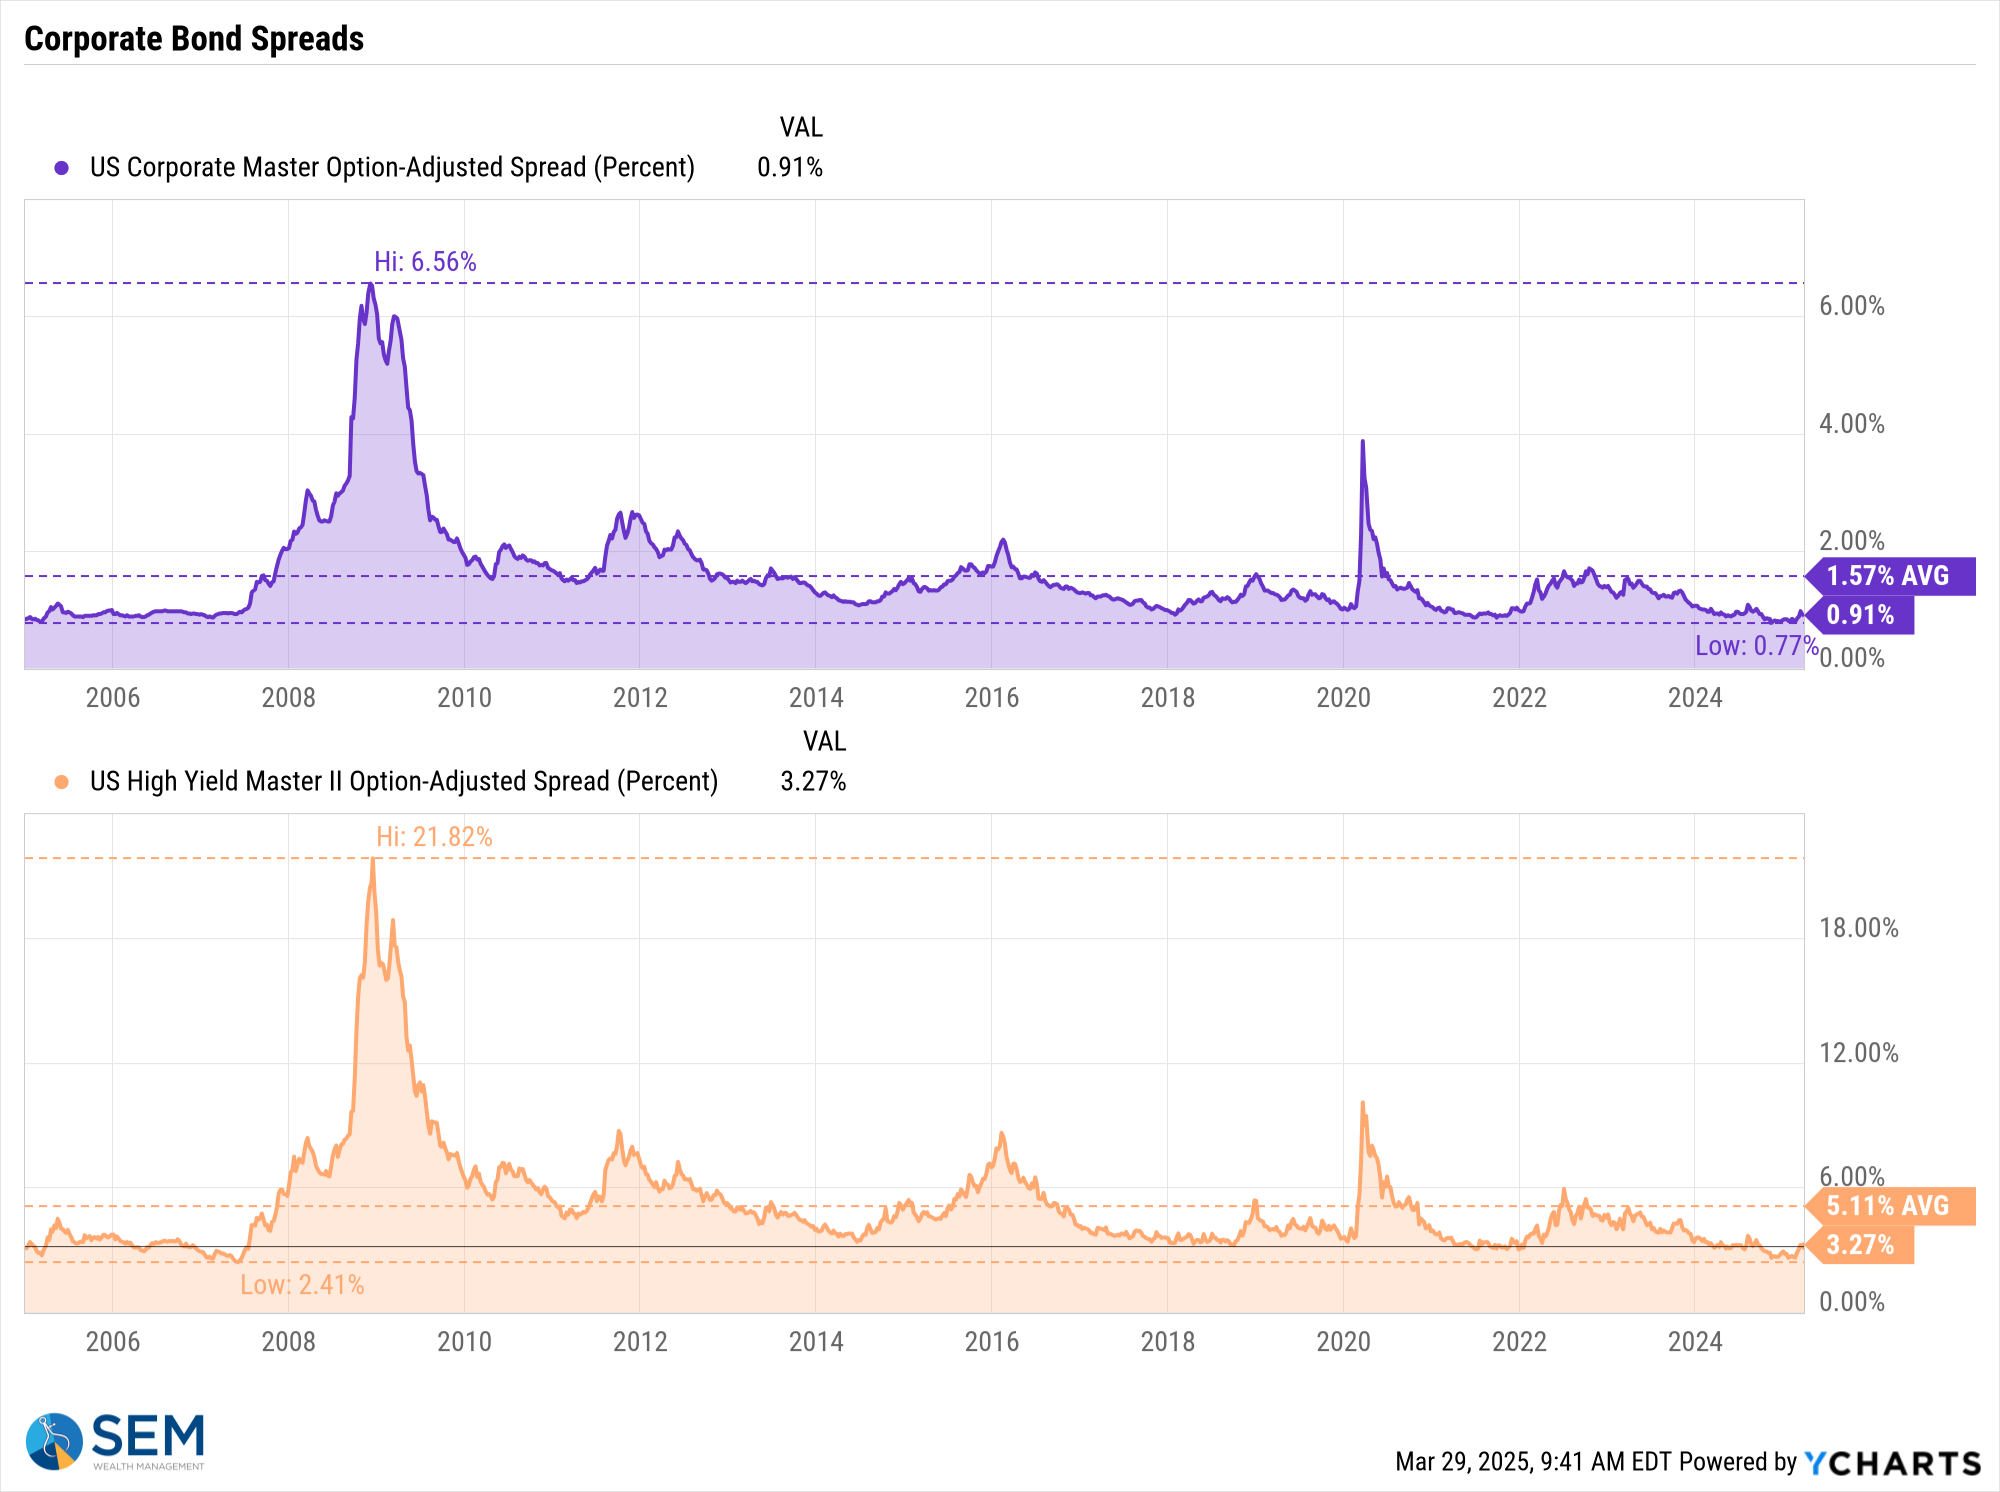
More importantly, corporate bond spreads remain near record low levels, an indication that bond investors do not see strain in the credit markets.
SEM Model Positioning
As of this morning, March 31 both our Tactical High Yield and the trend models inside of AmeriGuard and Cornerstone are within a whisker of a sell signal. The action most of last week was negative, especially the sell-off on Friday. If the week starts off on a negative slant, we could see some sells in several of our models.
Stay tuned.
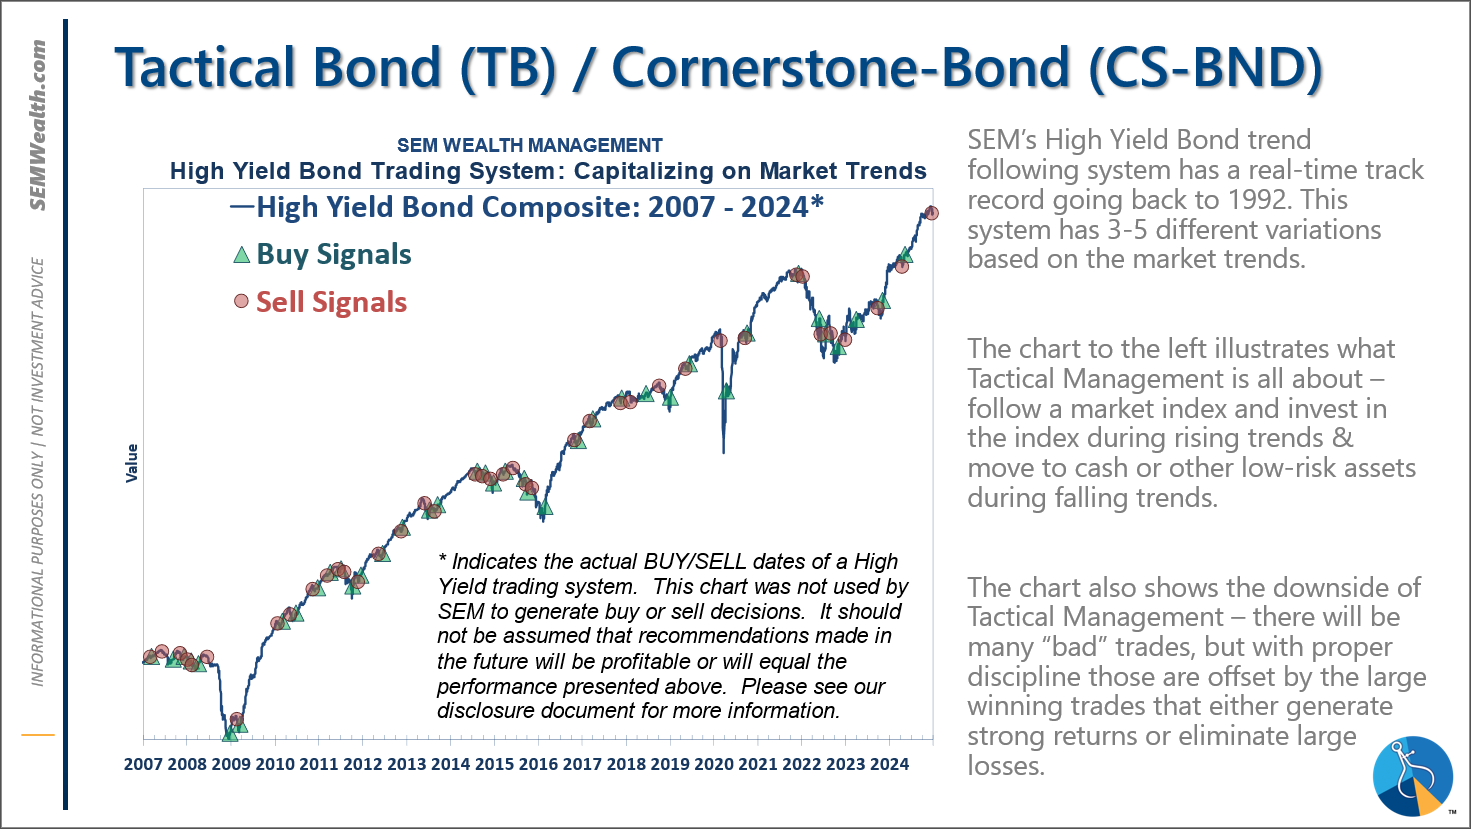
-Tactical High Yield reentered the high yield bond market on 1/27/25 after about 5 weeks on the sidelines. We had added a 30% position in floating rate bonds on 12/6/24, which currently have a 9% yield compared to a 6% yield in high yields and 4.6% in money markets.
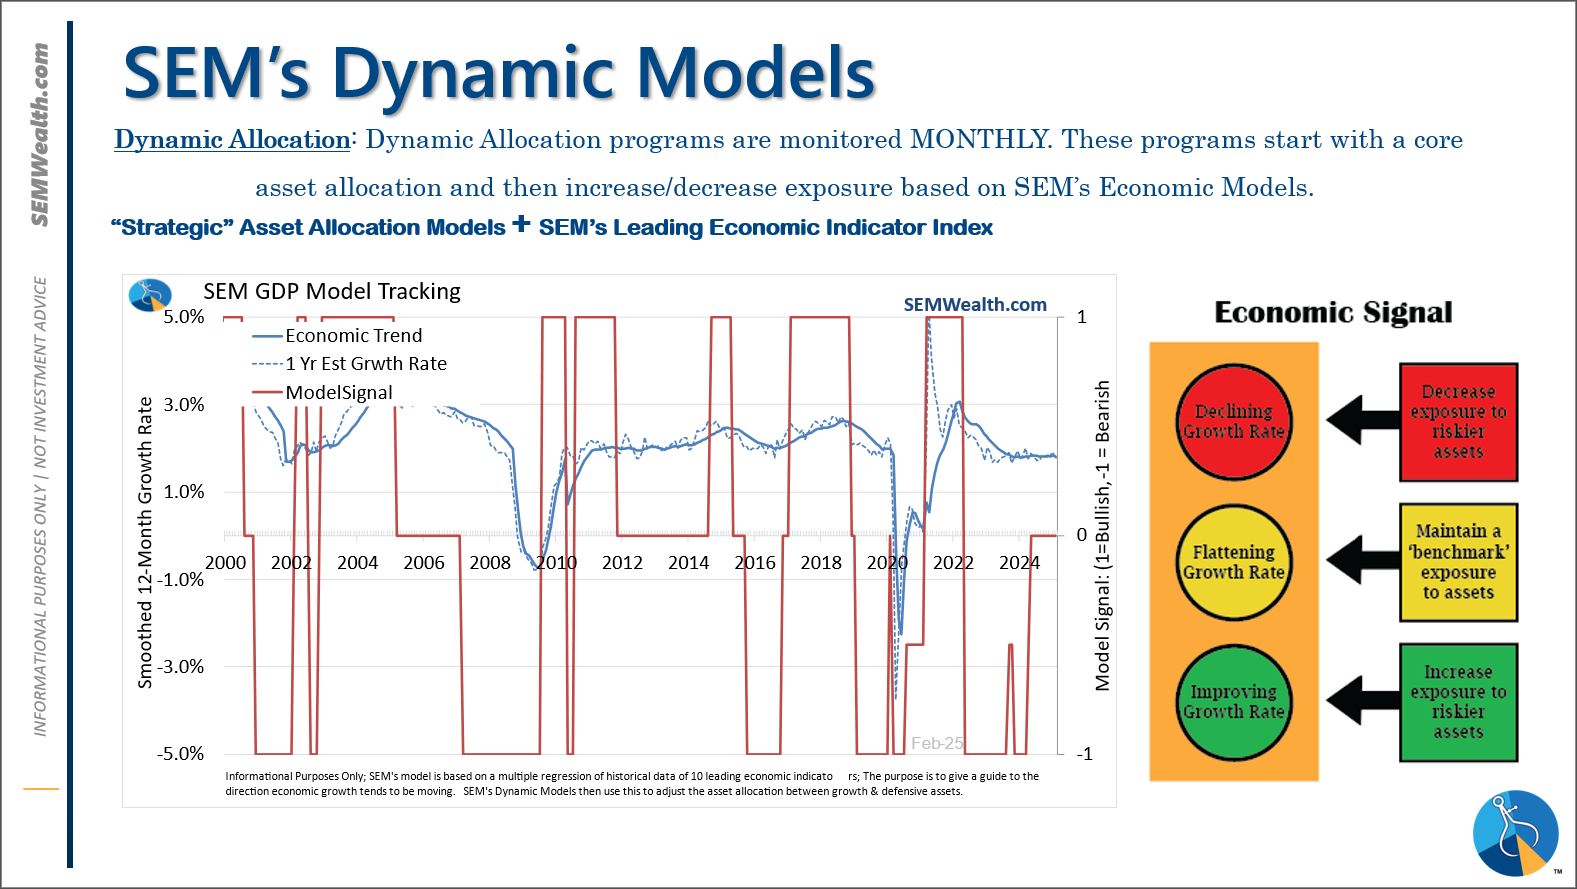
-Dynamic Models are 'neutral' as of 6/7/24, reversing the half 'bearish' signal from 5/3/2024. 7/8/24 - interest rate model flipped from partially bearish to partially bullish (lower long-term rates).
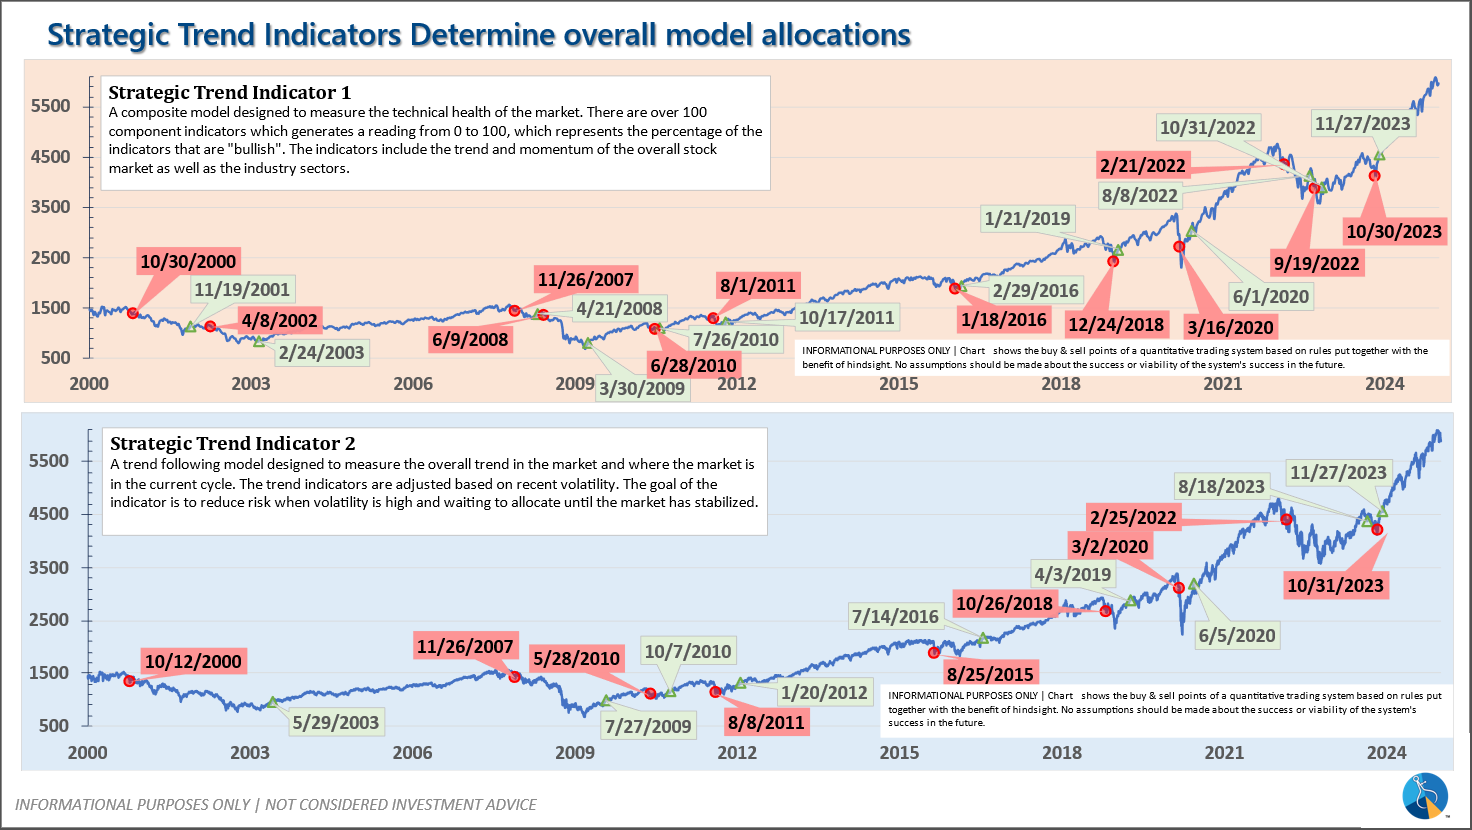
-Strategic Trend Models went on a buy 11/27/2023; 7/8/24 – small and mid-cap positions eliminated with latest Core Rotation System update – money shifted to Large Cap Value (Dividend Growth) & International Funds
SEM deploys 3 distinct approaches – Tactical, Dynamic, and Strategic. These systems have been described as 'daily, monthly, quarterly' given how often they may make adjustments. Here is where they each stand.
Tactical (daily): On 12/20/2024 our tactical high yield model sold out of high yield bond (about 70% of our holdings) into money market. The other 30% is invested in shorter duration, higher yielding floating rate bonds. These instruments are not as sensitive to credit risk and are typically allocated to in the early and late stages of a high yield bond move in our model.
Dynamic (monthly): The economic model was 'neutral' since February. In early May the model moved slightly negative, but reversed back to 'neutral' in June. This means 'benchmark' positions – 20% dividend stocks in Dynamic Income and 20% small cap stocks in Dynamic Aggressive Growth. The interest rate model is slightly 'bullish'.
Strategic (quarterly)*: BOTH Trend Systems reversed back to a buy on 11/27/2023
The core rotation is adjusted quarterly. On August 17 it rotated out of mid-cap growth and into small cap value. It also sold some large cap value to buy some large cap blend and growth. The large cap purchases were in actively managed funds with more diversification than the S&P 500 (banking on the market broadening out beyond the top 5-10 stocks.) On January 8 it rotated completely out of small cap value and mid-cap growth to purchase another broad (more diversified) large cap blend fund along with a Dividend Growth fund.
The * in quarterly is for the trend models. These models are watched daily but they trade infrequently based on readings of where each believe we are in the cycle. The trend systems can be susceptible to "whipsaws" as we saw with the recent sell and buy signals at the end of October and November. The goal of the systems is to miss major downturns in the market. Risks are high when the market has been stampeding higher as it has for most of 2023. This means sometimes selling too soon. As we saw with the recent trade, the systems can quickly reverse if they are wrong.
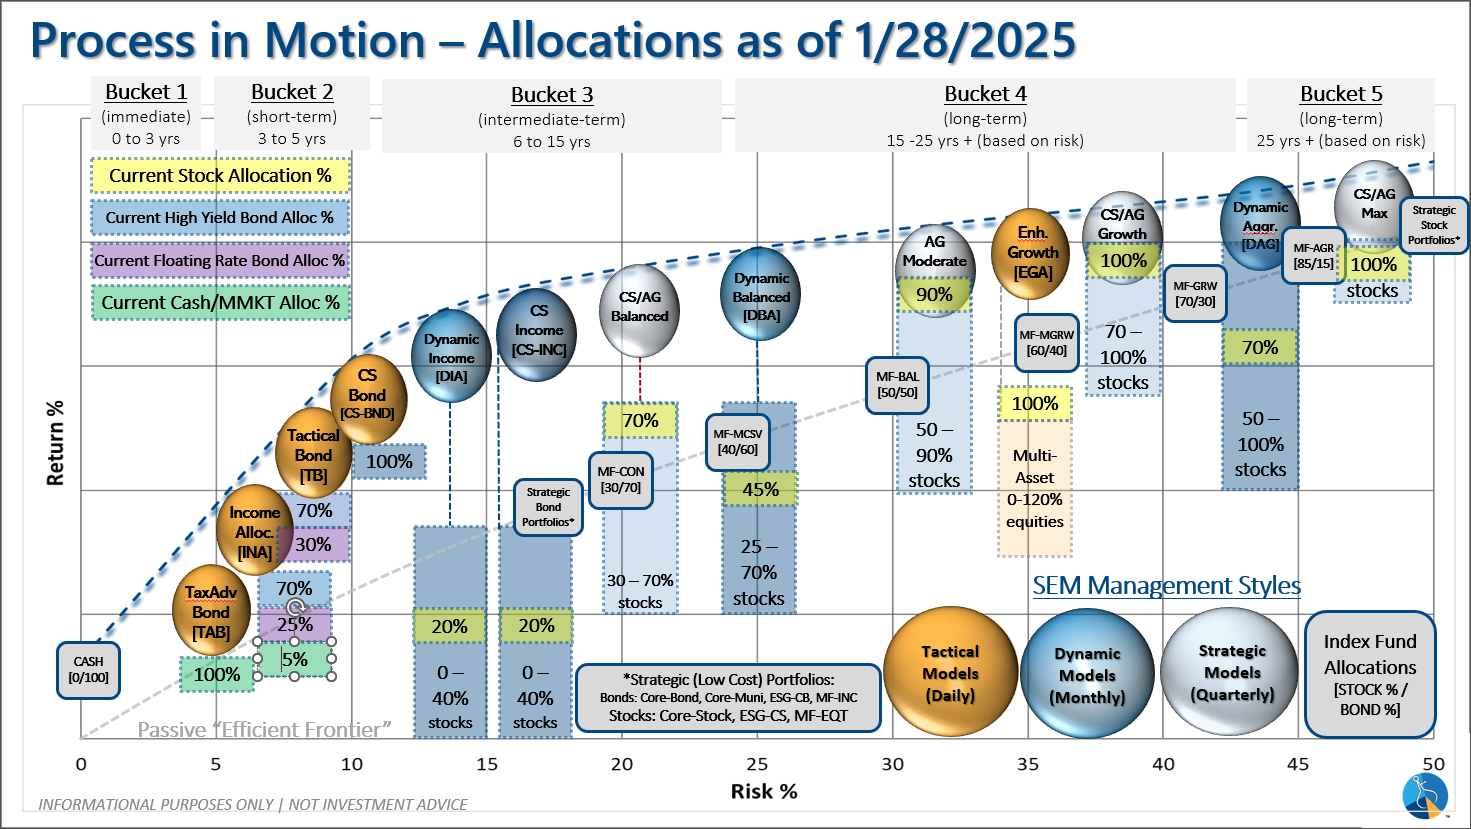
Overall, this is how our various models stack up based on the last allocation change:
Questions or comments - drop us a note?
Curious if your current investment allocation aligns with your overall objectives and risk tolerance? Take our risk questionnaire


