
Remember when the market was terrified of its own shadow back in April? Well, the AI trade slapped a rally cap on Wall Street and dragged the major indexes back into the green. Meanwhile, Washington and Beijing are playing “Rollback Roulette,” and the President is again blasting Jerome Powell harder than a middle-schooler with a TikTok account. Buckle up—let’s quickly unpack the week that was so we can take a deeper look into how we really got here.
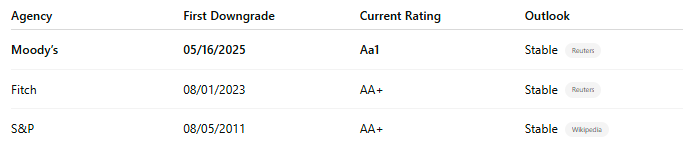
Moody’s Finally Pulls the Trigger — U.S. Loses Its Last “AAA”
Moody’s cut the U.S. sovereign rating to Aa1 from Aaa after Friday’s close (05/16/2025), citing (1) persistent, large fiscal deficits, (2) a debt burden now topping $36 trillion and projected to 134 % of GDP by 2035, and (3) political gridlock that makes any multi-year fix “unlikely.” The outlook was set to stable, but the move closes the chapter on America’s century-long run of triple-A status across all three major agencies.
Initial market read:
- The S&P 500, Nasdaq 100 and Dow futures opened Sunday down and continued their sell-off and are looking to open down 1% or more, while the 10-year Treasury yield pushed above 4.5 % as investors demanded a higher premium.
- China’s Finance Ministry urged Washington to “act responsibly to safeguard global financial stability,” underscoring how the downgrade reverberates well beyond U.S. borders. Reuters
Why it matters for advisors & clients
- Financing cost creep: Even a 25-bp rise in average Treasury funding rates adds roughly $90 B a year to interest outlays. Expect renewed headlines around debt-ceiling politics and Treasury-auction demand.
- Risk-free rate ≠ risk-free volatility: A ratings change doesn’t make default likely, but it does amplify term-premium swings that feed directly into mortgage rates, corporate spreads and equity valuation models.
- Knock-on to credit spreads: U.S. sovereign CDS widened after the announcement; keep an eye on high-grade corporates that price off the Treasury curve.
- Policy constraint: With yields already elevated, the downgrade limits fiscal space just as recession odds and tariff-related growth headwinds are rising.
- Tax cuts may be pulled back: The "one big beautiful bill" the President has promised with not only an extension of his 2017 tax cuts, but an expansion of them will likely face more pressure from the few remaining fiscally conservative Republicans who will see this as a stark warning to the US that they cannot continue to spend so freely.
What we’re watching next
- This week’s 20- and 30-year bond trading and the weekly auctions for signs of real foreign-reserve–manager demand.
- Money-market fund flows and any possible "repo" or other emergency actions from the Fed
- Counter-trend equity leadership: higher-quality balance-sheet names often outperform in the wake of credit-confidence shocks.
Why this isn't a repeat of 2011
Some of you may remember the "debt ceiling circus" of 2011 when the S&P first pulled the AAA rating from the US. At the time most prospectuses of insurance products, pensions, derivative products, and nearly all financial products had some sort of stipulation about the percentage of "AAA" debt that must be held. Since that time all of those have been re-written to including US Government debt in the "AAA" category regardless of the ratings services.
SEM Model Positioning (unchanged for now)
Our tactical high yield systems remain invested in high yield bonds. We will be watching closely whether "credit" risk in the corporate space becomes a concern or if this sell-off in bonds is only triggered for Treasury bonds. Our "trend" indicator in the "strategic models" was within 1/2% of going to a buy, so the markets were running into "resistance" already. For now, no allocation changes are being triggered. We will, however, watch closely our quantitative monitors around Treasury yields and corporate-bond momentum over the next several sessions.
Market Charts - S&P 500 Turns Positive / Yields Spike
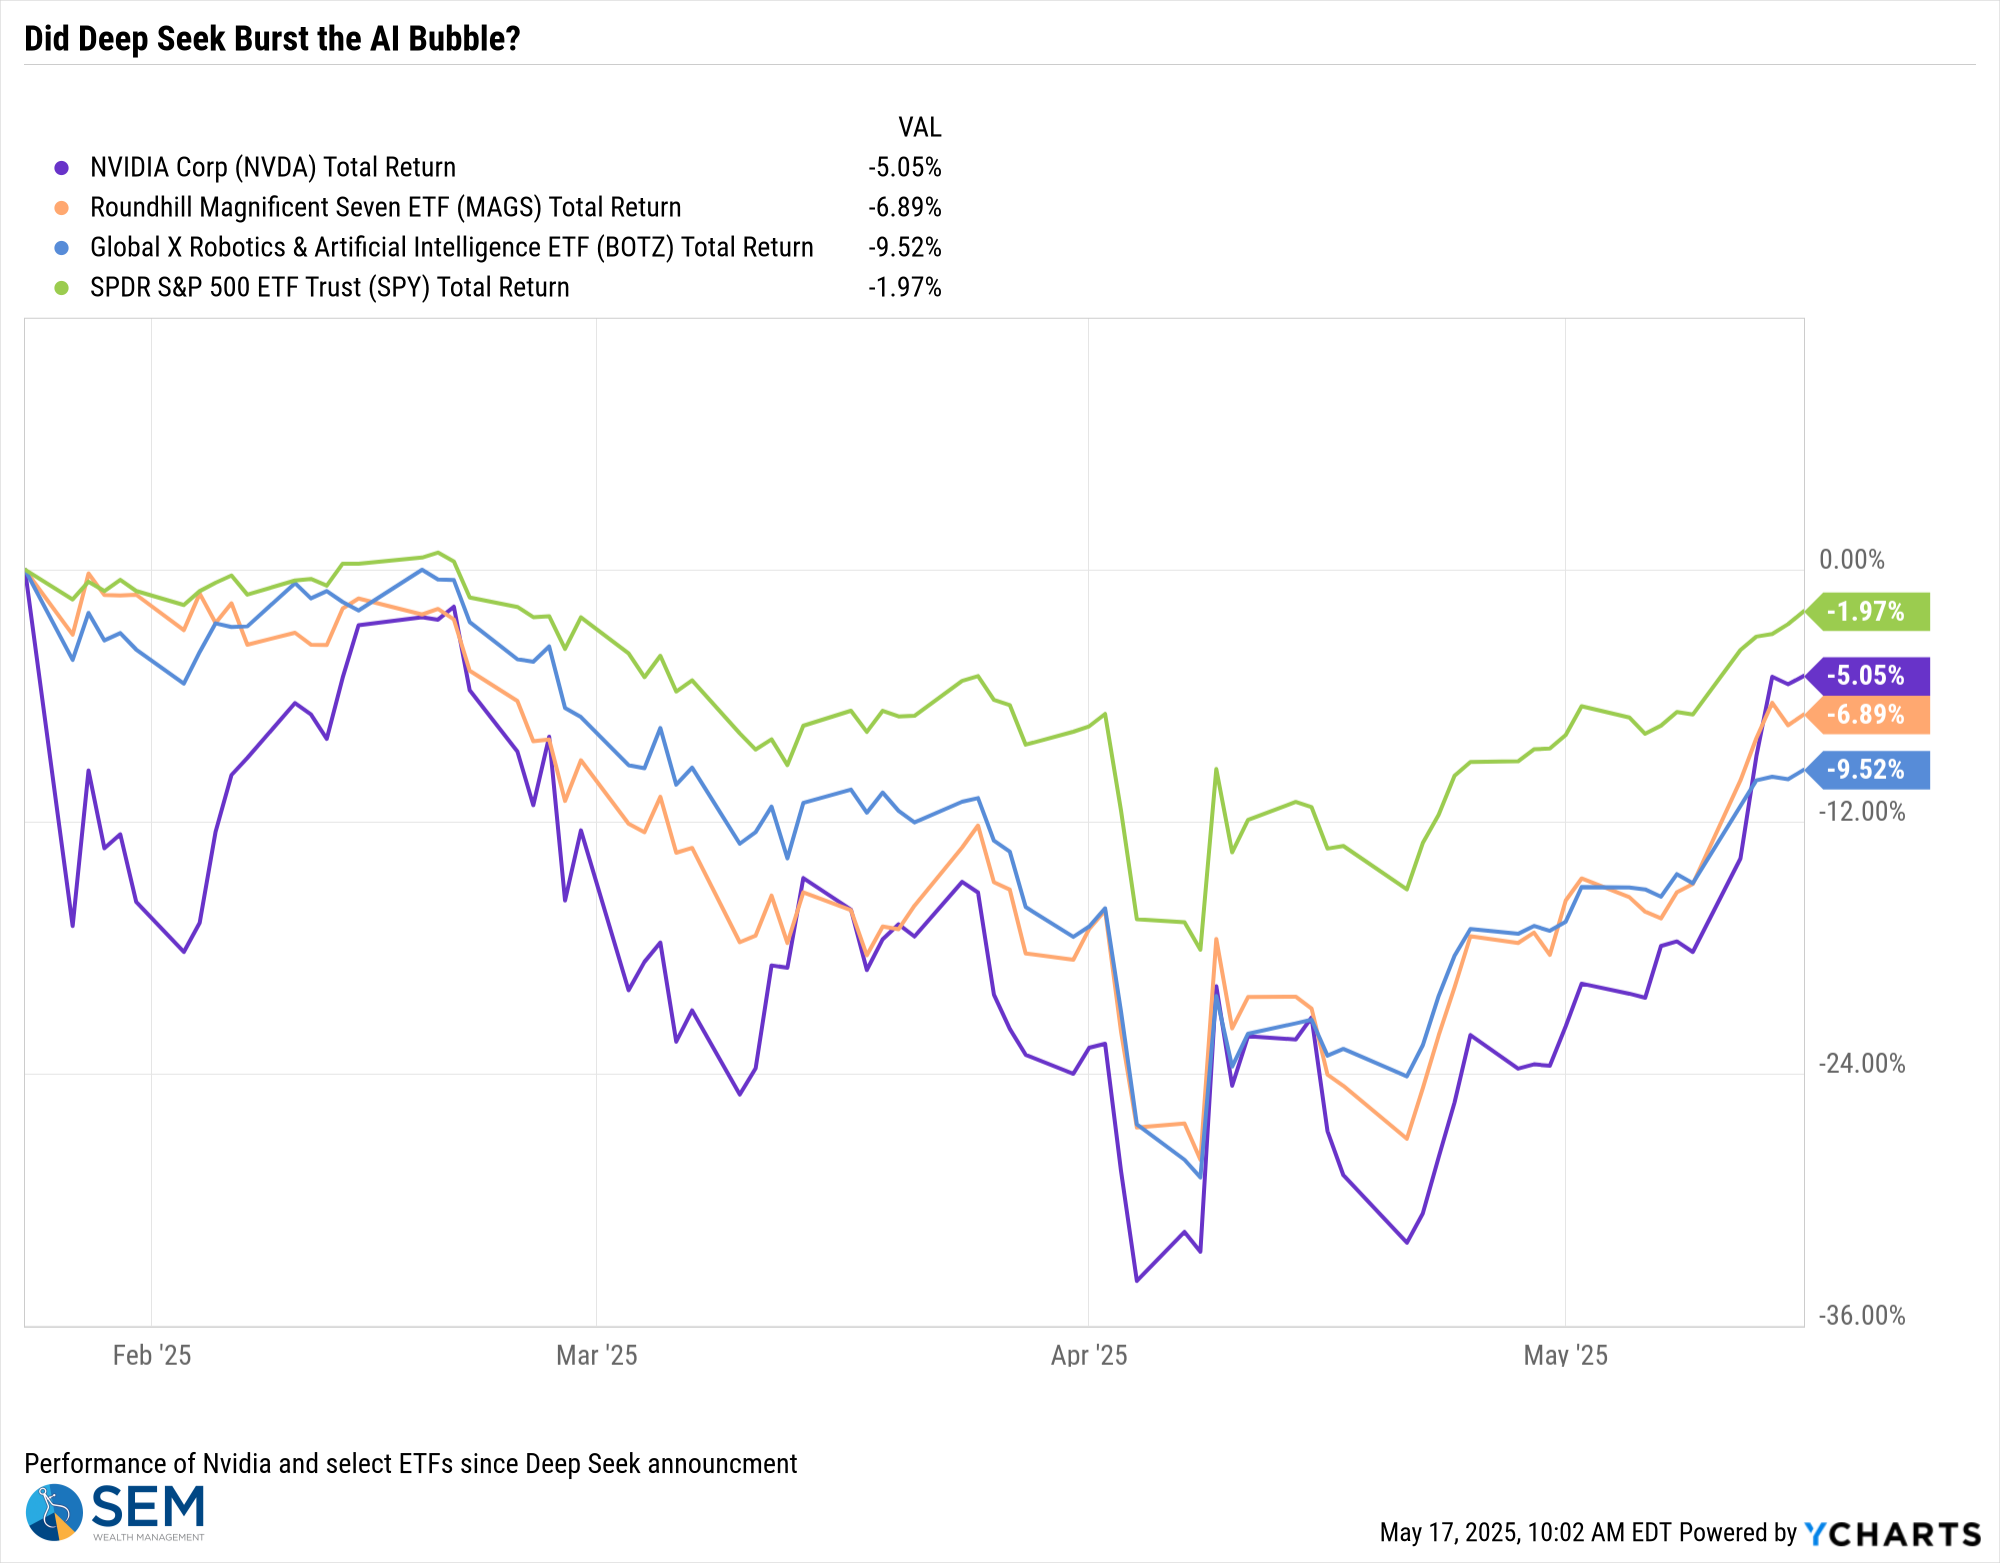
We normally have a section near the bottom on market charts, but the thing most on my mind over the weekend was how quickly the tone of the market shifted. The turn in the market was led by Nvidia and other AI-related stocks.
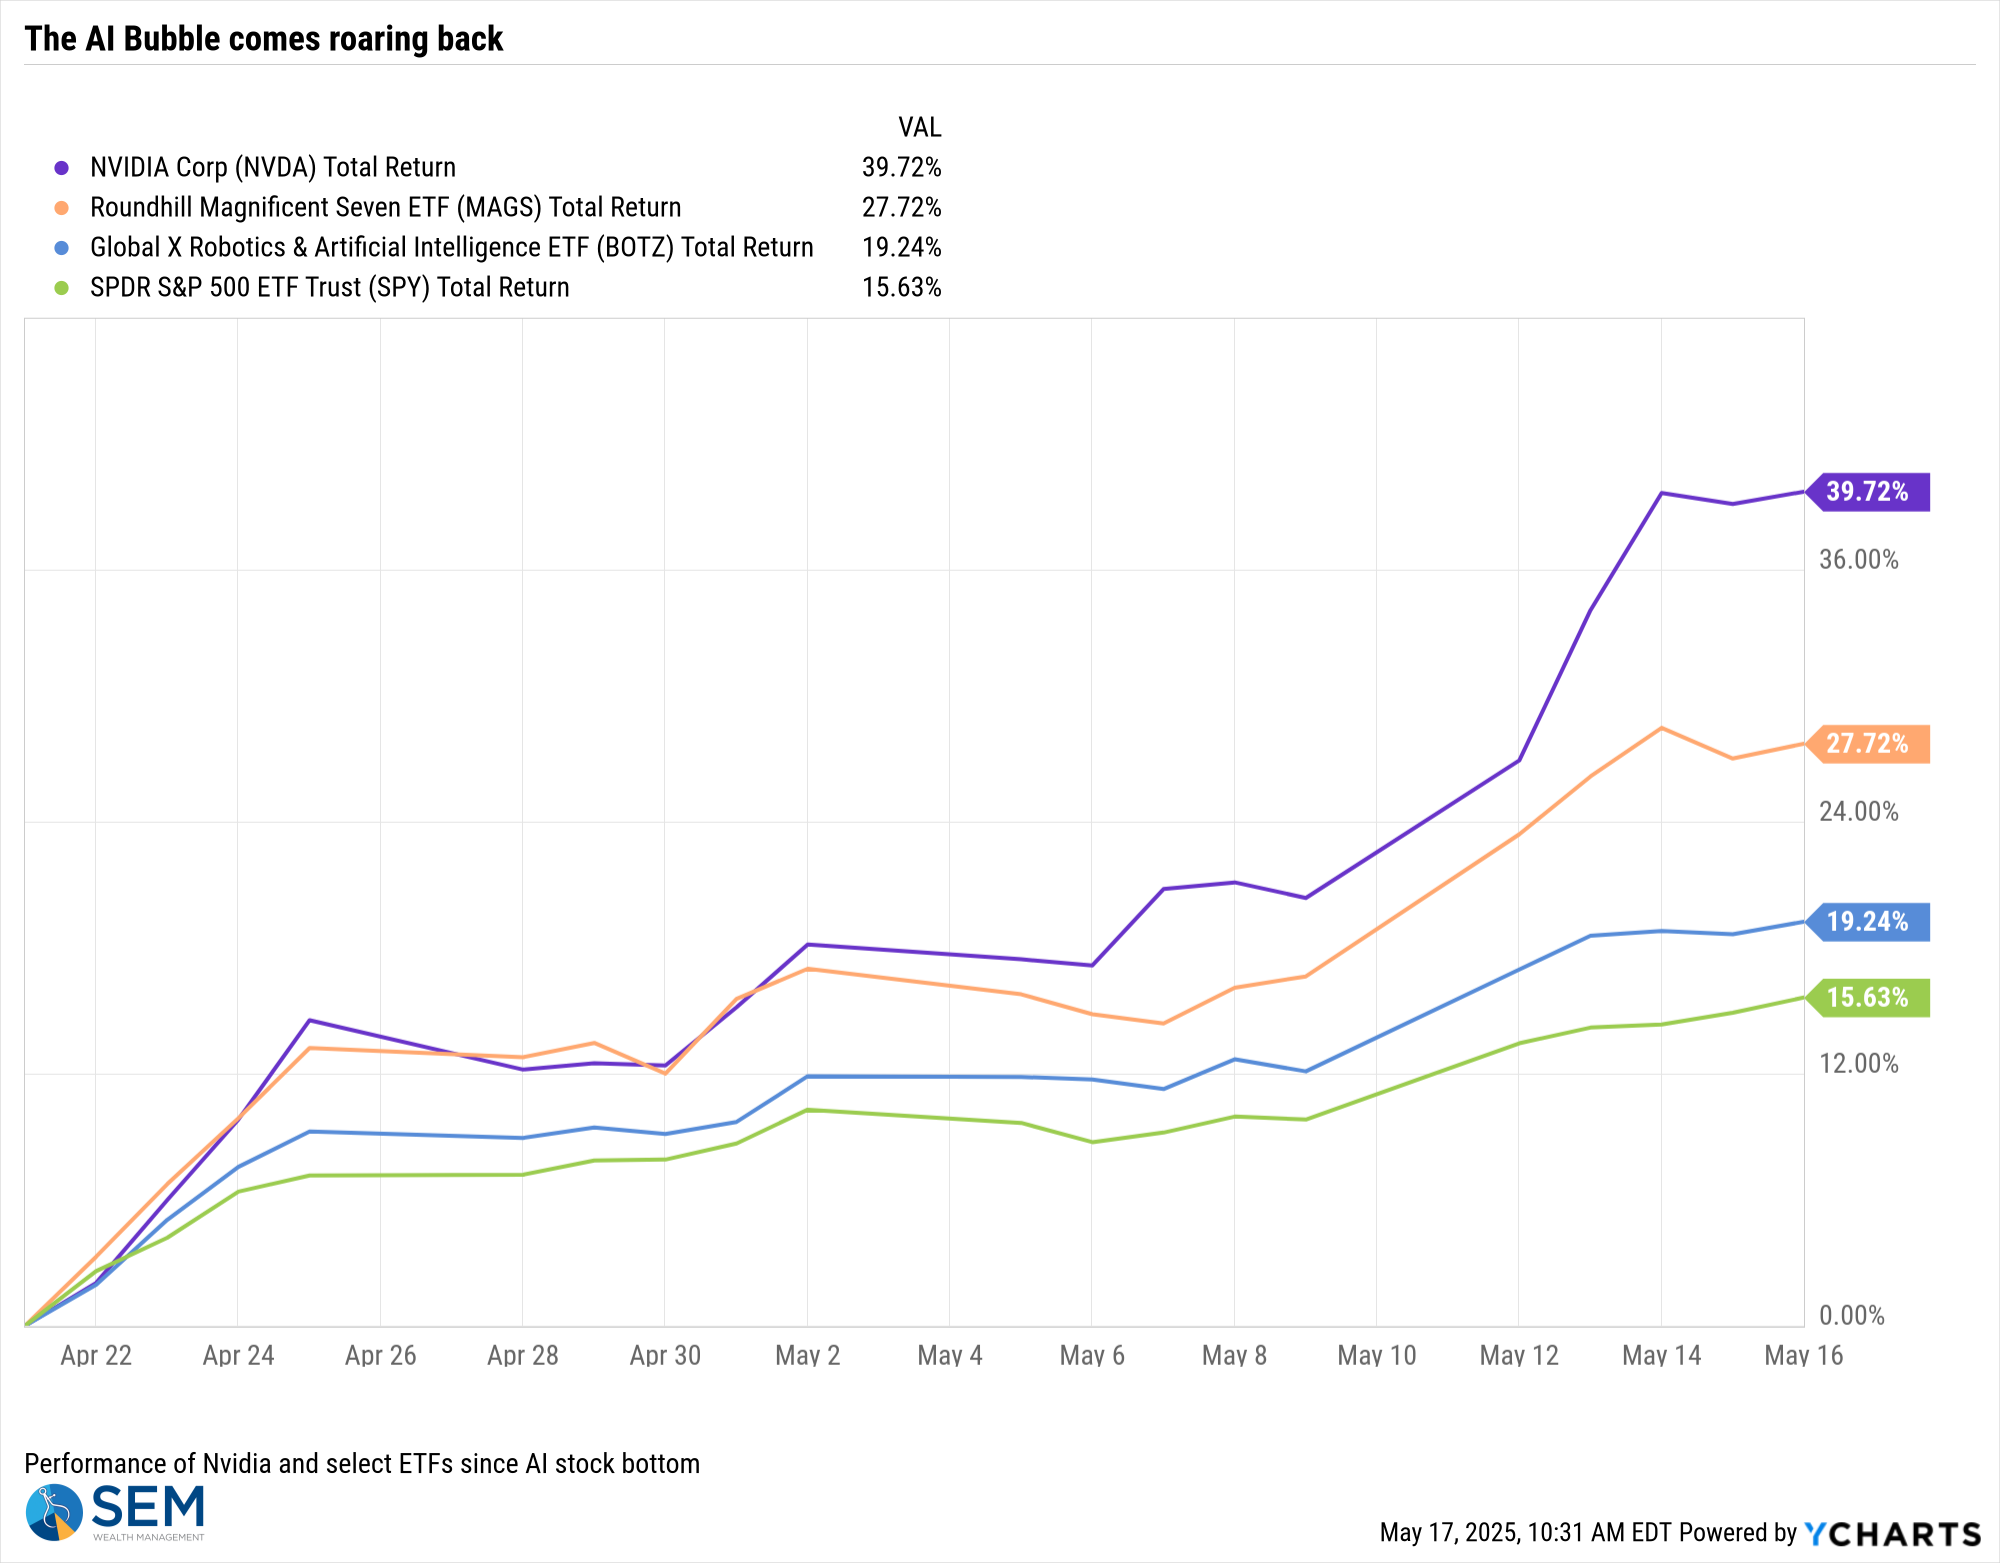
Here's an updated chart I made tracking these market leaders since the "Deep Seek" announcement. At least for now, it appears that bubble has reinflated. I may have to relabel this chart if the rally keeps going.
The catalyst of the rally seemed to be TSMC's 60% profit jump and the US government instructing every federal agency to accelerate AI adoption. When combined that with the 90-day pause for most "liberation day tariffs" announced the week earlier, with hindsight we can see the reason for a huge snapback rally.
Overall, the S&P 500 has returned to positive territory for the year, while the NASDAQ is inching its way to the black. Small caps continue to disappoint.
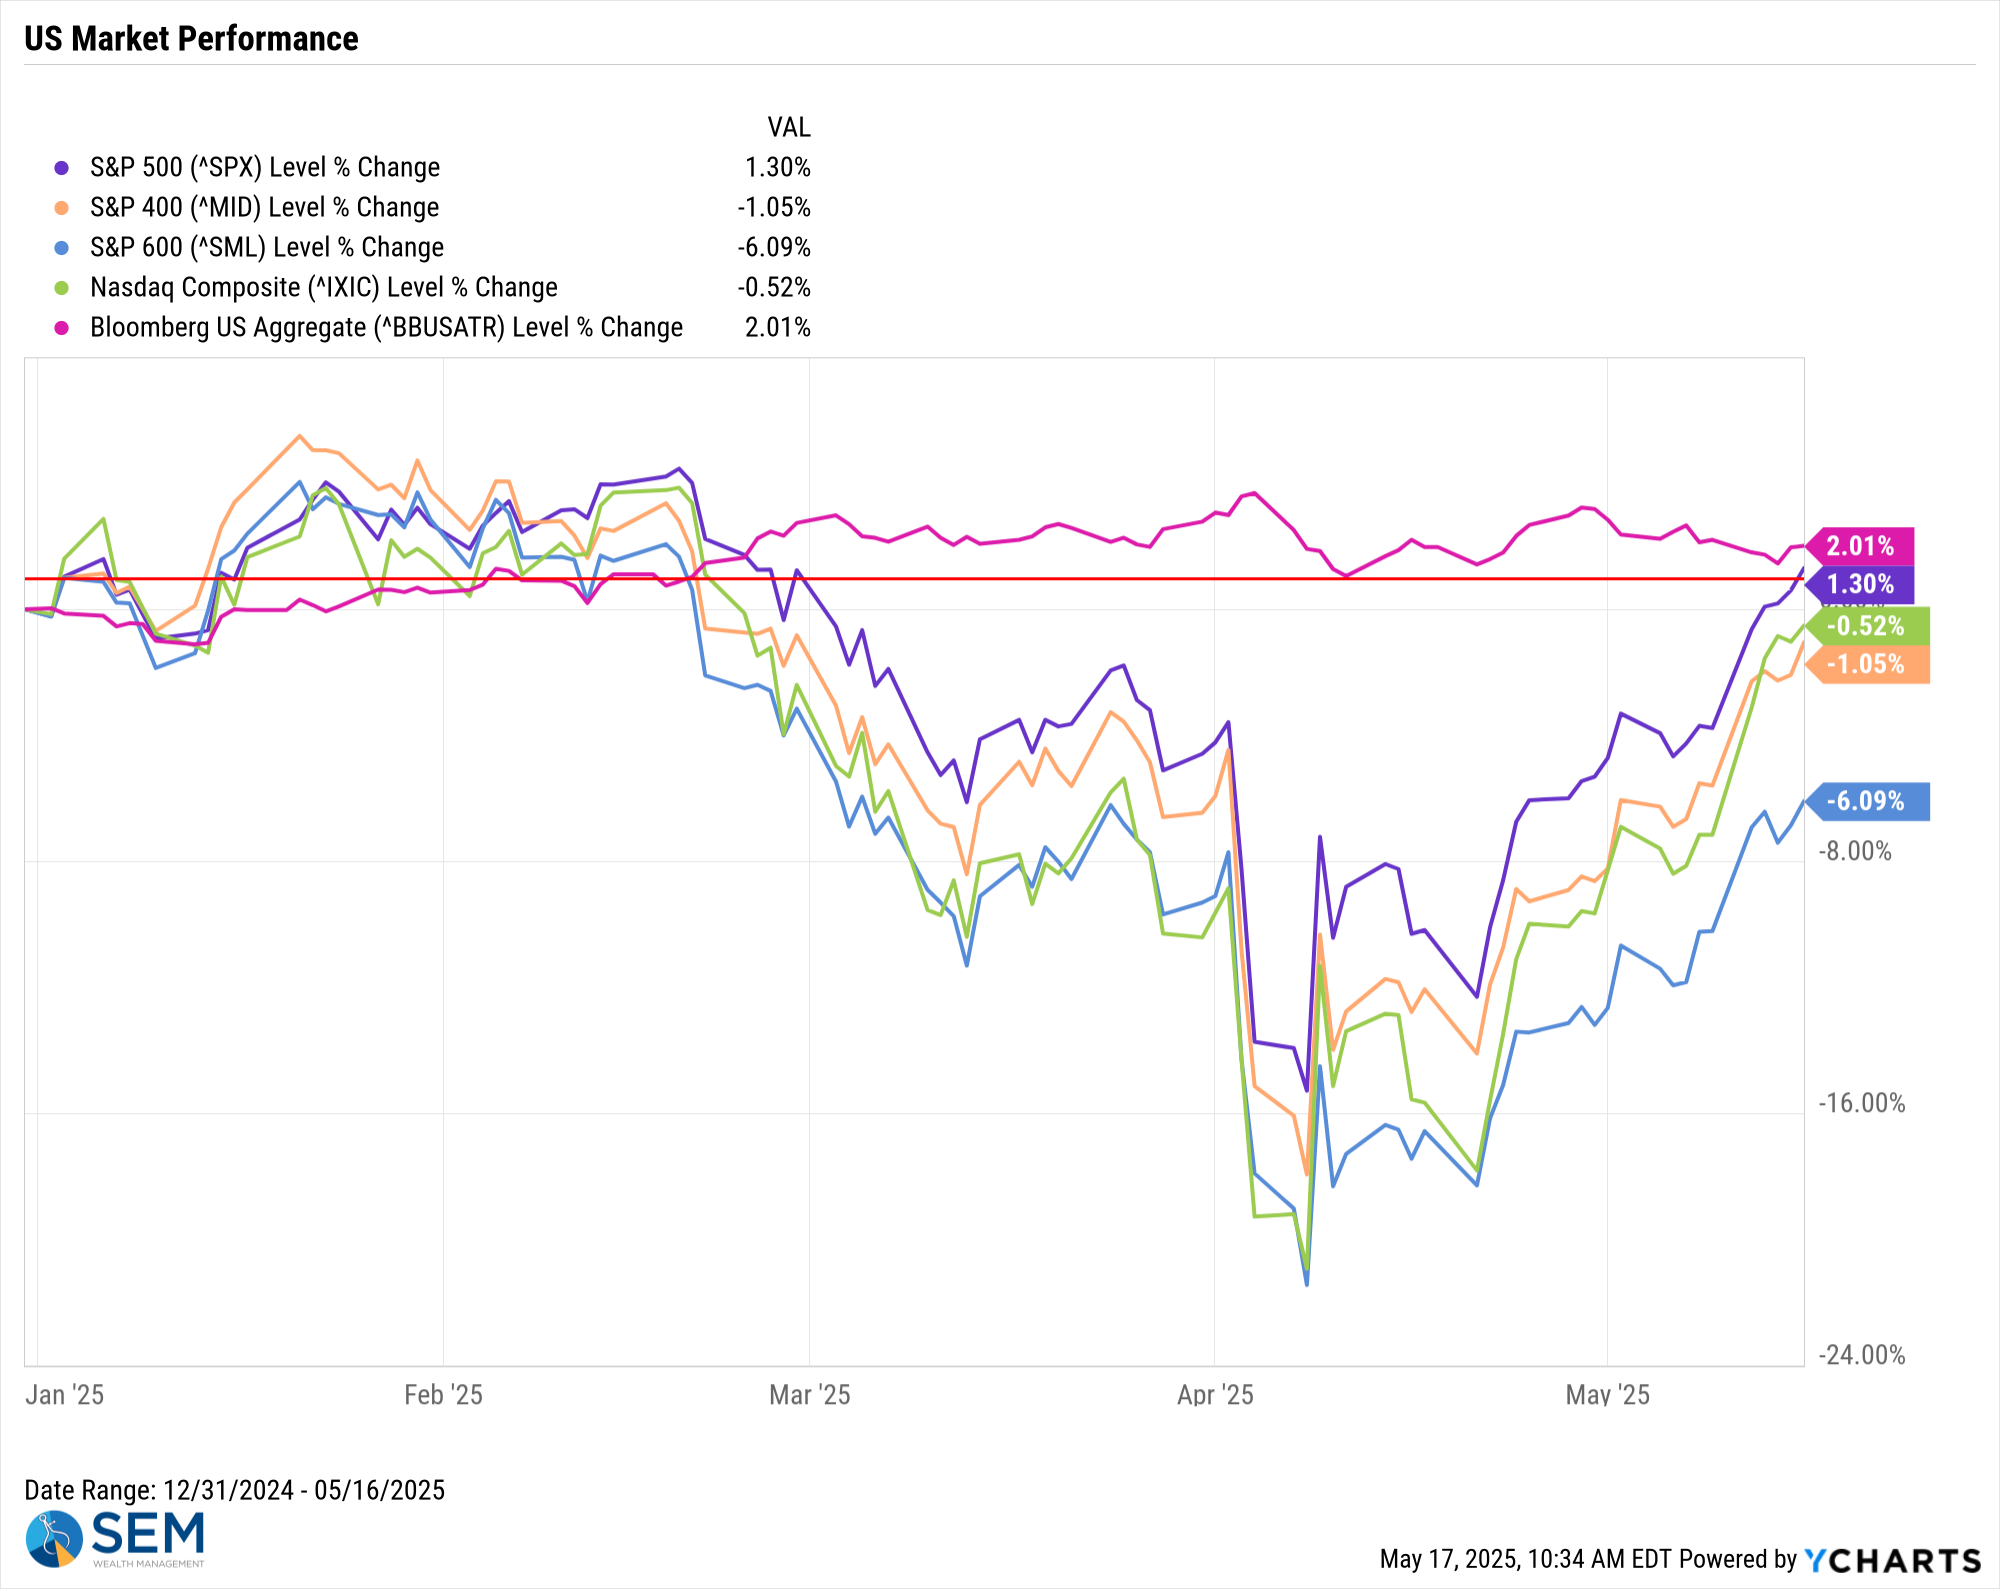
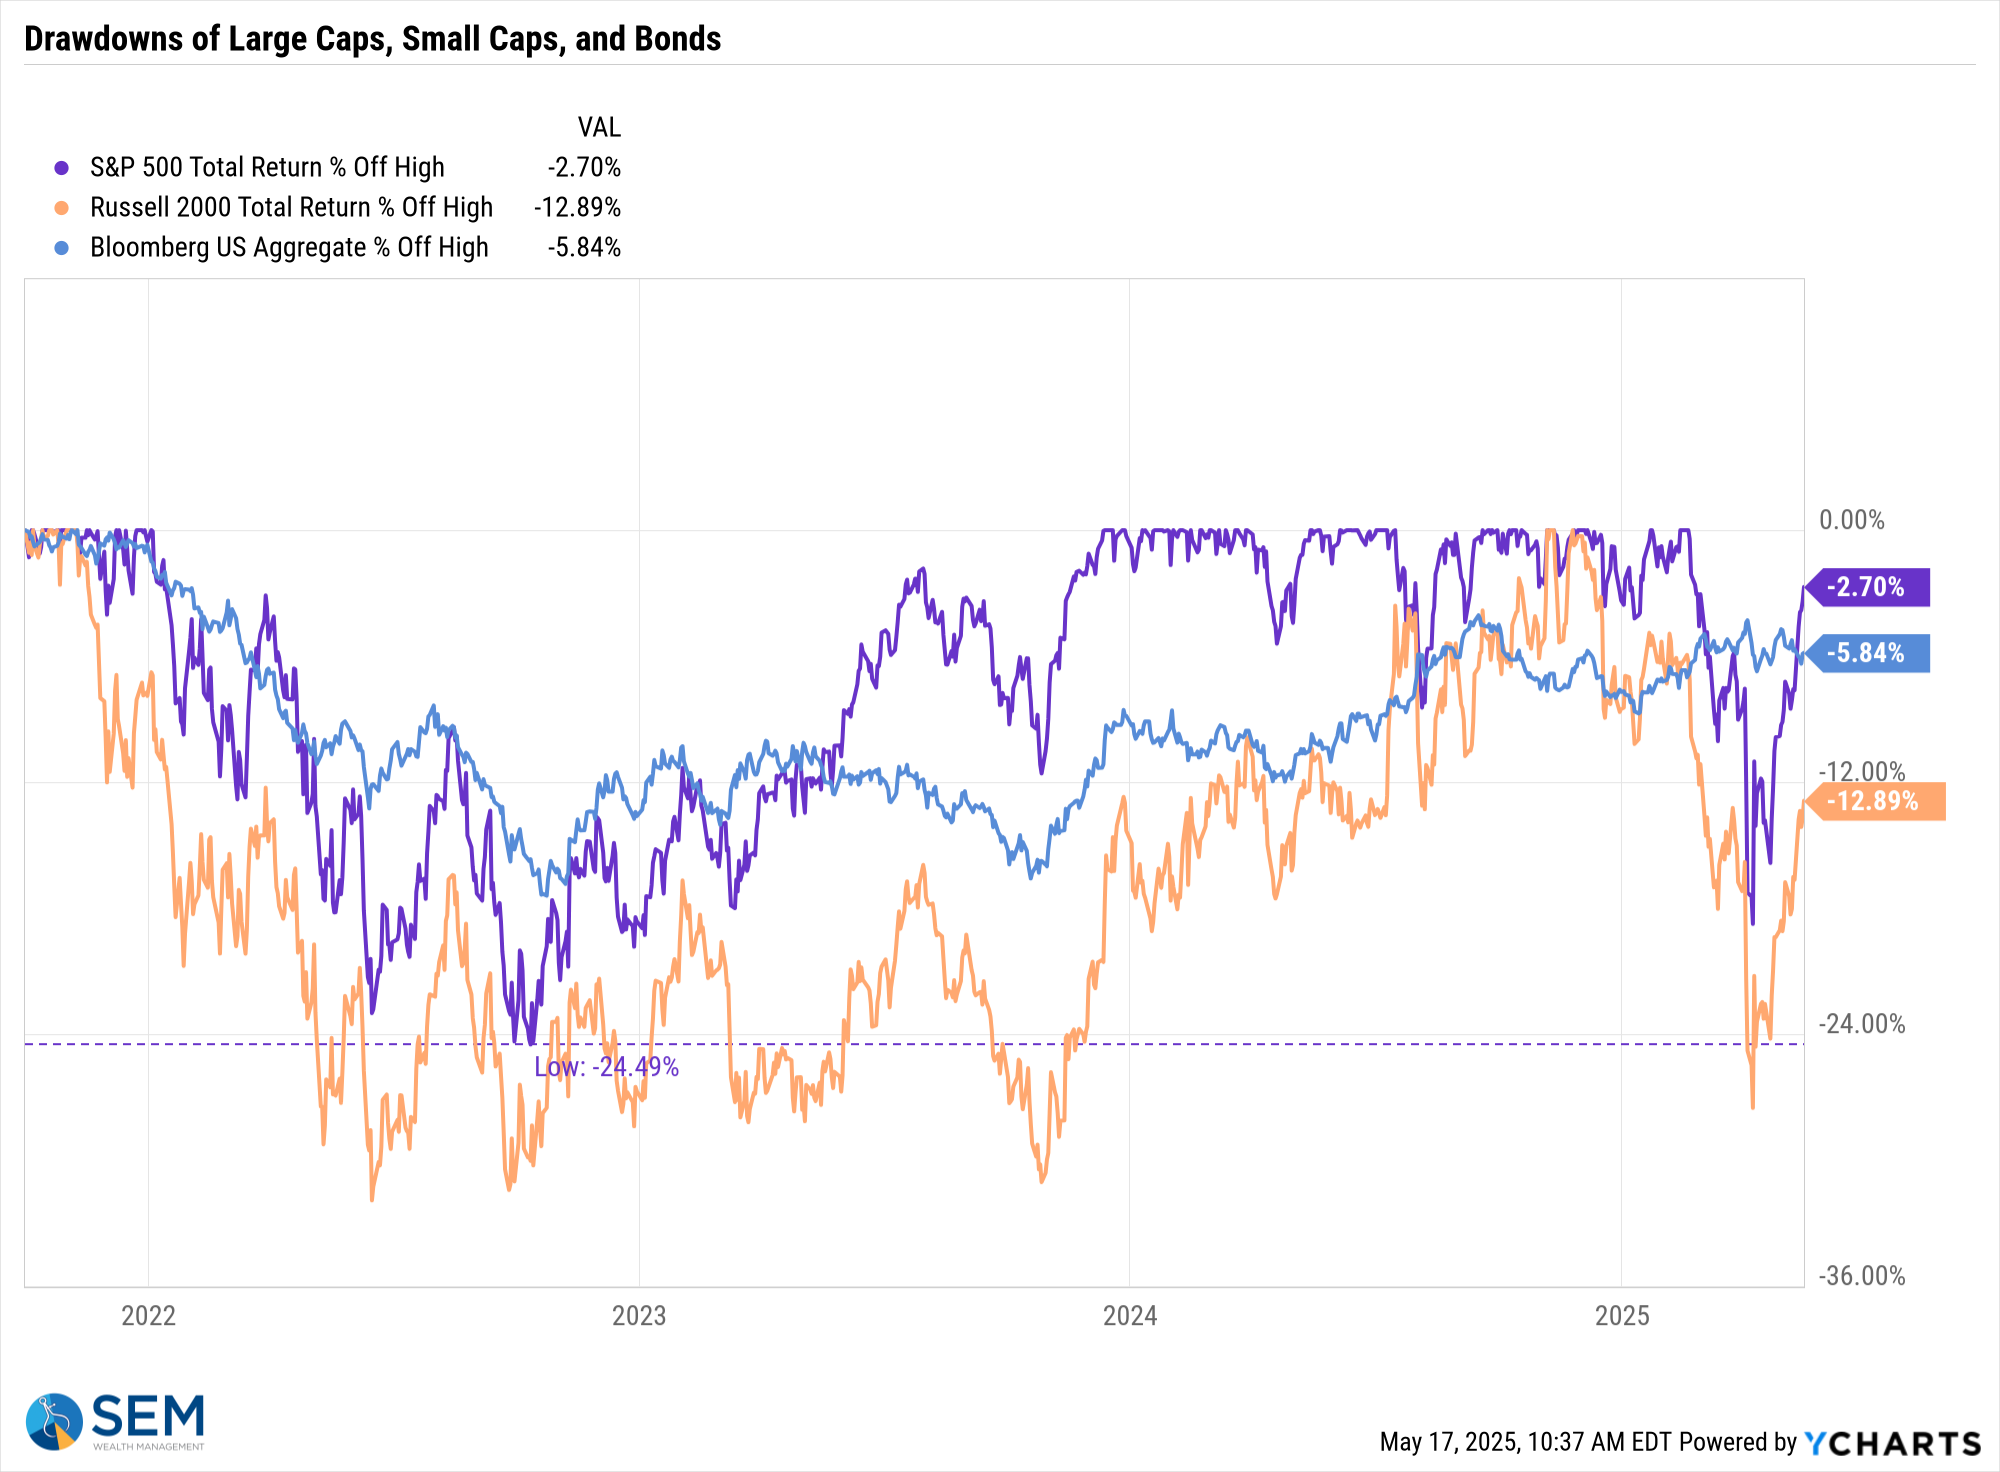
The bigger story remains the bond market, especially Treasuries. We will have more on that below, but for now, let's continue to keep a close eye on Treasury yields:

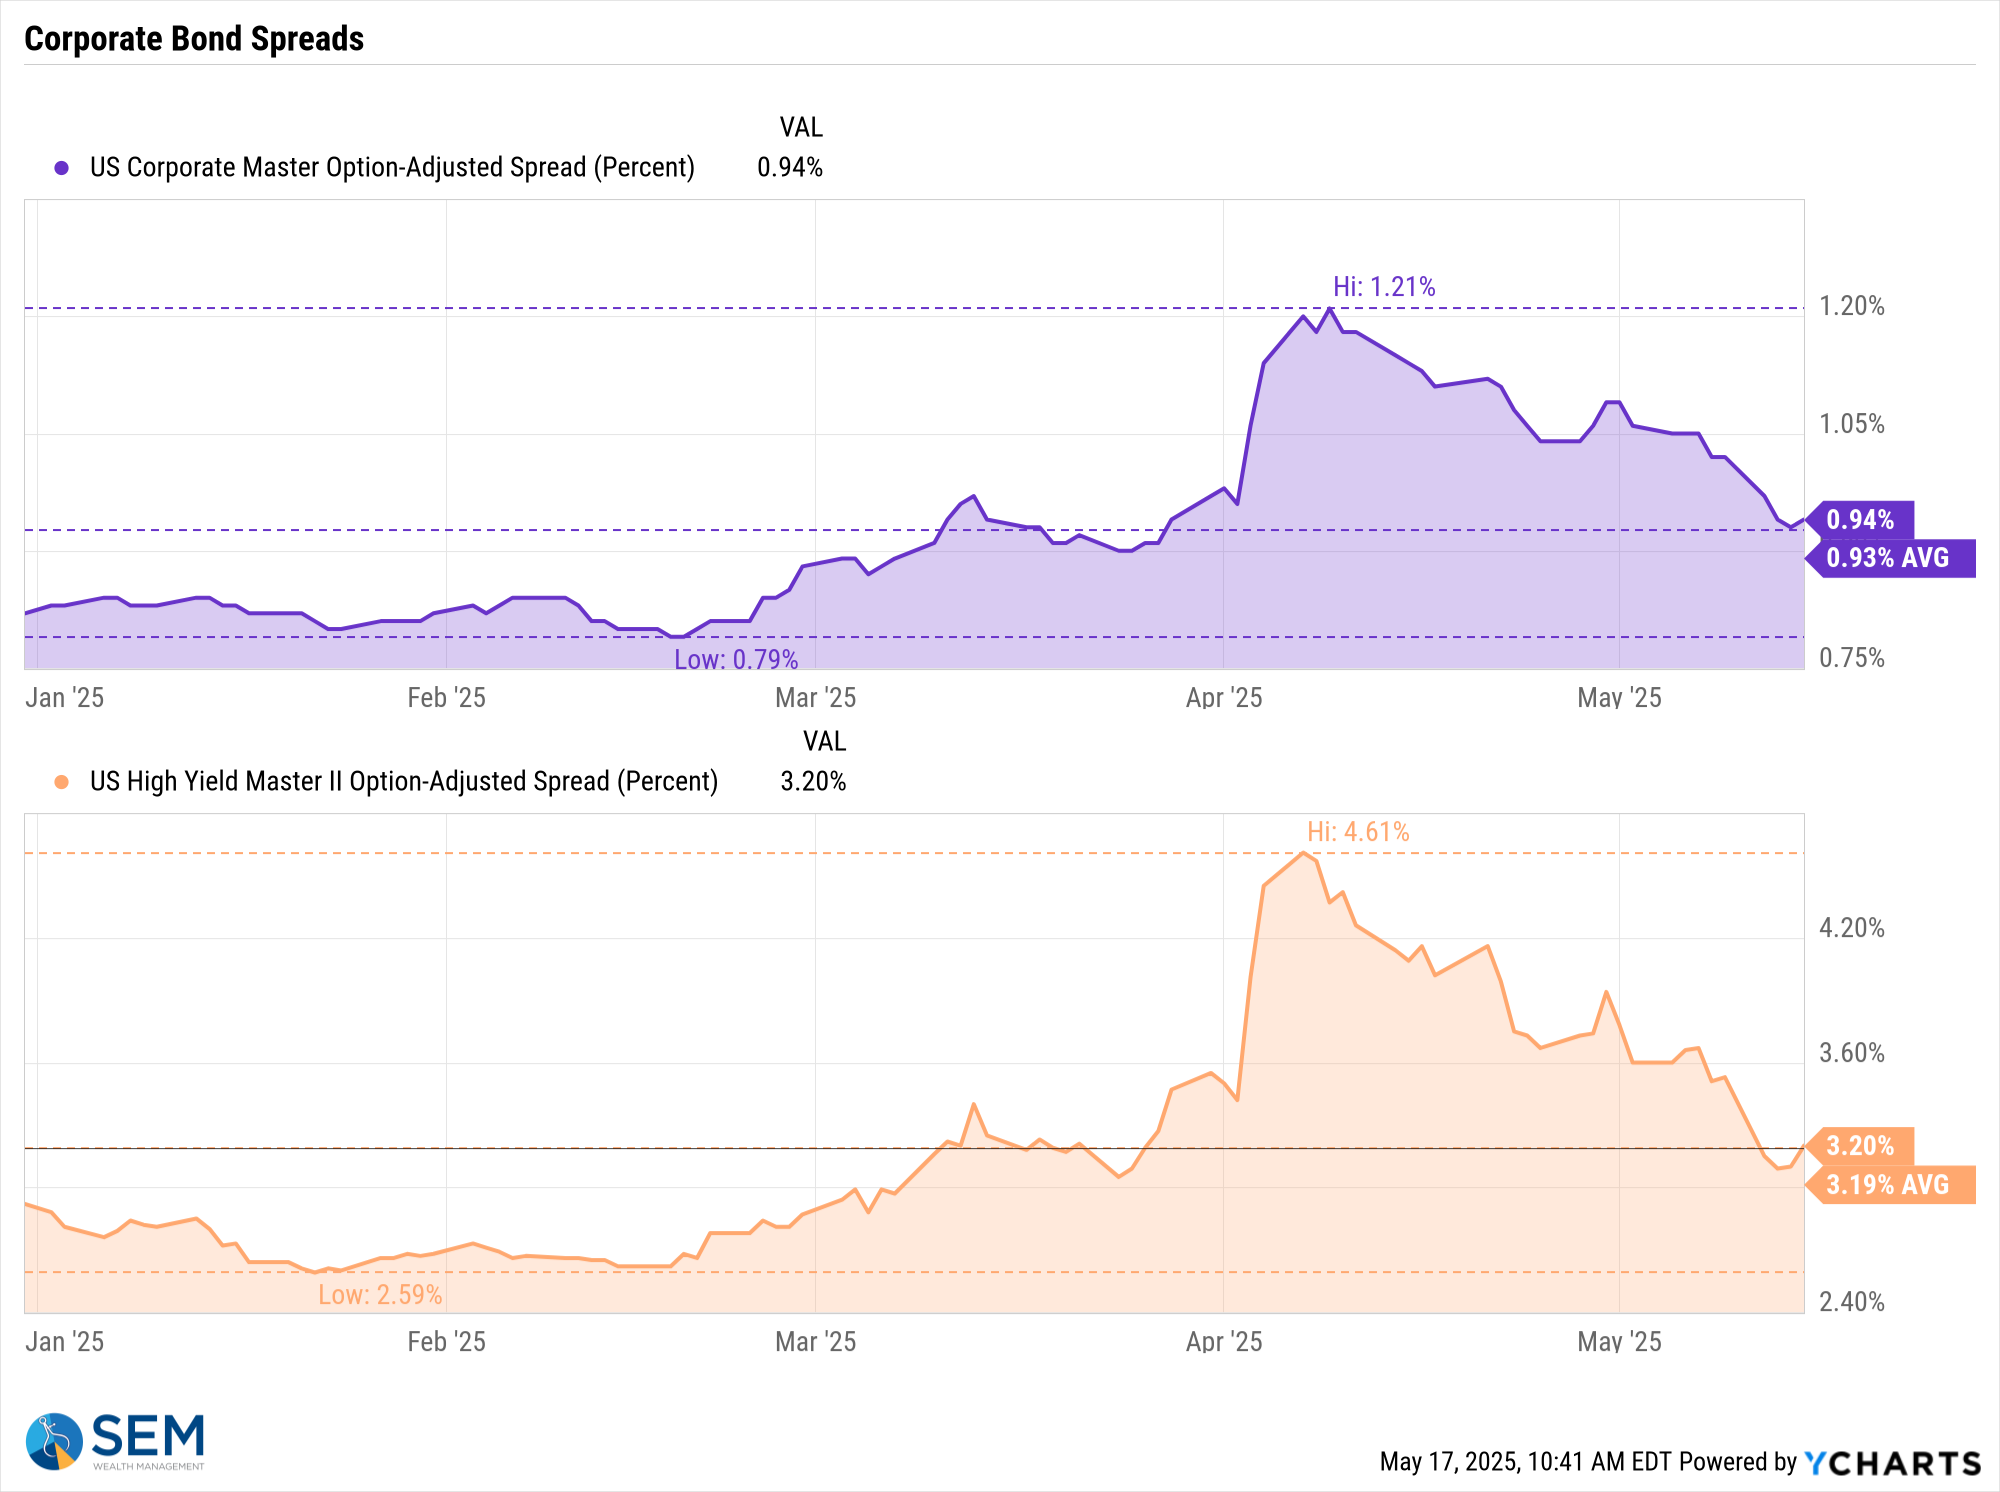
More importantly, credit spreads after spiking in April have come back down near the lows of the last 5 years. It's one thing to have Treasury yields spike, but another to see problems with credit rising to the top of everyone's minds.
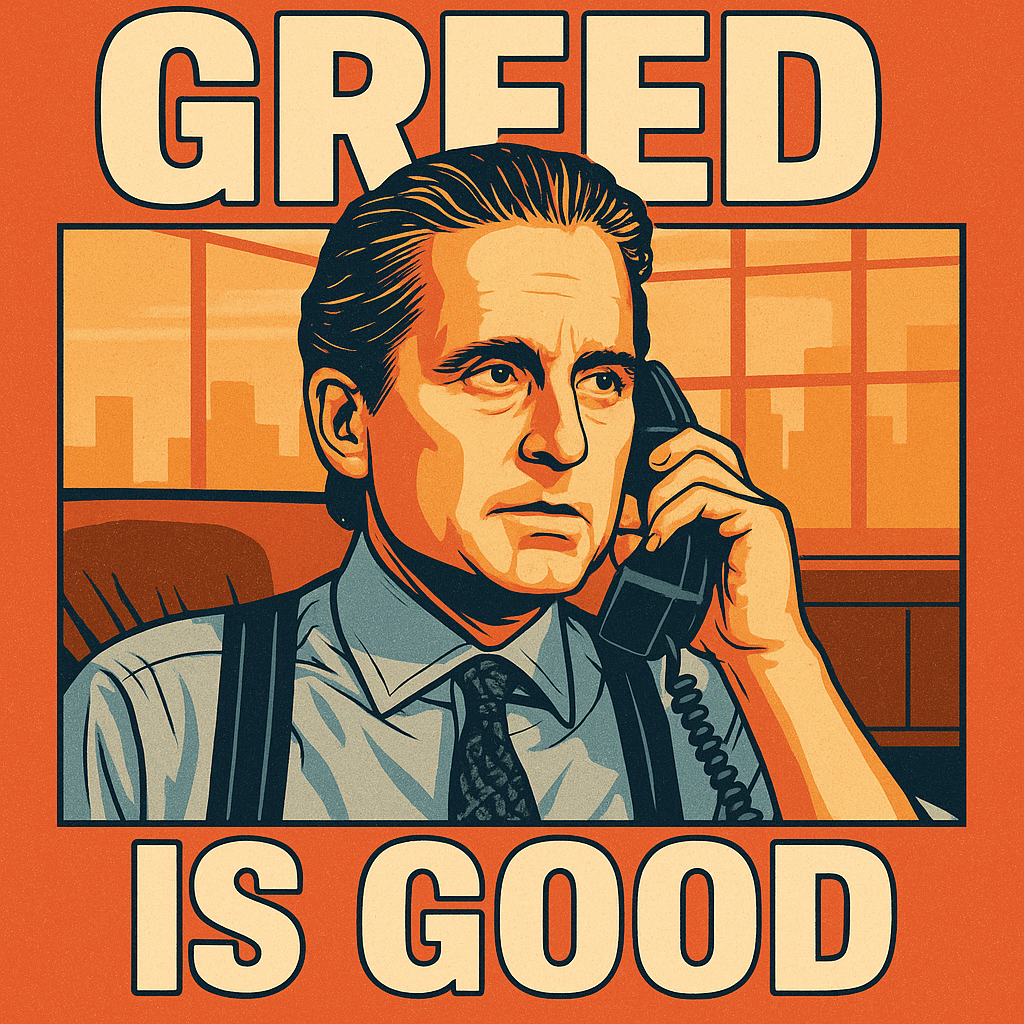
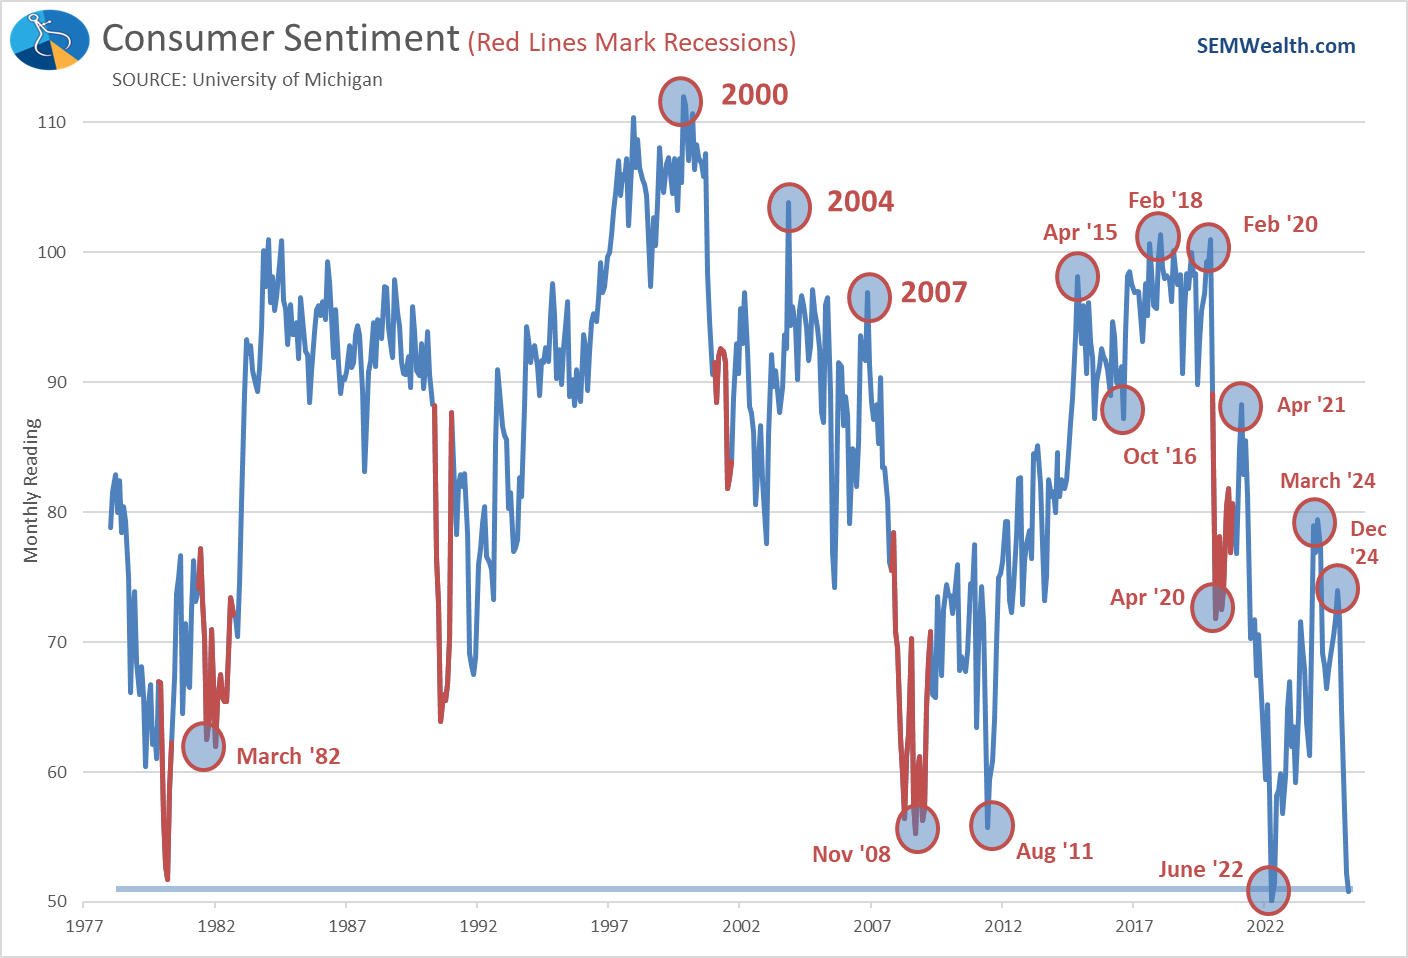
Greed is Good - Sentiment comes roaring back
It's amazing how quickly sentiment turned in April. According to the CNN Fear & Greed Index, we went from "fear" to "greed" in less than one month.
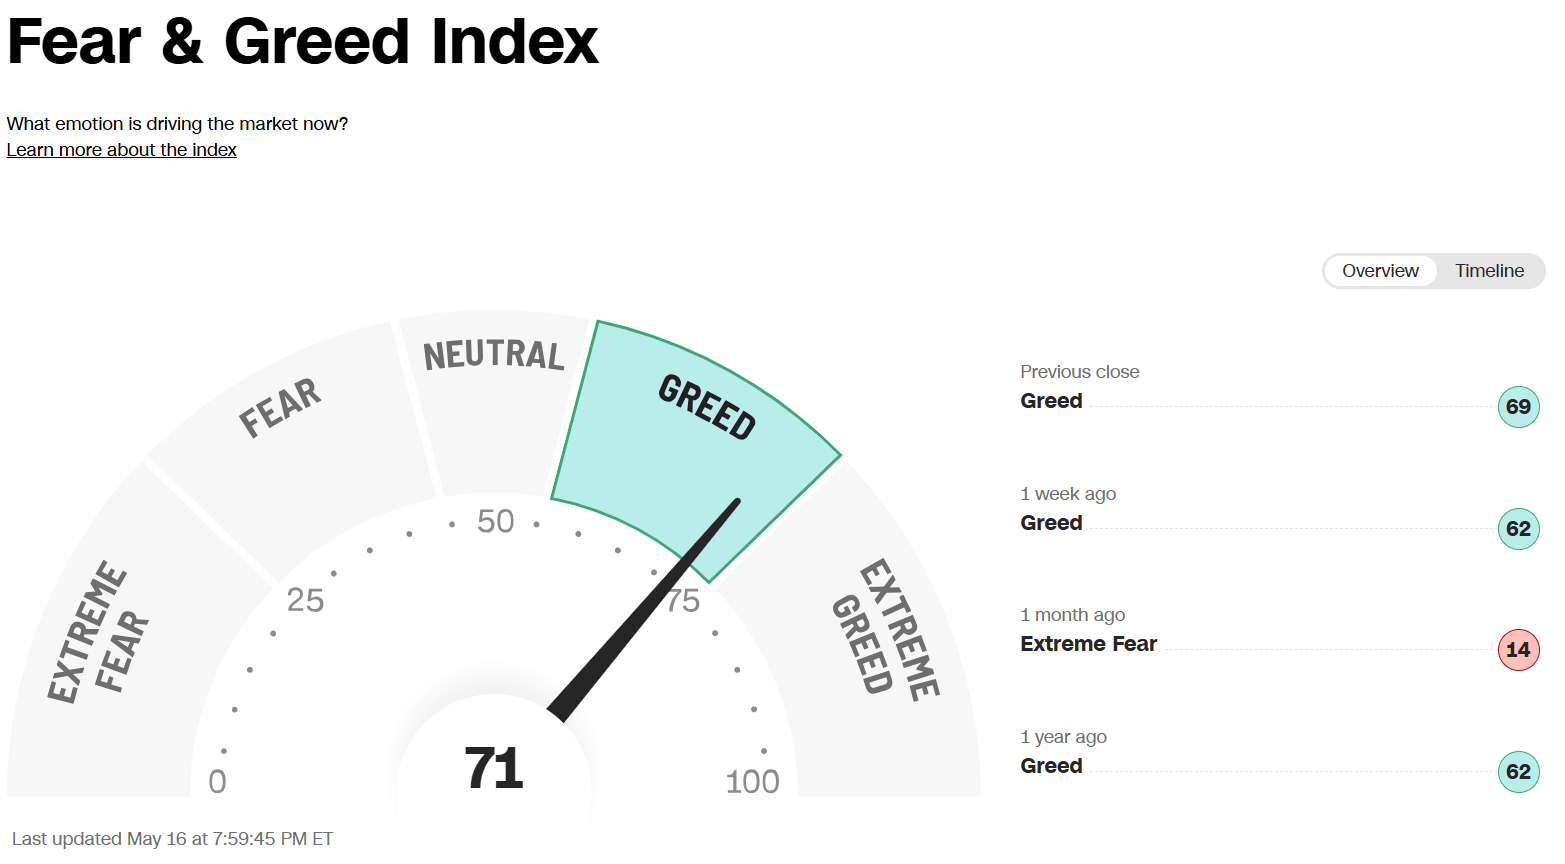
The last time the market was this enthusiastic was just before the election.
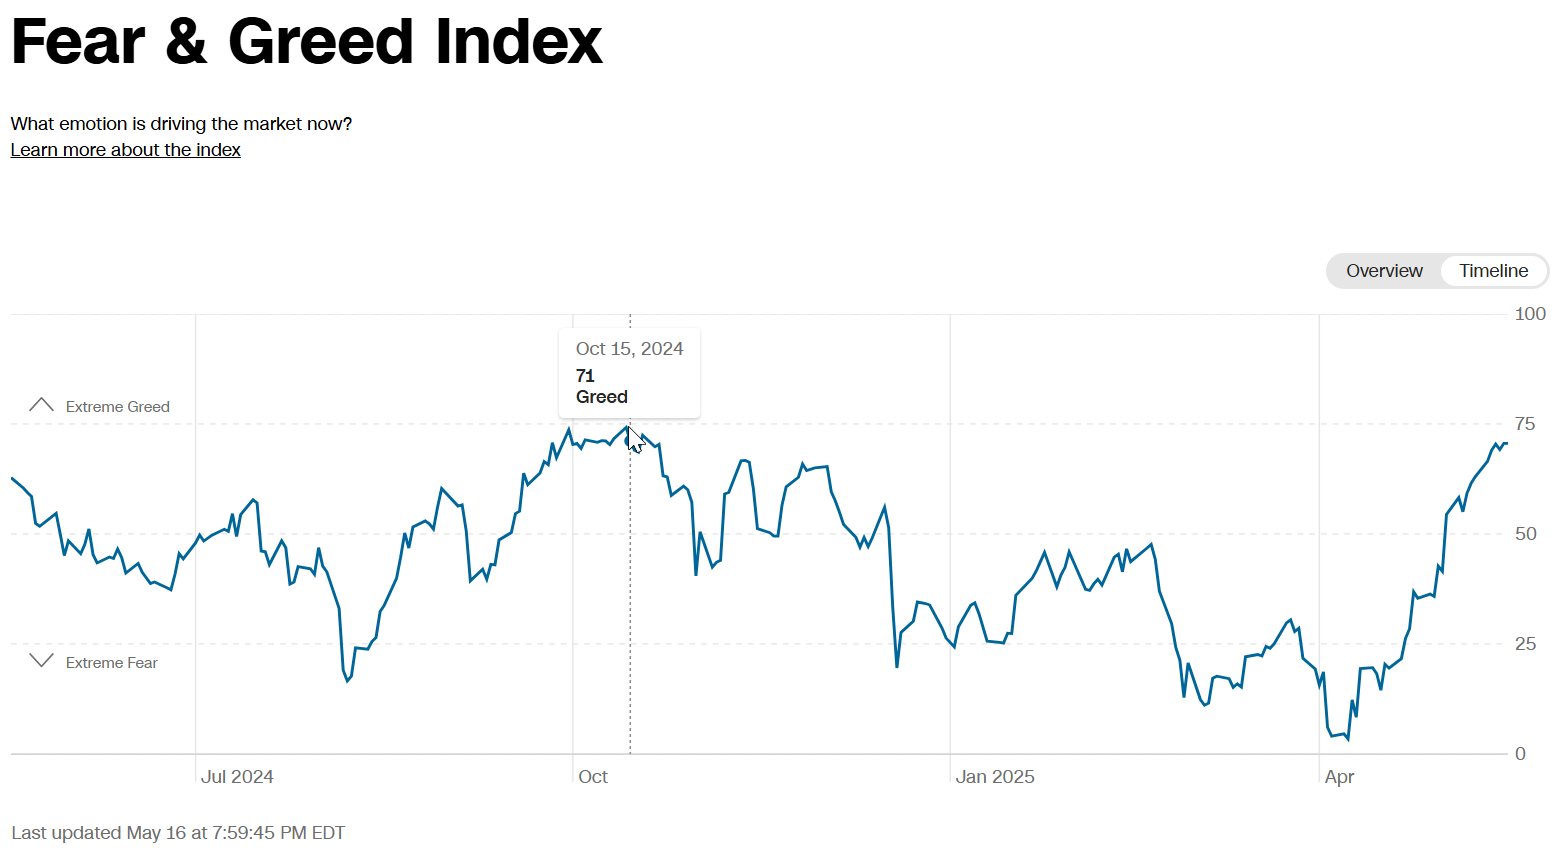
A high "greed" reading doesn't necessarily mean the market will go down, but it does mean it is more susceptible to disappointments. Where that comes from is anybody's guess, but we have to remember the trade war is far from over.
Tariff Markups Coming?
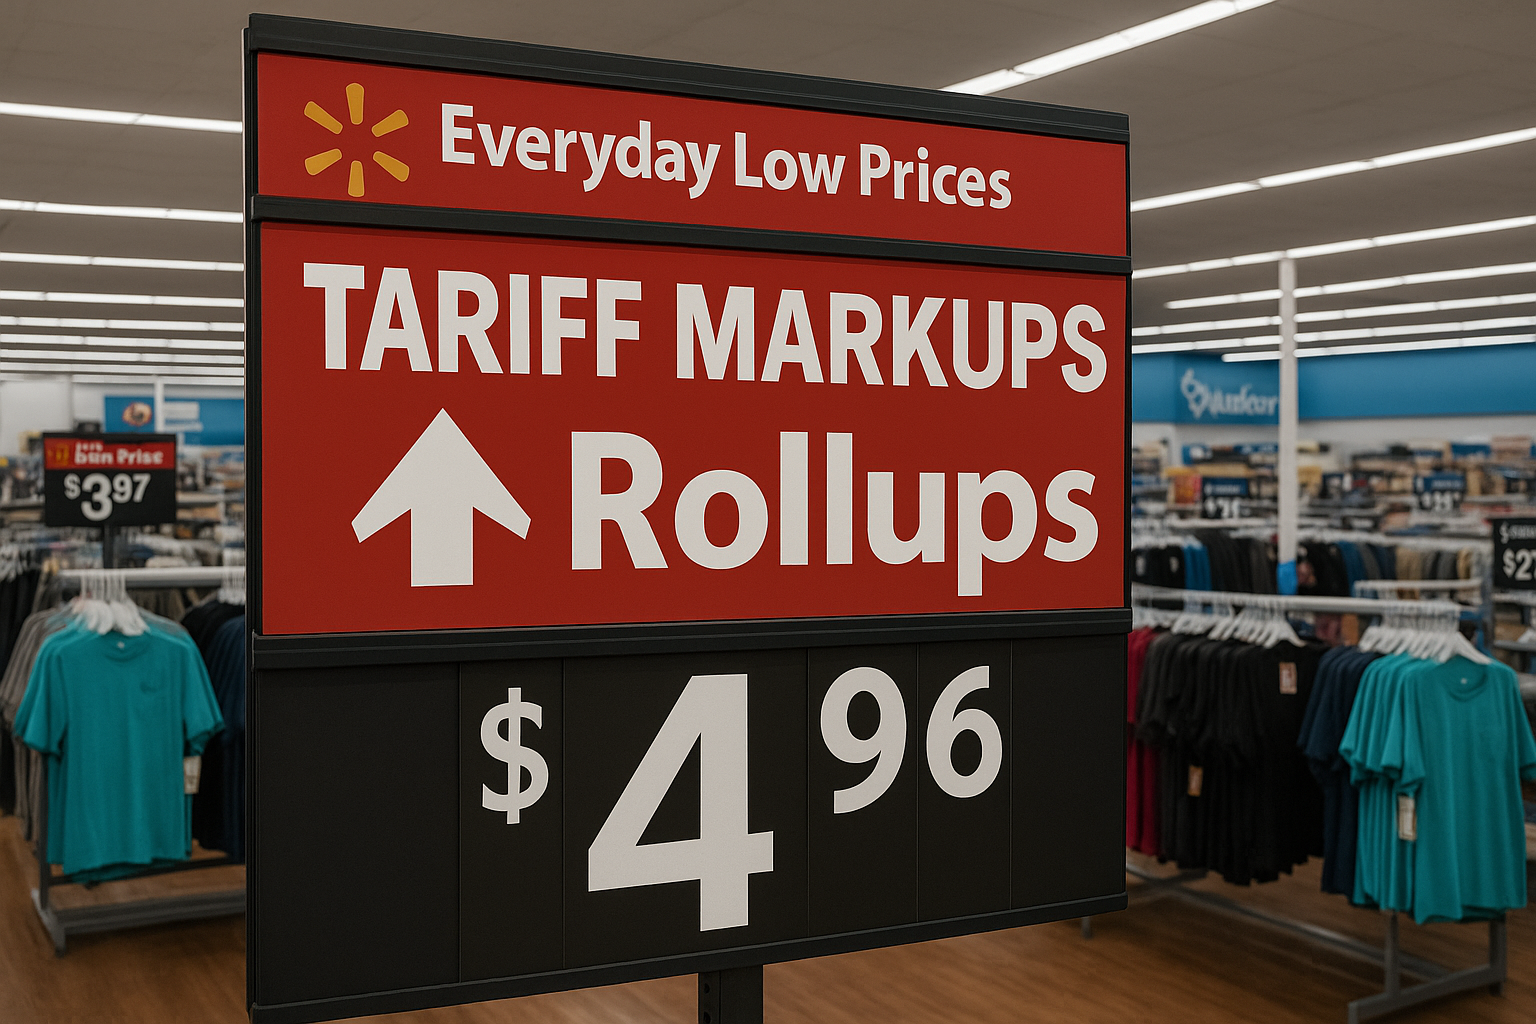
Wal-Mart and Target both warned last week that they are struggling to forecast future sales and earnings due to the trade-war. Wal-Mart also warned they may need to start increasing prices due to tariffs as even the current 30% tariffs on China are too high for them to absorb.
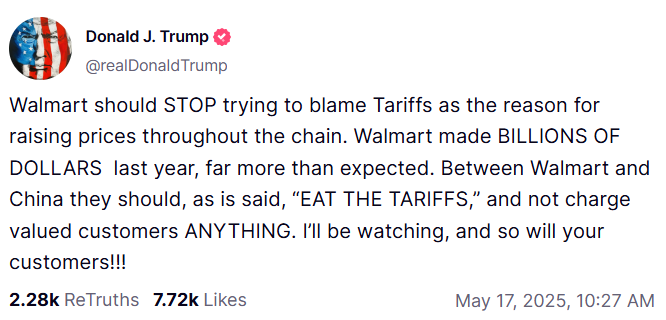
This of course was met swiftly with a rebuke from the President.
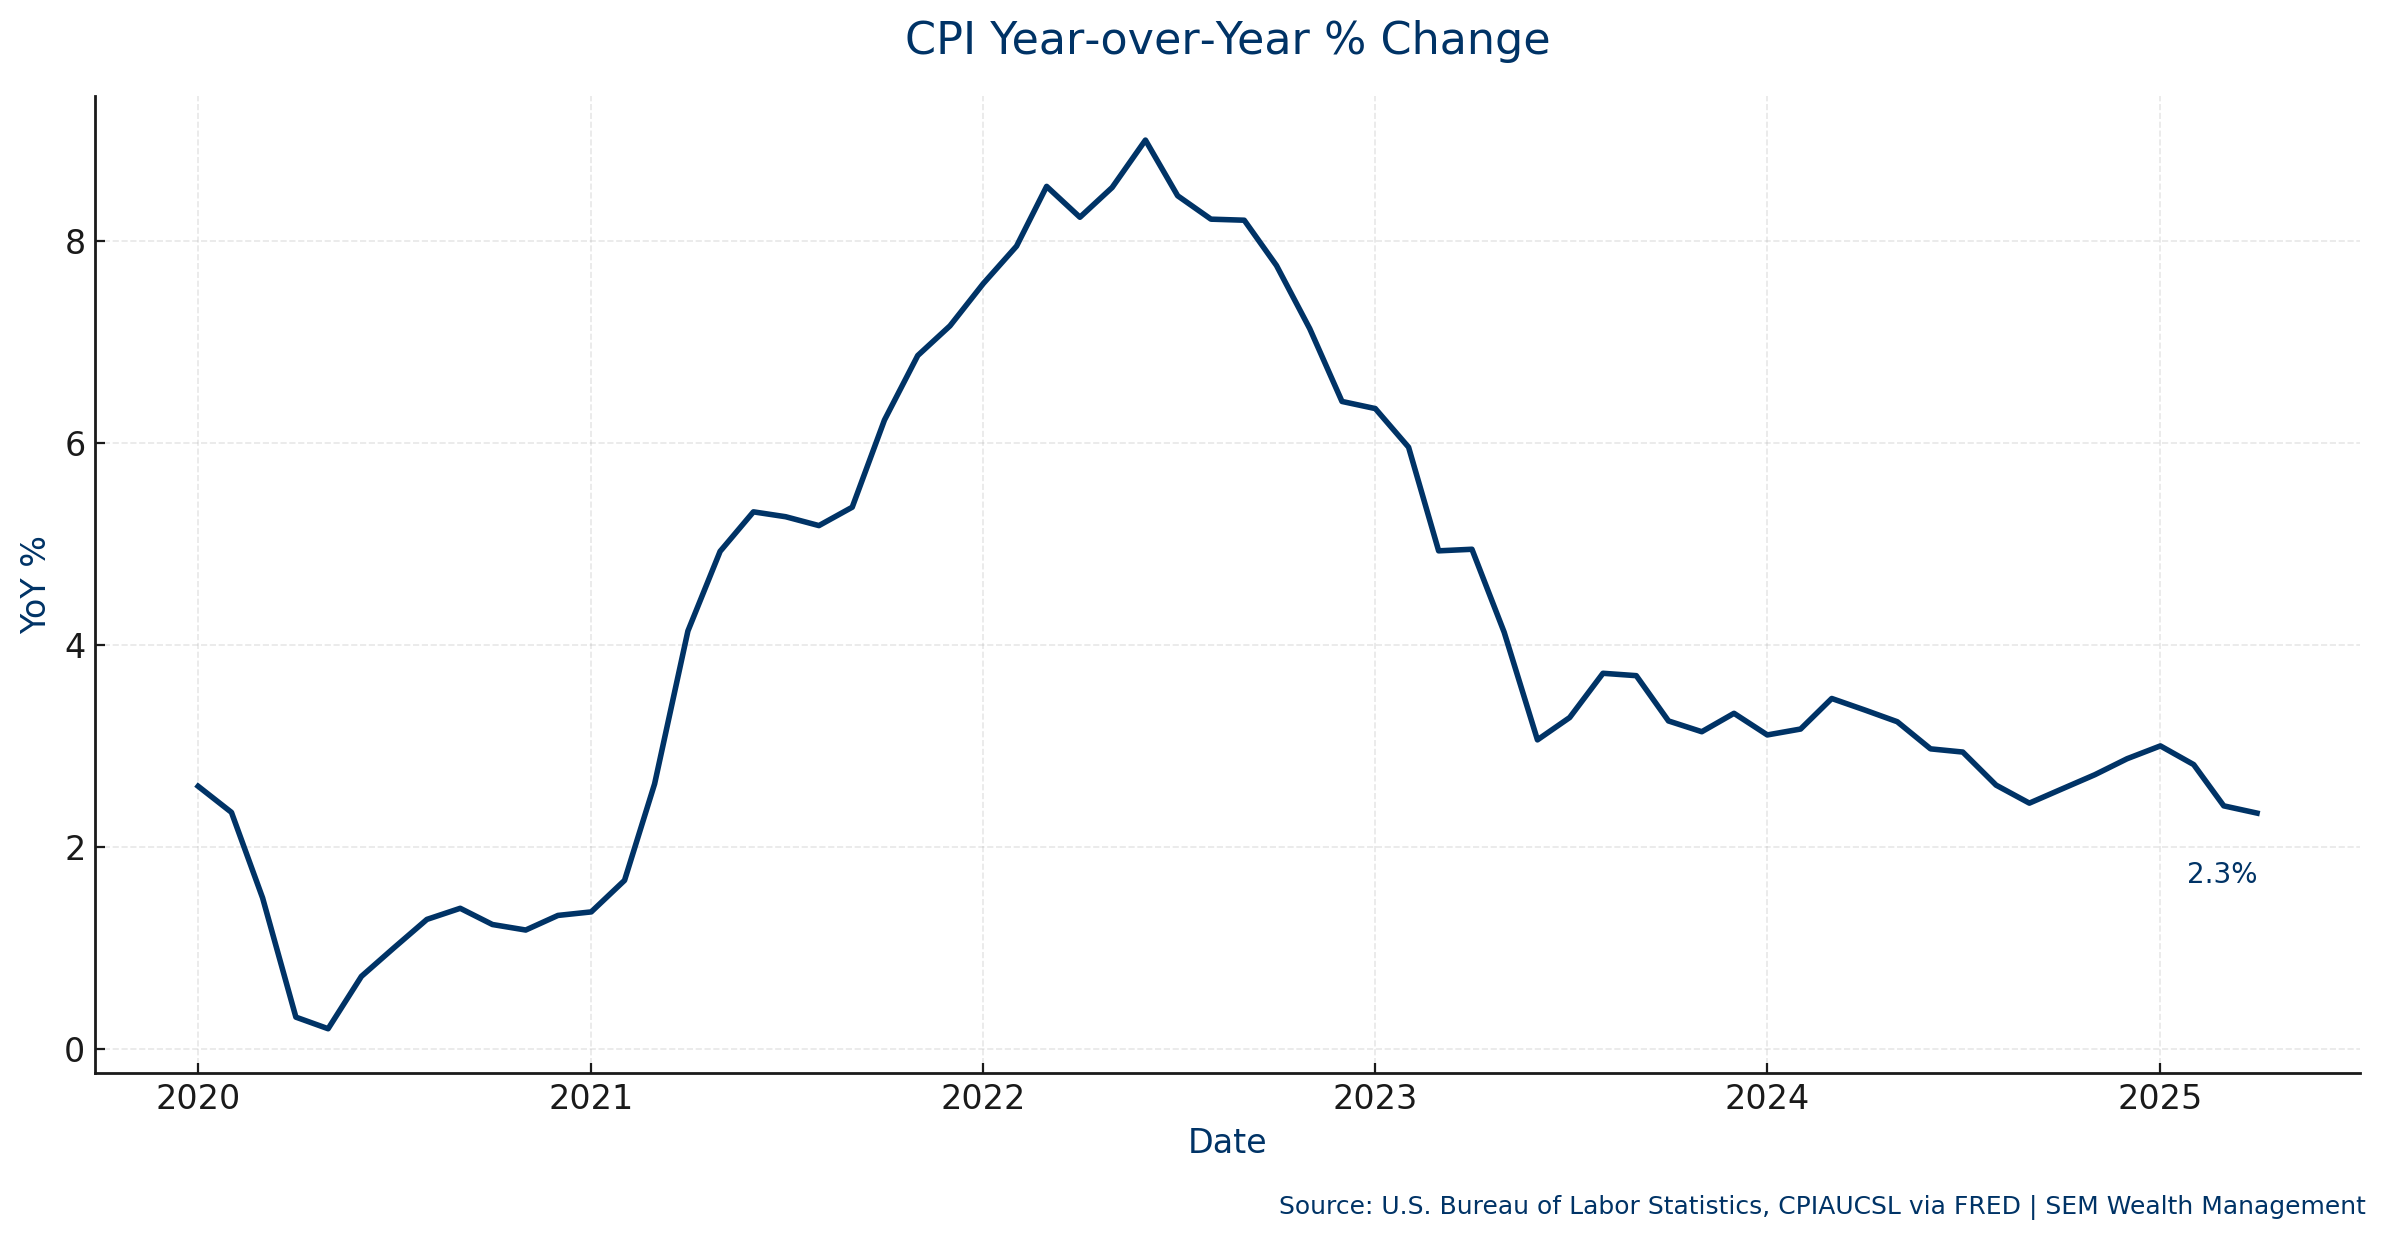
For now, inflation seems to be trending down, based on the latest CPI reading, but that may end as tariffs begin to filter into our stores.
Consumers also are clearly not happy, with what has been happening, even with the rollback of most of the tariffs. We are rapidly approaching the lows of 2022 in terms of sentiment. Most of us remember the lows of 2022 led to two consecutive declines in GDP and a drop of just over 20% for the stock market. I'm not saying that is what comes next, but a deeply pessimistic consumer does not often lead to record S&P 500 profits, which is what is currently expected.
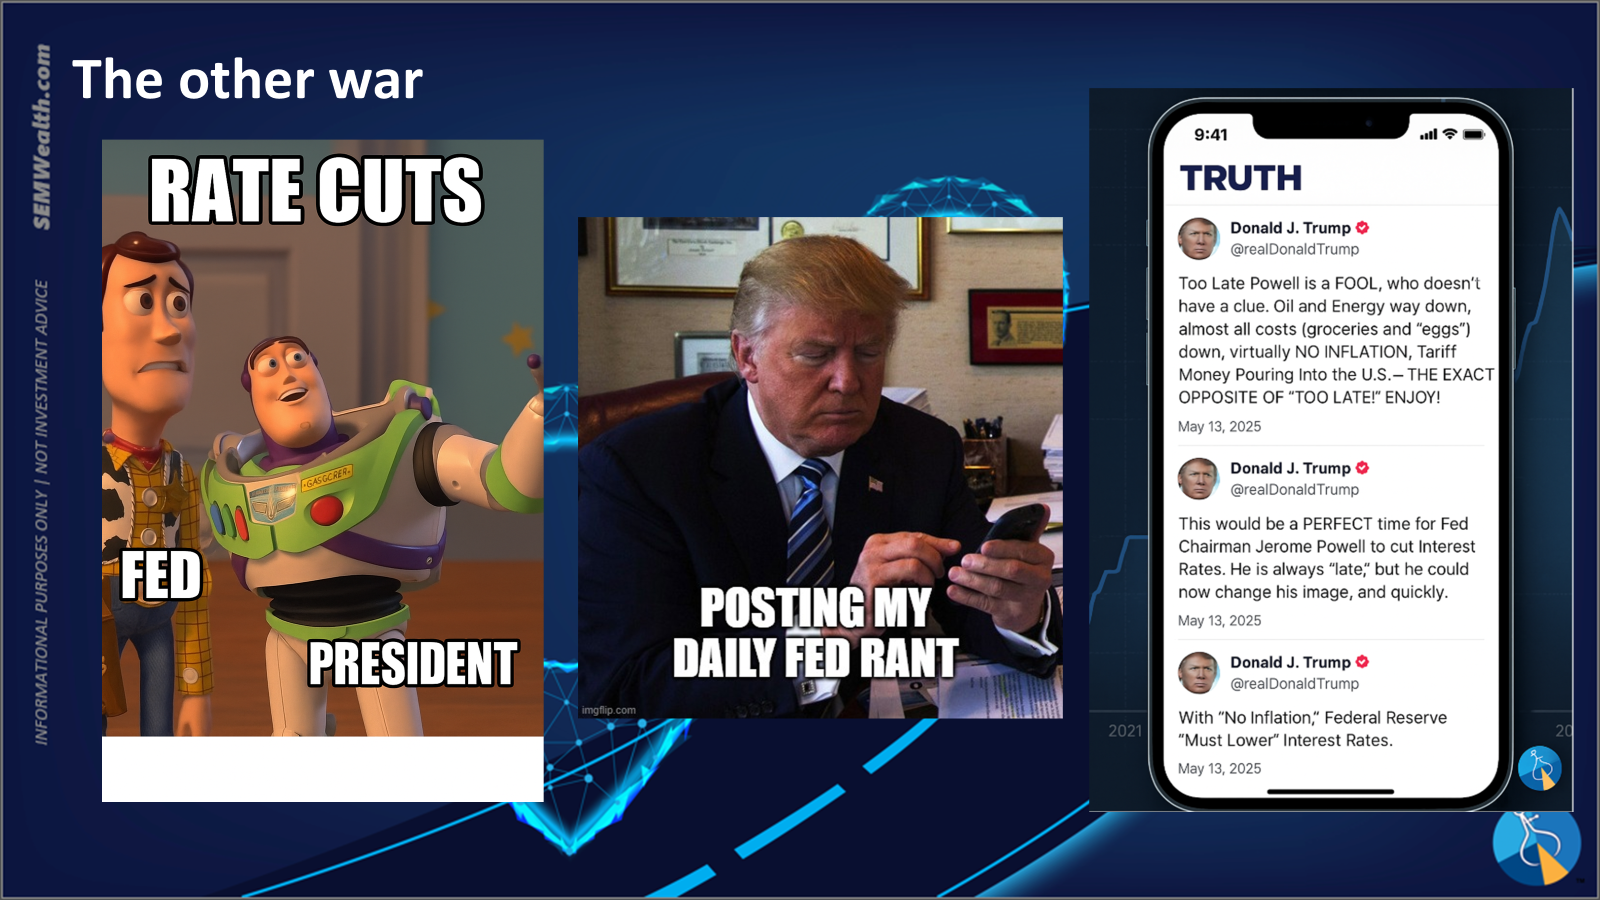
At the same time we saw the on-going (one-sided) feud between Donald Trump and Jerome Powell. I used this slide during an advisor meeting this week and it is something that could boil up and be a net negative for the market.
The chart fireworks above are all focused on the short-term. John Mauldin’s latest newsletters offer a zoomed out look to an 80- to 90-year institutional cycle (Friedman) overlapped with Strauss & Howe’s generation-driven Crisis cycle. Spoiler: all models say we’re knee-deep in the “Crisis / Instability” phase—and won’t exit until new institutions rise from the rubble. This WILL NOT be a smooth or easy process.
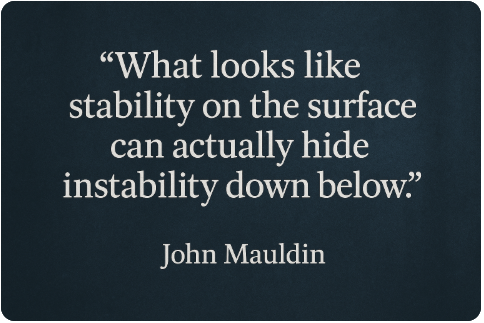
Mauldin Watch – Reading the Sandpiles Beneath the Rally
Our long-time readers know that I have always been a fan of John Mauldin and his ability to look past the short-term noise and identify the deeper issues which could impact long-term investors. He has a vast network of economic, political, and market experts. Often he dives into the inner-workings of the markets which most of us do not understand. Given the shift to overwhelming "greed" again in the market, I thought it would be pertinent to check in with Mr. Mauldin as his last 3 weekly newsletters focused more on the big picture rather than the enthusiastic and triumphant rise back above the election day levels in the market.
Soft Data Screams Before Hard Data Whispers
Just days before 10-year Treasury yields began their 36 basis point spike from 4.17% to a high of 4.53%,, Mauldin dissected a shift few people were talking about—the collapse in the Dallas Fed Business Outlook surveys. Manufacturing’s headline activity index cratered to –35.8, a level we hadn’t seen since the COVID shutdown, and services followed to –19.4. What caught his eye were the free-text comments: “Orders went to zero overnight,” “Customers won’t sign until tariff numbers settle,” and “We lost 64 % of container bookings in a week.”
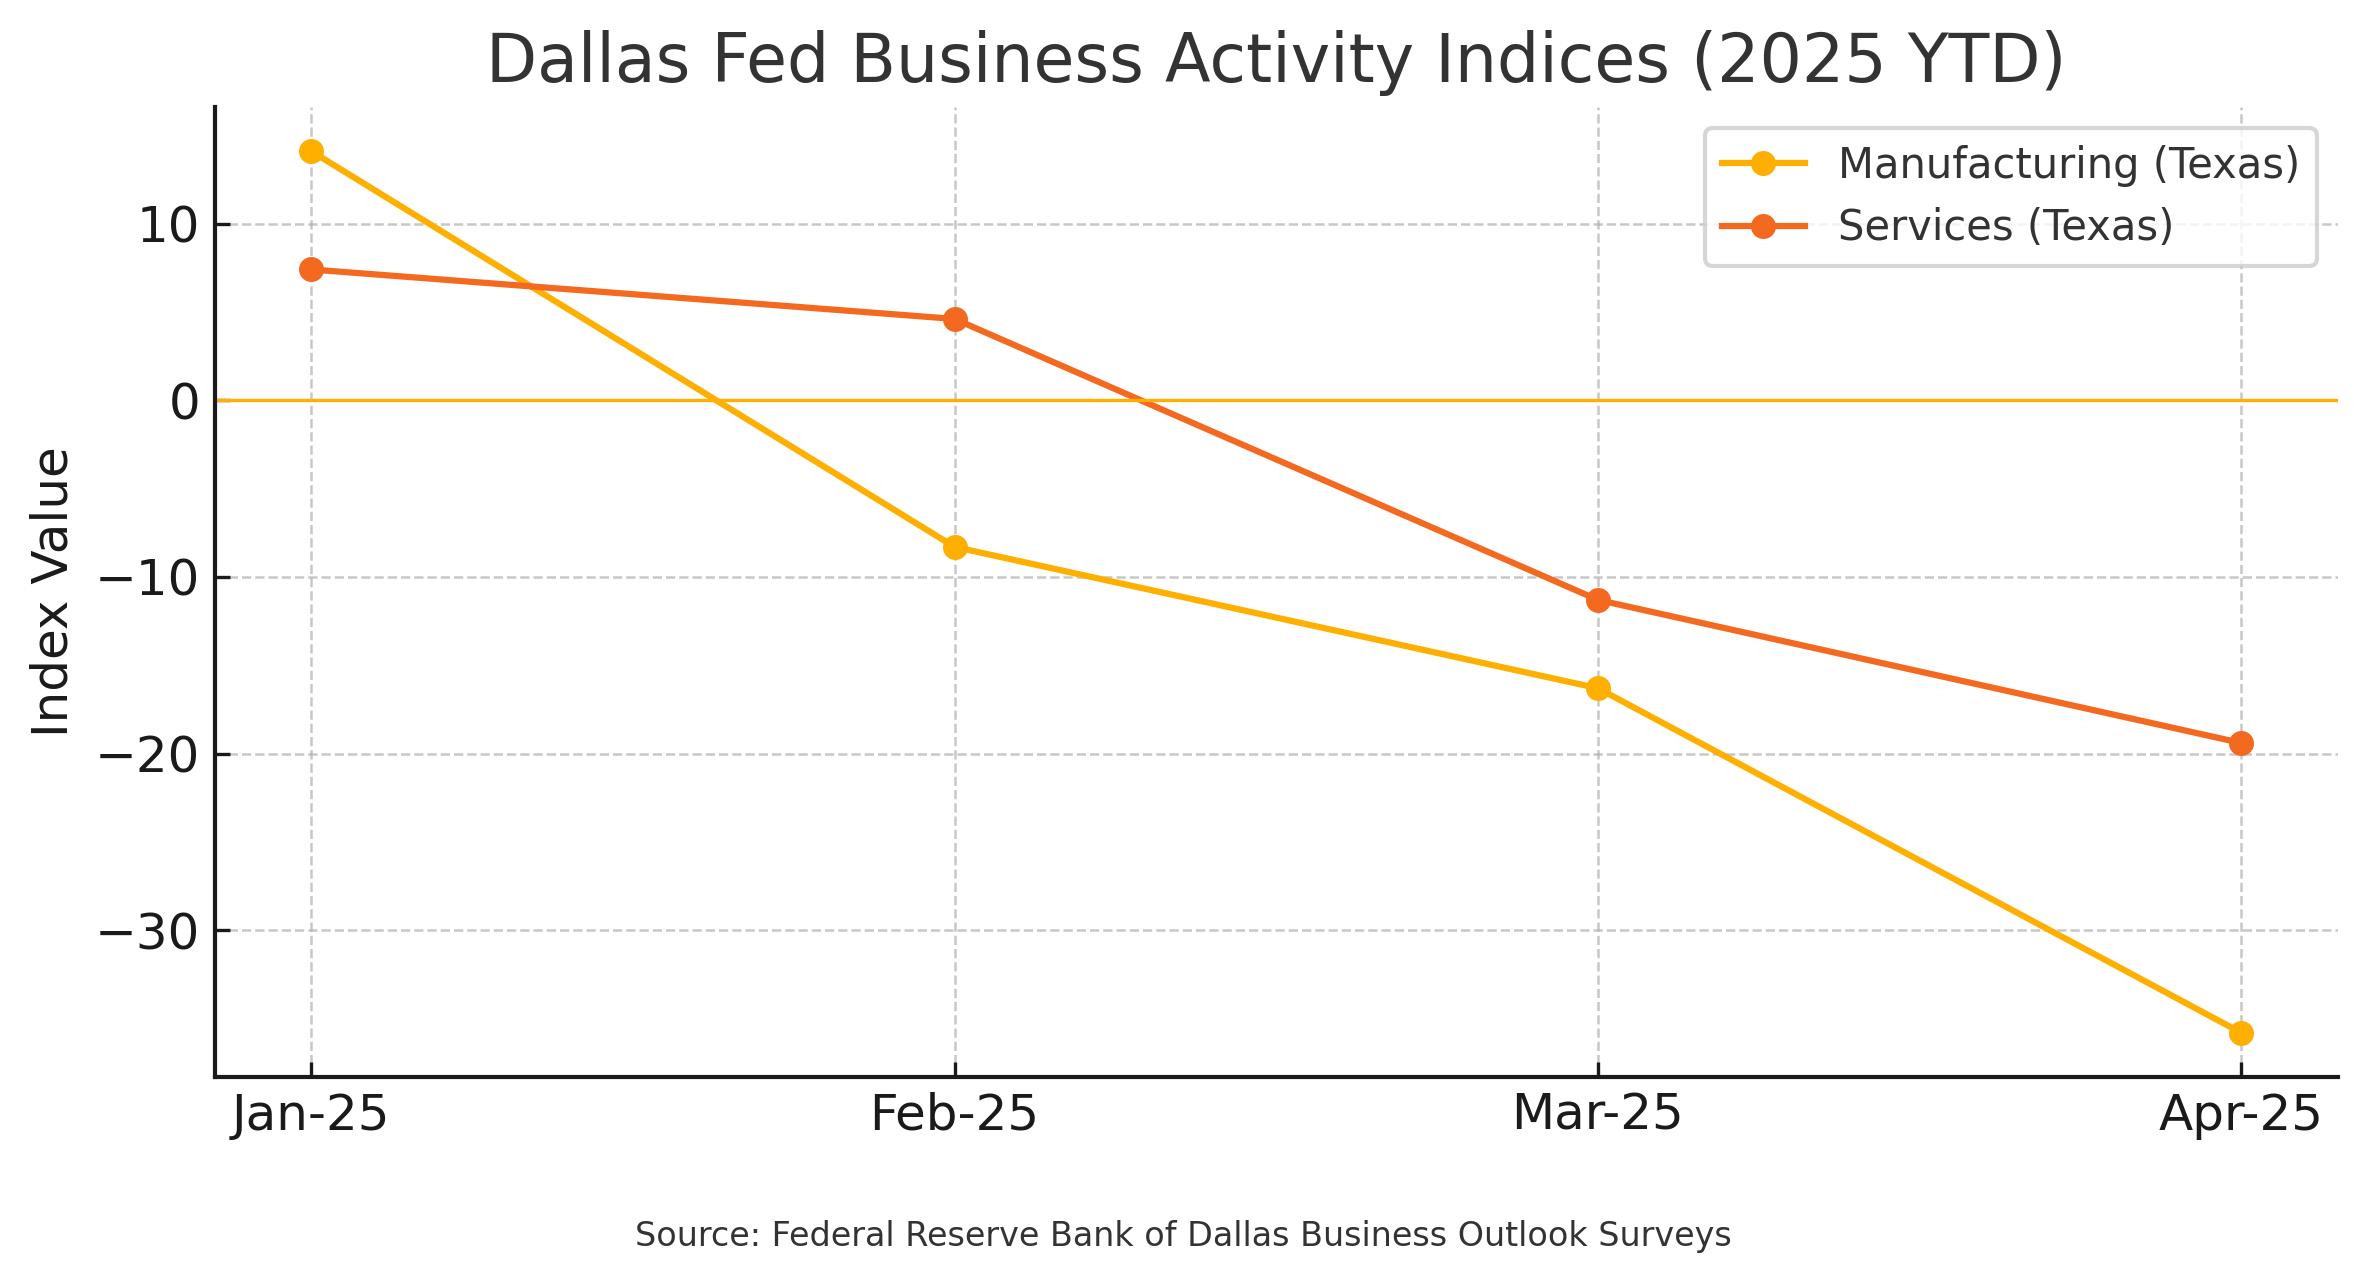
The Dallas Fed survey is thought to be an important bellwether for the President's policies as it covers both "oil (and gas) country" as well as the fastest growing state for businesses. Mauldin connects that sudden stop directly to the administration’s ever escalating Chinese tariffs (which at 30% are still high). CFOs are locking up CapEx and procurement teams are double-ordering to front-run price hikes. History says that kind of uncertainty eventually bleeds through to payrolls with a two- to three-quarter lag, precisely when the market is busy celebrating new index highs.
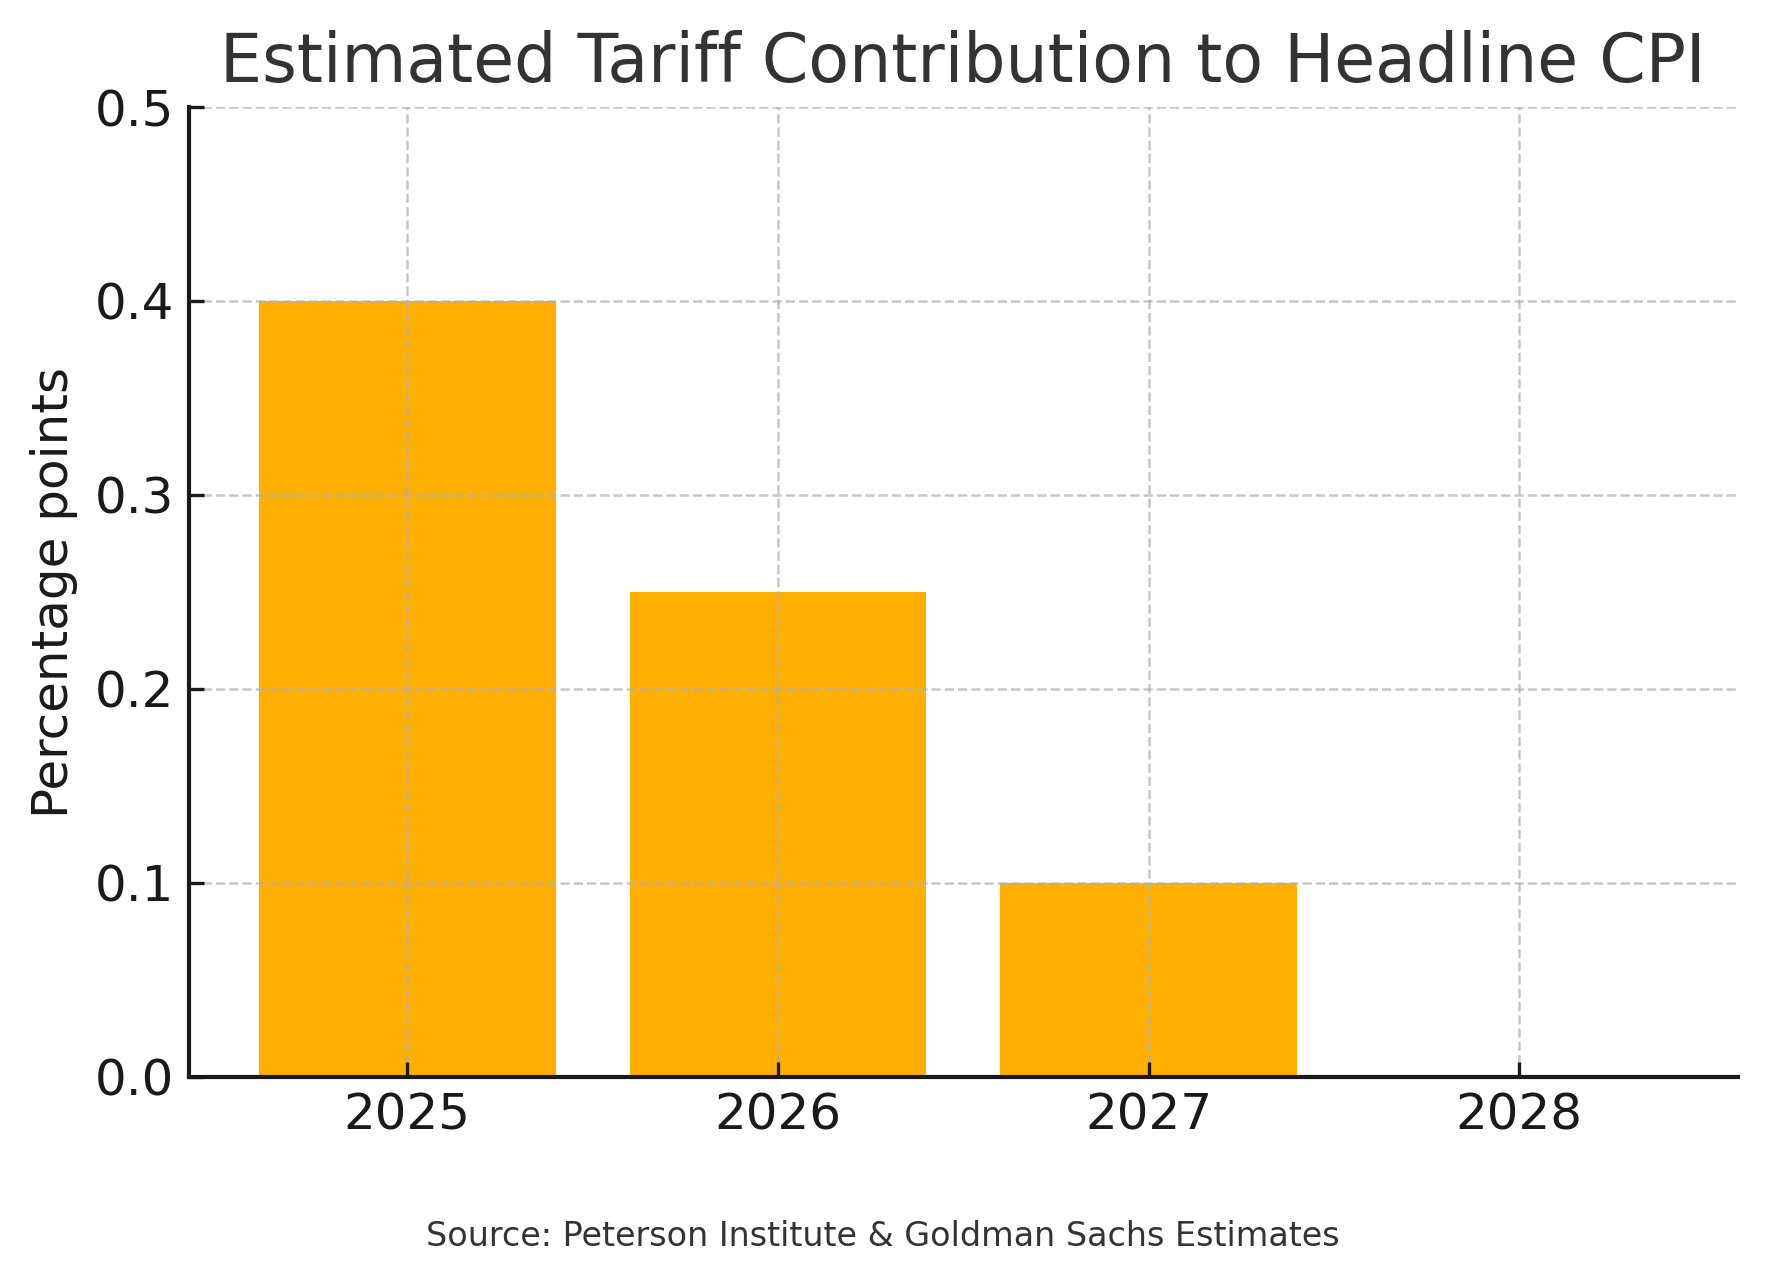
He quantifies the hit using outside work from Peterson and Goldman: the tariff schedule alone could tack +0.40 percentage-points onto headline CPI in 2025—and +0.25 pp in 2026—before fading. That may not sound like much, but it’s roughly the entire gap between 2 % and the Fed’s comfort ceiling. In other words, tariffs could be what keeps Jerome Powell from cutting rates even if growth stalls.
Why “Impossible Things” Keep Happening
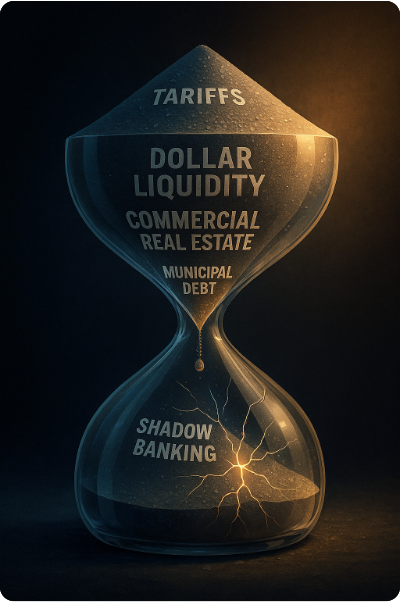
Rates aren’t supposed to behave like meme-stocks—yet they did. Mauldin opens with the startling reality that the long-bond yield vaulted 40 basis-points in five trading sessions (April 4-11), something the Street’s VaR (Values at Risk) models assign to the tenth decimal place of improbability. He leans on Didier Sornette’s sandpile research to explain why markets periodically deliver “fat-tail” moves even with no obvious catalyst. The pile looks stable right up until the grain that triggers the slide—and global dollar funding is the biggest grain in history.
What’s a “sandpile” anyway?
Imagine dropping grains of sand onto a table. At first they stack up neatly, then the slope gets steeper, and suddenly one extra grain sends a whole wedge sliding off. That last grain wasn’t special—it just happened to land when the pile was already at a critical angle. Mauldin says markets work the same way: years of easy money and leverage let “grains” like dollar swaps, shadow-bank loans, or Treasury basis trades pile higher and higher. We can’t predict which specific stress—liquidity pinch, tariff shock, policy misstep—will be the final grain, only that the bigger the pile, the bigger the eventual slide. His point: don’t obsess over spotting that single grain; focus on measuring how tall and unstable the pile has grown.
Under the hood, there’s an estimated $60 trillion in non-U.S. dollar liabilities (euro-currency loans, cross-currency basis swaps, synthetic repos) that must roll almost continuously. A modest squeeze—say, a 25-bp widening in interest rate spreads—forces leveraged players to dump the safest collateral they own: Treasuries. That’s how we land a five-sigma week without a macro data shock.
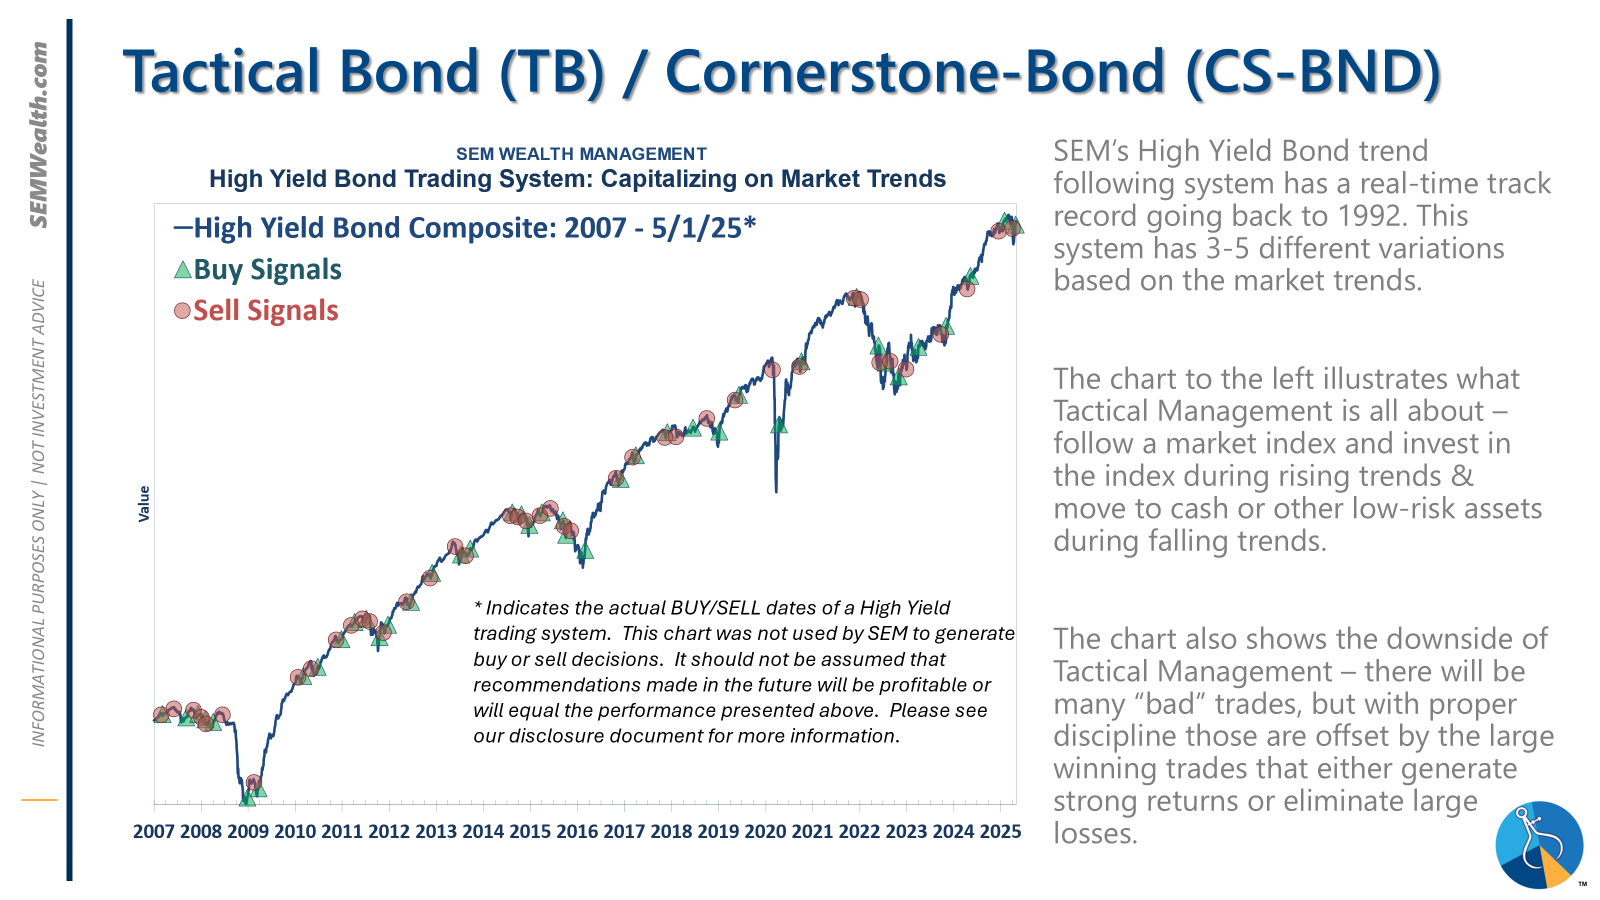
For advisors, the message is not to predict the next grain but to respect the pile. For fixed income investors, our Tactical Bond model (as well as Income Allocator and Tax Advantage Bond) already limits duration and other risks when they expand beyond our risk levels (which measure standard deviations to adjust to the current market environment); the past month is an example as to why this could happen. We sold quickly when rates spiked and jumped back in when things stabilized (for now). A client holding “safe” bond funds or ETFs still needs to understand they’re sitting on risks that can bite back sometimes faster than equities.
Mauldin leaves us with a challenge: “The question isn’t whether the pile will slide—only whether you’ve positioned portfolios to ride the slide without panicking.” That sets the stage for the economic cracks showing up in real-time surveys.
How We (Really) Got Here
For the finale, Mauldin hands the "mic" to geopolitical strategist George Friedman, who zooms out a full generation. Friedman argues the U.S. is simultaneously closing two long cycles—an 80-year institutional cycle that began with WWII and a 50-year socio-economic cycle that started in the 1970s. When two cycles end together, you get turbulence: political polarization, policy whiplash, and yes, tariff shock therapy.
A core plank of Friedman’s thesis is that the Cold-War security model died in Ukraine. Russia’s conventional forces cannot threaten Western Europe; China depends on U.S.-policed sea-lanes it cannot yet replace. With military deterrence essentially uncontested, Washington no longer needs perpetual trade deficits to buy allies. That turns the unthinkable—double-digit tariffs—into a rational strategy to reboot domestic capacity and, by extension, social cohesion.
He lays out three imperatives for the next decade:
- Defuse the culture war. The social fabric frays when real wages stagnate; reshoring is meant to fix that.
- Modernize the economy. Supply chains optimized for cost now re-optimize for resilience; think chips, EVs, critical minerals.
- Rebuild institutions. From the Fed’s dual mandate to the way Congress budgets, 20th-century frameworks are creaking under 21st-century realities.
Understanding Friedman's Cycles:
Here's a graphic illustrating the two cycles discussed by Mr. Friedman.
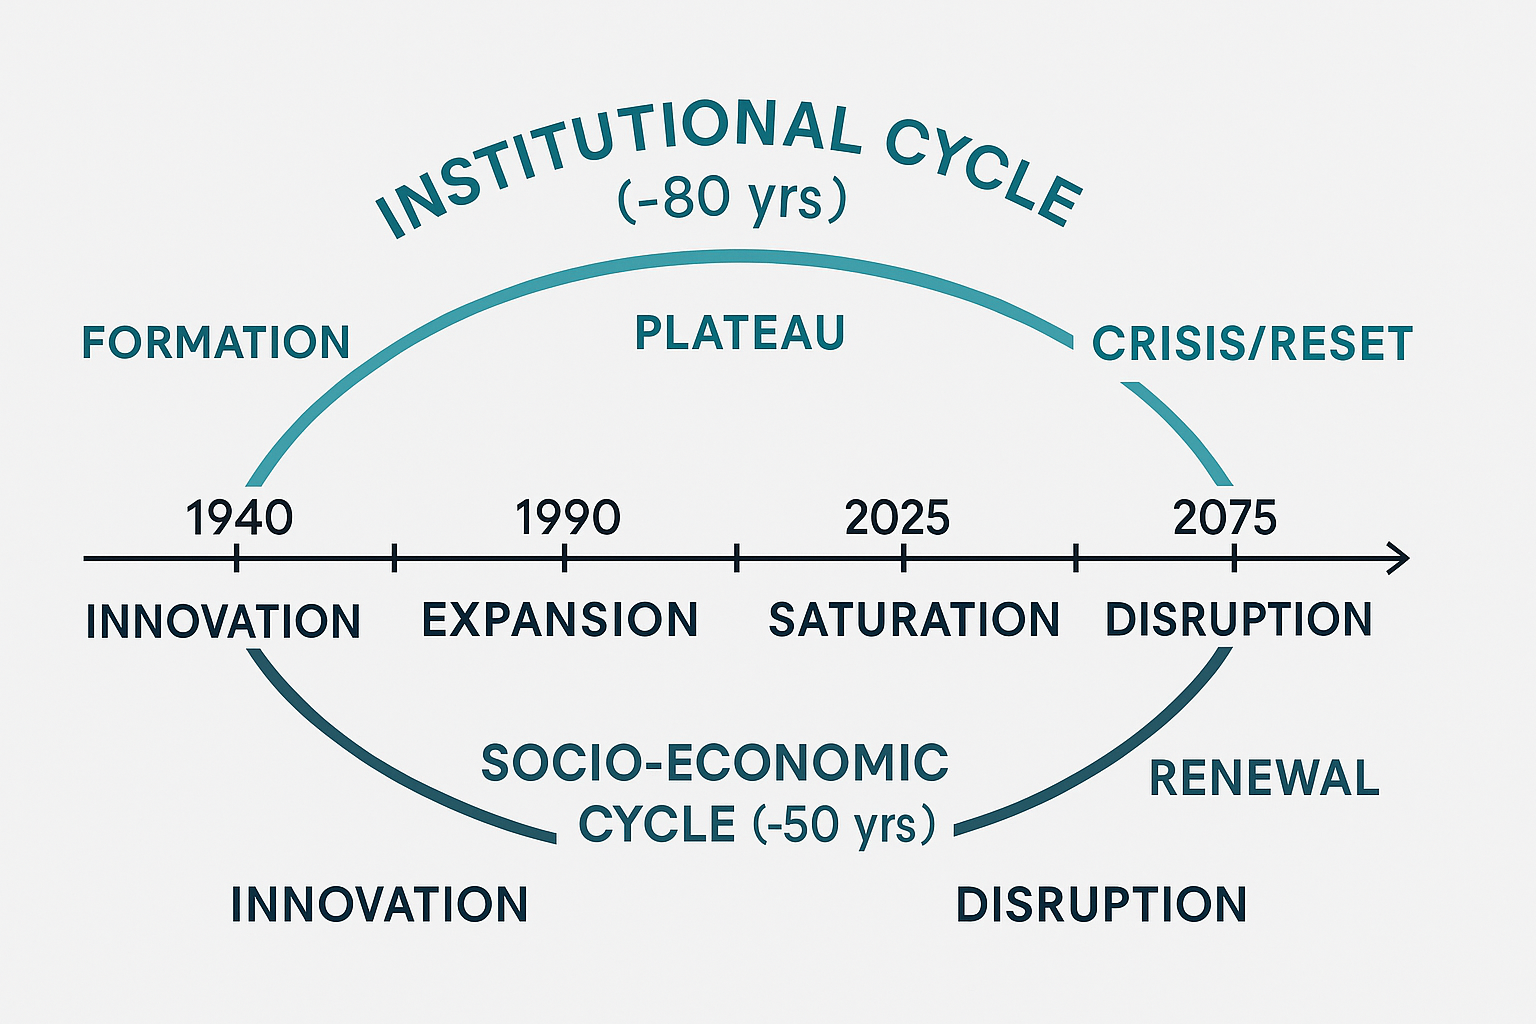
- Institutional Cycle (~80 yrs) – Arches across the top. Starts with Formation (post-WWII institutions), cruises through Expansion and Plateau, and now bends into the Crisis/Reset arc that Friedman says is underway.
- Socio-Economic Cycle (~50 yrs) – Arches below the timeline. Follows the pattern of Innovation → Expansion → Saturation → Disruption → Renewal.
- Both cycles converge in the 1990-2025 window—precisely where Mauldin and Friedman put today’s turbulence. The overlap helps explain why “normal” policy fixes feel ineffective: multiple systems are peaking at once.
Long-time readers know we’ve tracked the 80- to 90-year social (or generational) cycle for more than a decade. Friedman’s 80-year institutional cycle and his 50-year socio-economic reset both land in the “crisis” phase of that pattern. The danger is that we treat today’s headlines as a straight, black-and-white story—because that’s what most of us have experienced. Cycles remind us the storyline can bend sharply: what has always felt “normal” can unravel into something no one alive has ever faced.
Our takeaway: volatility isn’t a bug, it’s the operating system of big transitions. That’s why SEM’s behavioral risk framework is built to keep clients out of all-or-nothing bets on how the cycle resolves. We’ll take what the market gives, but always with a hand on the risk dial.
Quantitative, price-and-volume signals—not headline narratives—let us move fast and without emotion. In a world that suddenly stops behaving linearly, that discipline is the edge.
Final Thought
Markets love climbing walls of worry—but don’t forget to check the structural integrity of the ladder. Tariffs, tweets, and tech euphoria can all move price today, yet the slow-grinding cycles Mauldin highlights will set the playing field for the next decade.
See you next week—same bat-time, same bat-channel. Until then, keep your rally cap handy with your risk buckets at the ready.
SEM Model Positioning
Tactical Bond, Cornerstone Bond, and Income Allocator jumped back to buy signals on 4/24. At least according to the data, we are in a "wait and see" mode.
-Tactical High Yield sold high yield bonds on 4/3/25 after 9 weeks in these funds. These models bought back in on 4/24. All proceeds were moved to money market or short-term bonds, with a yield around 4.1% in money markets.
-Dynamic Models are 'neutral' as of 6/7/24, reversing the half 'bearish' signal from 5/3/2024. The interest rate model remains partially 'bullish' (long Treasuries).
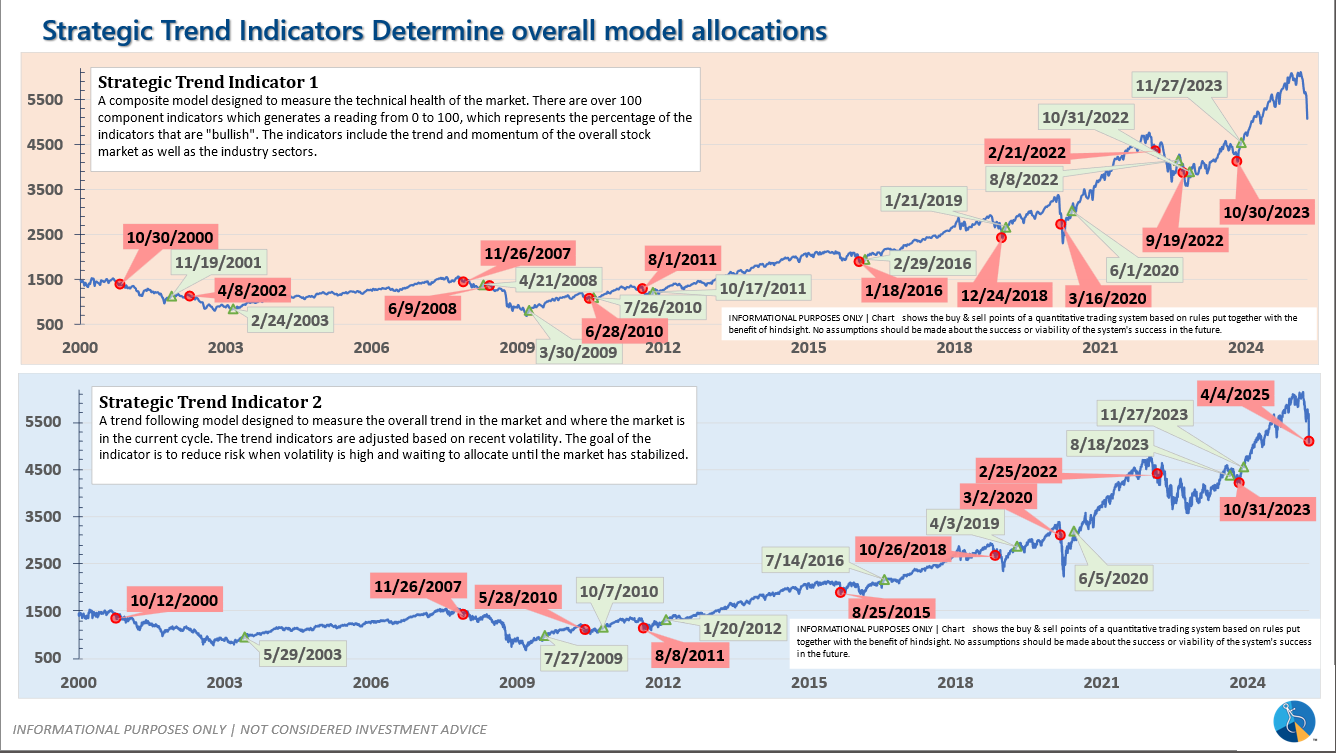
-Strategic Trend Models received 1/2 of the trend sell signal on 4/5/25
SEM deploys 3 distinct approaches – Tactical, Dynamic, and Strategic. These systems have been described as 'daily, monthly, quarterly' given how often they may make adjustments. Here is where they each stand.
Tactical (daily): On 4/3/2025 our tactical high yield model sold out of high yield bond into money market.
Dynamic (monthly): The economic model was 'neutral' since February. In early May 2023 the model moved slightly negative, but reversed back to 'neutral' in June. This means 'benchmark' positions – 20% dividend stocks in Dynamic Income and 20% small cap stocks in Dynamic Aggressive Growth. The interest rate model is slightly 'bullish'.
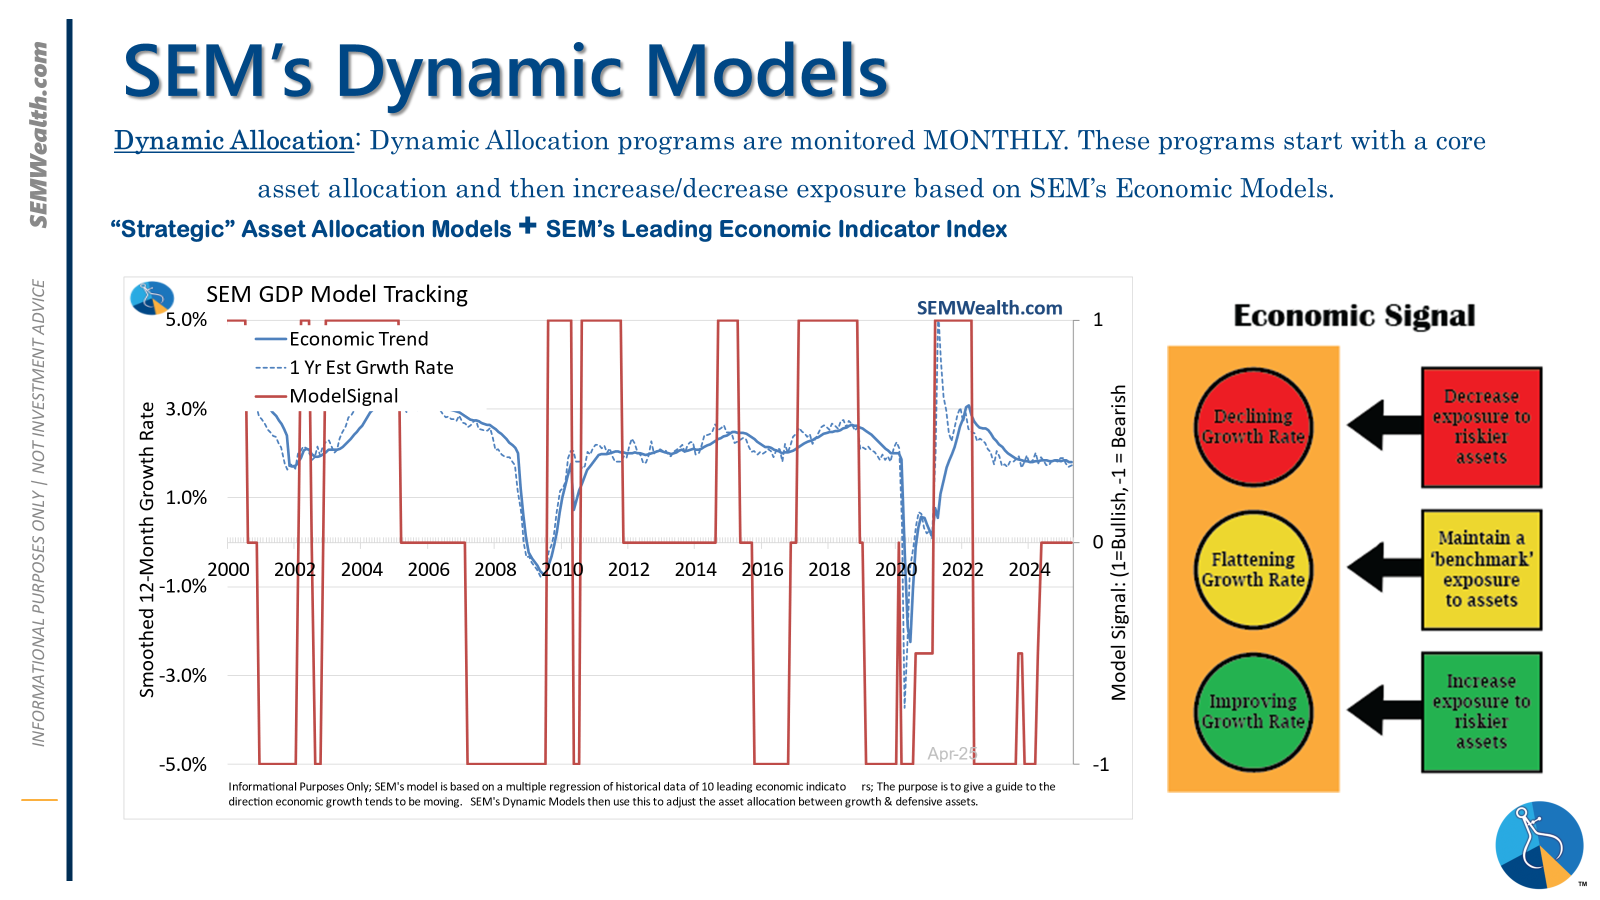
Strategic (quarterly)*: One Trend System sold on 4/4/2025
The core rotation is adjusted quarterly. On August 17 it rotated out of mid-cap growth and into small cap value. It also sold some large cap value to buy some large cap blend and growth. The large cap purchases were in actively managed funds with more diversification than the S&P 500 (banking on the market broadening out beyond the top 5-10 stocks.) On January 8 it rotated completely out of small cap value and mid-cap growth to purchase another broad (more diversified) large cap blend fund along with a Dividend Growth fund.
The * in quarterly is for the trend models. These models are watched daily but they trade infrequently based on readings of where each believe we are in the cycle. The trend systems can be susceptible to "whipsaws" as we saw with the recent sell and buy signals at the end of October and November. The goal of the systems is to miss major downturns in the market. Risks are high when the market has been stampeding higher as it has for most of 2023. This means sometimes selling too soon. As we saw with the recent trade, the systems can quickly reverse if they are wrong.
Overall, this is how our various models stack up based on the last allocation change:

Questions or comments - drop us a note?
Curious if your current investment allocation aligns with your overall objectives and risk tolerance? Take our risk questionnaire


