
There were many times in 2023 & 2024 where I sat down to write the blog and I thought, "how many different ways can I say the same thing?" Back then it was all about the mega cap stocks (eventually named the "Magnificent 7" or "Mag 7") and how they were driving the market higher. This year I find myself starting each week again feeling as if I'm saying the same thing over and over again. This time it is not due to a lack of real news, but rather TOO MUCH news. We are bombarded several times a day with headlines that swing markets. This makes it difficult to see what really matters. With that in mind, I'll again try this week to summarize what I thought was important for the markets.
3 Things That Moved Markets Last Week
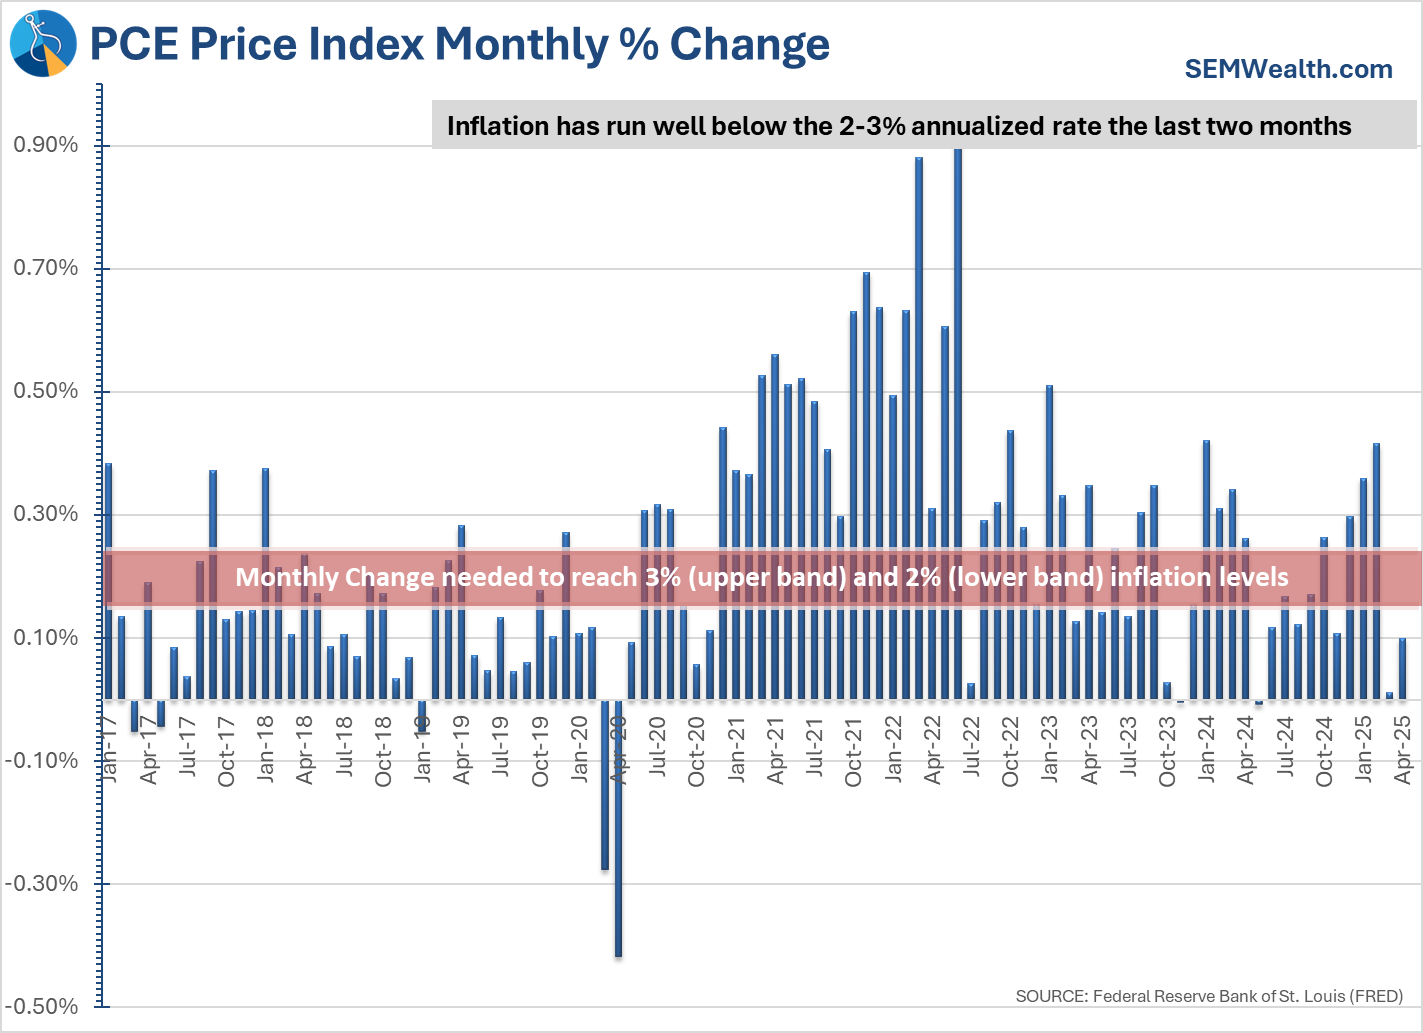
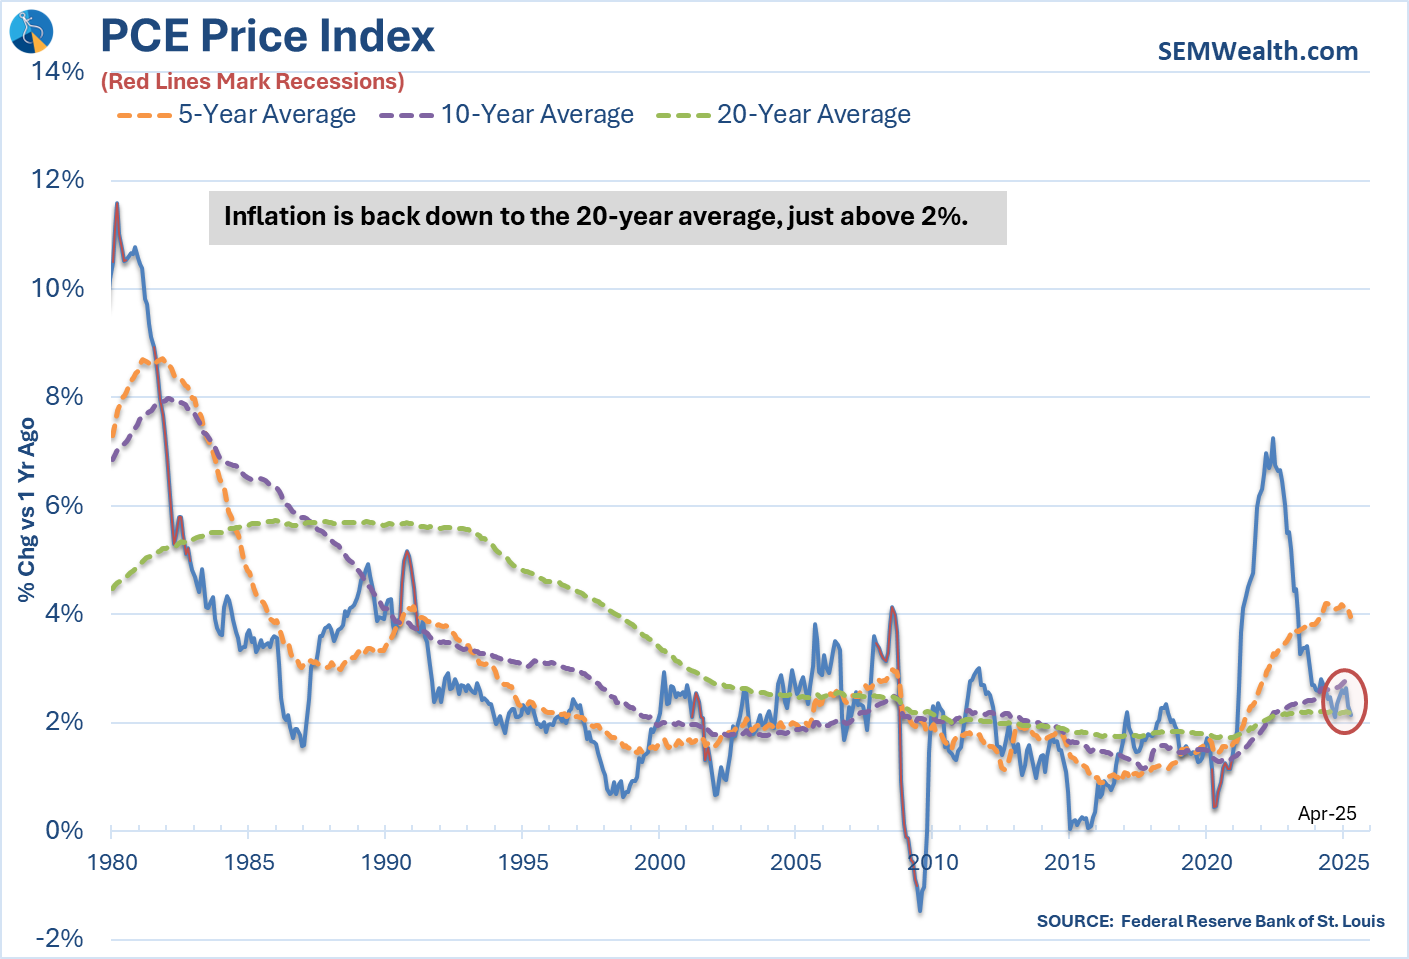
1. Inflation Relief → “Patient-Fed” Narrative Gains Steam
April core PCE, the Fed's preferred inflation measurement slowed to 0.1 % over the past month (2.5 % over the past year)—the 2nd consecutive month of "light" inflation.
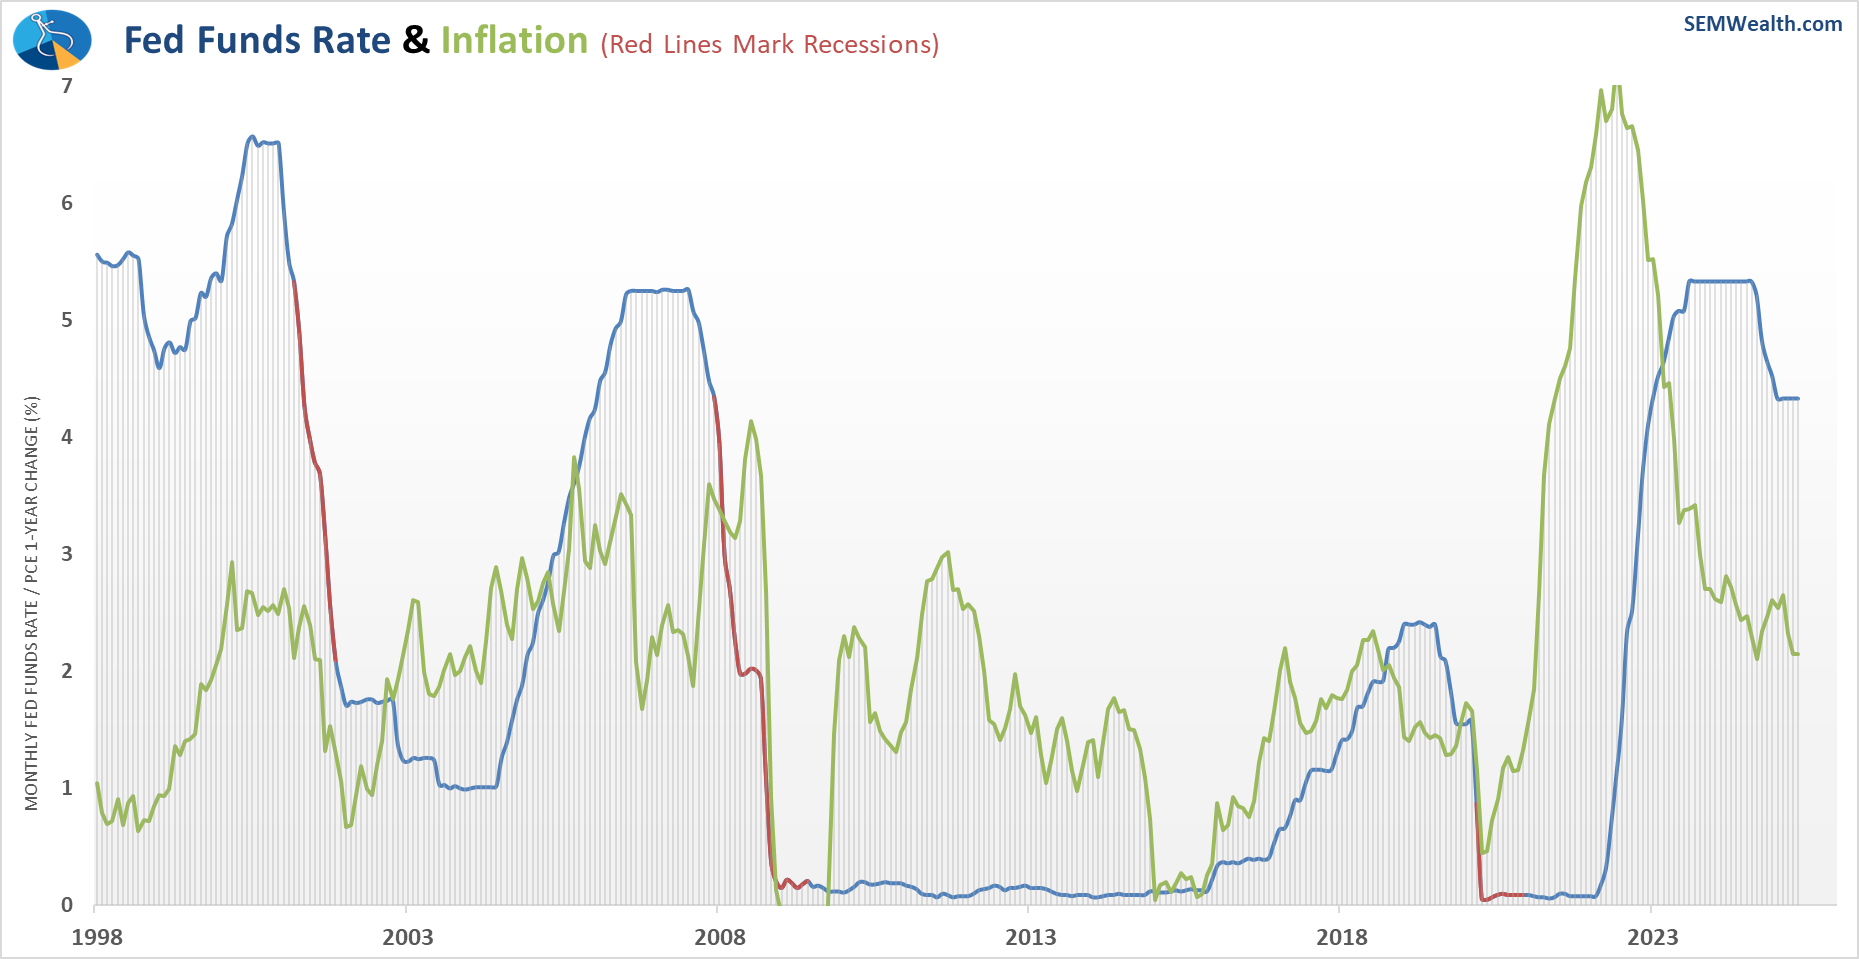
This chart illustrates the changes over time in inflation and the Fed Funds rate. While inflation is tracking well below the Fed Funds rate, there have been times the Fed has chosen to keep rates higher (when they thought the economy was "too hot" – during the tech and housing bubbles.)
The weaker inflation reading the past two months has bolstered hopes the next rate cut should arrive by fall.
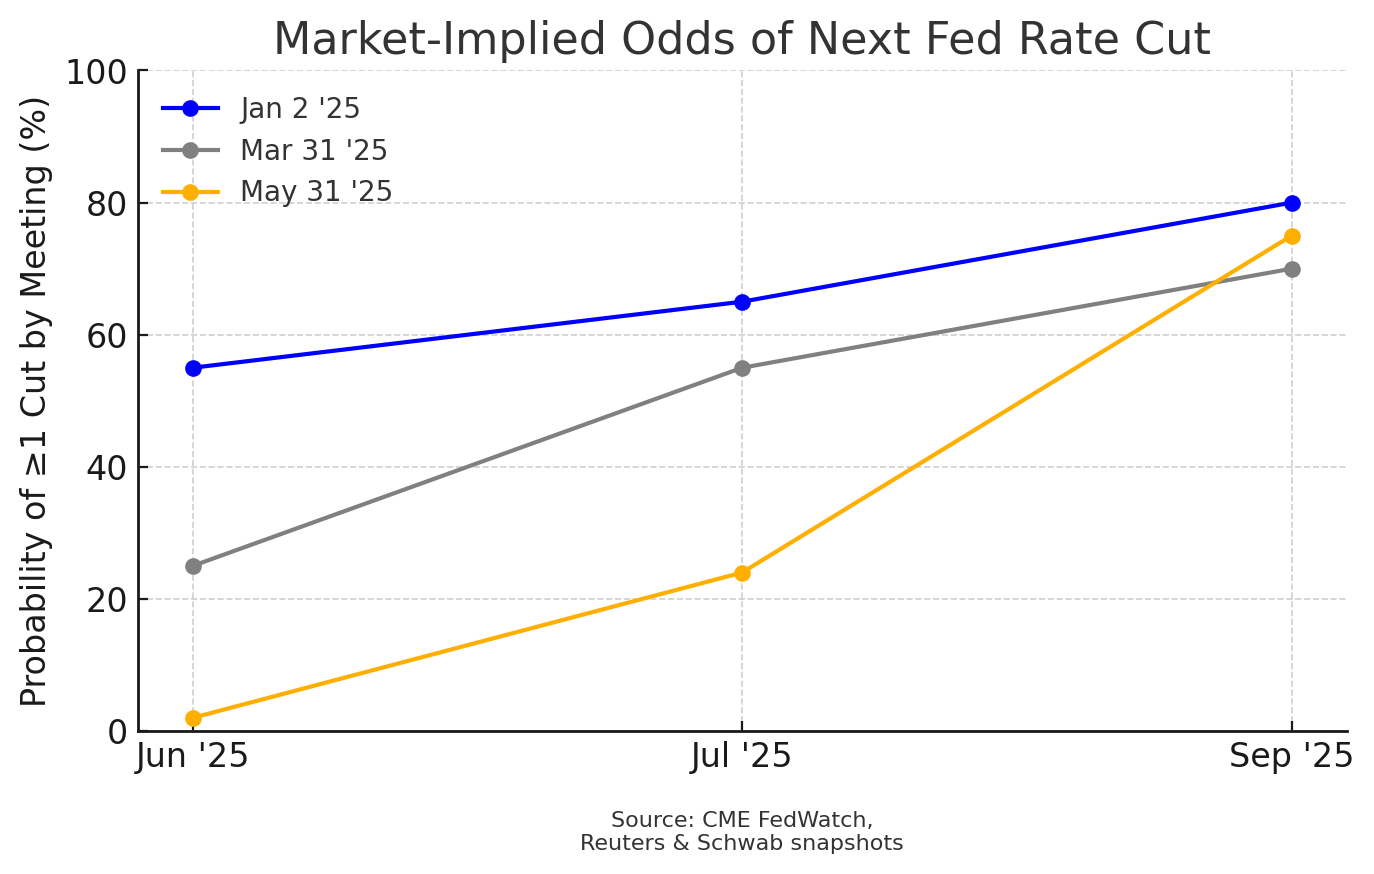
Nobody knows what comes next, but for now the market is back to believing rate cuts are again a possibility
2. Tariff Pendulum Swings (Again)
We had more tariff whipsaws this week. We started the week with a quick reversal on EU tariffs, then late Wednesday two courts ruled that the President lacked authority under emergency powers to implement most of his threatened tariffs. Early Friday a short-term "stay" was issued blocking the courts who blocked the tariffs. This came at the same time the White House announced tariffs on specific industries that are higher than they were under the past announcements the courts blocked. Finally, late-Friday comments from President Trump that “China has totally violated its deal” led to more angst.
I think the main takeaway from this is NOBODY knows how this will end. Guessing could be dangerous to your portfolios. We will continue to follow the DATA and let everybody else pontificate on what they think will be the end result.
3. AI Earnings Keep Mega-Caps in the Driver’s Seat
Nvidia again blew away all estimates when it released earnings last Wednesday. Revenue was up in the 1st quarter 66% and they reported a big backlog of orders. This led to another strong week for the "Mag7".
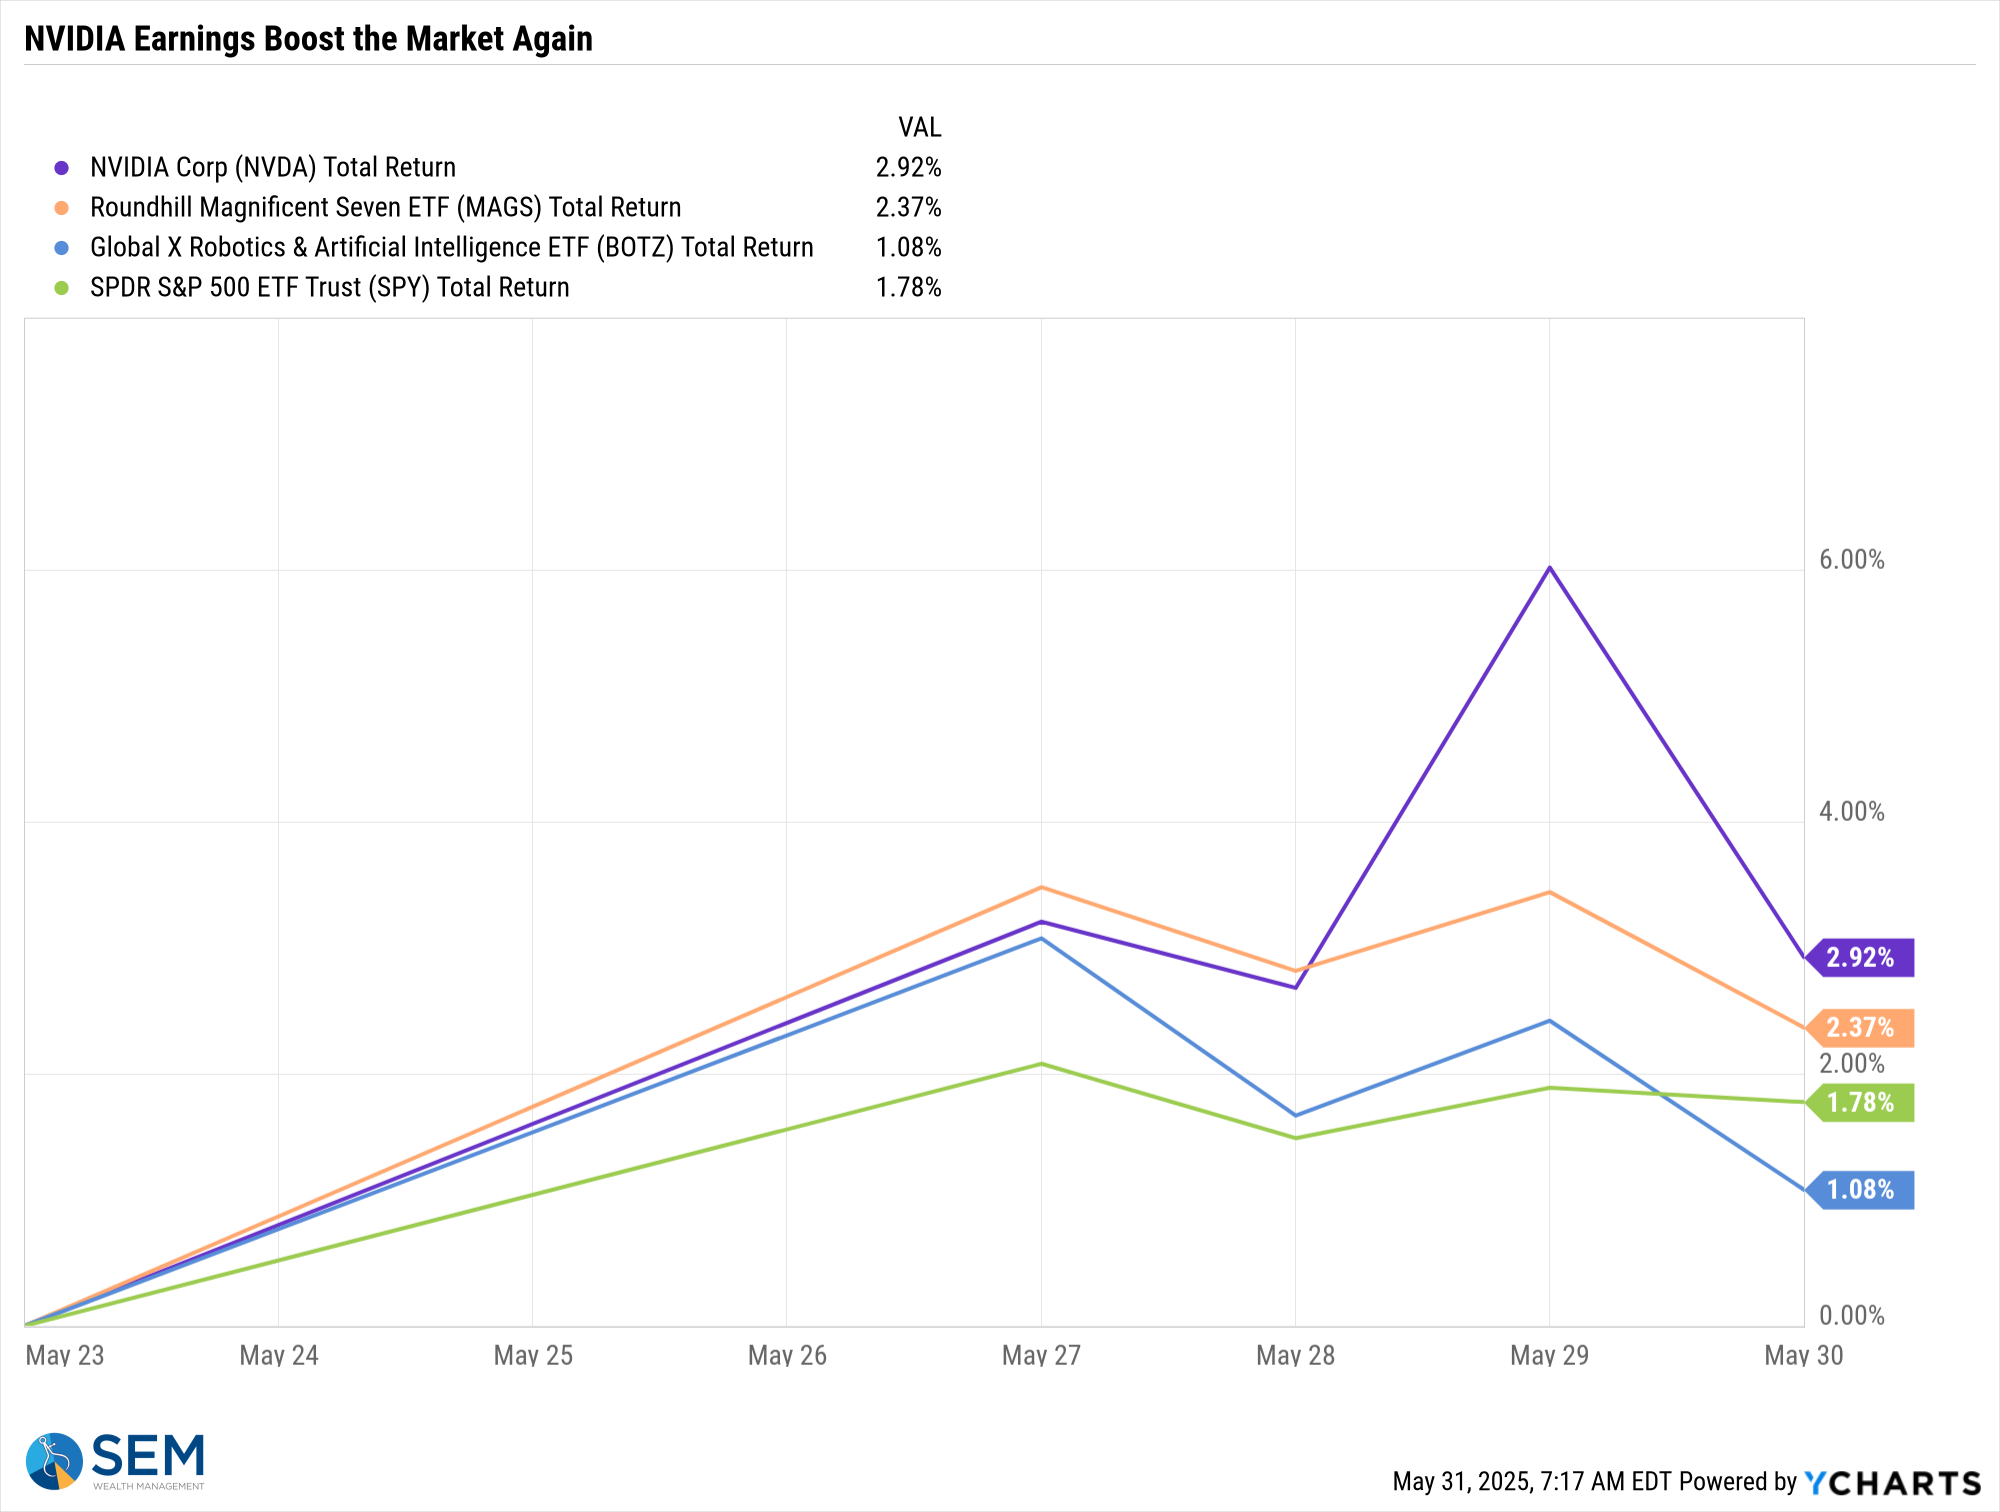
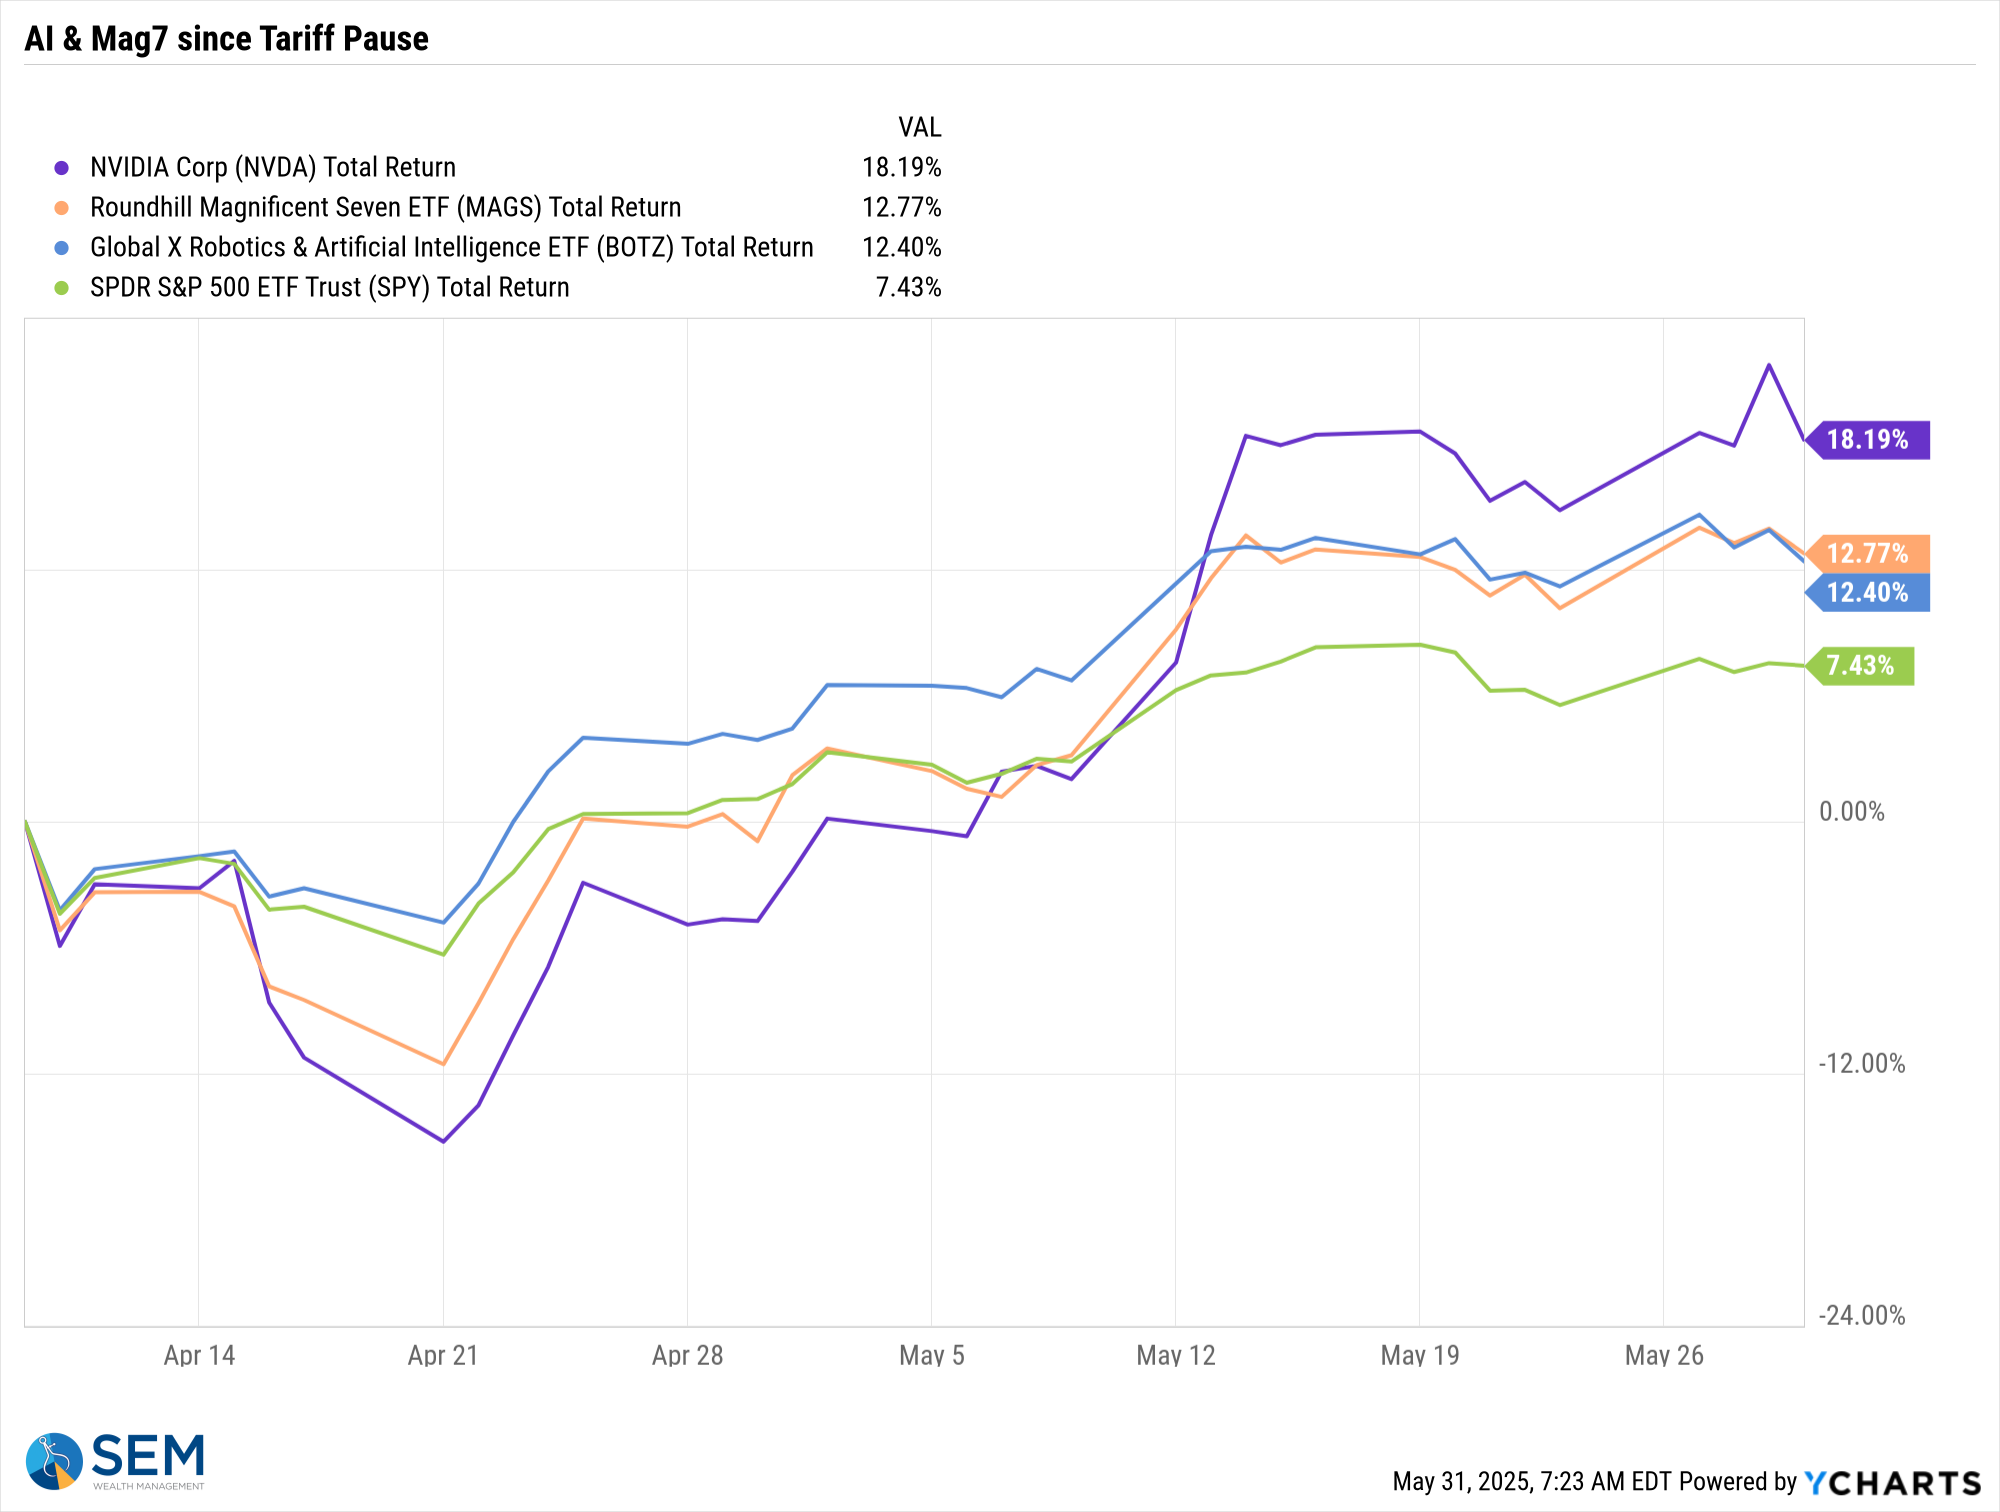
Since most of the "Liberation Day" tariffs have been put on hold, Nvidia and the Mag7 have been driving the market higher.
Greed is still driving the market (meaning sentiment is quite optimistic).
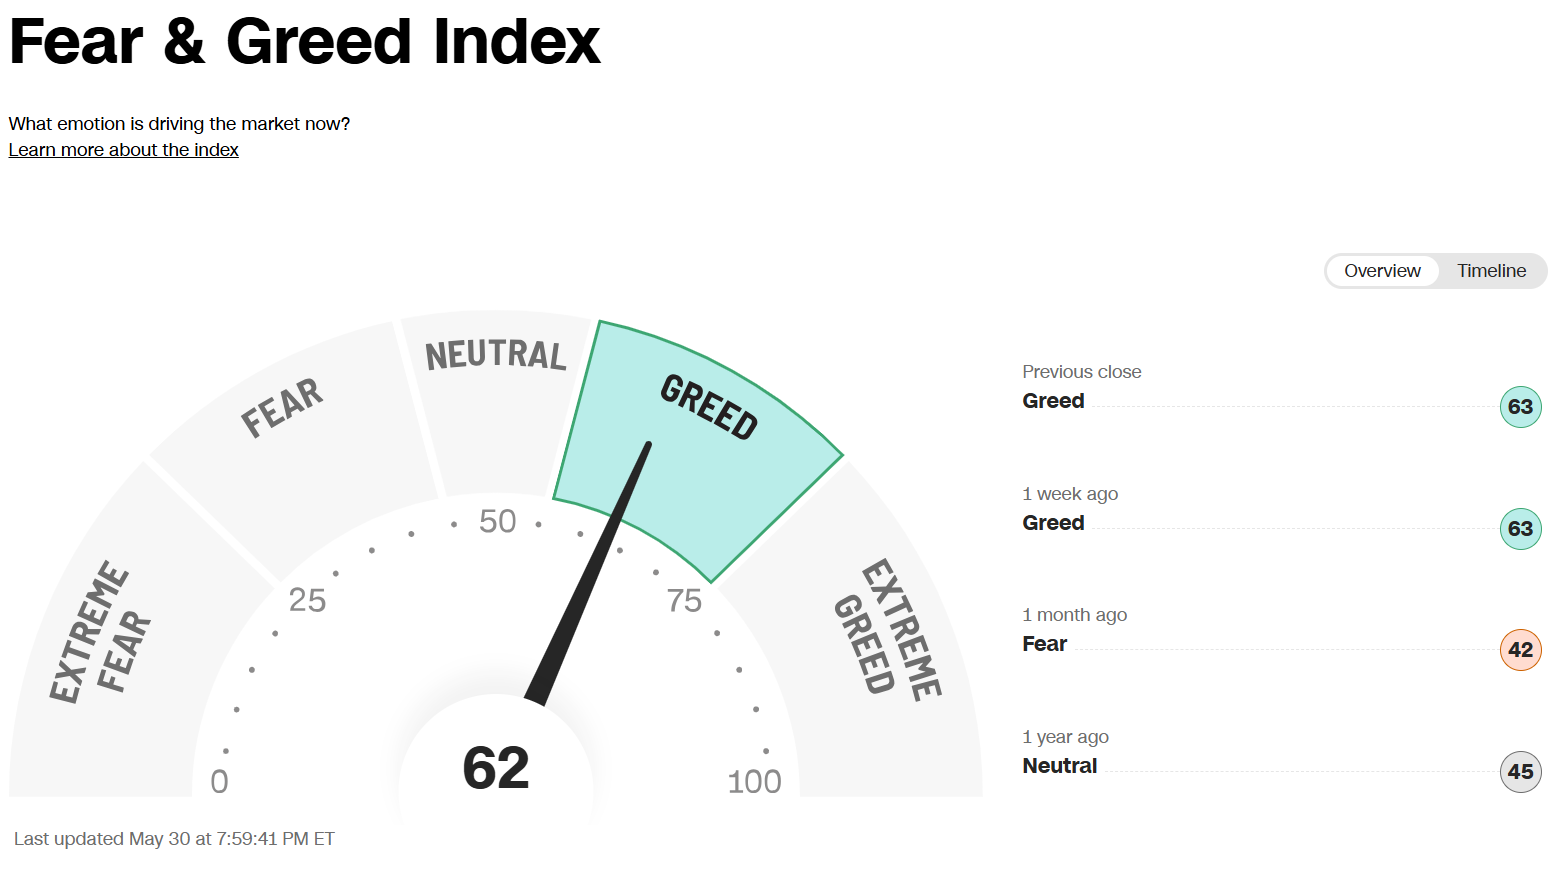
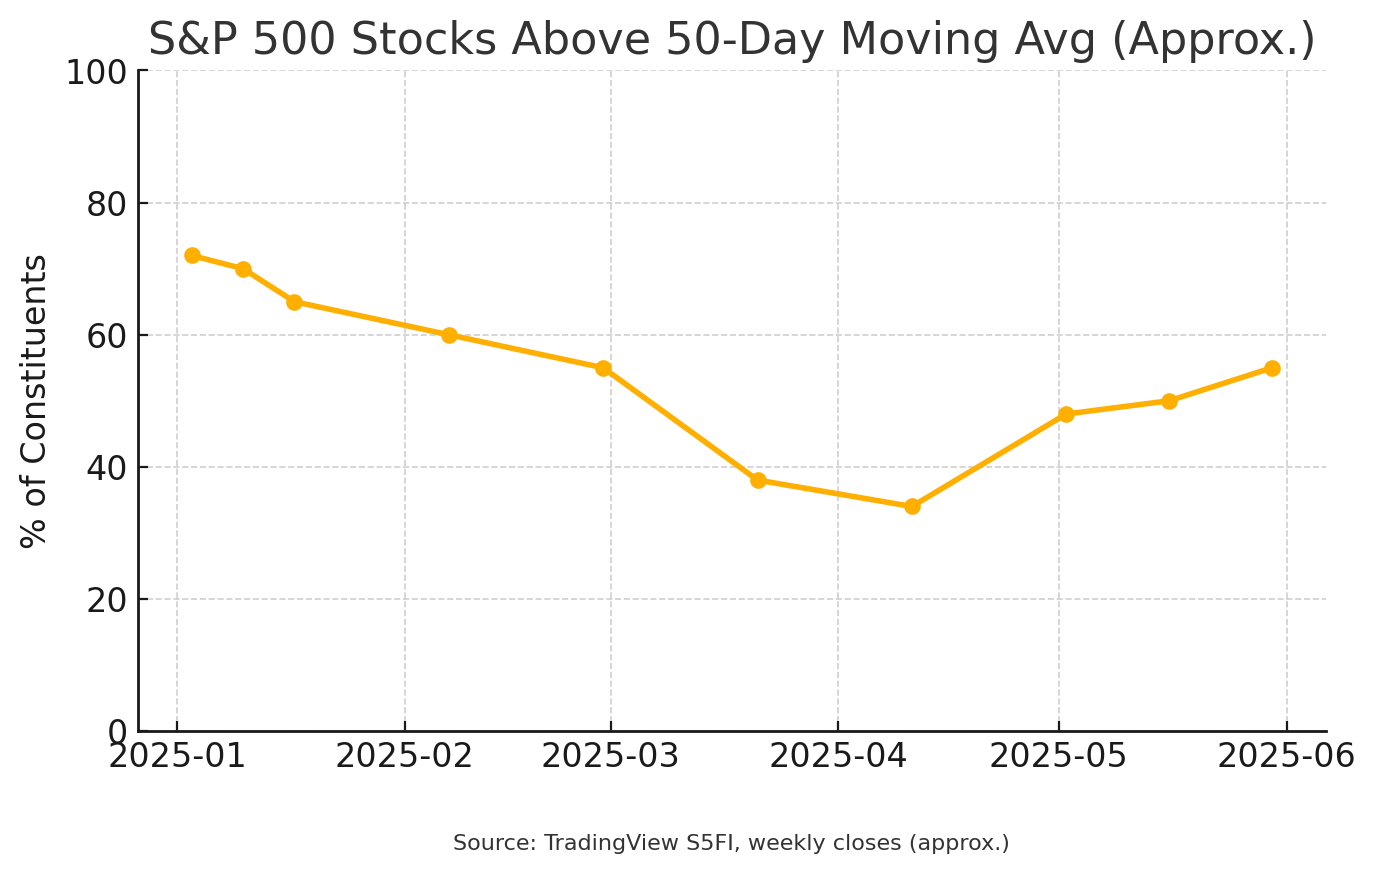
Sentiment is not a "timing" mechanism, but is something that does highlight the "mood" of the market. Overall the market has recovered some, but the "average" stock is still below its 50-day moving average, which is usually used as a trend indicator and a sign of market health.
My takeaway – it's too murky right now both from a technical, fundamental, and sentiment perspective to make any big bets.
What We’re Watching This Week
- ISM Manufacturing (Monday) & Services (Thursday) – Two pieces of "soft" data we've been watching. Manufacturing has been in "contraction" for nearly a year now. Services had been holding up, but we've seen 3 consecutive months where service businesses saw some slowing. This would flash a broader economic warning.
- ECB Decision (Thursday) – We normally don't pay too much attention to what other central banks are doing but a cut could further widen the weakness in the dollar and possibly US Treasuries, pressuring the dollar. This could help feed further into the "ABUSA" (Anything but US) trade we discussed last week.
- May Payrolls Report (Friday) – The market will focus on the headline number. A number between 50-150K would reinforce the “patient-Fed” path. Anything stronger and the minority at the Fed who wants rates higher could become louder. A "positive" for the market would be a negative reading, although I'd caution getting too excited about that as simply lowering rates would not reverse a negative labor market. We will focus on the Average Weekly Hours index as that is one of the best leading indicators of future economic growth in our dashboard.
Market Charts
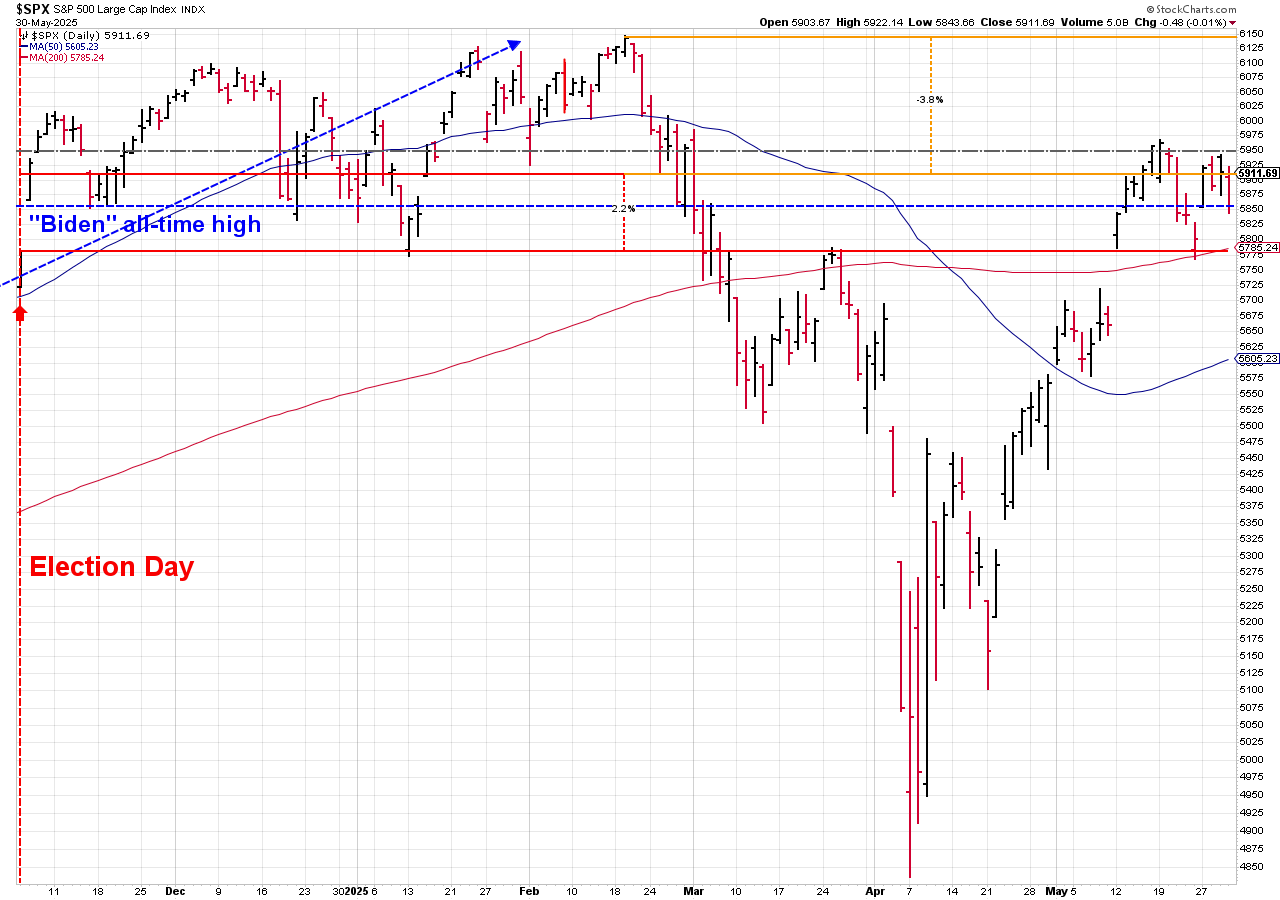
The S&P 500 has been able to maintain the wide range that started with the news of a US-China trade "deal" (details still are being sorted out apparently). It is typically a positive sign when the market moves sideways in a trading range after a big move. A drop below 5780 (which is also the election-day close) would be a negative while a move above 6010 (the recent high) would be seen as a positive development.
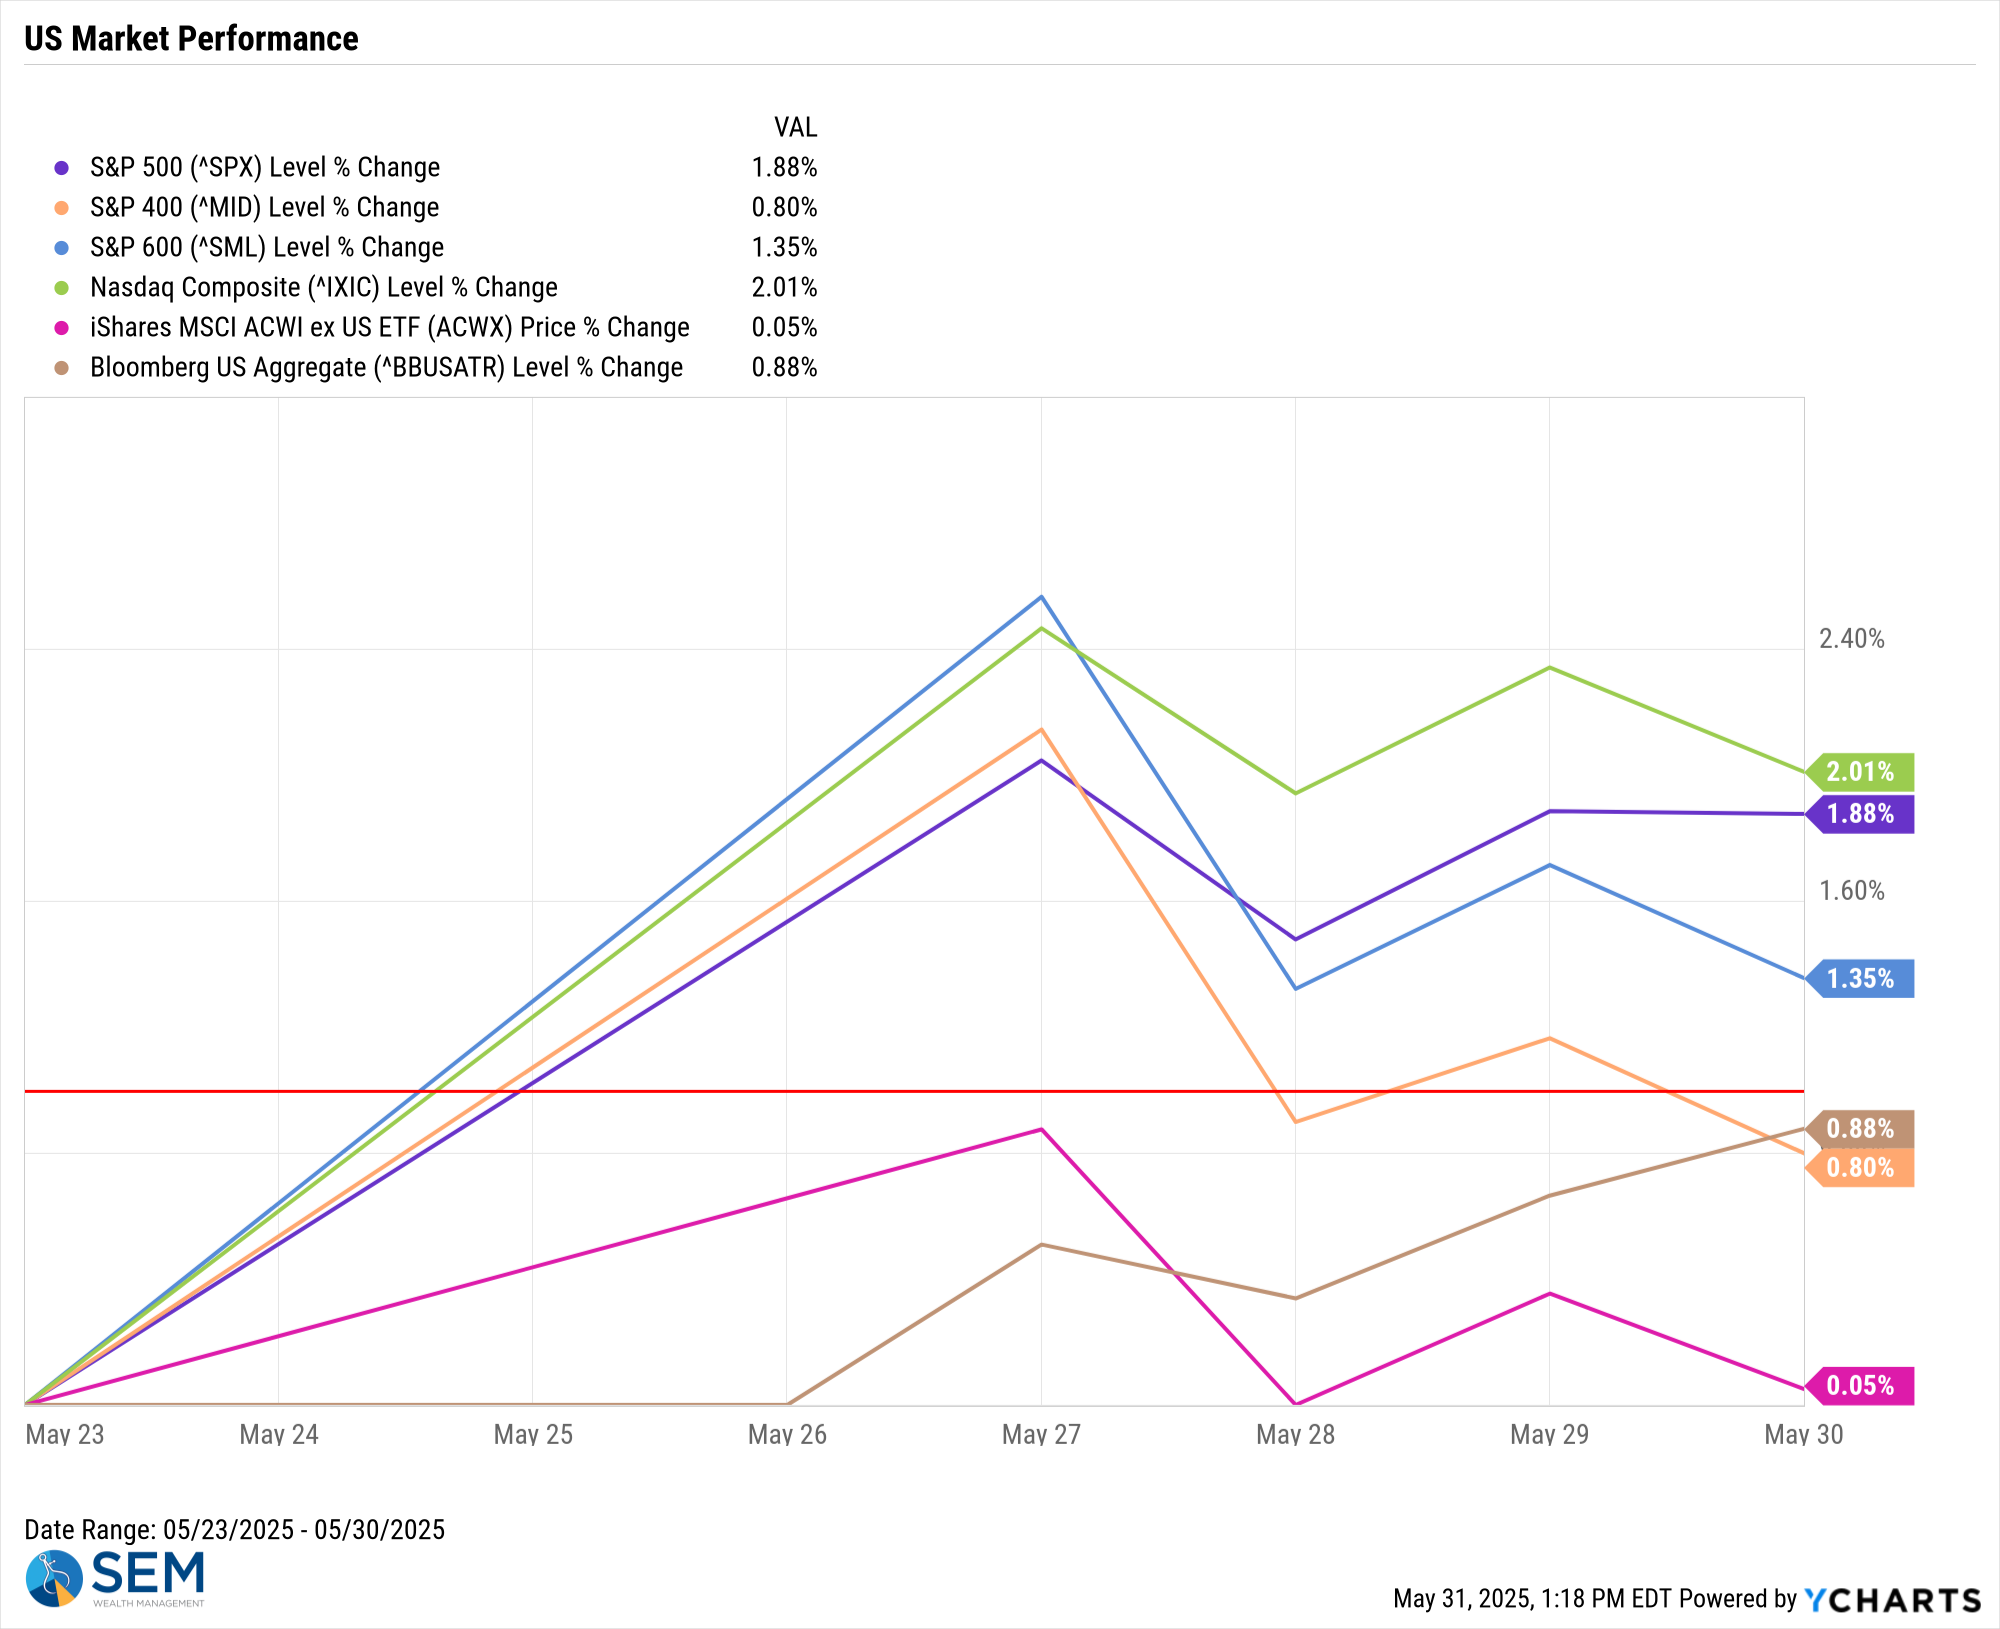
Looking at the overall market on the holiday-shortened week we saw some wild swings and broad differences in performance.
Bond yields continue to be the focus on the market. After a brief move higher earlier in the week, yields relaxed a bit.
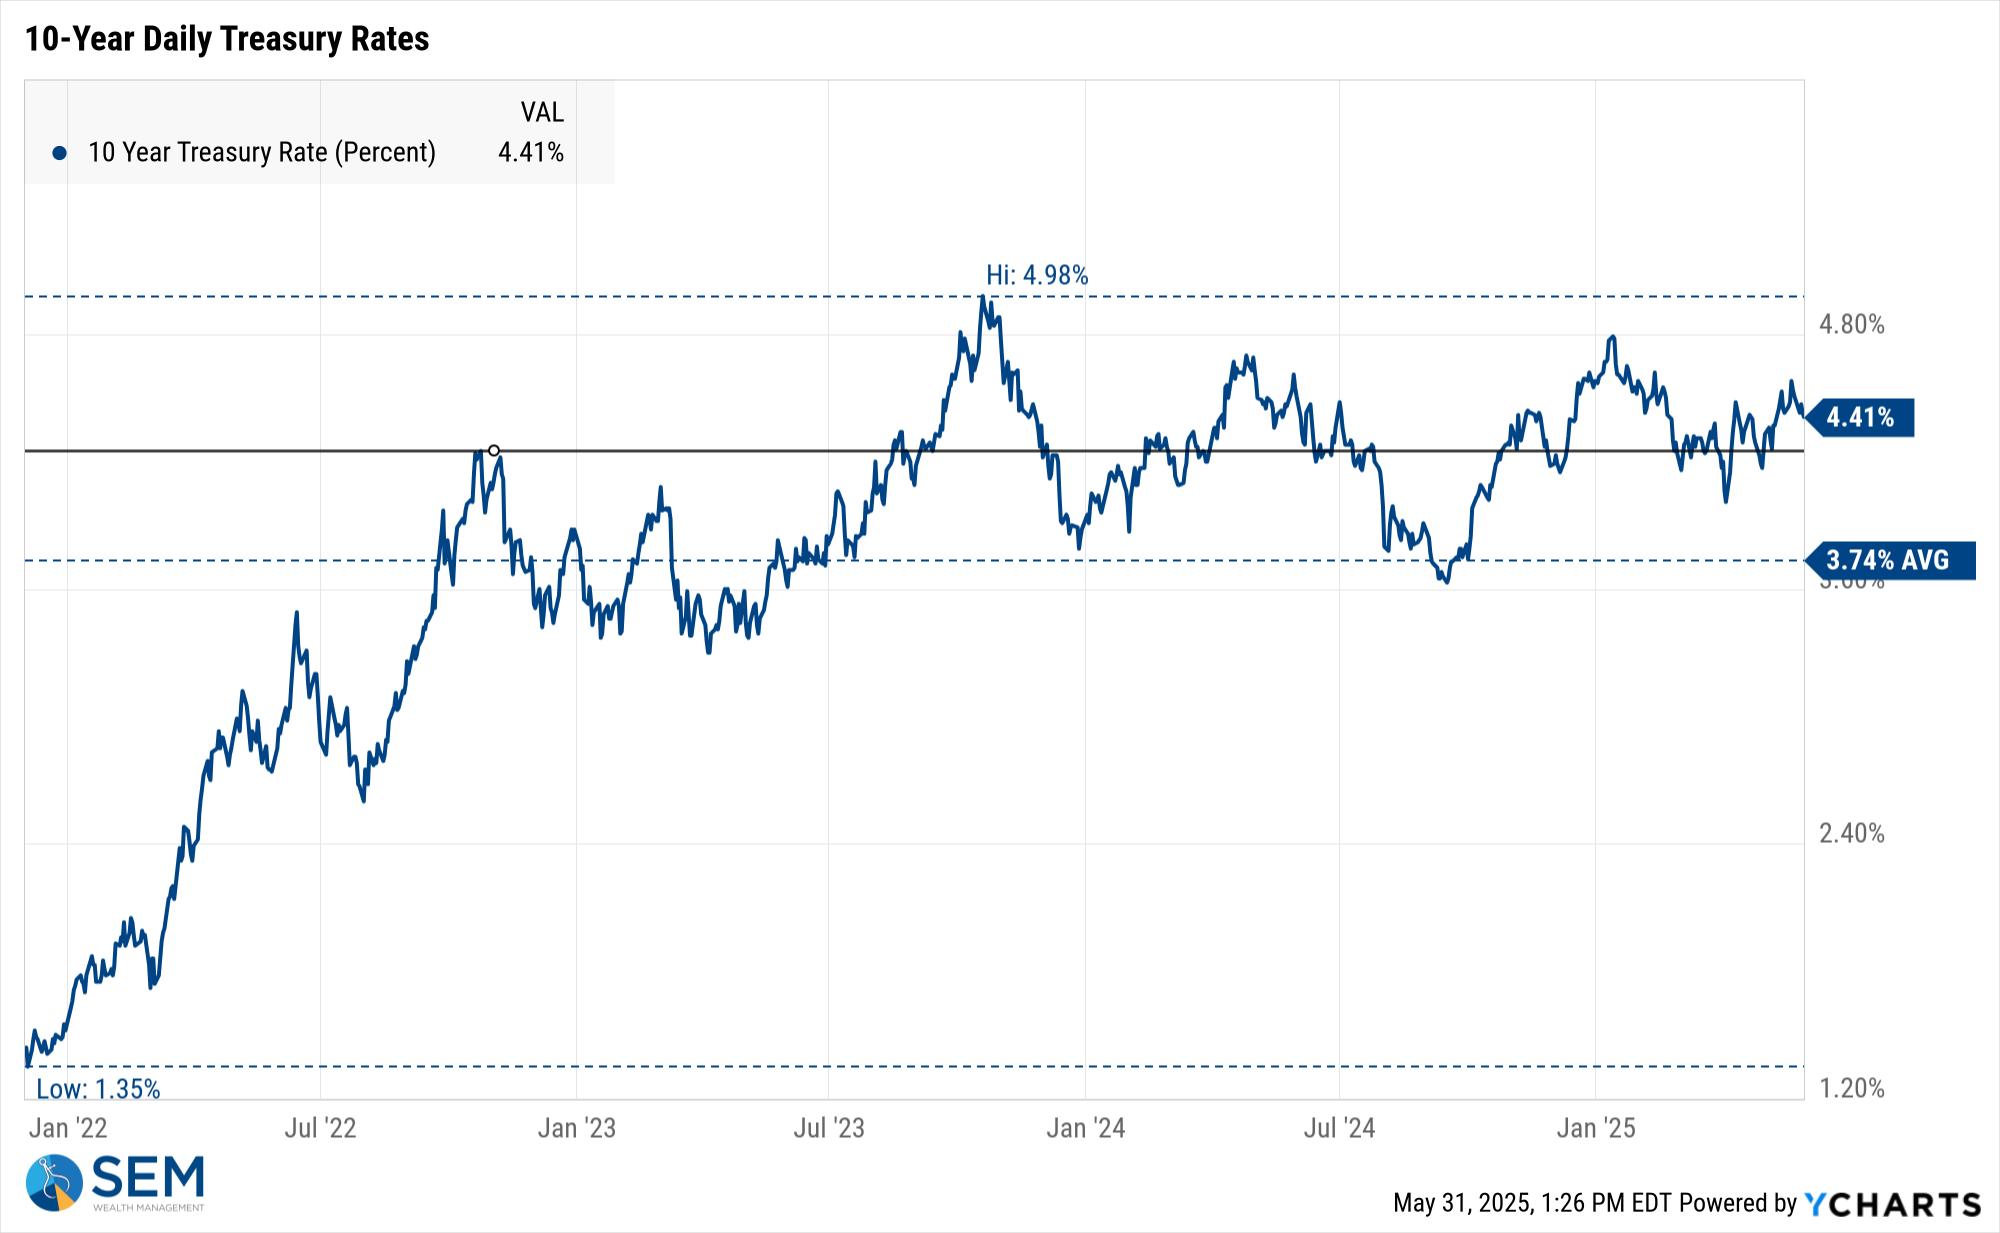
This is still a story about just Treasury yields (inflation and deficit concerns) as the spread between corporate bonds and Treasuries remains calm.
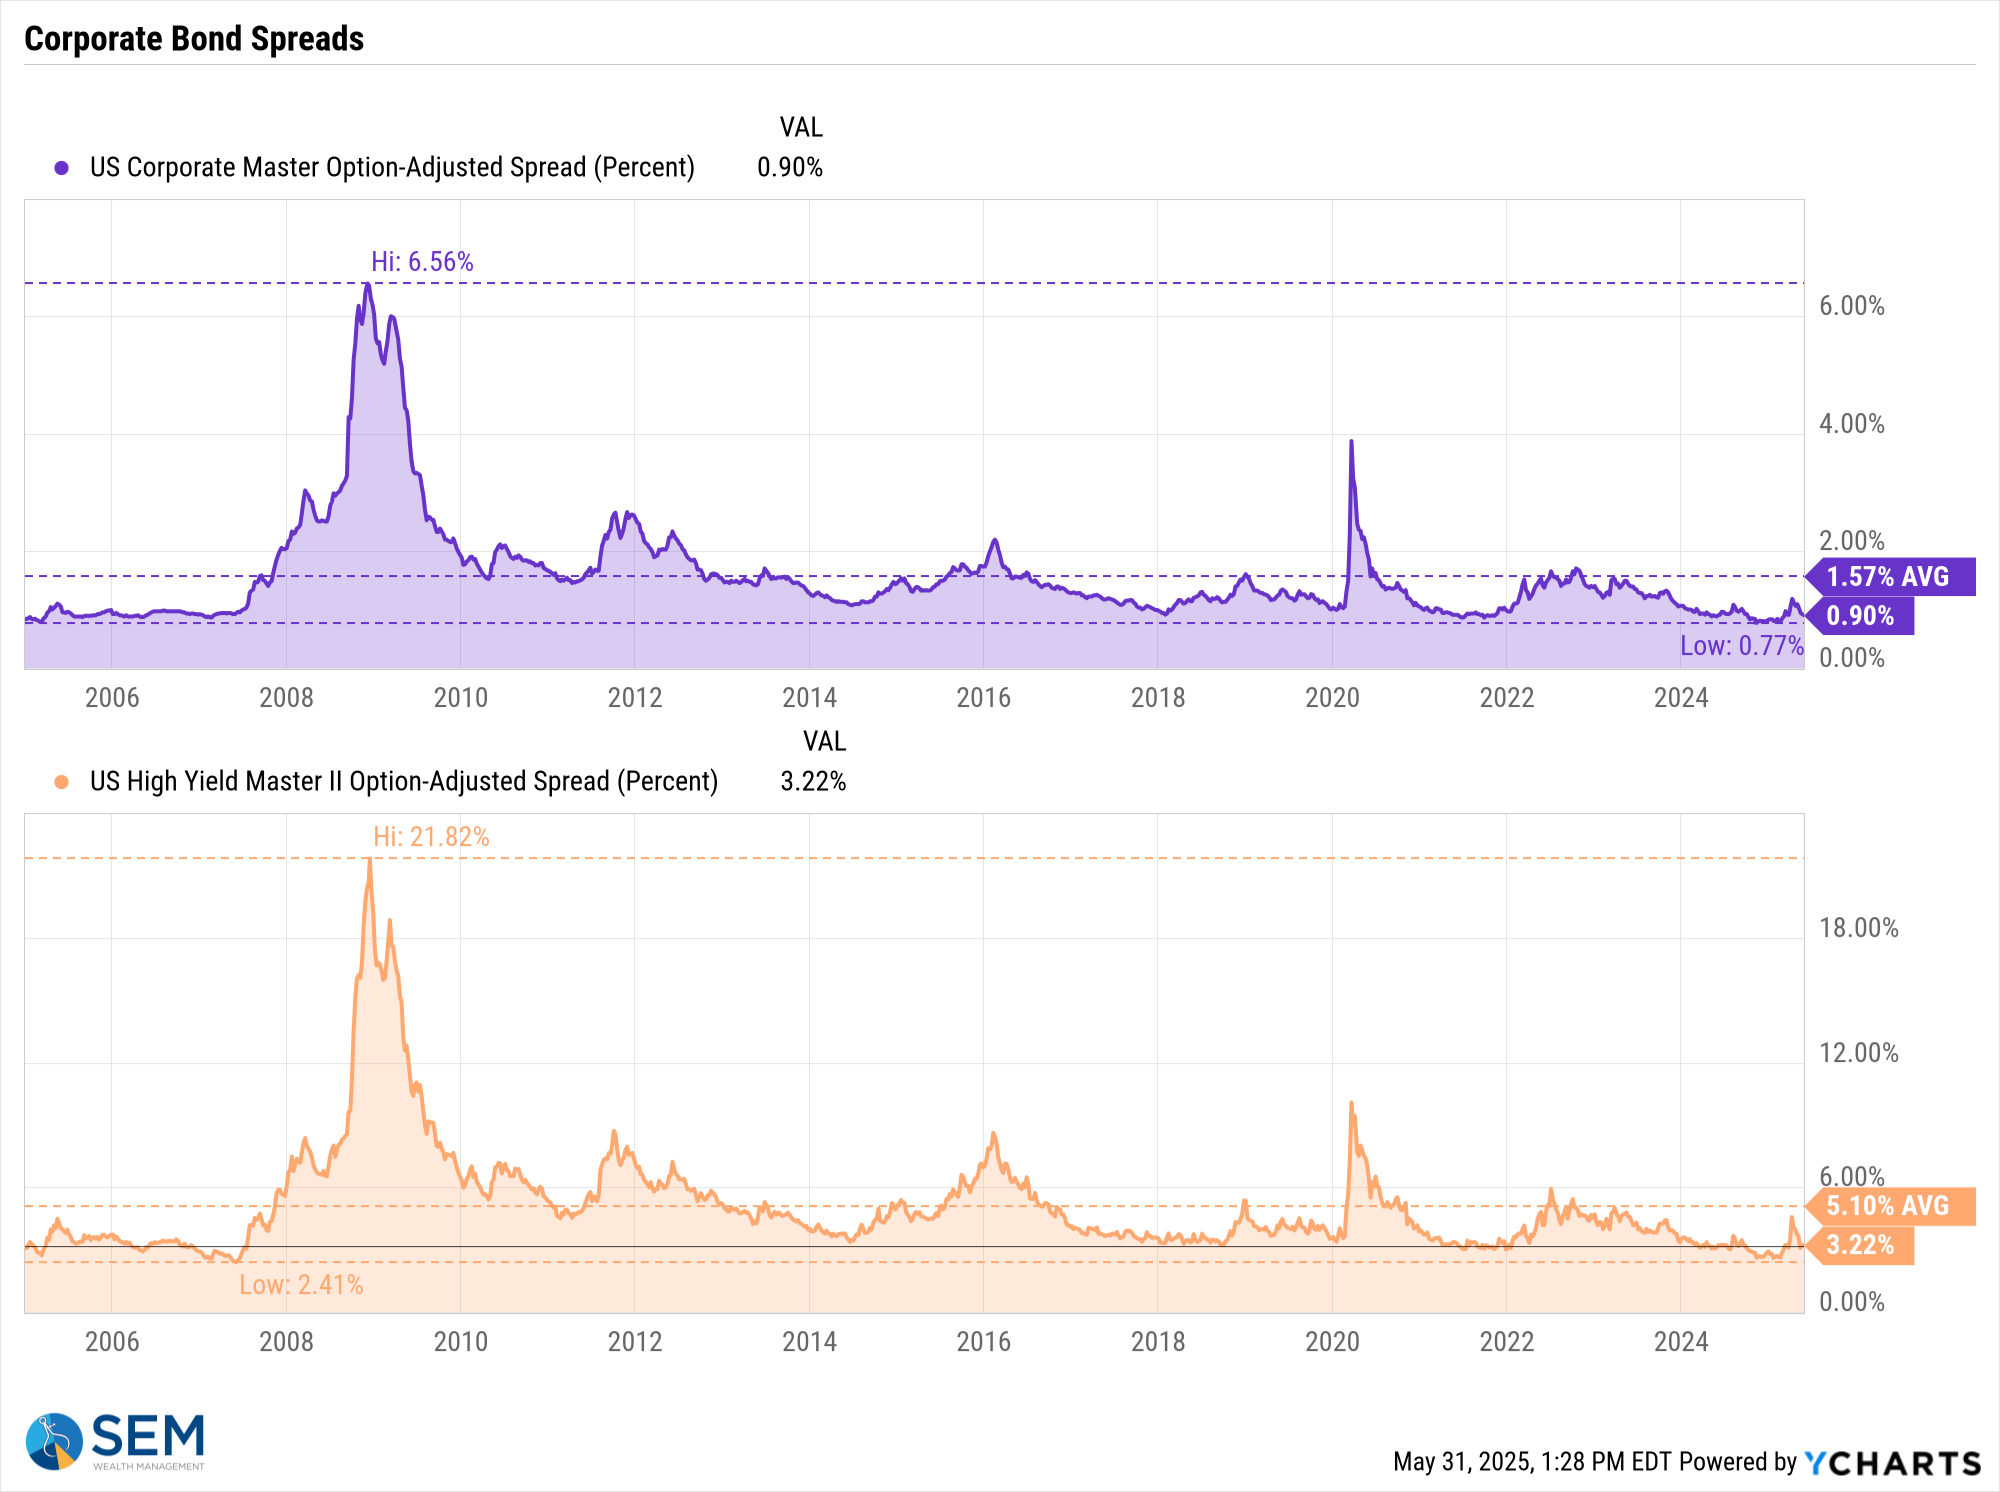
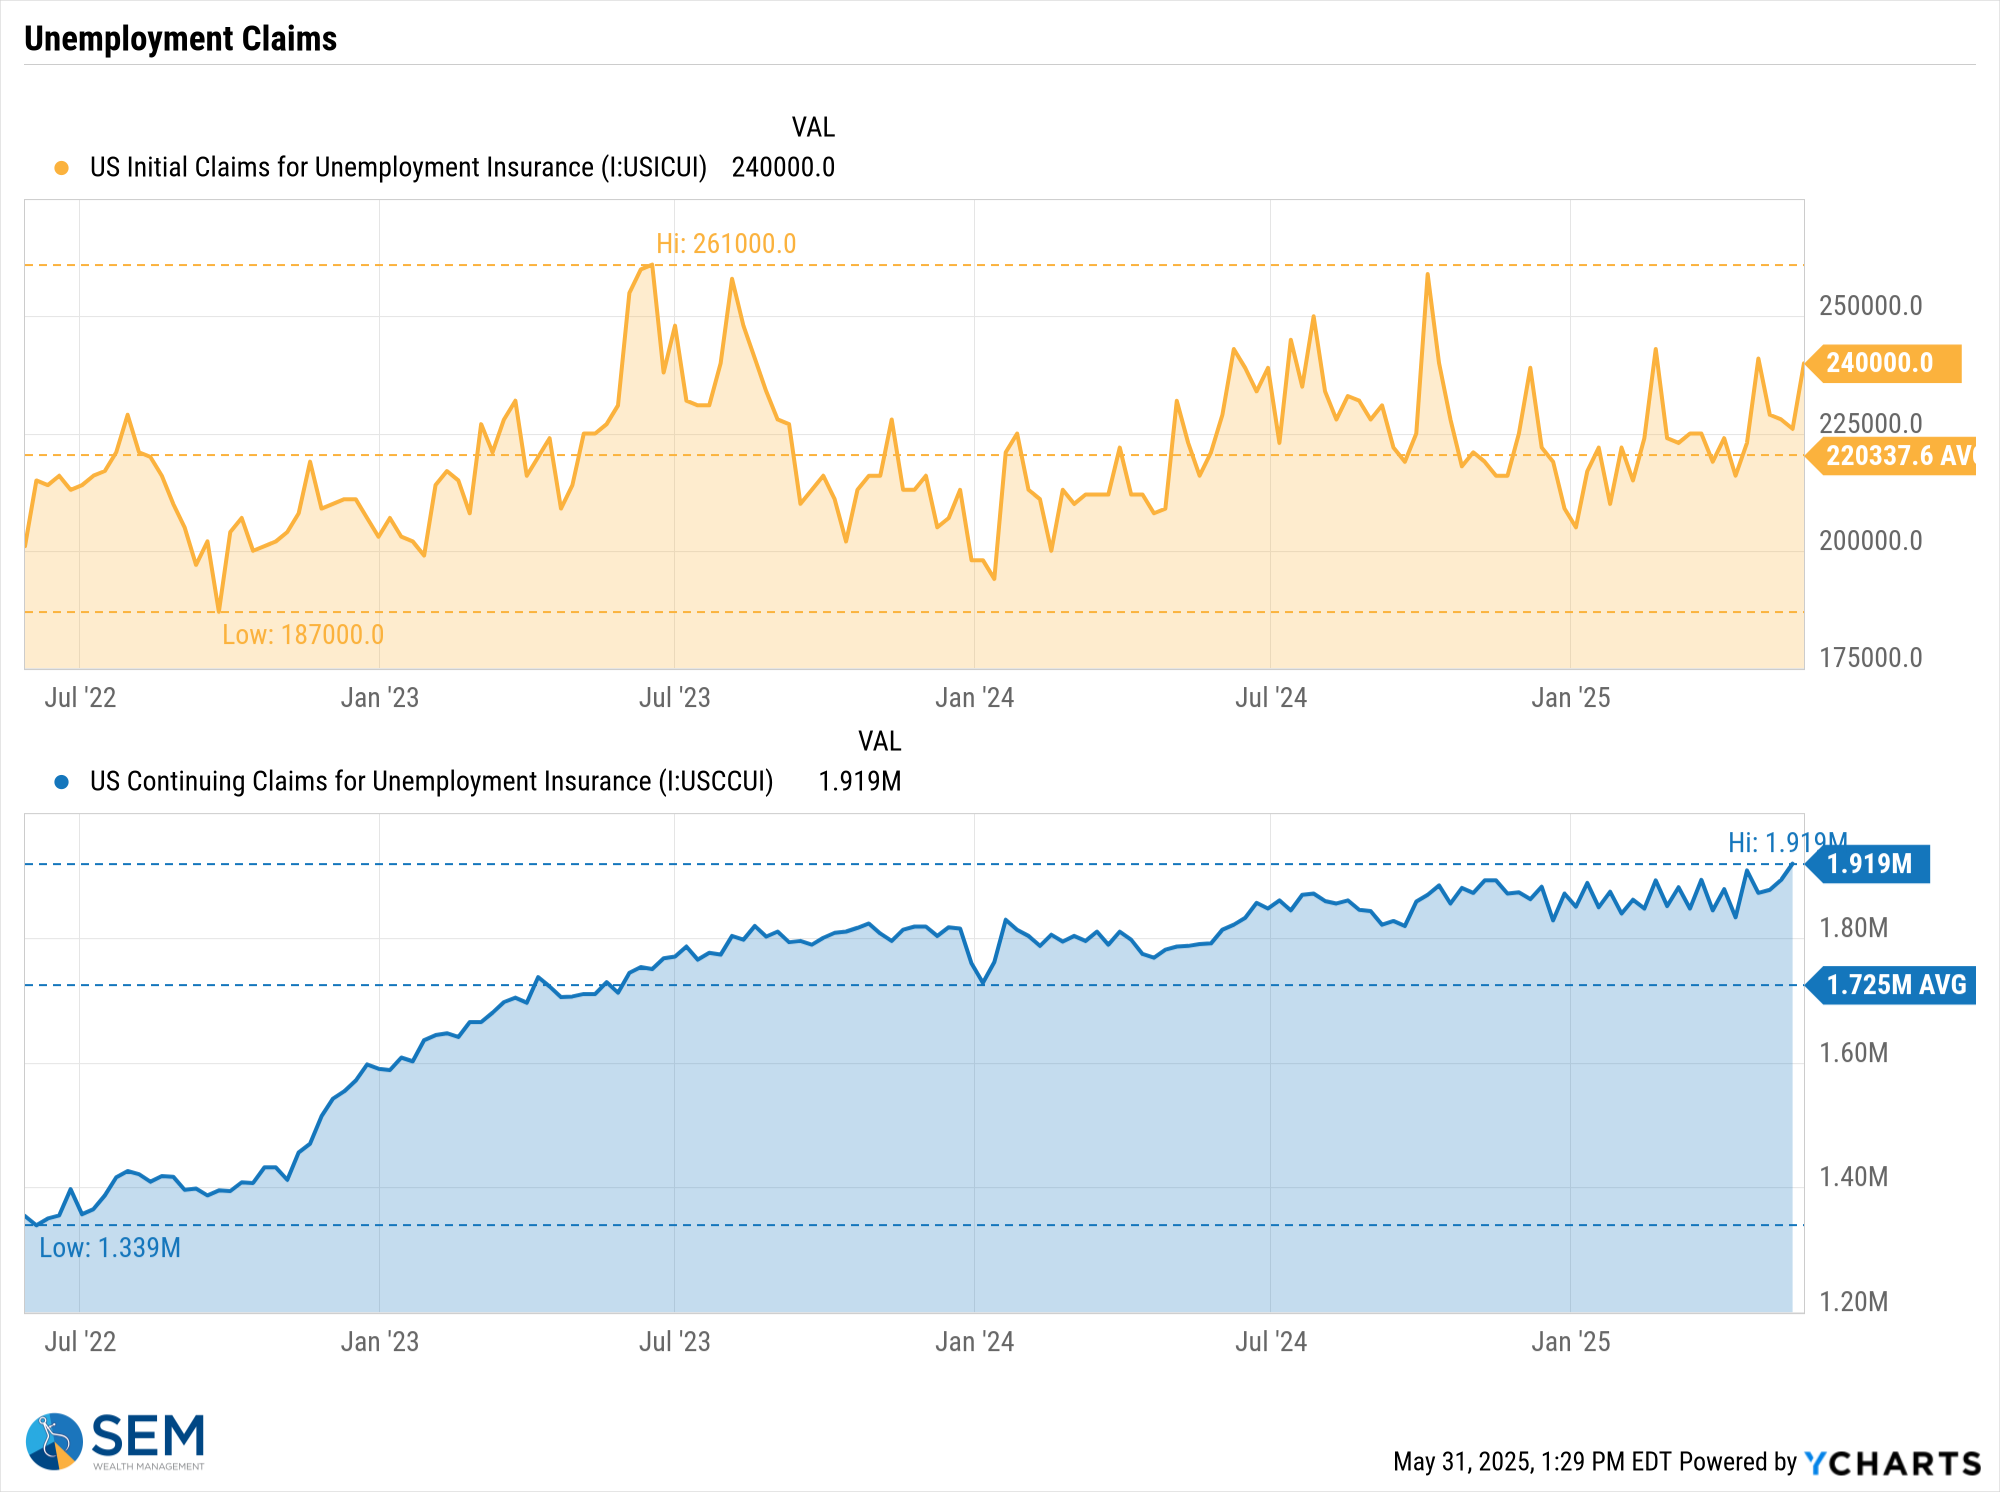
All will likely remain calm until we see jobless claims move significantly higher.
SEM Model Positioning
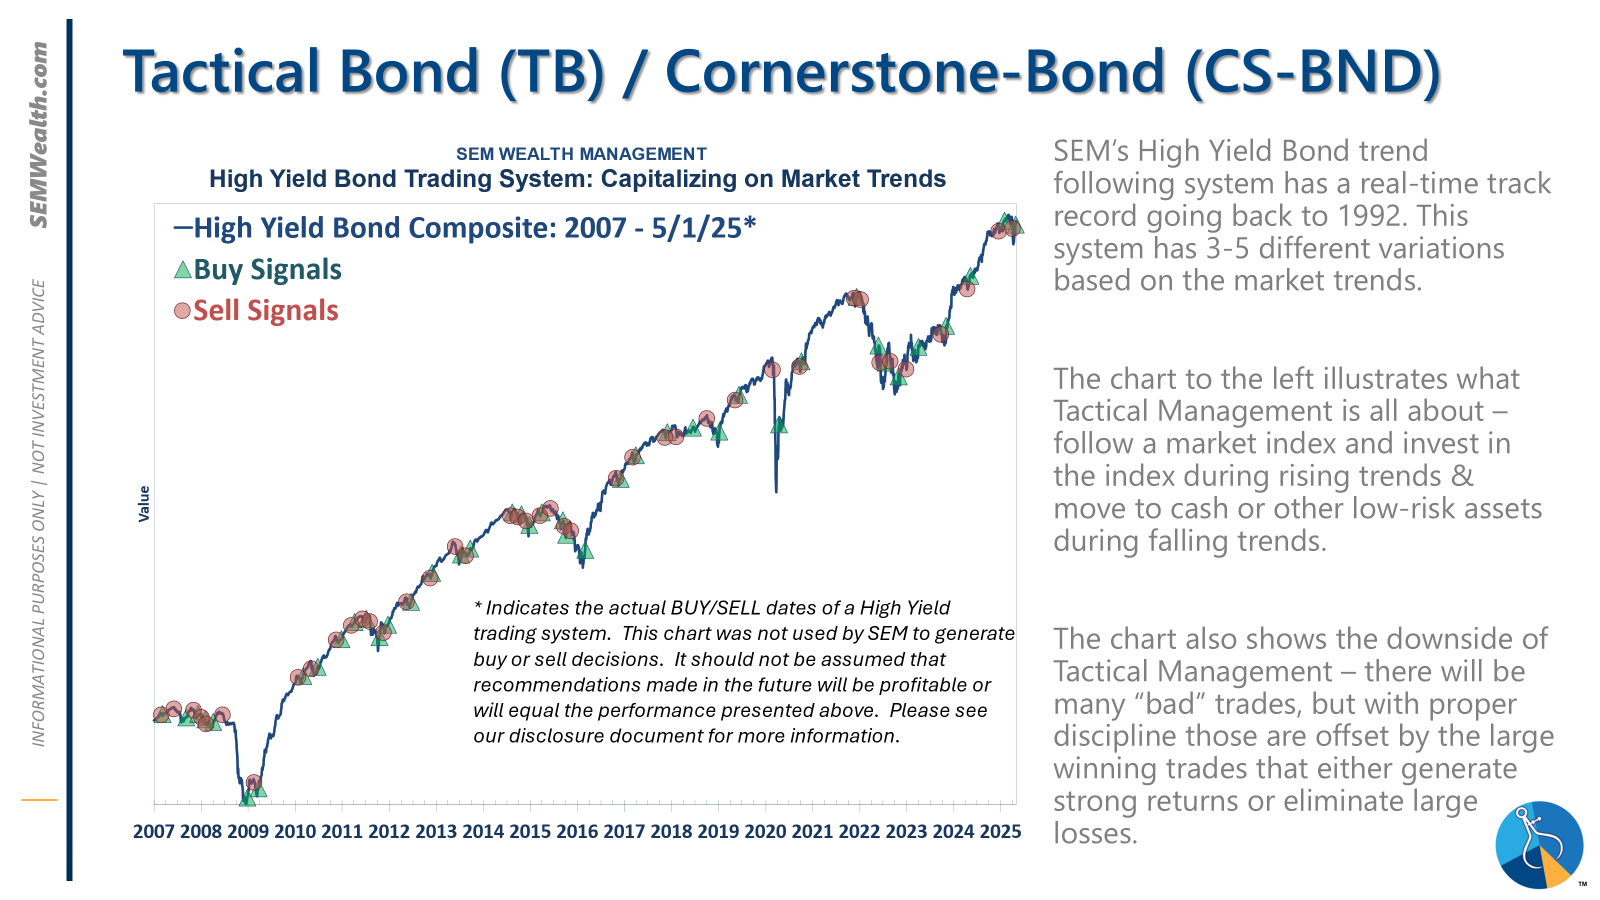
-Tactical High Yield sold high yield bonds on 4/3/25 after 9 weeks in these funds. These models bought back in on 4/24. All proceeds were moved to money market or short-term bonds, with a yield around 4.1% in money markets.
-Dynamic Models are 'neutral' as of 6/7/24, reversing the half 'bearish' signal from 5/3/2024. The interest rate model remains partially 'bullish' (long Treasuries).
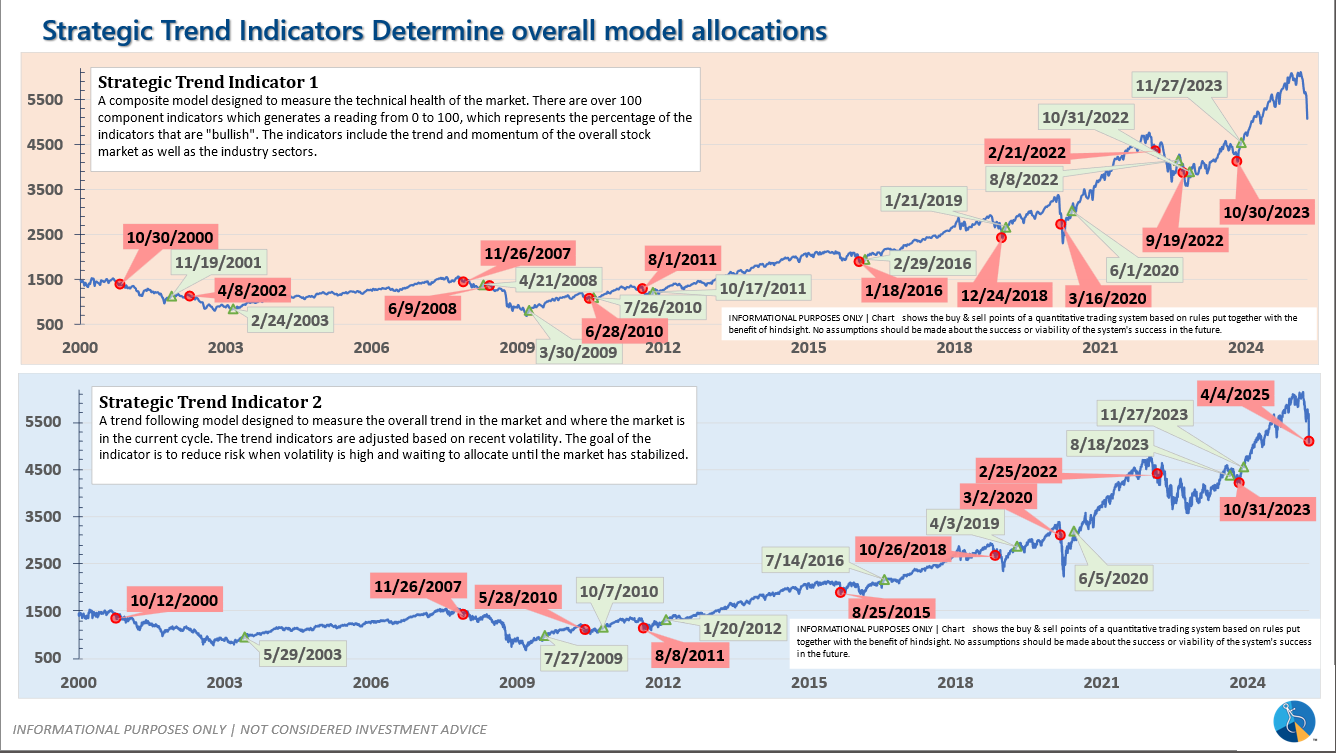
-Strategic Trend Models received 1/2 of the trend sell signal on 4/5/25
SEM deploys 3 distinct approaches – Tactical, Dynamic, and Strategic. These systems have been described as 'daily, monthly, quarterly' given how often they may make adjustments. Here is where they each stand.
Tactical (daily): On 4/3/2025 our tactical high yield model sold out of high yield bond into money market.
Dynamic (monthly): The economic model was 'neutral' since February. In early May 2023 the model moved slightly negative, but reversed back to 'neutral' in June. This means 'benchmark' positions – 20% dividend stocks in Dynamic Income and 20% small cap stocks in Dynamic Aggressive Growth. The interest rate model is slightly 'bullish'.
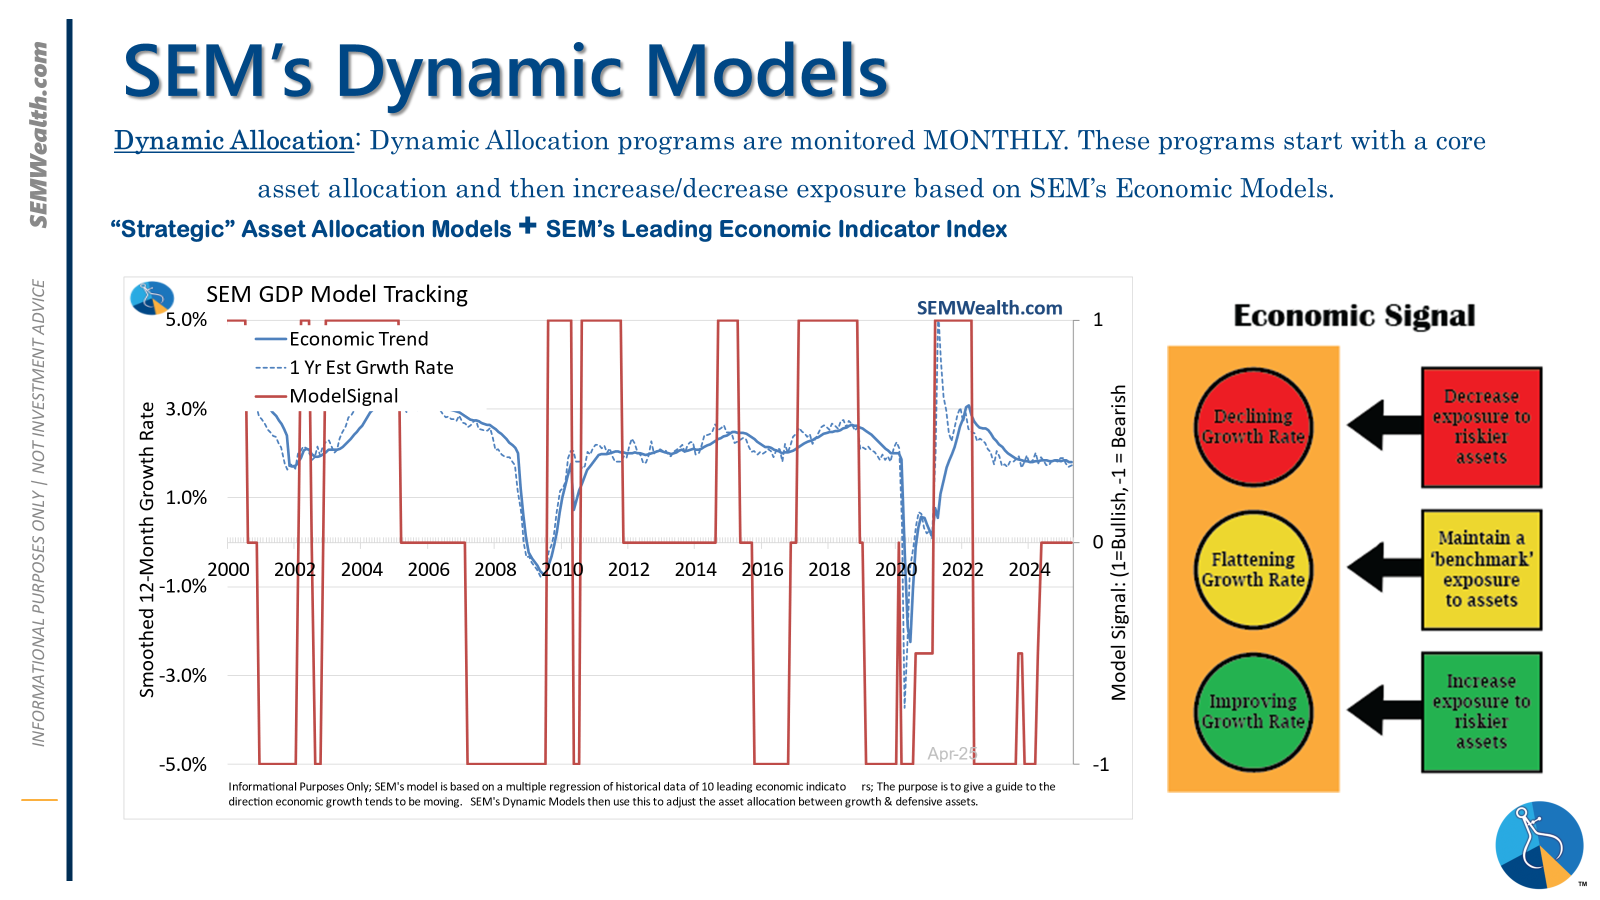
Strategic (quarterly)*: One Trend System sold on 4/4/2025
The core rotation is adjusted quarterly. On August 17 it rotated out of mid-cap growth and into small cap value. It also sold some large cap value to buy some large cap blend and growth. The large cap purchases were in actively managed funds with more diversification than the S&P 500 (banking on the market broadening out beyond the top 5-10 stocks.) On January 8 it rotated completely out of small cap value and mid-cap growth to purchase another broad (more diversified) large cap blend fund along with a Dividend Growth fund.
The * in quarterly is for the trend models. These models are watched daily but they trade infrequently based on readings of where each believe we are in the cycle. The trend systems can be susceptible to "whipsaws" as we saw with the recent sell and buy signals at the end of October and November. The goal of the systems is to miss major downturns in the market. Risks are high when the market has been stampeding higher as it has for most of 2023. This means sometimes selling too soon. As we saw with the recent trade, the systems can quickly reverse if they are wrong.
Overall, this is how our various models stack up based on the last allocation change:

Questions or comments - drop us a note?
Curious if your current investment allocation aligns with your overall objectives and risk tolerance? Take our risk questionnaire


