
Markets vs. Bison
Last week our family’s cross-country graduation road-trip covered more ground than a newly launched meme coin— from shopping at the Mall of America to white-water rafting the Yellowstone River. Somewhere between the world’s only Corn Palace and the granite faces of Mount Rushmore I was reminded how quickly scenery (and sentiment) can change. One minute you’re coasting through breathtaking vistas, the next you’re braking for a bison herd blocking the road.
[Sidenote: buffalo and bison are different animals – several guides and locals corrected us. Teenage parenting tip: keep calling them the wrong name and see how they react].
Markets have been acting the same way: breathtaking runs interrupted by headline-driven roadblocks. This week’s MMM looks at the four “bison herds” investors keep swerving around—and what happens if the animals decide not to move (or worse, decide to charge).
Headline 1 – Iran / Israel Conflict

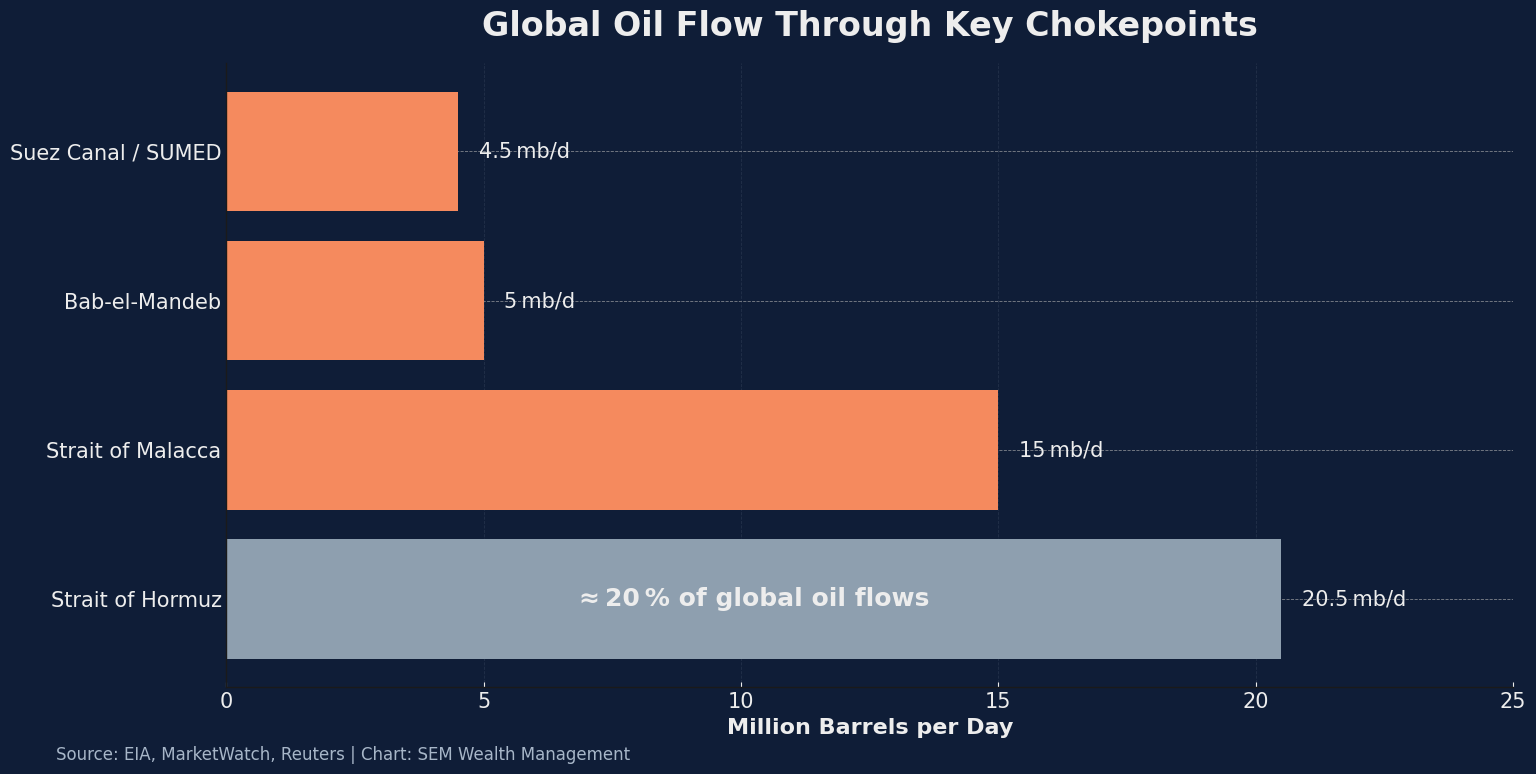
Tensions in the Middle East escalated significantly over the weekend, with reports confirming that the U.S. carried out airstrikes on three Iranian nuclear facilities in retaliation for Tehran’s increasing involvement in the Israel/Iran conflict. While the consensus view had been that Iran lacked the military strength or oil market leverage to shift global dynamics, this latest development dramatically raises the risk of a broader regional conflict. Any retaliation by Iran—or efforts to close or disrupt shipping through the Strait of Hormuz, which carries over 20% of the world’s oil—could send energy prices sharply higher and rattle financial markets. What began as a “contained” geopolitical flare-up now threatens to become a multi-front crisis, drawing in global powers and destabilizing a region critical to global supply chains and energy flows.
Consensus View: Iran’s direct military capacity remains limited, and oil markets have largely priced in regional instability, assuming containment within Israel’s borders. The U.S. involvement was expected to remain indirect and the thought this morning was the US strikes were meant to be a one-time involvement to quickly end the Iranian threat.
Risk: The U.S. strikes on Iranian nuclear facilities do mark a major escalation, potentially provoking a direct Iranian response or action by its regional proxies. A broader conflict could disrupt global energy flows—especially through the Strait of Hormuz—and lead to a sustained spike in oil prices, increased market volatility, and heightened global security concerns.
Headline 2 – Never-Ending Trade War (a.k.a. “TACO”)
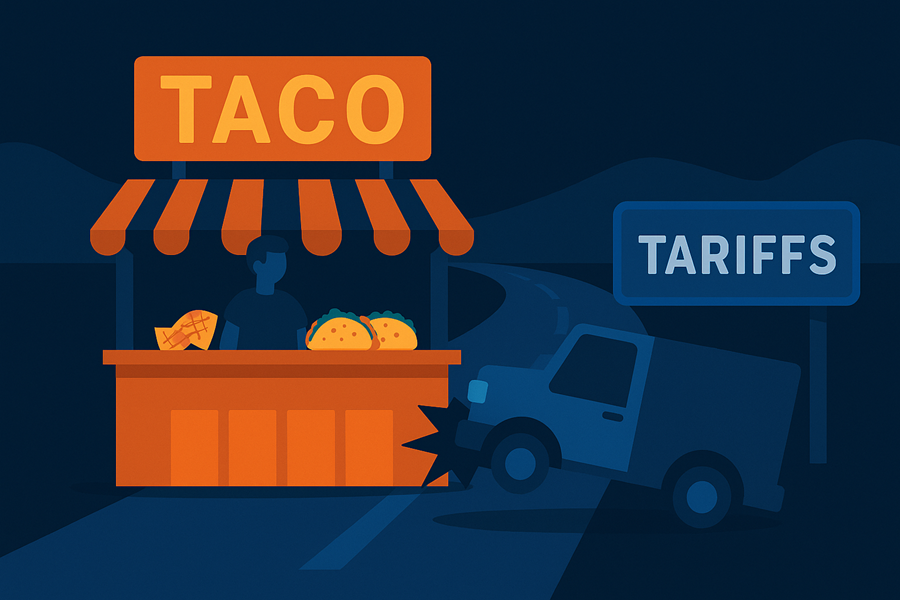
Consensus view: The President often talks tough on tariffs but eventually prioritizes market stability—hence TACO (“Trump Always Chickens Out”).
Risk: Rhetoric becomes policy. Broad-based tariffs stick, margins compress, and global supply-chain inflation returns.
Headline 3 – U.S. Debt & Deficit
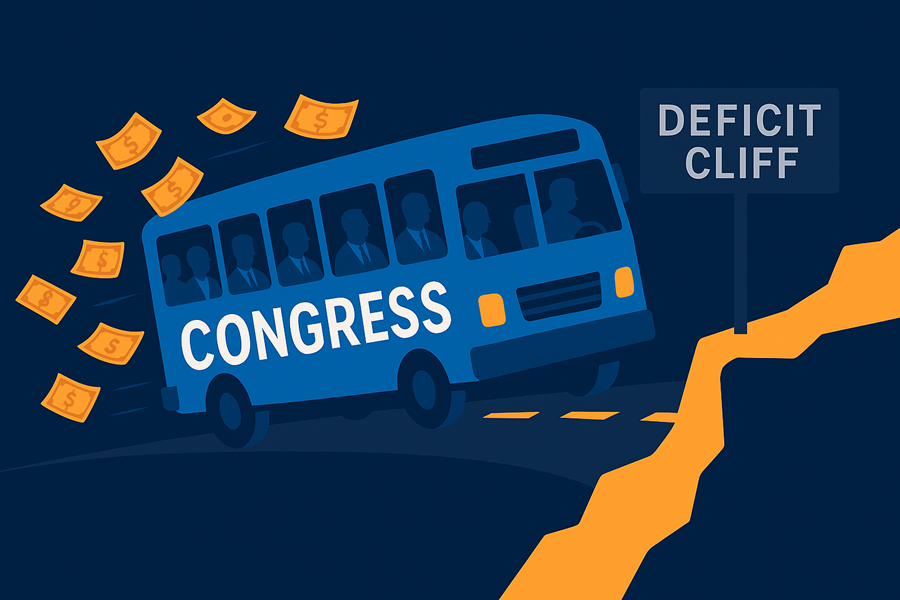
Consensus view: Demand for Treasuries remains robust; the bond market appears comfortable funding larger deficits.
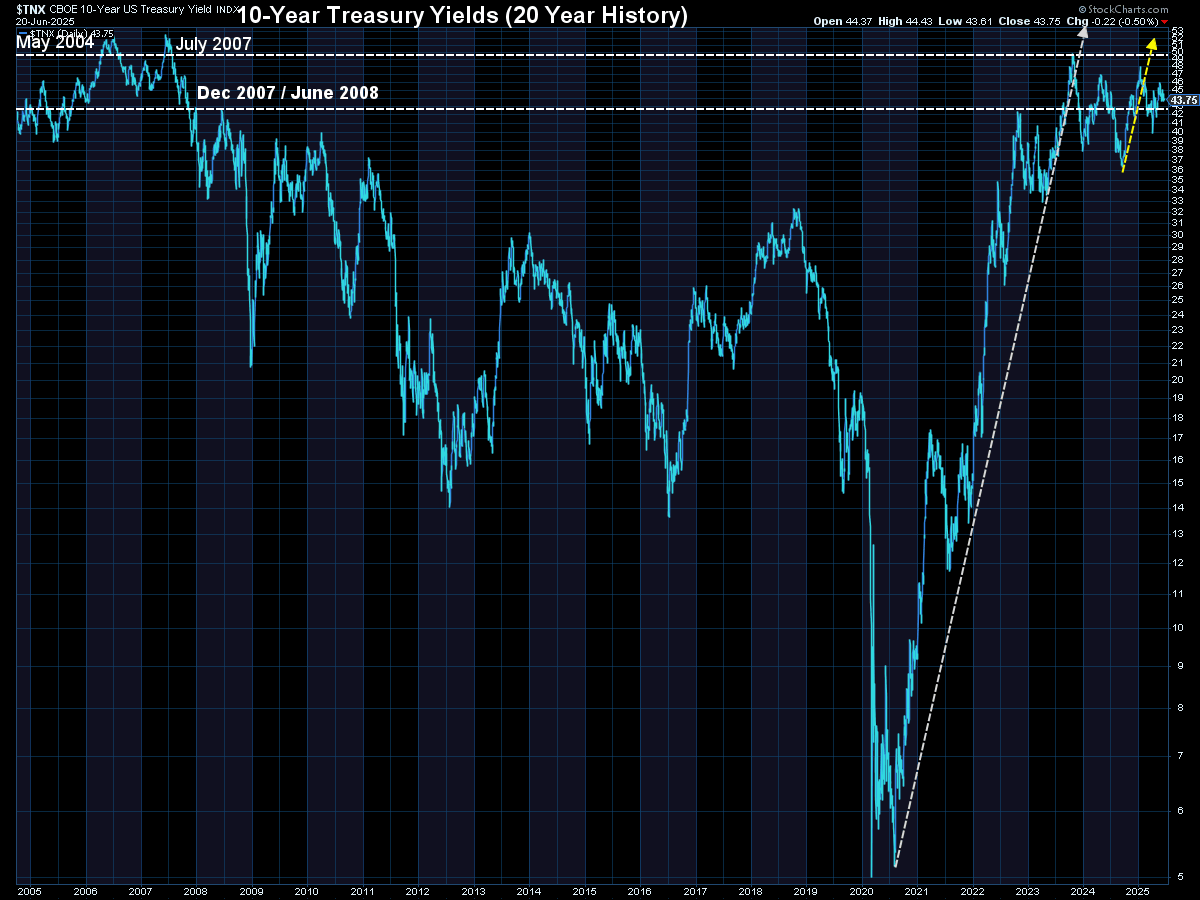
Risk: A buyers’ strike drives the 10-year yield decisively above 5 %, forcing a messy repricing across risk assets.
Headline 4 – Economic Slowdown
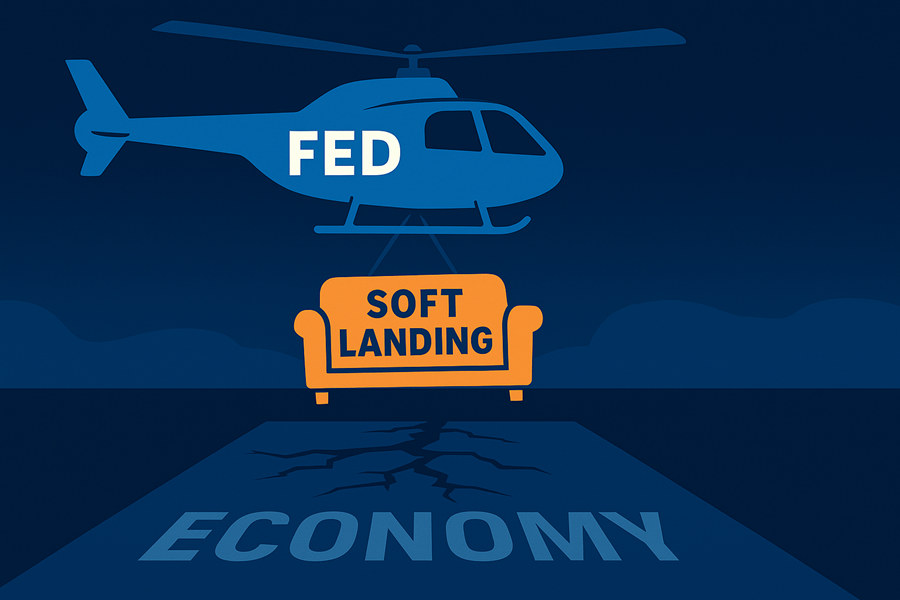
Consensus view: The U.S. economy has already dodged two recession scares in three years—resilience is the base-case.
Risk: “Soft” survey data bleeds into “hard” spending and hiring numbers, revealing that resilience was overstated.
Reminder: The SEM Economic Model went bearish a few weeks ago.
Click here for the details.
Hope is not a strategy
We truly hope these risks are things we will have forgotten a few months from now, but hope is not a strategy. One thing I’ve learned over three decades: headlines don’t matter—until suddenly they do. Markets can ignore risk stories for months, then pivot in a single session once data fails to follow the “consensus” narrative. Our models are designed for that inflection point; we’d rather take risk off the table and miss a bit of upside than bank on everything “working out.”
In Other News
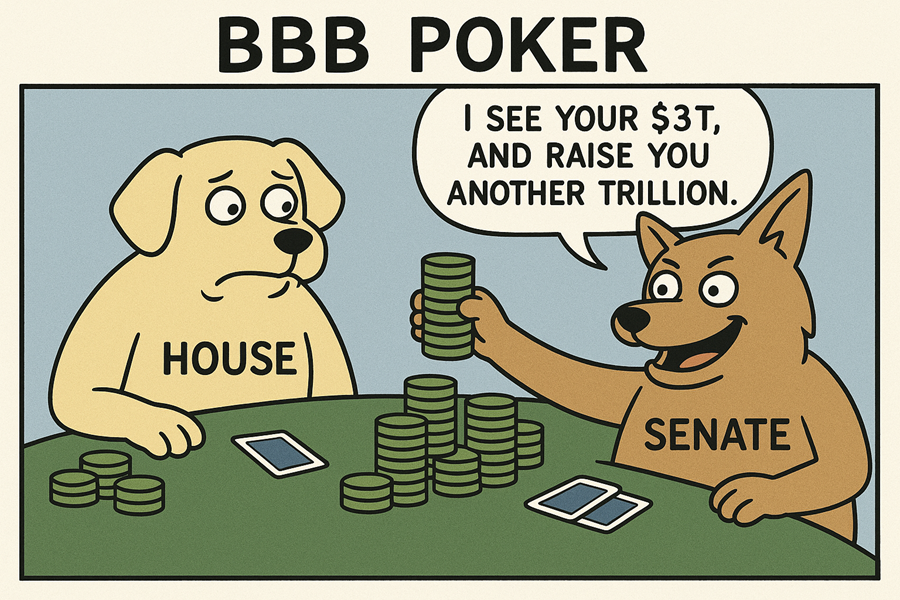
Senate BBB Outline
The Senate released its framework for the “Big Beautiful Bill.” The meme below captures the, ‘persuasive tactics’ employed to cobble together enough votes.
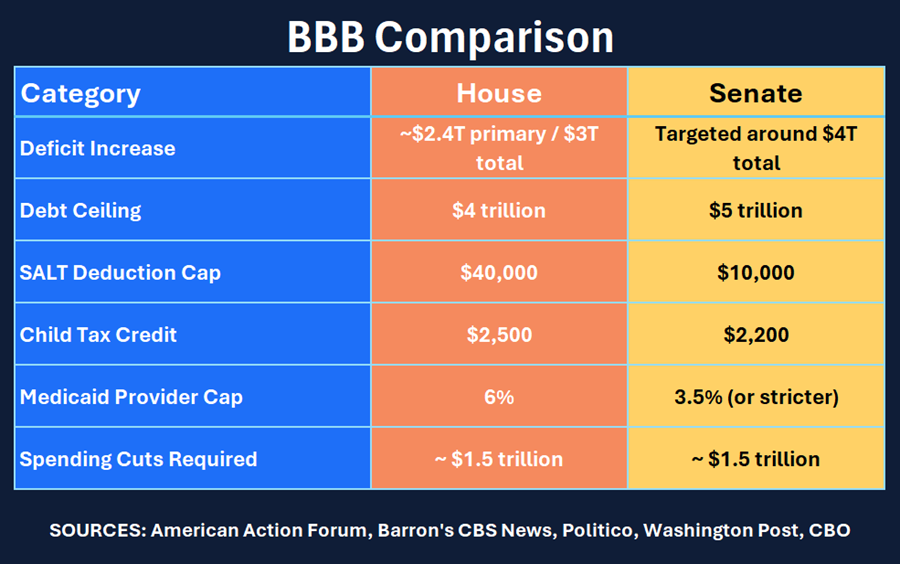
This table compares key provisions of the House-passed version with the Senate proposal.
Fed Rate Decision & Press Conference
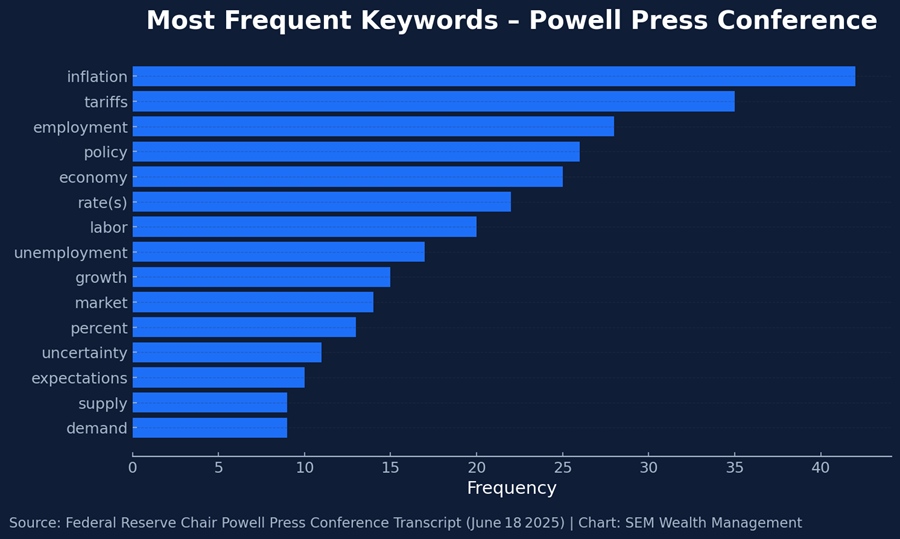
Wednesday’s FOMC meeting delivered no policy change. With the statement largely unchanged, all eyes turned to Chair Powell’s press conference. Here’s a summary of how many times he mentioned some of the key words.
Below are my take-aways on the four key topics that dominated Q&A:
1 | Tariffs

- What Powell said: “Increases in tariffs this year are likely to push up prices and weigh on economic activity … The pass-through could be short-lived, but it might also prove more persistent if expectations become unanchored.” (Source: federalreserve.gov)
- In the Q&A he underscored that the Fed now “expects a meaningful amount of tariff-driven inflation to arrive in coming months” and therefore must “wait to see the size of that pass-through before adjusting policy.” (Source: reuters.comreuters.com)
- Market take-away
- Short-run: higher headline CPI prints this summer; risk that goods-price dis-inflation stalls.
- Equity sectors with imported inputs (retail electronics, apparel) likely see margin pressure, while domestic-supply beneficiaries (U.S. steel, aluminum) could show relative strength.
- Rate-cut expectations have shifted toward September as traders wait for clarity on the tariff impulse. (Source: reuters.com)
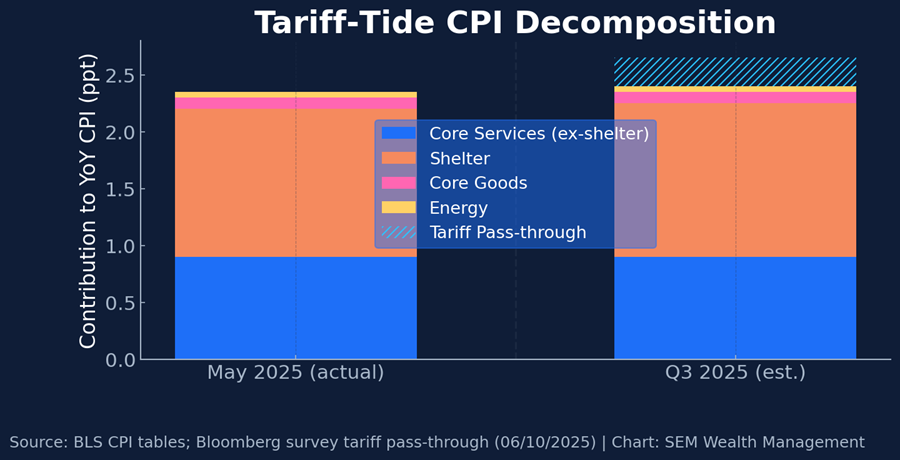
Chart explanation: Monthly CPI component tables (BLS) + consensus tariff pass-through estimates illustrating the components of inflation with the CBO estimate of price increases related to tariffs. Source: Bloomberg Survey
2 | Inflation & Monetary Policy
- Key quote: “Inflation has come down a great deal but remains somewhat above our 2 percent goal … every outside forecaster and the Fed expects a meaningful pick-up in the near term.” (Source: federalreserve.govreuters.com)
- The Summary of Economic Projections (SEP) now shows core PCE 2.6 % → 3.0 % for 2025 and only returning to 2.1 % by 2027. (Source: reuters.com)
- Policy path
- Dot-plot still pencils in two cuts in 2025 (median 3.9 % → 3.6 % by 2026) but seven officials see no cuts this year, highlighting a hawkish tilt. (Source: reuters.com)
- Powell: “No one holds these rate paths with a great deal of conviction; they’re all data-dependent.” (Source: reuters.com)
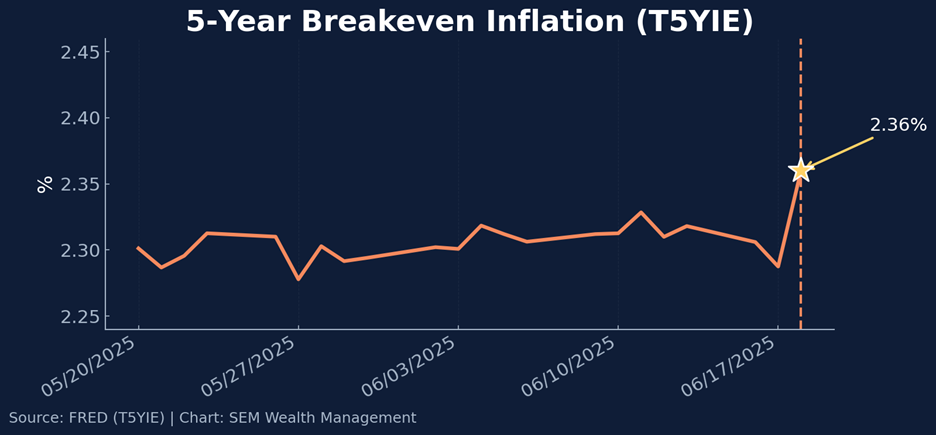
Chart explanation: Inflation expectations jumped to 2.36 % last Wednesday 6/18 immediately after Powell’s press conference —the highest since April, underscoring both the Fed’s uncertainty & their credibility risk. (Data Source: FRED)
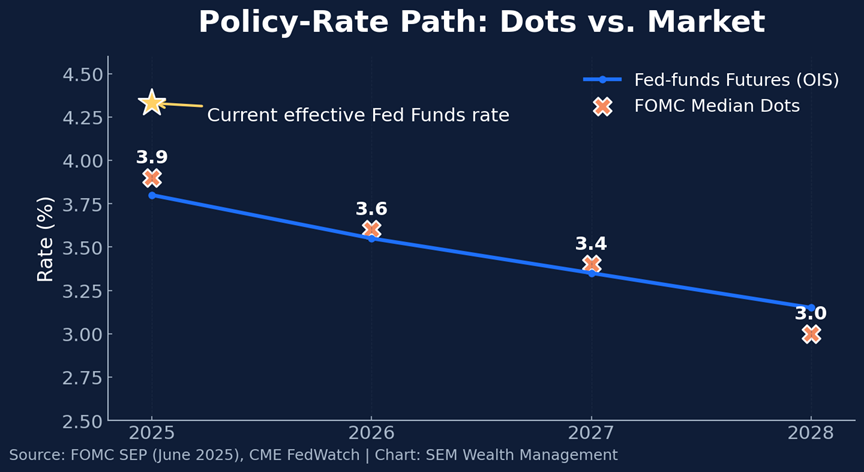
Chart explanation: June Fed SEP median dots and the market’s Option Implied Spread illustrates the market-vs-Fed gap (Market expects 2 cuts in 2025, Fed expects 1 1/2) Source: CME and Federal Reserve)
Note: On Friday, Fed Governor Christopher Waller in a speech suggested the tariff driven inflation fears are likely overblown and the Fed could cut rates again as early as next month if the data supports it. Conversely San Francisco Fed Governor Mary Daly said in an interview on CNBC after the close on Friday she believes the fall is the more appropriate time to consider cutting rates again unless the labor market falters before then. Fed futures are currently pricing in a 45% chance of a rate cut in July.
3 | Economic Growth

- Powell’s assessment: “GDP edged down in Q1, but private domestic final purchases grew a solid 2.5 %. The labor market is broadly in balance.” (Source: federalreserve.gov)
- The Fed trimmed its 2025 GDP call to 1.4 % (from 1.7 %) and lifted the unemployment projection to 4.5 %. (Source: reuters.com)
- Equity lens: Slower top-line growth with sticky inflation = profit-margin risk. Growth-sensitive cyclicals (industrials, small-caps) could lag, while secular EPS growers and low-volatility franchises keep their relative bid.
4 | Fiscal Backdrop – the “Big Beautiful Bill”
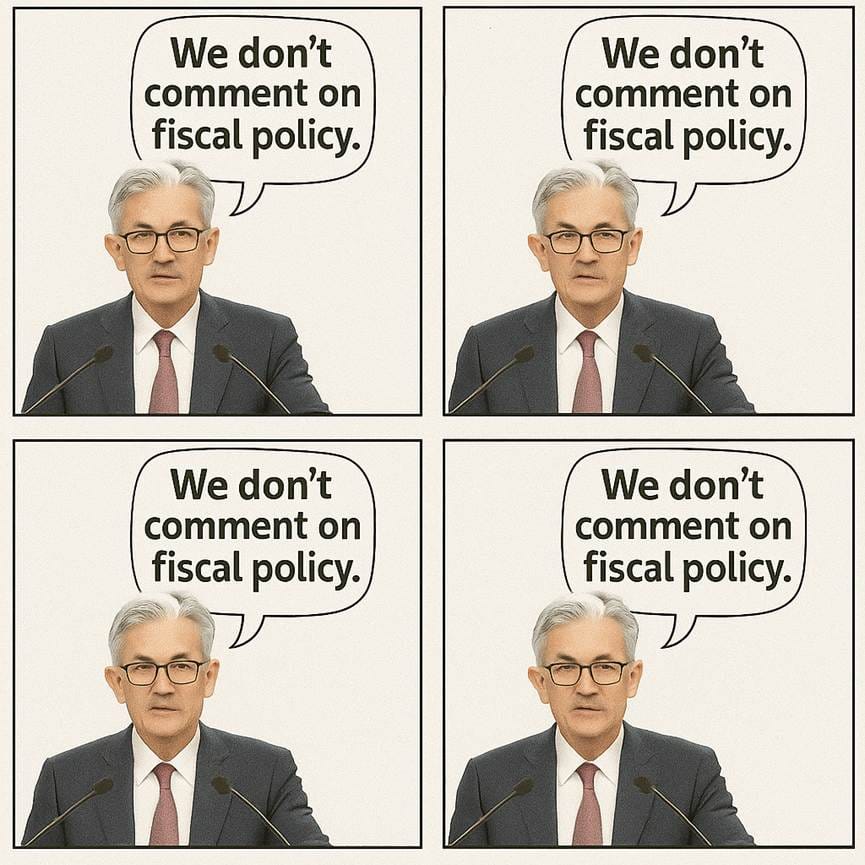
- Reporters pressed Powell on whether the proposed $2.4–3T tax-cut package would force the Fed to keep policy tighter. He reiterated the classic Fed refrain: “Fiscal policy is the province of Congress; our job is to deliver on maximum employment and price stability.” (same answer each time).
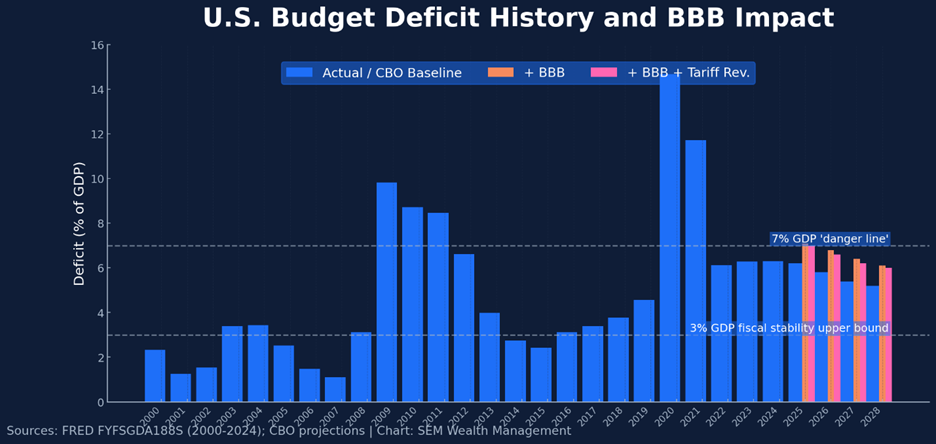
- Deficit arithmetic: CBO estimates put BBB’s 10-yr cost near 7 % of GDP, keeping the deficit above 7 %/GDP even before recessions. Markets worry that a larger term-premium could emerge in Treasuries, steepening the curve and crowding out equity risk appetite. (Source: reuters.com)
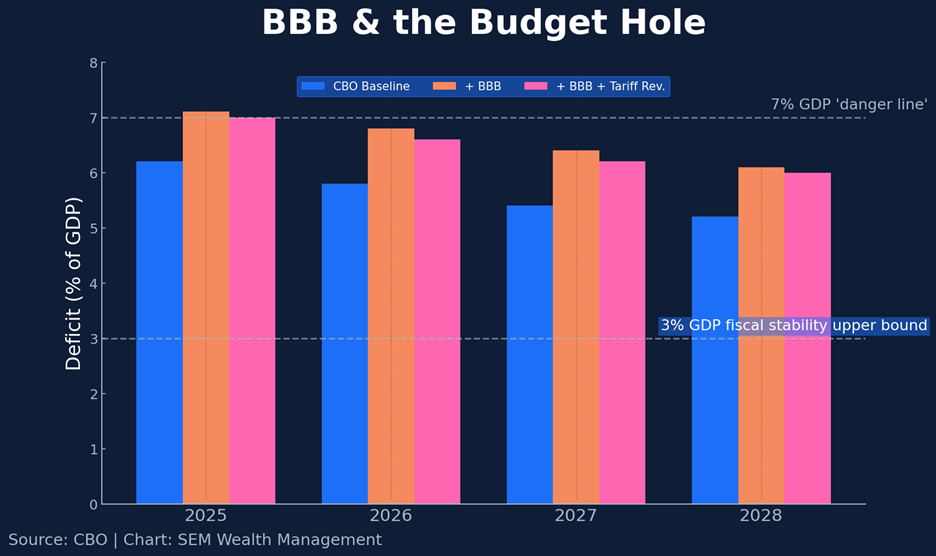
Chart explanations: Chart illustrates the CBO estimates of the current budget, the House version of the BBB as currently written, and their estimate of the impact tariff revenue could have on the budget deficit. Economists since 2010 have said in order to control our total debt levels the MAXIMUM level the deficit should hit is 3% of GDP. The 7% of GDP level is an area cited as “dangerous” as it would lead to an exponential expansion of our total debt levels, which would be unsustainable and lead to an exponential increase in debt. The last time the US was below 3% of GDP was in 2015. Since 2019 the US has been at 6% or above. (Sources: CBO, House Financial Services Archives, PGP Foundation, IMF)
Expanding this out allows us to see how much our deficit has ballooned since we ran a surplus in the late 1990s.
5 | Questions about the President
Powell fielded four direct questions about President Trump (rate-cut pressure, tariff strategy, and the BBB bill). Each time he:
- Re-asserted Fed independence,
- Deferred on fiscal specifics, and
- Stressed the data-dependent framework.
(The wording was effectively identical in every response.) (Source: reuters.com)
Market Charts
- Weekly Performance: S&P 500 −0.2 %, Nasdaq −0.5 %, Russell 2000 +0.4 %
- Best and Worst Sectors: Energy +1.1 %; Health Care −2.4 %
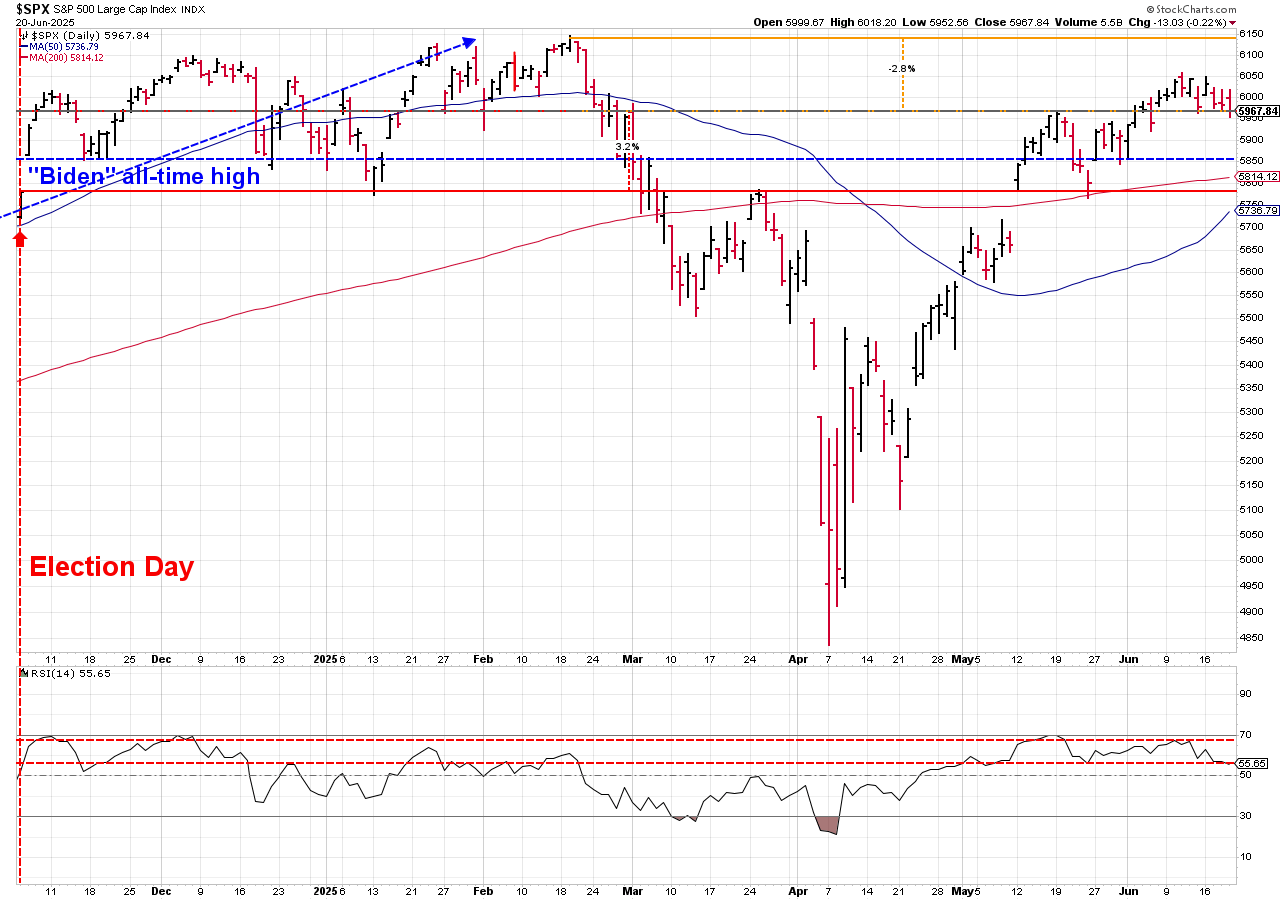
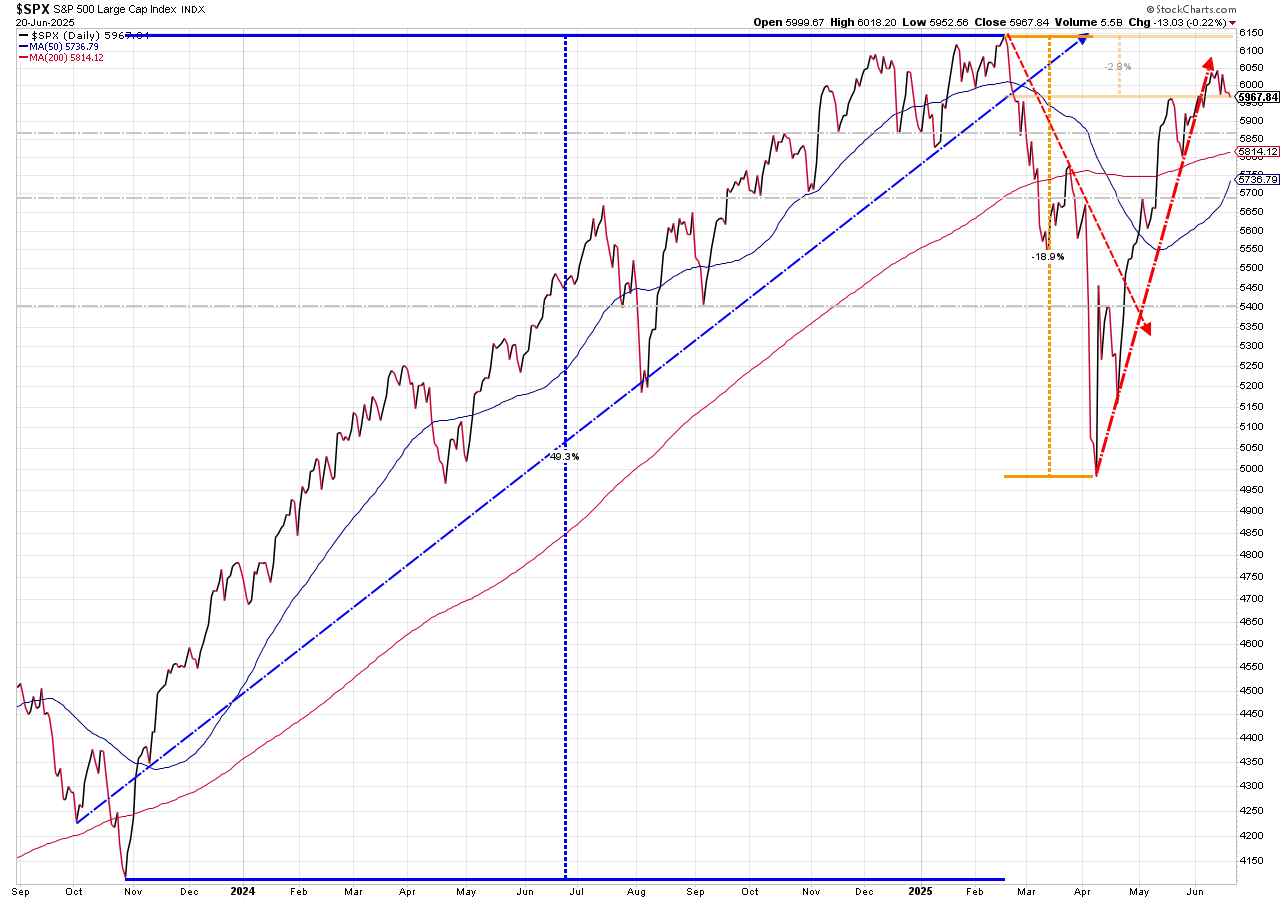
From a technical perspective, the S&P closed just 0.25% above the now flattening 21-day Moving Average(MA). This will be the first key level to watch. It is ~4 % above its rising 50-day MA (~5,736) and 3% above the 200-day (~5,814); The "death-cross" of the 50-day being below the 200-day remains. This is a sign of a longer-term downtrend developing. RSI drifted toward neutral at 55 and failed to confirm the recent rally (a bearish divergence).
Bonds remain in their very wide trading range, with yields on the 10-year drifting lower to end the week.
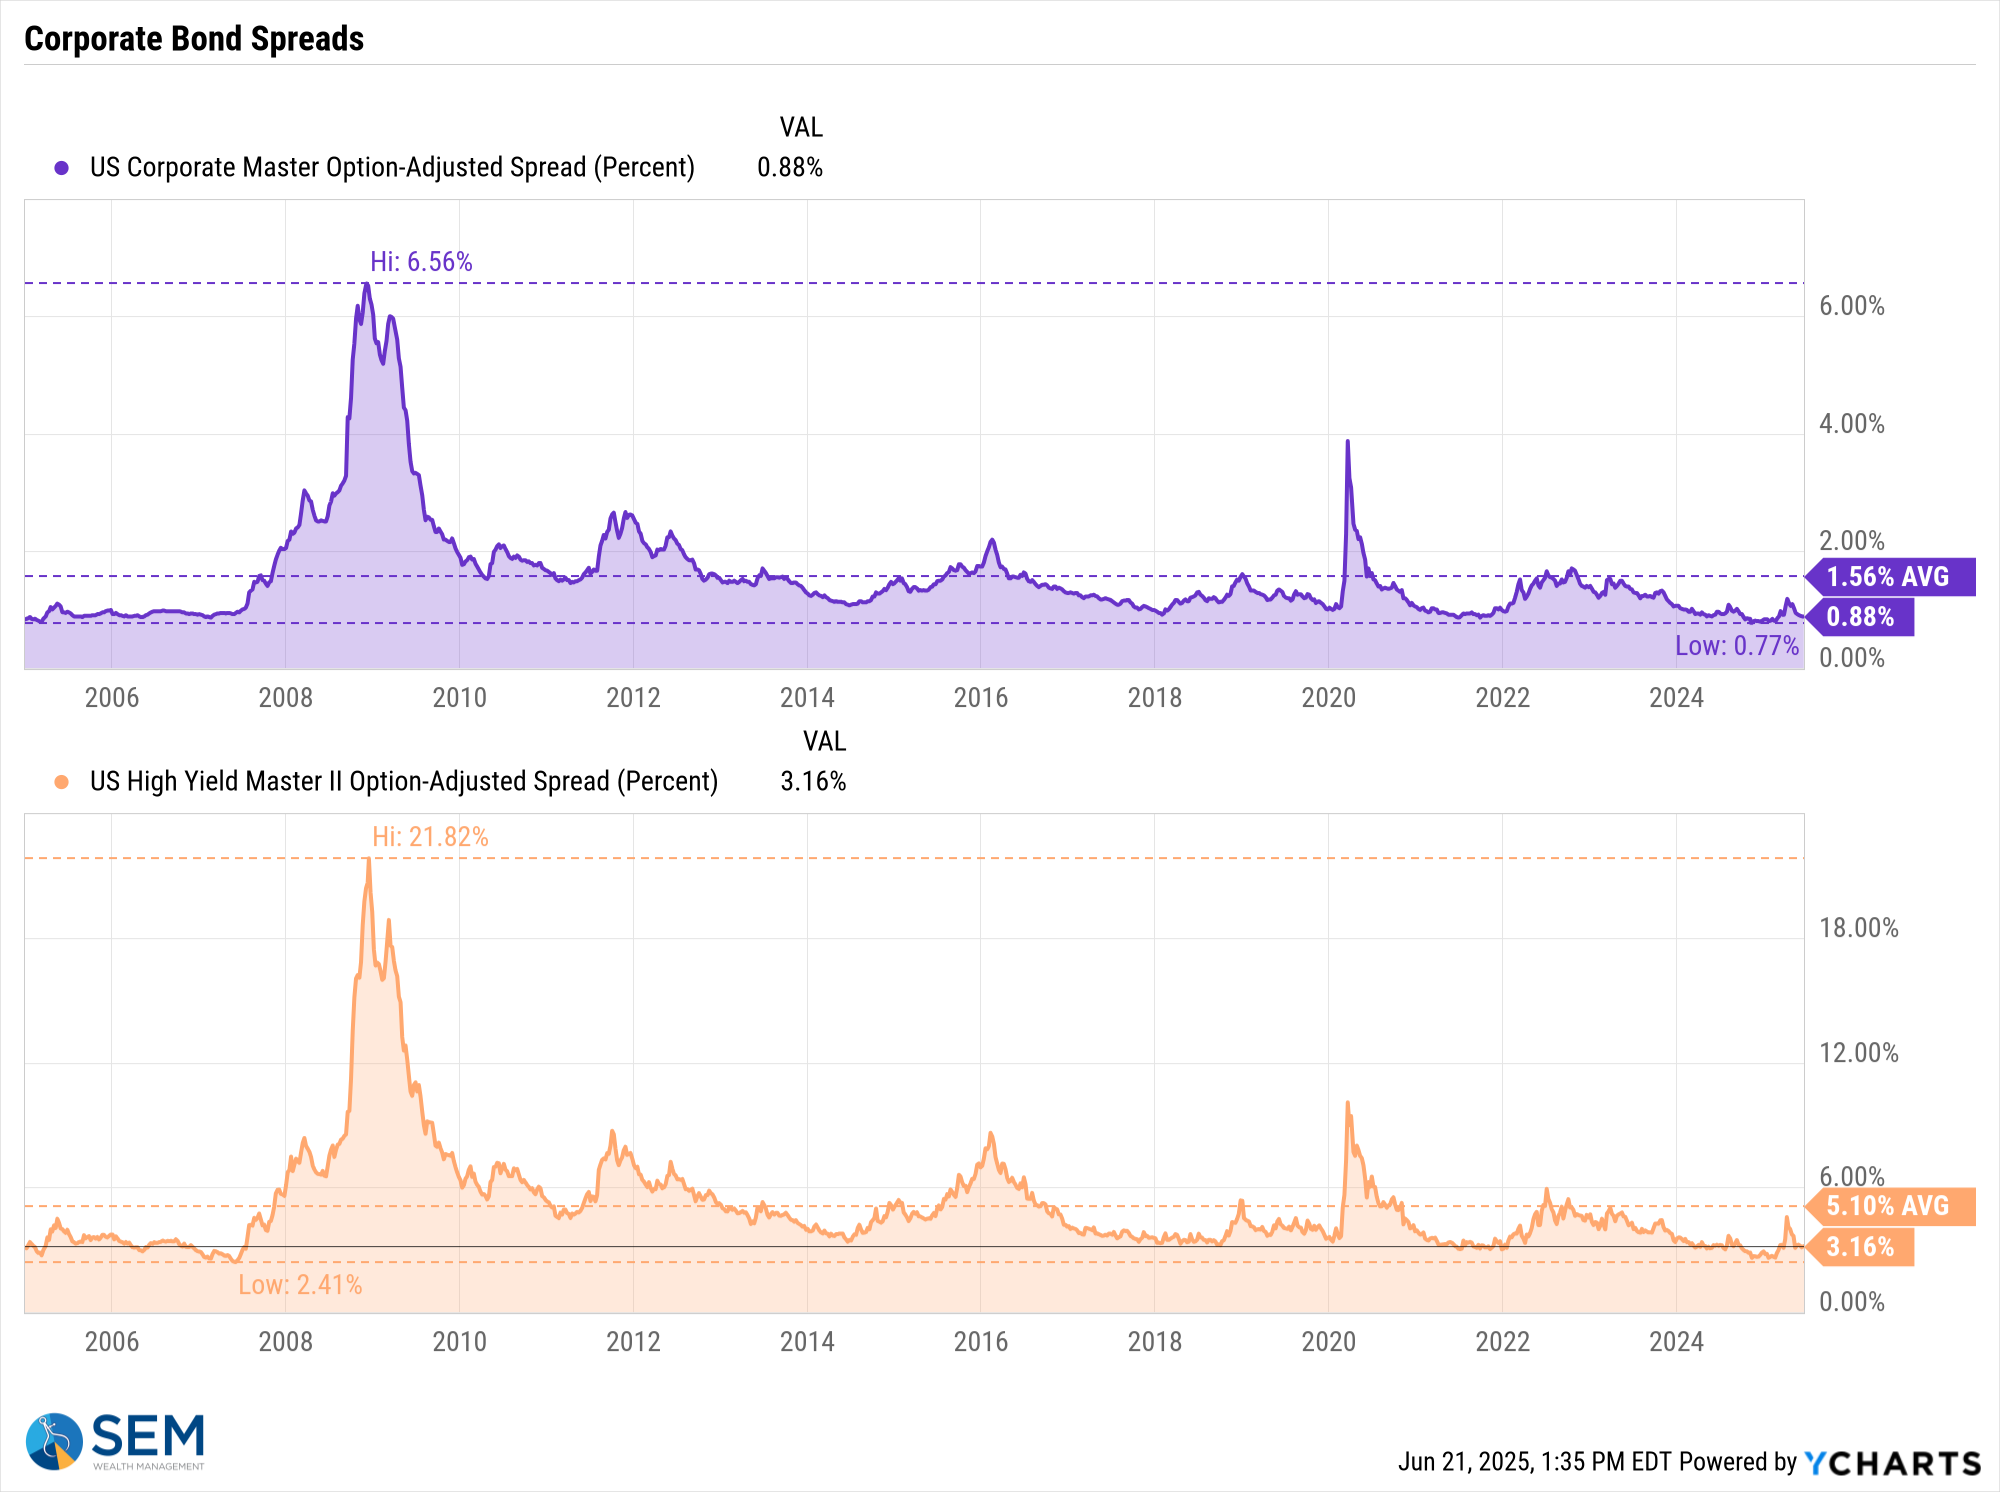
Bond spreads moved lower for the week.
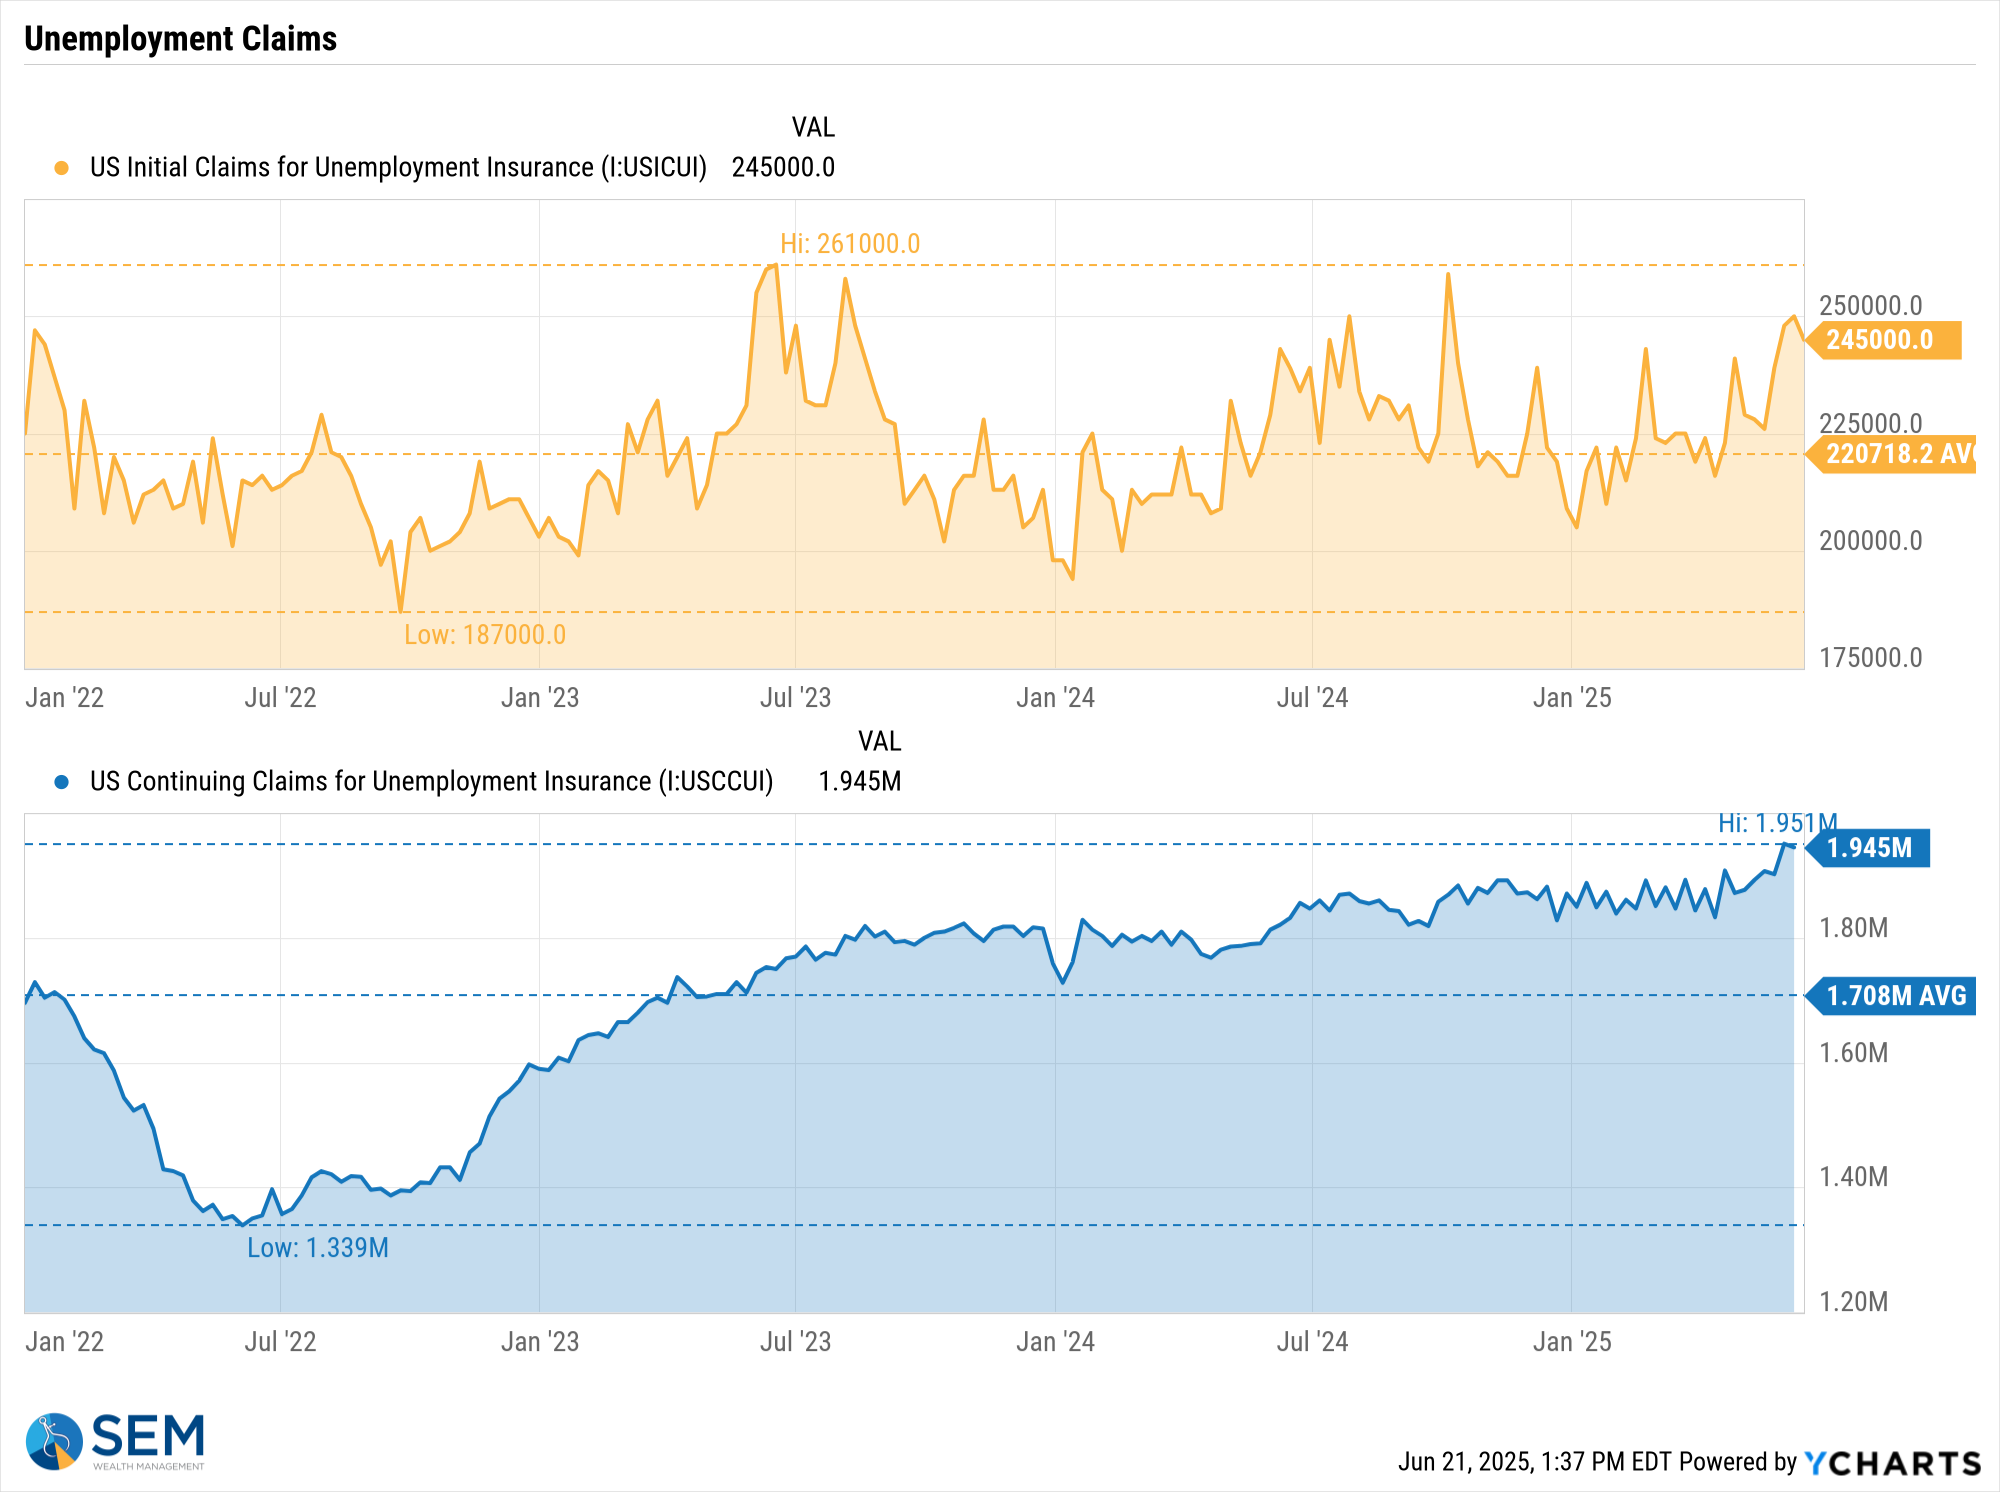
Initial unemployment claims fell slightly, but continuing claims hit another new cycle high.
SEM Market Positioning
| Model Style | Current Stance | Notes |
|---|---|---|
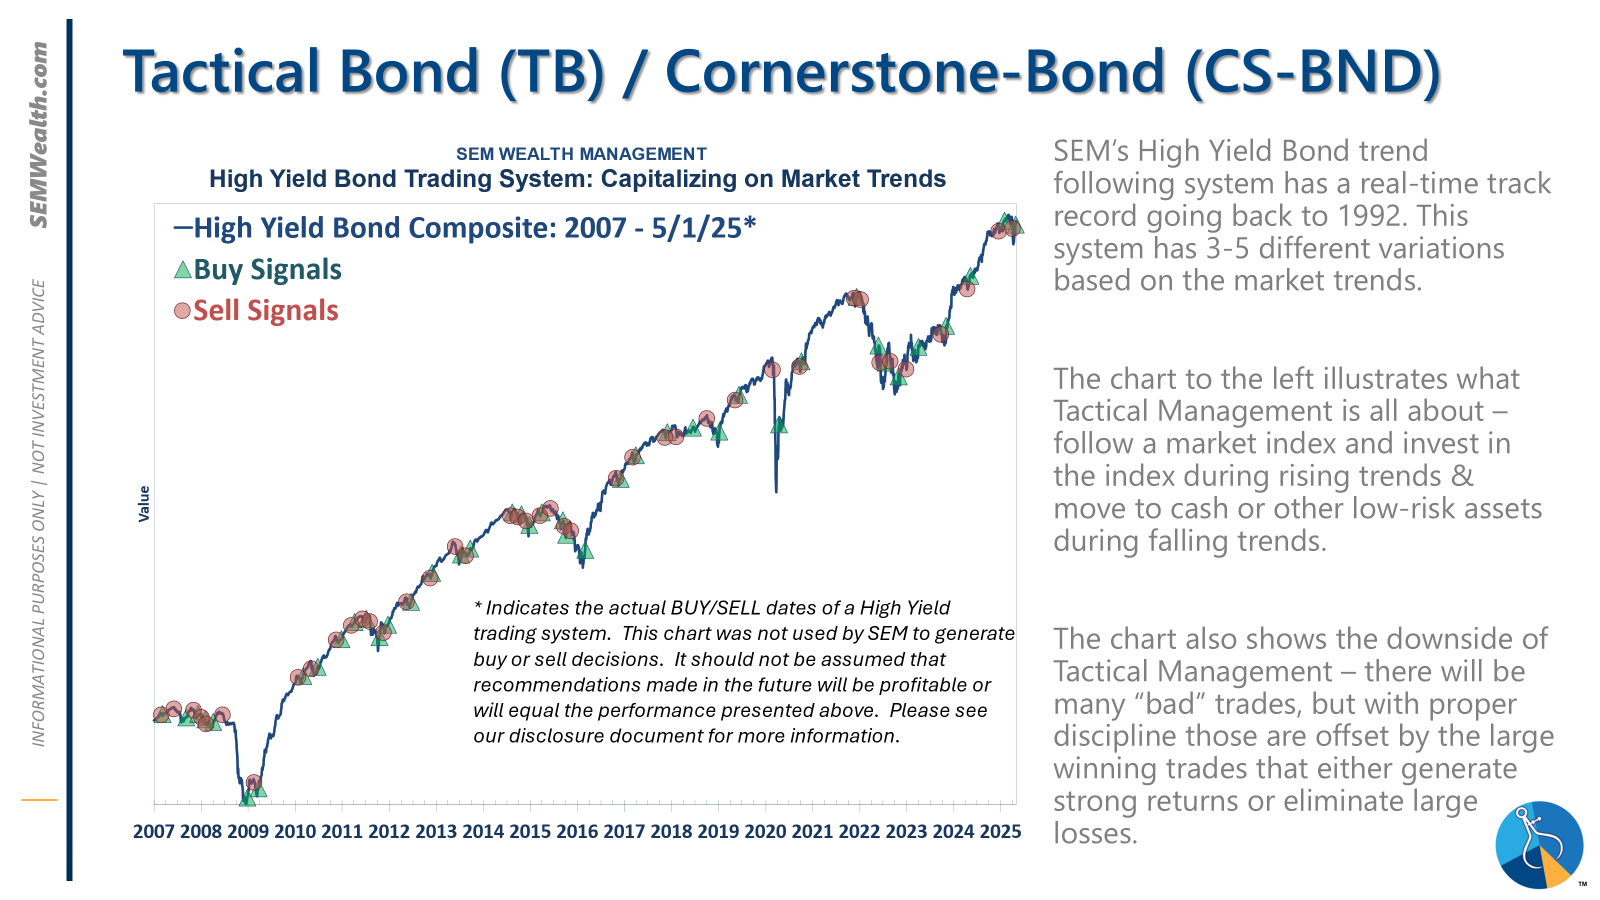
| Tactical | 100% high yield | High-yield spreads holding, but trend is slowing-watching closely |
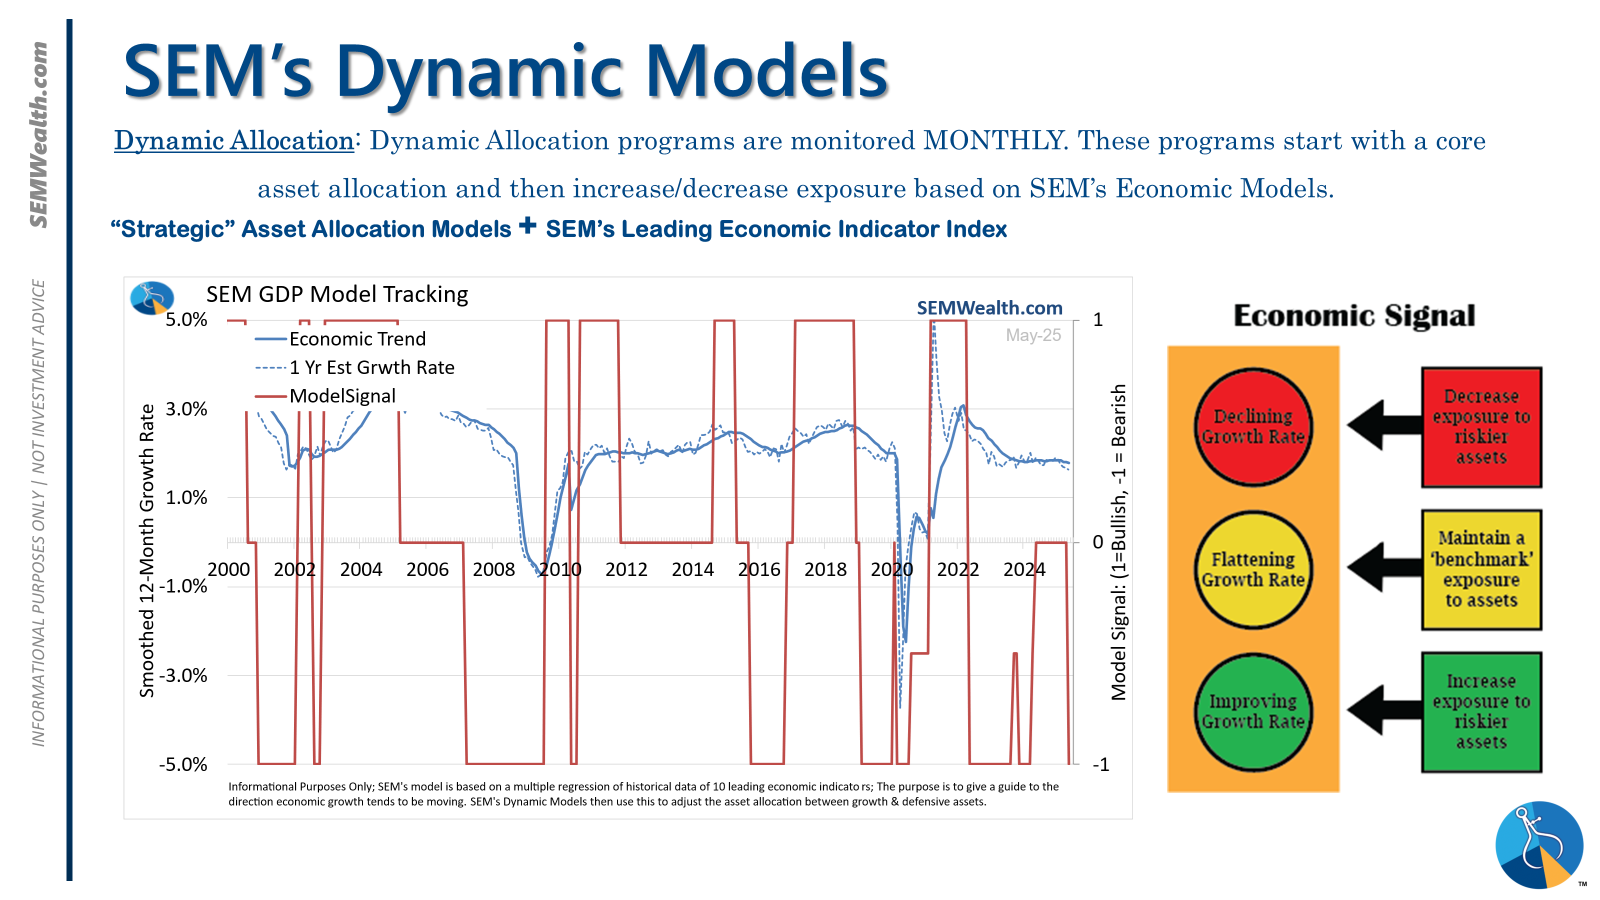
| Dynamic | Bearish | Economic model turned red – leaning defensive |
| Strategic | Slight under-weight | Trend overlay shaved 10 % equity in April -- waiting for signs of broadening before re-entry |
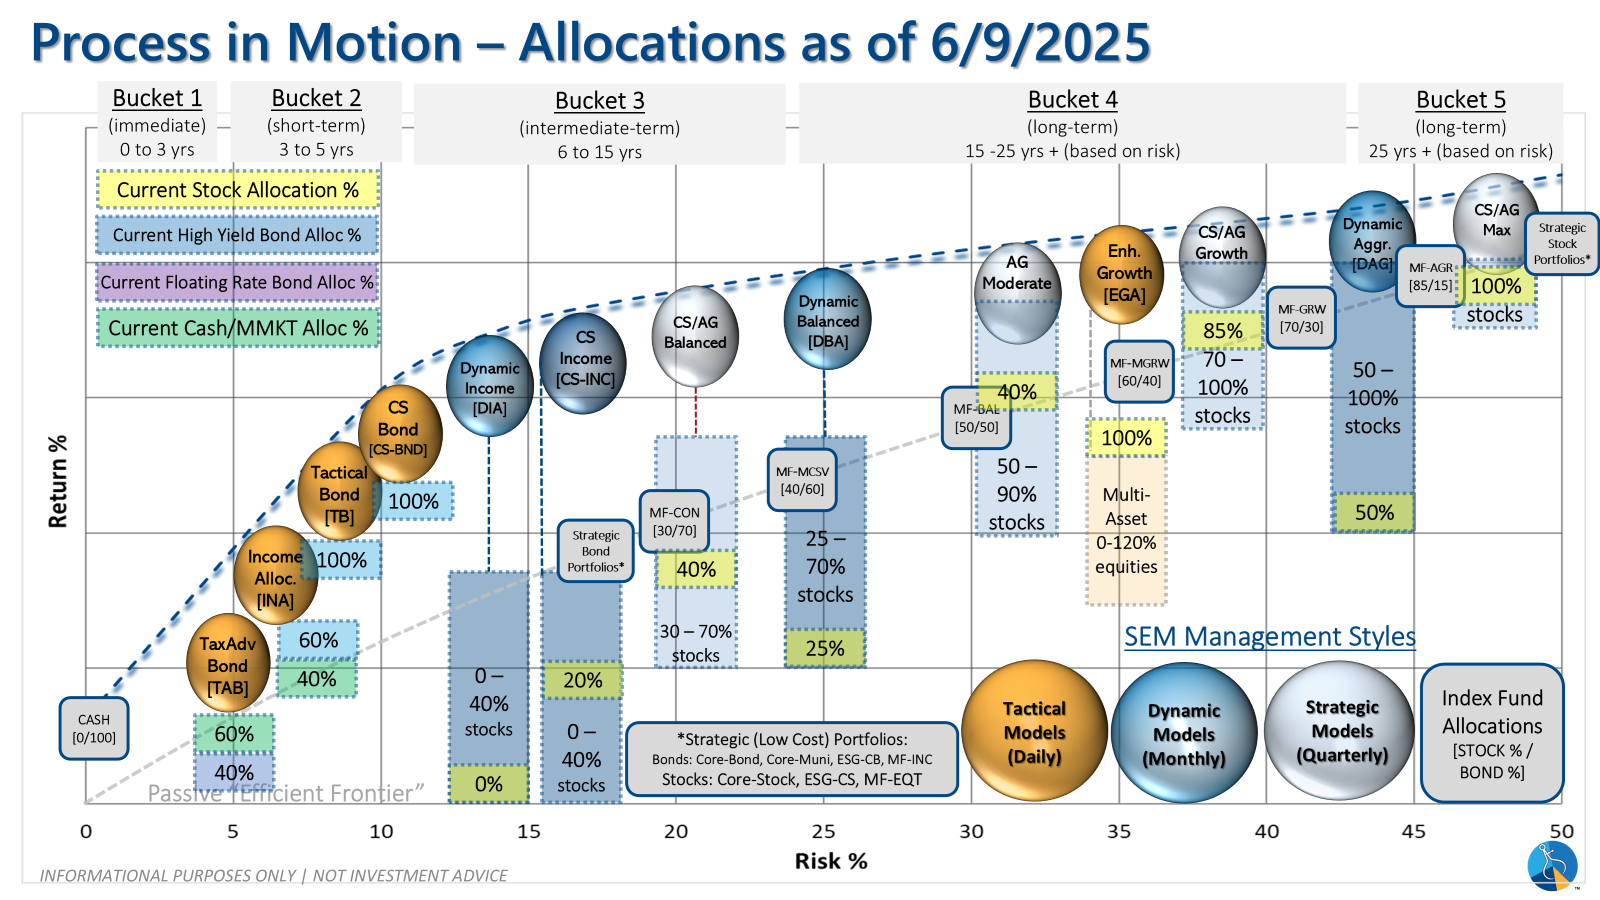
SEM deploys 3 distinct approaches – Tactical, Dynamic, and Strategic. These systems have been described as 'daily, monthly, quarterly' given how often they may make adjustments. Here is where they each stand.
Tactical (daily): On 4/3/2025 our tactical high yield model sold out of high yield bond into money market.
Dynamic (monthly): The economic model went 'bearish' in June 2025 after being 'neutral' for 11 months. This means eliminating risky assets – sell the 20% dividend stocks in Dynamic Income and the 20% small cap stocks in Dynamic Aggressive Growth. The interest rate model is 'neutral' meaning low duration/money market investments for the bulk of the bonds.
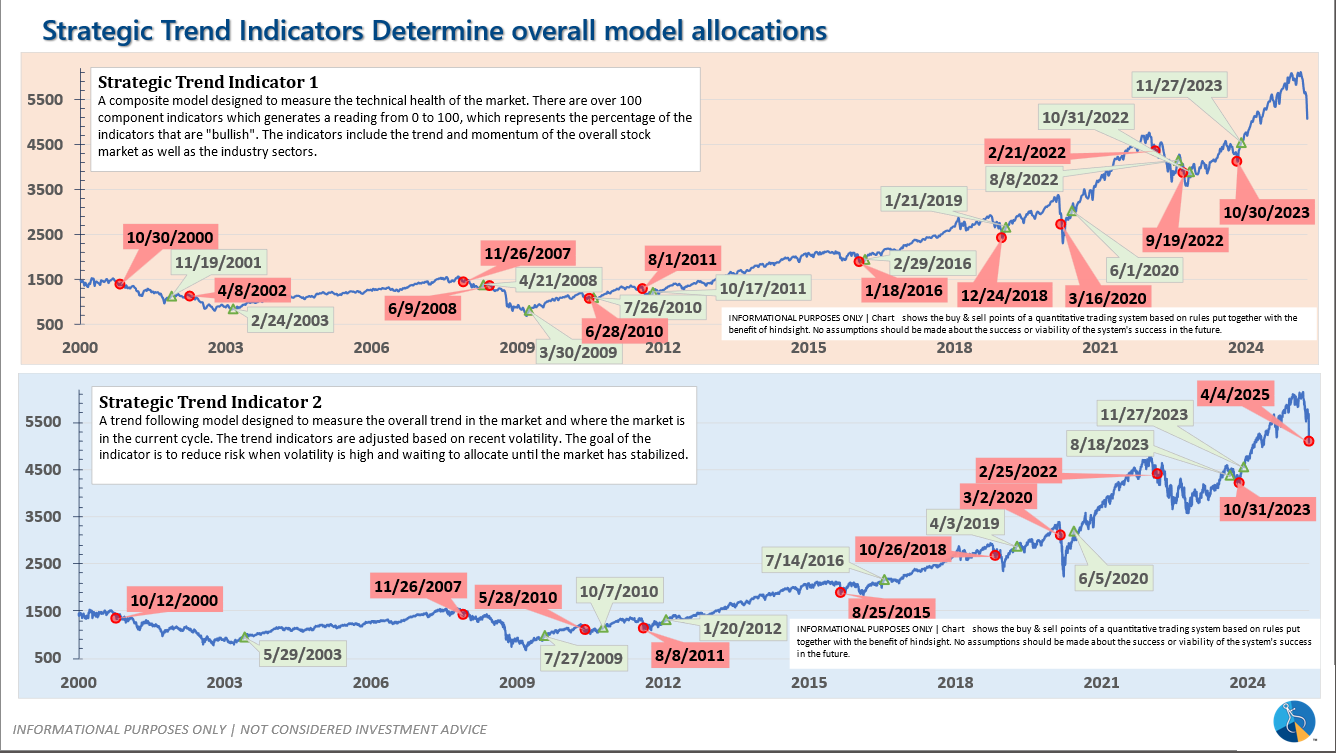
Strategic (quarterly)*: One Trend System sold on 4/4/2025
The core rotation is adjusted quarterly. On August 17 it rotated out of mid-cap growth and into small cap value. It also sold some large cap value to buy some large cap blend and growth. The large cap purchases were in actively managed funds with more diversification than the S&P 500 (banking on the market broadening out beyond the top 5-10 stocks.) On January 8 it rotated completely out of small cap value and mid-cap growth to purchase another broad (more diversified) large cap blend fund along with a Dividend Growth fund.
The * in quarterly is for the trend models. These models are watched daily but they trade infrequently based on readings of where each believe we are in the cycle. The trend systems can be susceptible to "whipsaws" as we saw with the recent sell and buy signals at the end of October and November. The goal of the systems is to miss major downturns in the market. Risks are high when the market has been stampeding higher as it has for most of 2023. This means sometimes selling too soon. As we saw with the recent trade, the systems can quickly reverse if they are wrong.
Overall, this is how our various models stack up based on the last allocation change:
Curious if your current investment allocation aligns with your overall objectives and risk tolerance? Take our risk questionnaire
We manage risk so advisors can focus on planning.
Questions or comments - drop us a note?
© 2025 SEM Wealth Management


