
Historic rally continues, with seemingly nothing standing in the way
Like a sprinter who suddenly finds a moving sidewalk underfoot, the market raced through the last full week of July with an extra jolt of speed it didn’t seem to need. Hints of a tariff truce with Europe, fresh murmurs of a friendlier Fed, and Google's blockbuster cloud numbers provided the tailwind, propelling the major indexes to yet another set of records. Even a slide in business-equipment orders and Intel’s stark “maybe-we-exit foundry” warning felt more like road gravel than real speed bumps, quickly swept aside by the momentum of AI optimism and policy hope. With that backdrop, here are the five headlines that caught my eye last week:
1. Trade-deal buzz pushes indexes to fresh records 🏅
What happened: Hopes for a Japan-style tariff truce with the European Union — plus confirmation of a signed U.S.–Japan pact — powered the S&P 500 and Nasdaq to record closes mid-week. (Source: Reuters) On Sunday the EU & US announced a deal that appeared to be a "best case scenario" for the US according to most analysts. A 15% across the board tariff on EU goods (lowering the 25% that was being charged on autos), with the exception of EU steel, which remains at 50%. (Source: BBC)
Why it matters: Fewer tariff surprises mean steadier input costs for manufacturers and a clearer backdrop for long-term financial plans your clients count on. We only have a few more "big deals" to complete before this becomes a tailwind to the stock market.
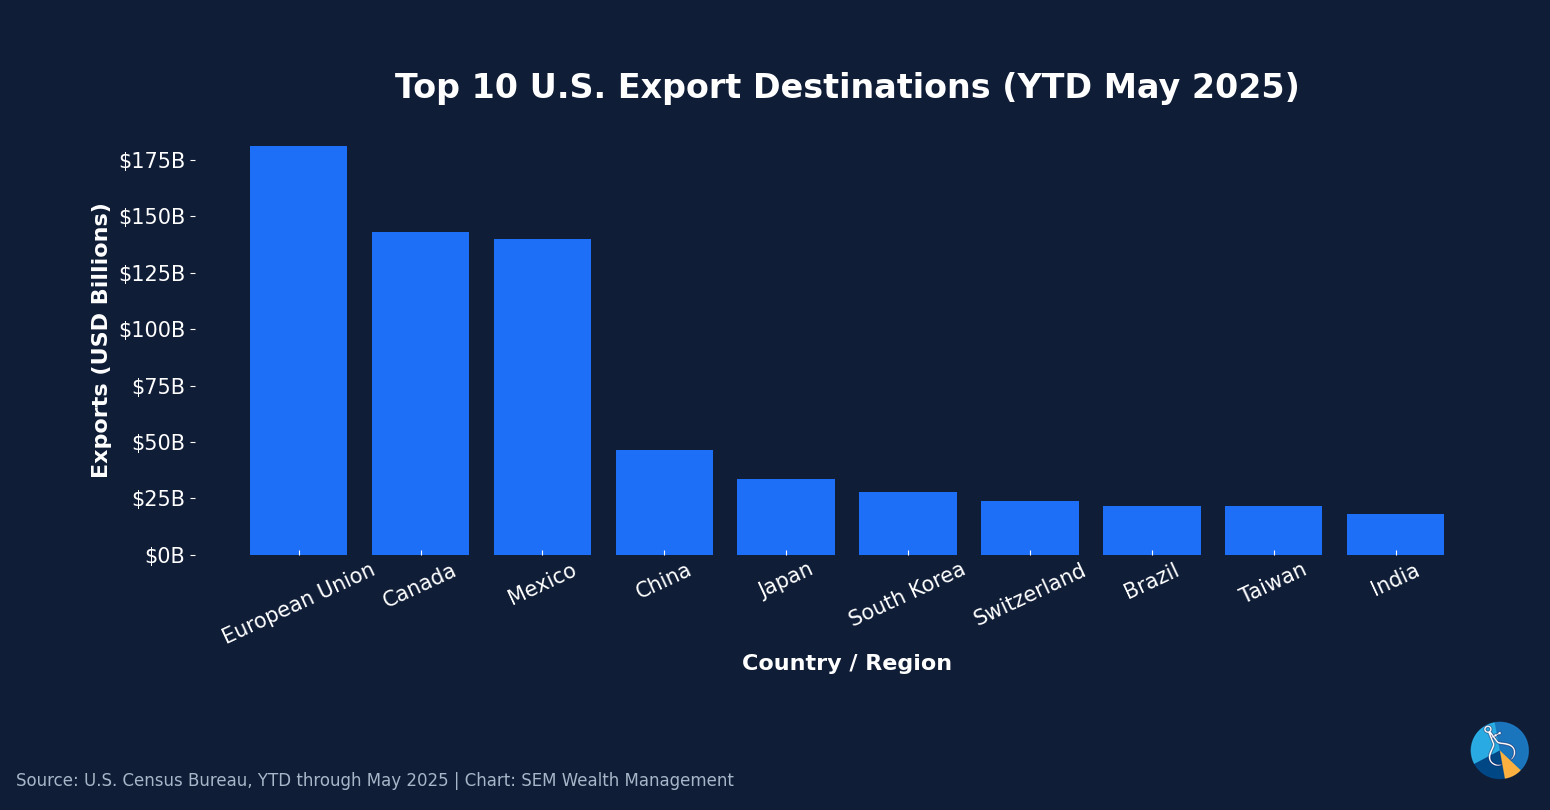
In terms of which countries are the most important trading partners (in terms of buying our "stuff"), we can see how critical the EU (along with Canada and Mexico) are. The Japan deal is "nice", but the EU deal is the most important so far. Canada, Mexico, and China will be the final 3 deals that need to be completed.
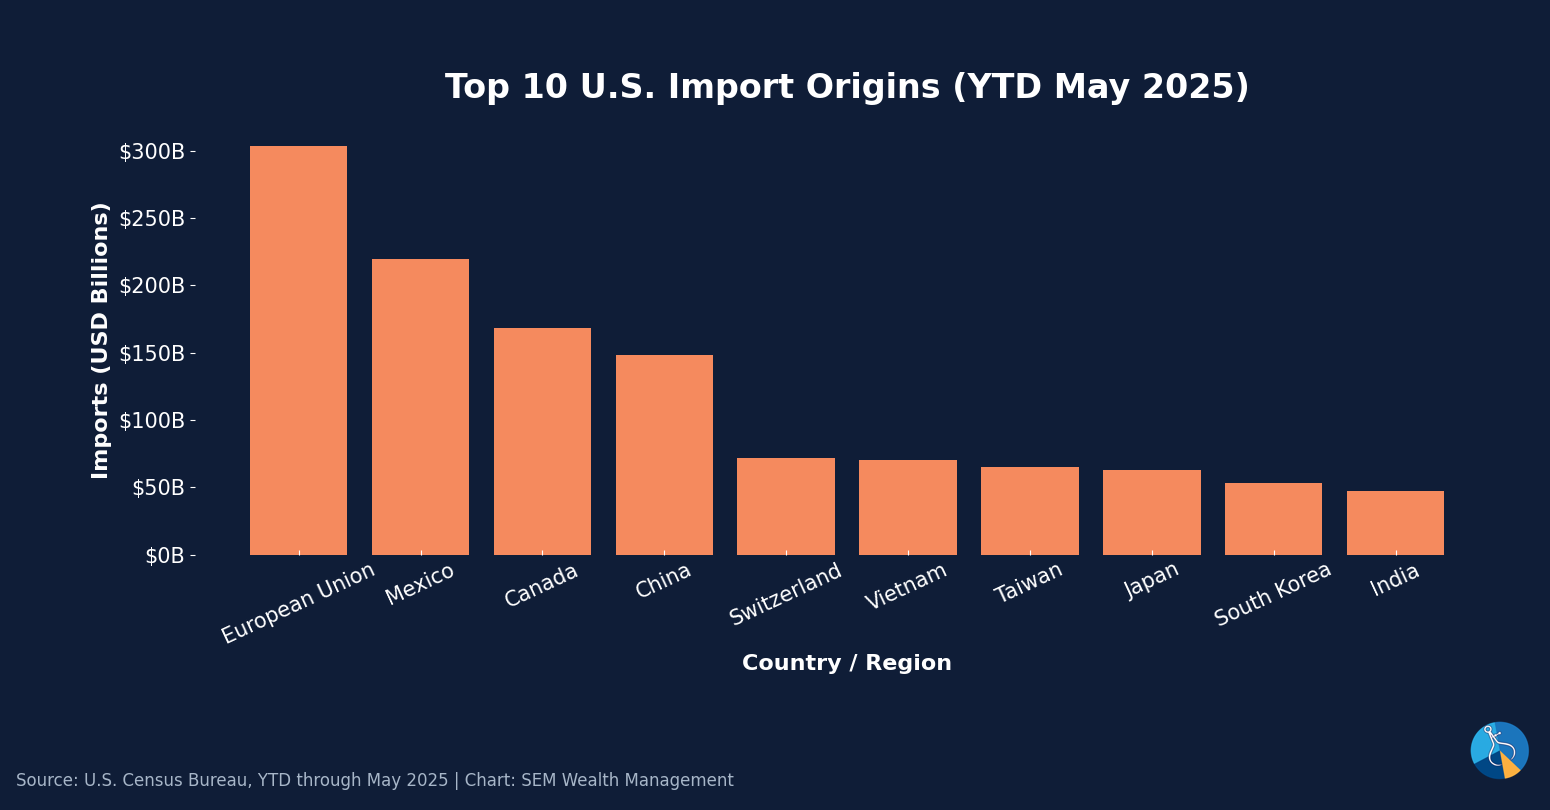
When we turn to where we buy "stuff" the players are nearly the same.
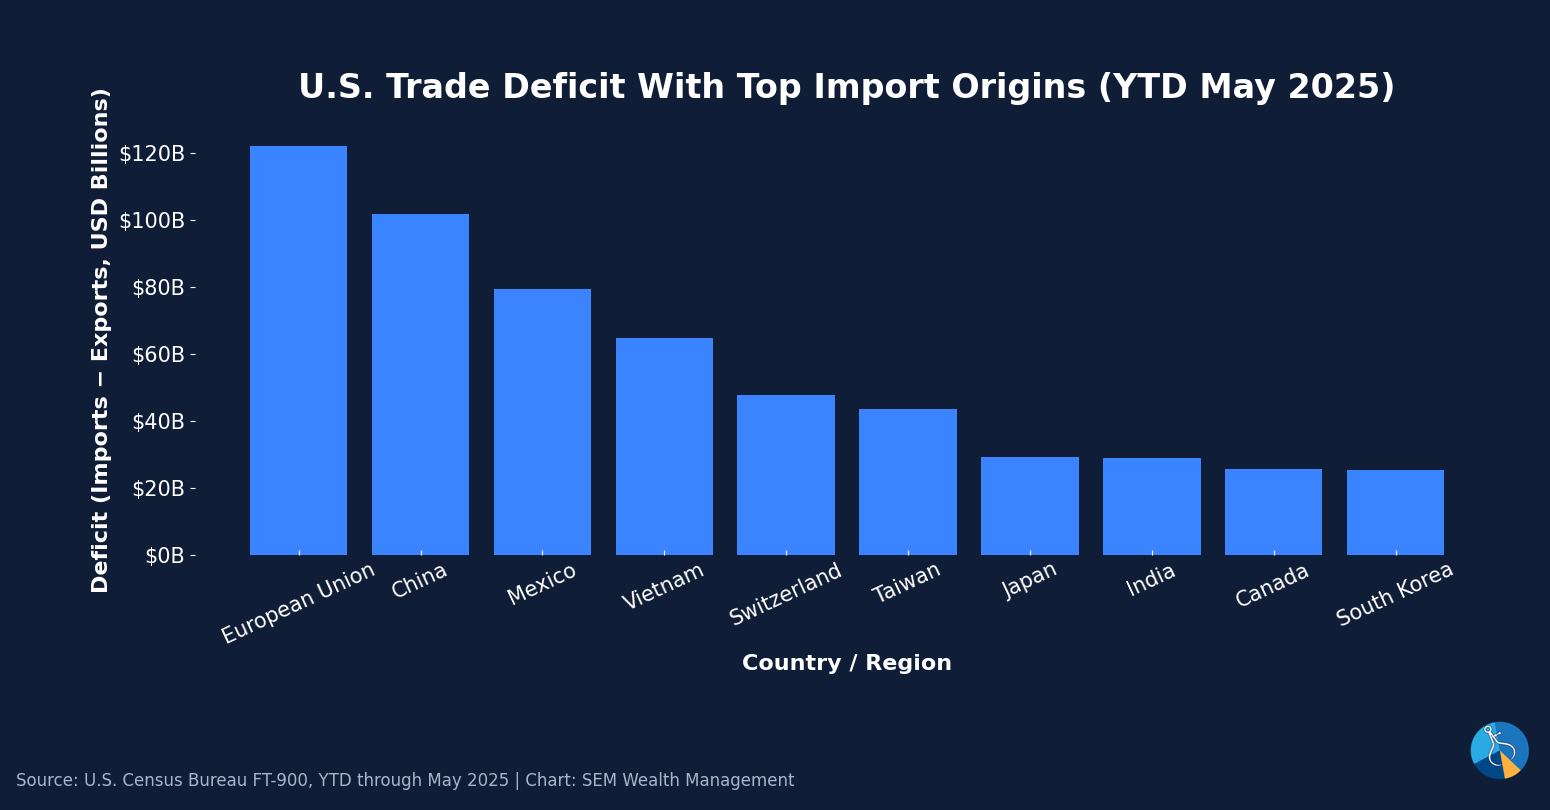
Summing these numbers up, you can also see the problem trying to be solved — we run a trade deficit with every single country.
2. Trump hints the Fed is warming to rate cuts 🏦
What happened: After a very rare visit to Fed HQ (Ford was the last President to visit the Fed's Headquarters), which included an awkward exchange of Trump presenting some data on the project's cost overruns followed by Chair Powell handing it back and saying that includes a building completed 5 years ago. The two then went on to meet in private. Following the meeting, President Trump told reporters Chair Powell “could be ready” to lower rates, stoking market odds of a cut as early as September. (Source: Reuters)
Why it matters: Even the possibility of cheaper money supports housing, business borrowing, and equity valuations — key things to consider as we evaluate investment options the back half of the year. We won't have to wait long – the Fed completes a 2-day meeting on Wednesday.
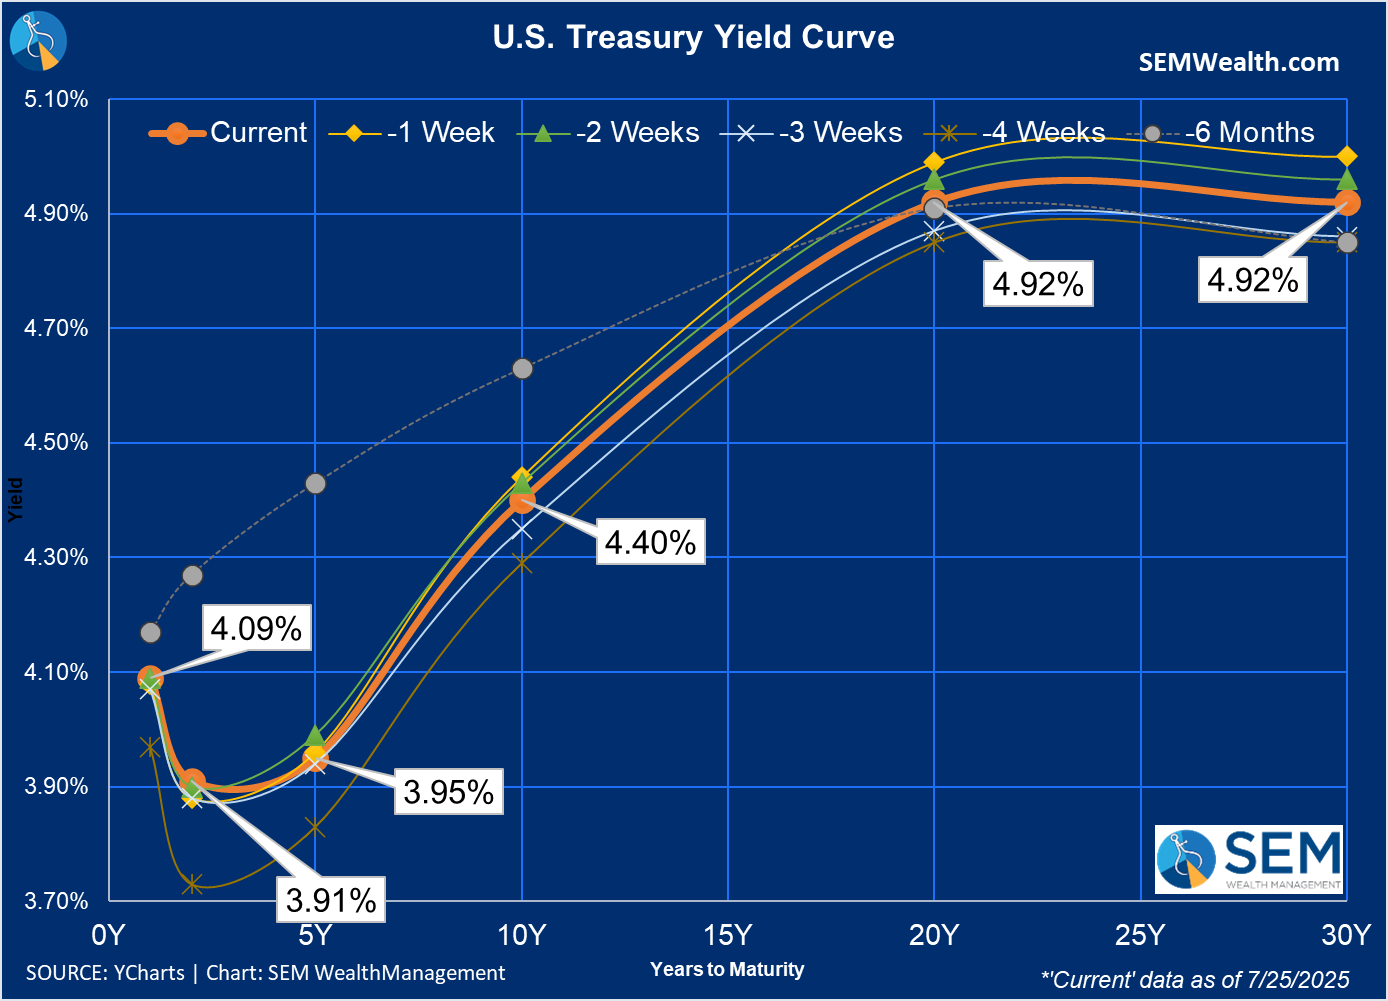
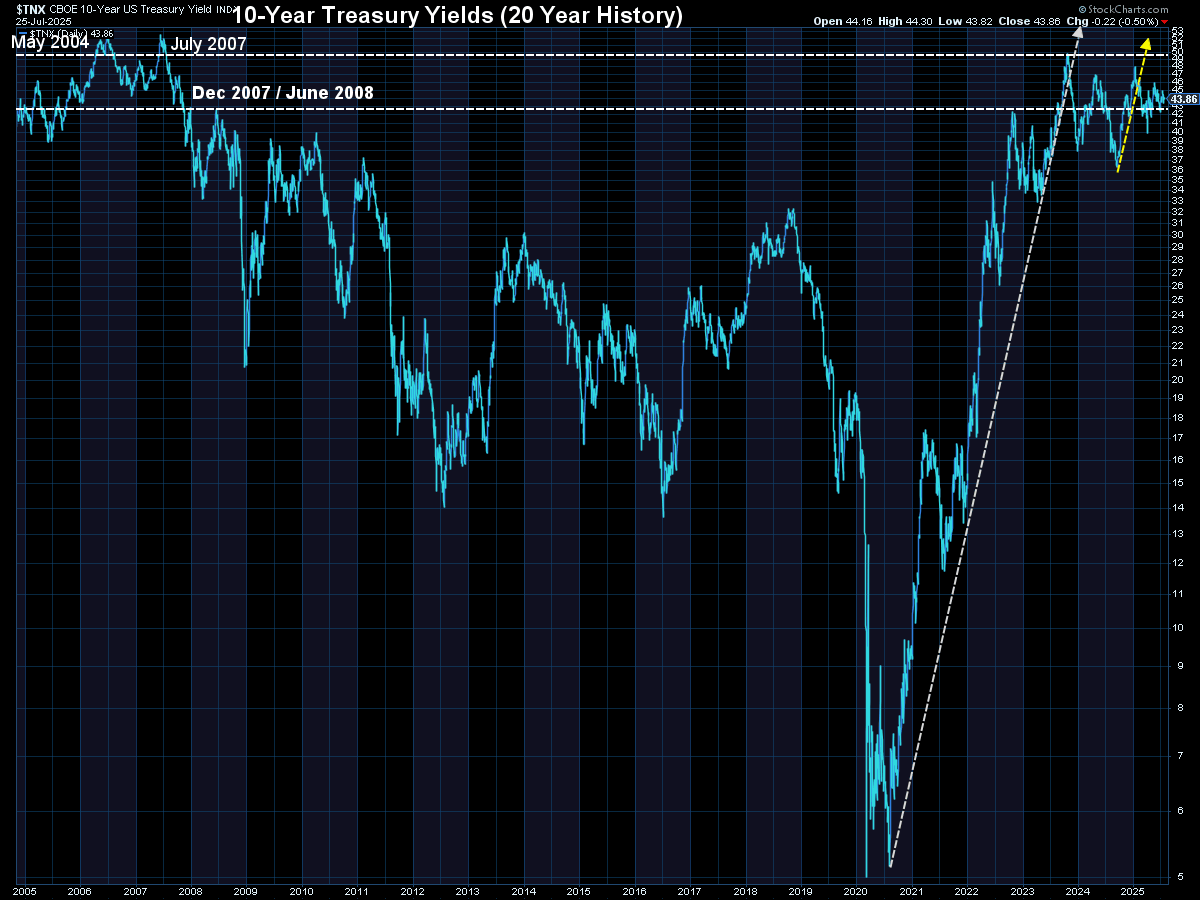
Short-term rates were up slightly on the week, but long-term rates dropped a bit. The yield curve is still hinting that the bond market expects some economic stress in the coming year.
3. Business-equipment orders stumble 📉
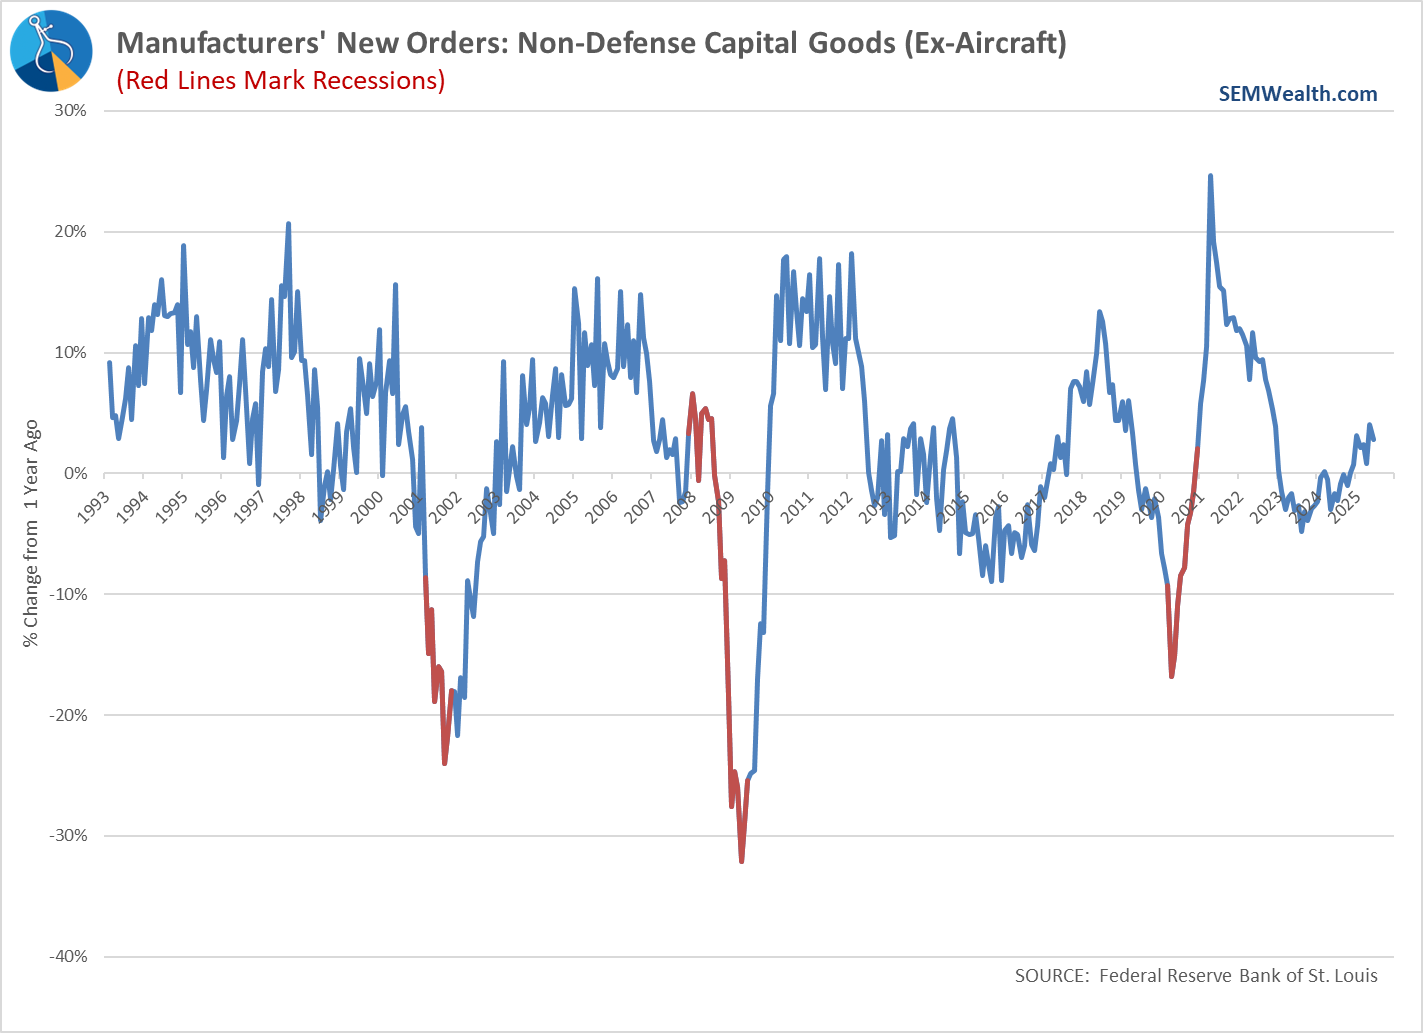
What happened: June orders for core capital goods — a proxy for business investment — fell 0.7 %, while overall durable-goods orders (which includes the volatile aircraft segment) plunged 9.3 %. (Source: Reuters)
Why it matters: Slower cap-ex is an early warning light for economic momentum; if it persists, expect analysts to trim earnings forecasts and bond yields to drift lower.
The question is whether this is a short-term blip on what has been an overall steady improvement.
4. Alphabet’s AI-driven cloud beat lifts big tech 🚀
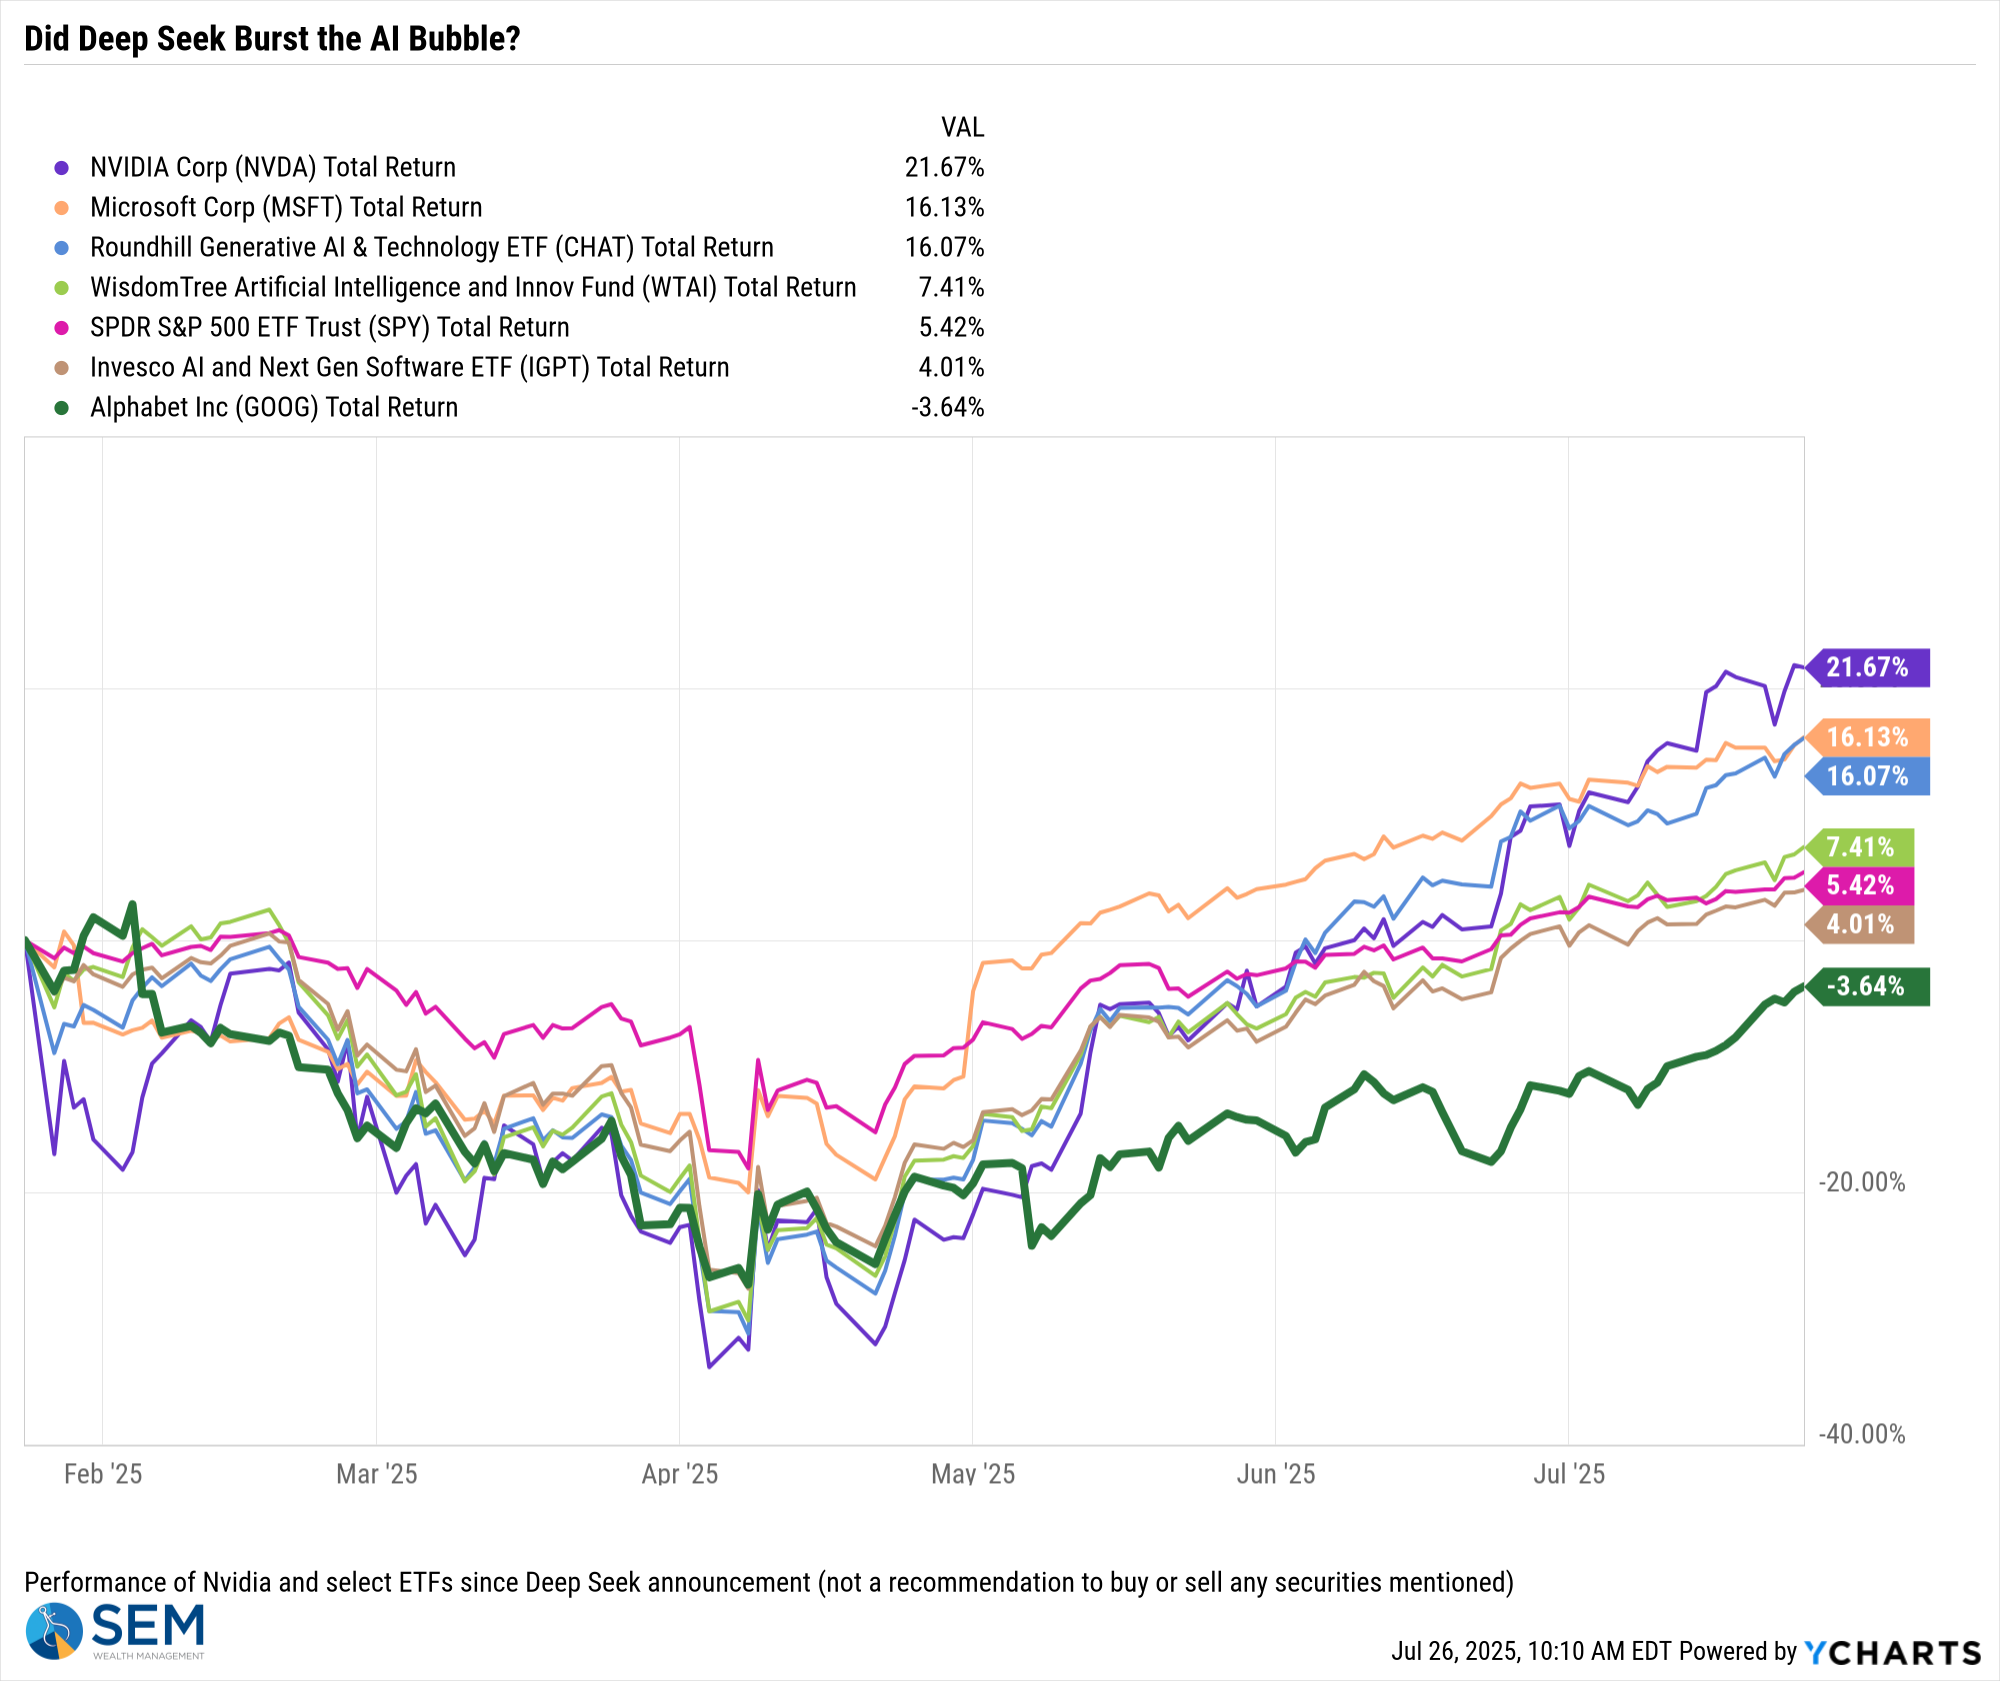
What happened: Google-parent Alphabet crushed forecasts, with cloud revenue up 32 % and a $10 billion bump to 2025 capital-spending plans, sending its shares up about 3 % and helping the Nasdaq notch another record. (Source: Reuters)
Why it matters: The results prove that hefty AI outlays are (for now) producing real sales growth — good news for the so-called "diversified" portfolios that have been dependent on continued megacap tech leadership.
Google (bold green line) has been lagging other AI related stocks, will they play catch-up or will their heavy reliance on advertising revenue, which is ironically being hurt by AI.
5. Intel’s foundry warning jolts chip sector ⚠️
What happened: Intel shares slid 8 % after the company said it may exit advanced chip manufacturing if it can’t land a major outside customer, following a surprise quarterly loss. (Source: Reuters)
Why it matters: A retreat by a legacy U.S. chipmaker could tighten global supply chains and hand more pricing power to overseas rivals — a reminder that not every AI-era storyline is bullish.
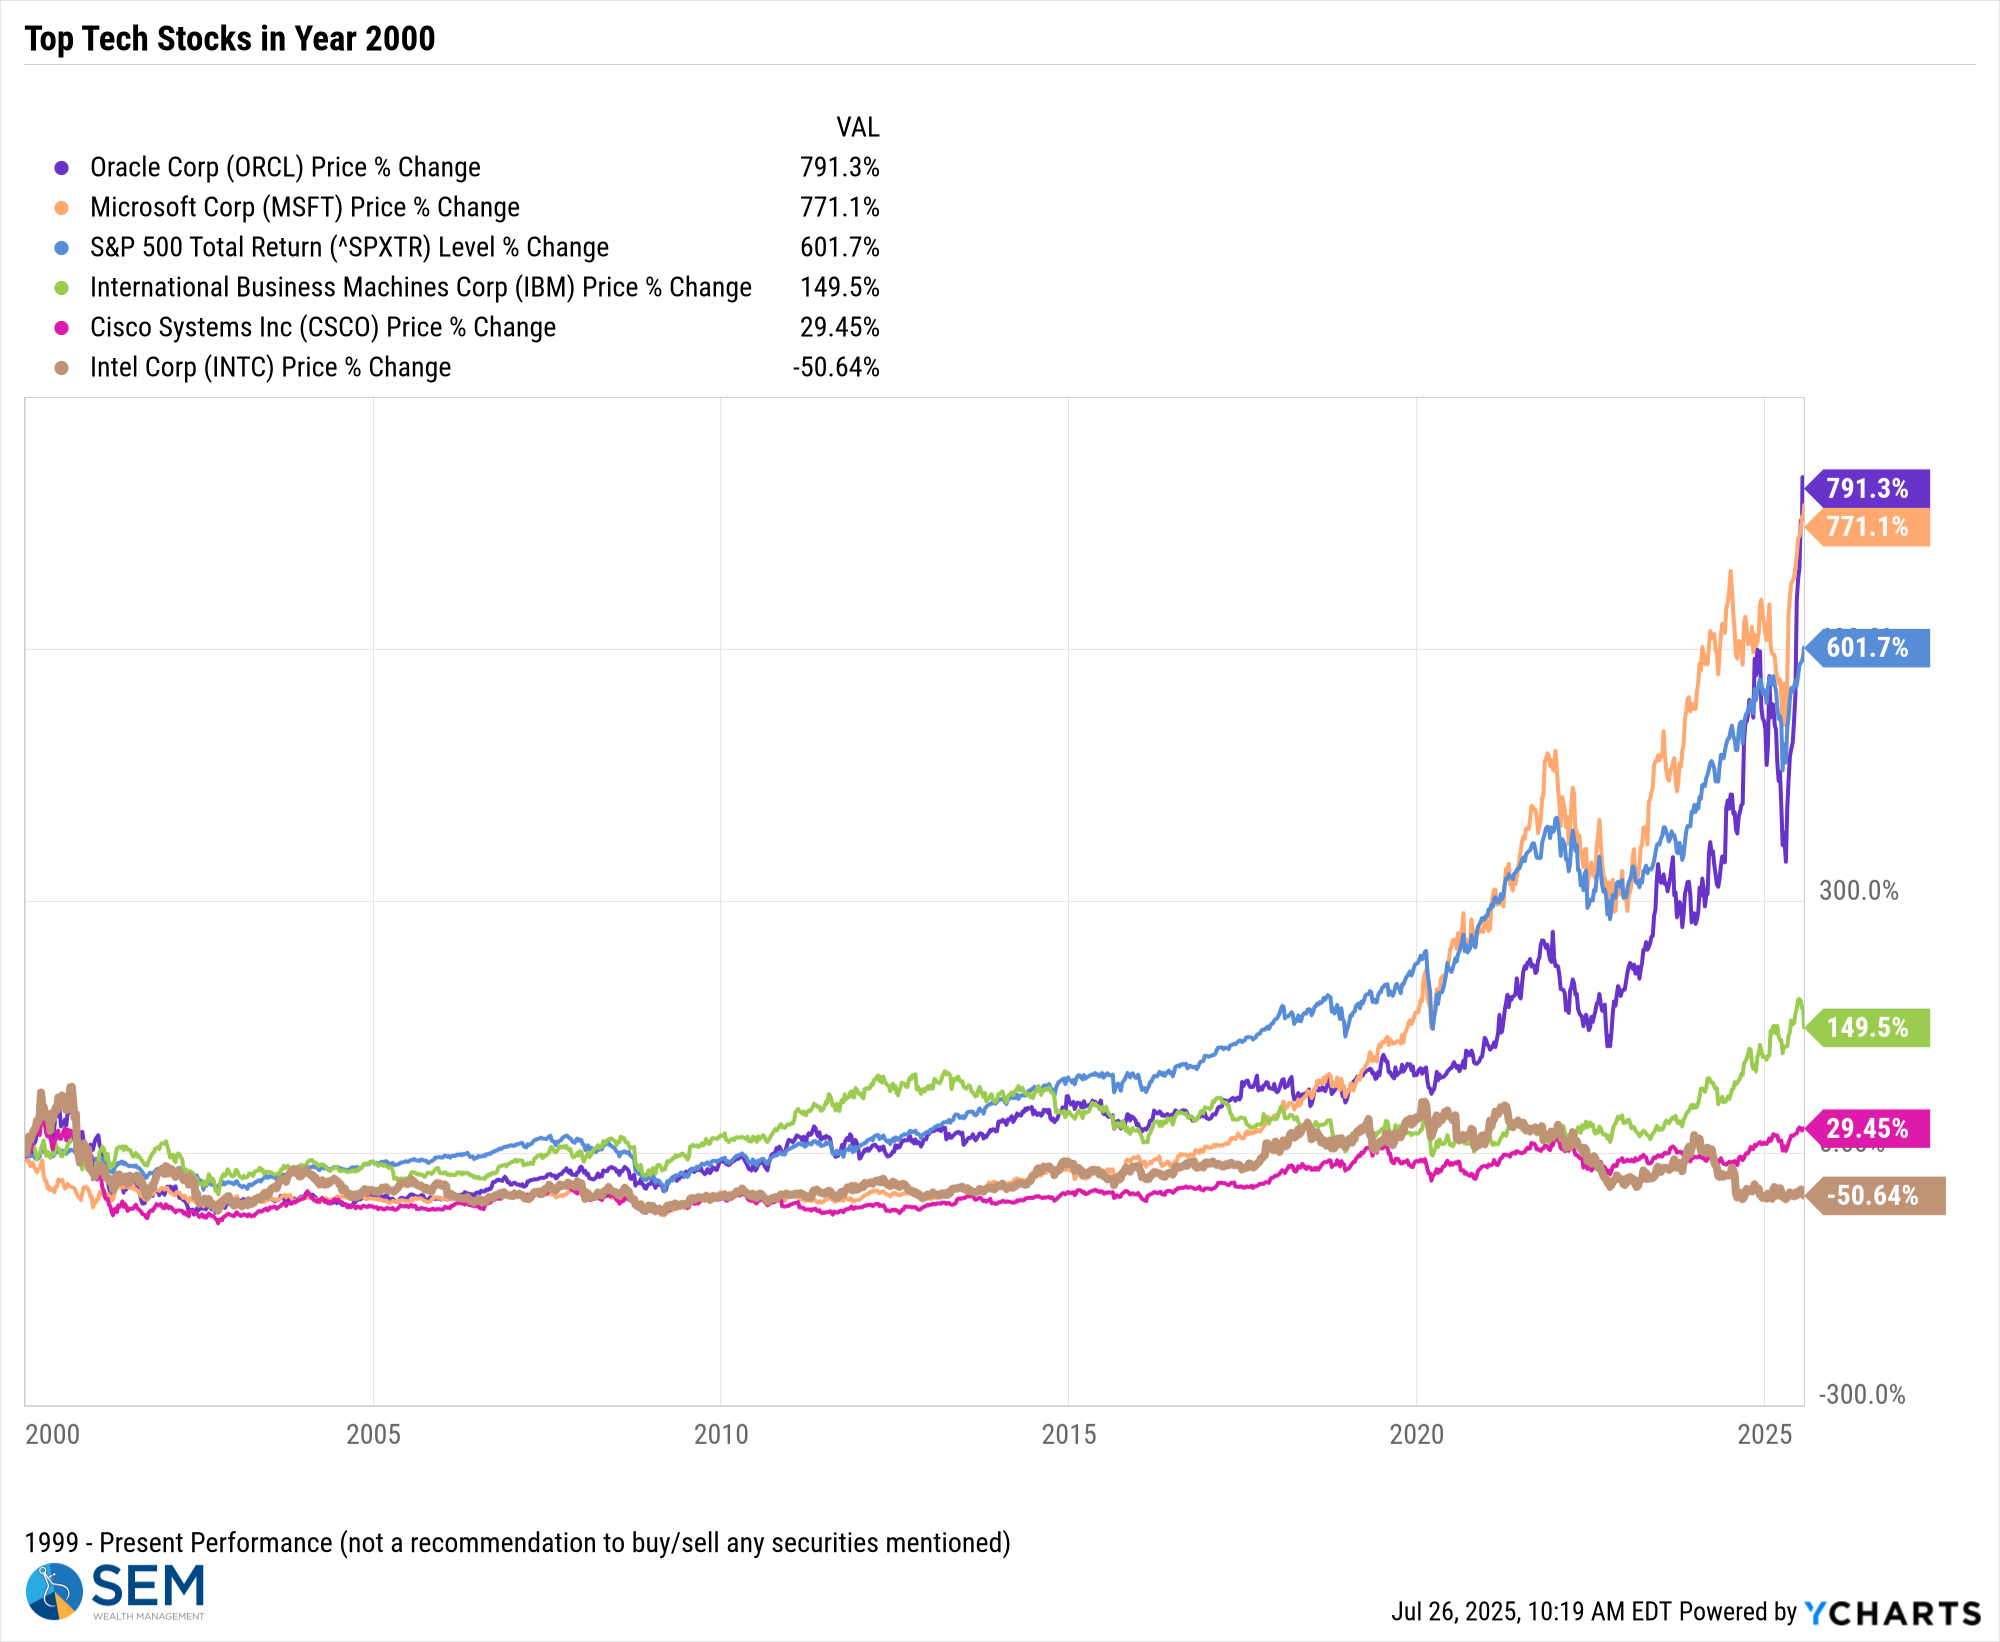
This is actually a sad story and a good lesson when investing in individual securities. I highlighted this chart earlier in the year which looks at the biggest tech companies at the turn of the century.....those thought to have such a strong future they should be considered "blue chips".
For all companies on the list, they were essentially "dead money" for 15 years (investors would have been underwater for that period of time). For those companies like Oracle and Microsoft who emerged post 2015, it wasn't built on their 1990s business model, but because they successfully transitioned to a "service" type model. Intel has not adjusted and has been left behind. Remember, at the end of the 90s Intel had a near monopoly on chips.
It is a VERY busy week – Fed meeting, the August 1 "deadline" for other trade deals, and the employment report on Friday. Next week's blog could be much more detailed!
There are always risks
Despite the strong rally, there are always risks. In fact, the more the market goes up, the more risky it becomes (because investors tend to overreact when the market does start going down.) All of the risks highlighted in our Summer Newsletter remain.

Market Charts
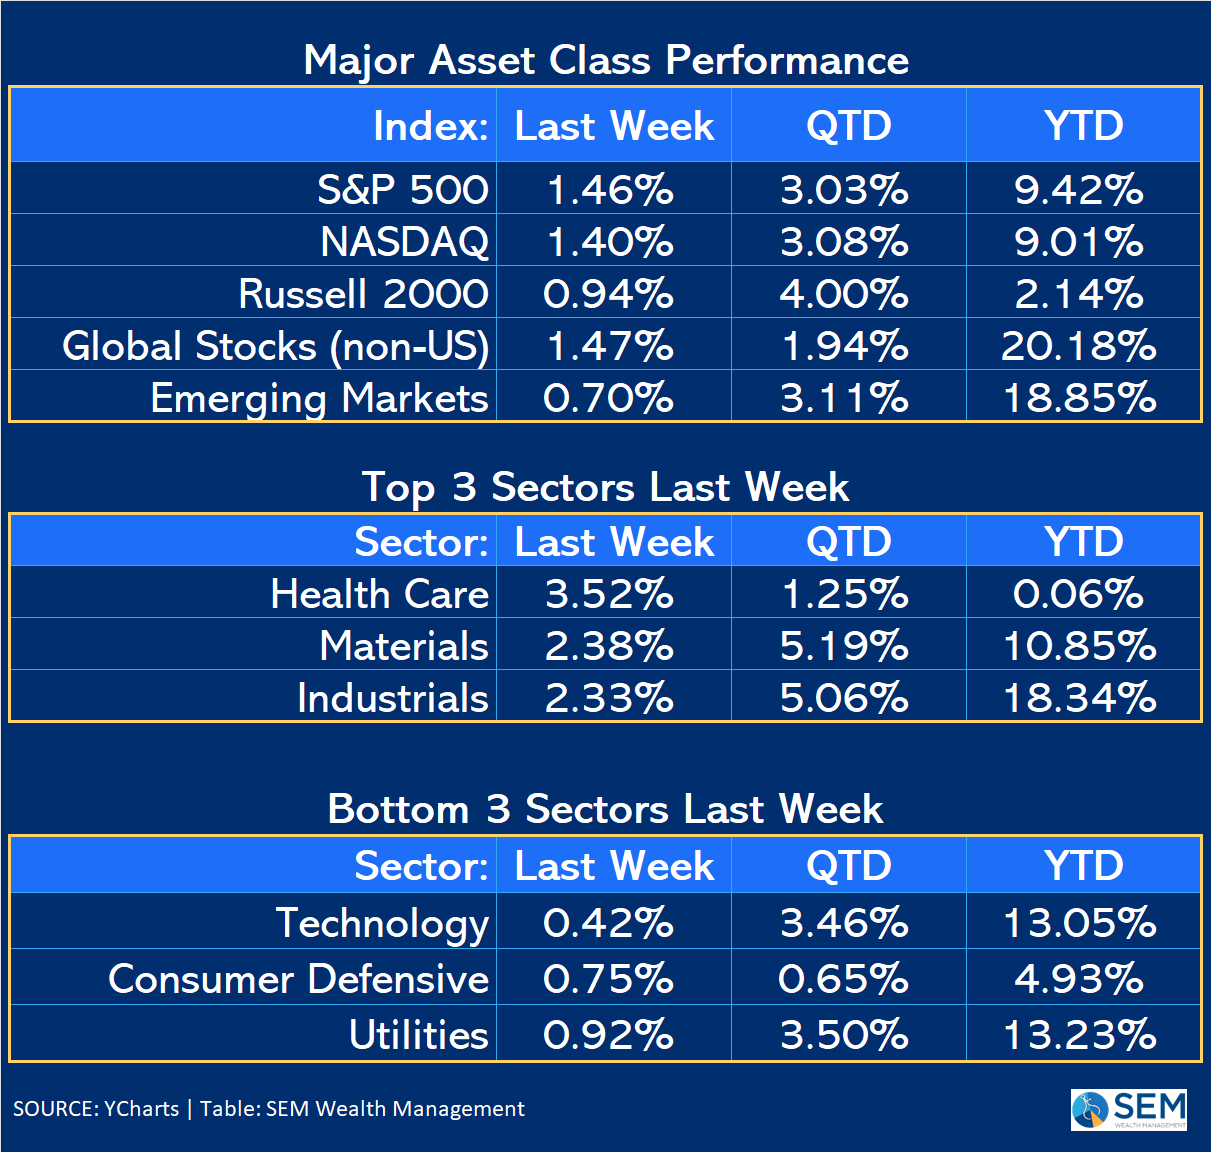
EVERY sector was up last week, obviously some more than others. I think the list of leaders and laggards tells a somewhat positive story — technology wasn't the driver of the market last week.
I think this chart tells the whole story. Ignoring the "liberation day" sell-off and the nearly unprecedented recovery, the stock market is surprisingly below the uptrend line that started in late 2023 when the Fed announced they were done raising interest rates (and hinted that cuts would be coming). At the rate we've been going the market will catch that uptrend line in 2-3 weeks.

Interest rates are holding steady, which is a good sign for investors.
SEM Market Positioning
| Model Style | Current Stance | Notes |
|---|---|---|
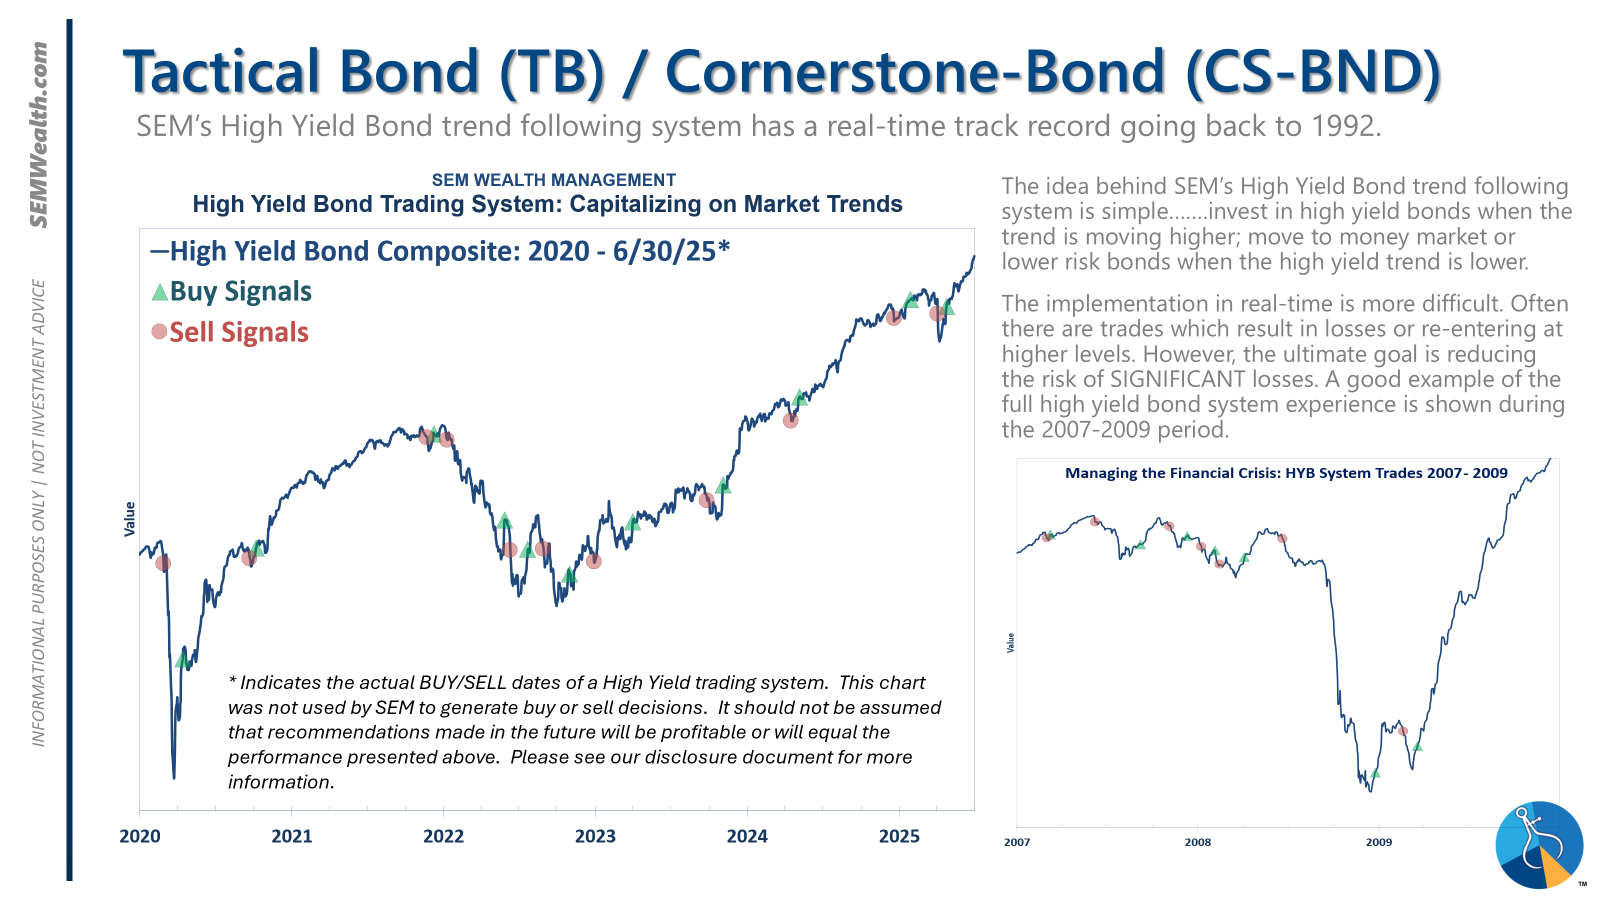
| Tactical | 100% high yield | High-yield spreads holding, but trend is slowing-watching closely |
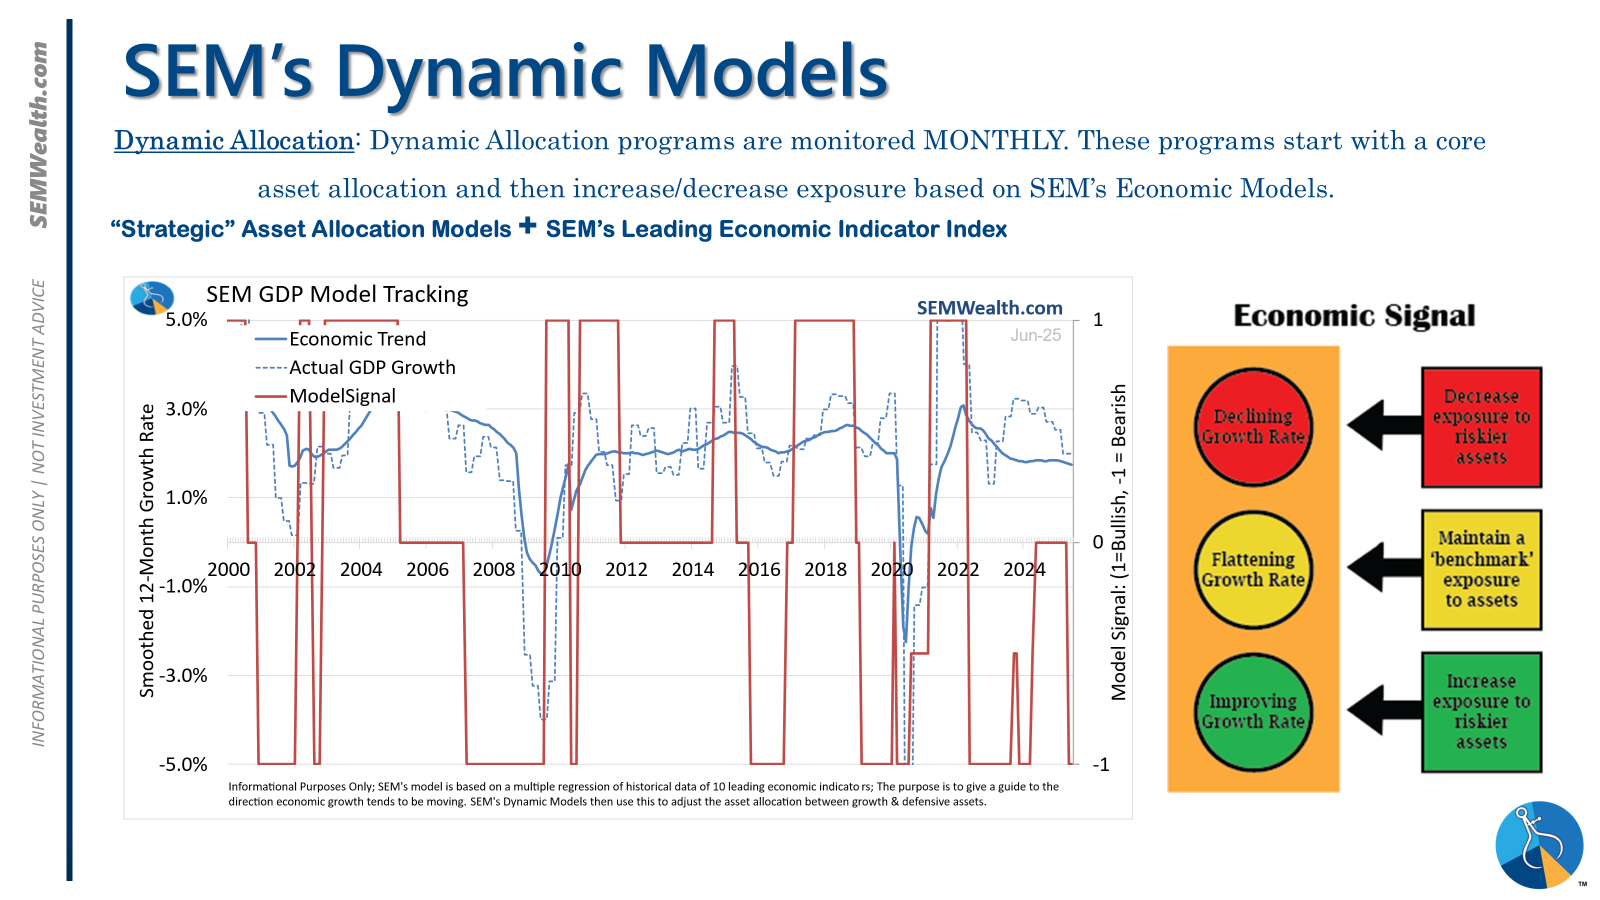
| Dynamic | Bearish | Economic model turned red – leaning defensive |
| Strategic | Slight under-weight | Trend overlay shaved 10 % equity in April -- added 5% back early July |
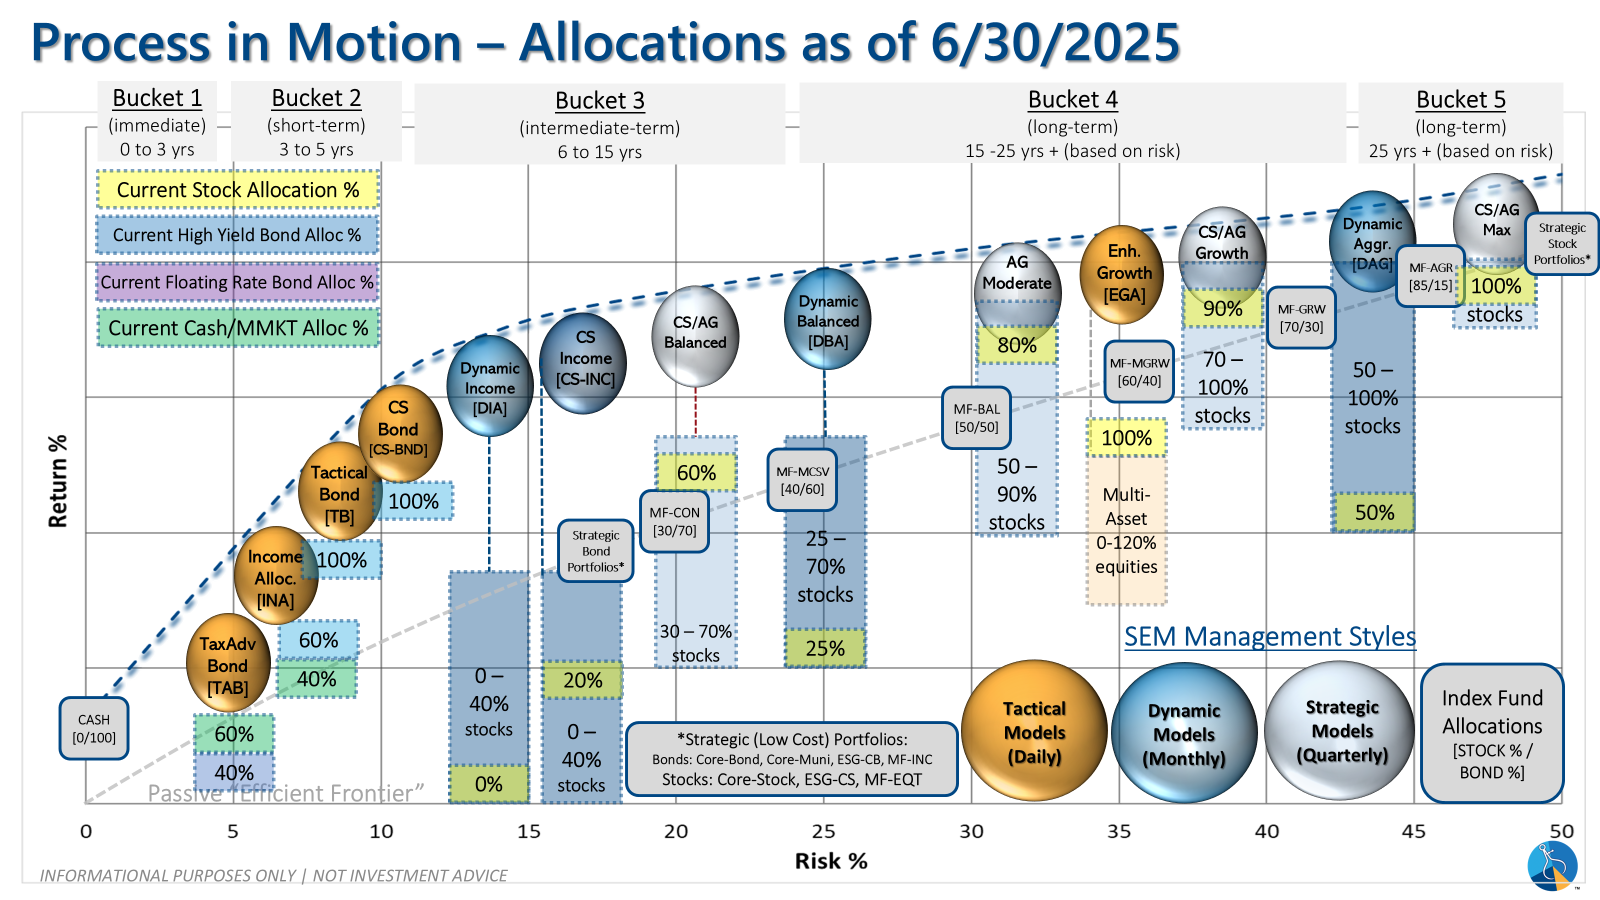
SEM deploys 3 distinct approaches – Tactical, Dynamic, and Strategic. These systems have been described as 'daily, monthly, quarterly' given how often they may make adjustments. Here is where they each stand.
Tactical (daily): The high yield system has been invested since 4/23/25 after a short time out of the market following the sell signal on 4/3/25.
Dynamic (monthly): The economic model went 'bearish' in June 2025 after being 'neutral' for 11 months. This means eliminating risky assets – sell the 20% dividend stocks in Dynamic Income and the 20% small cap stocks in Dynamic Aggressive Growth. The interest rate model is 'neutral' meaning low duration/money market investments for the bulk of the bonds.
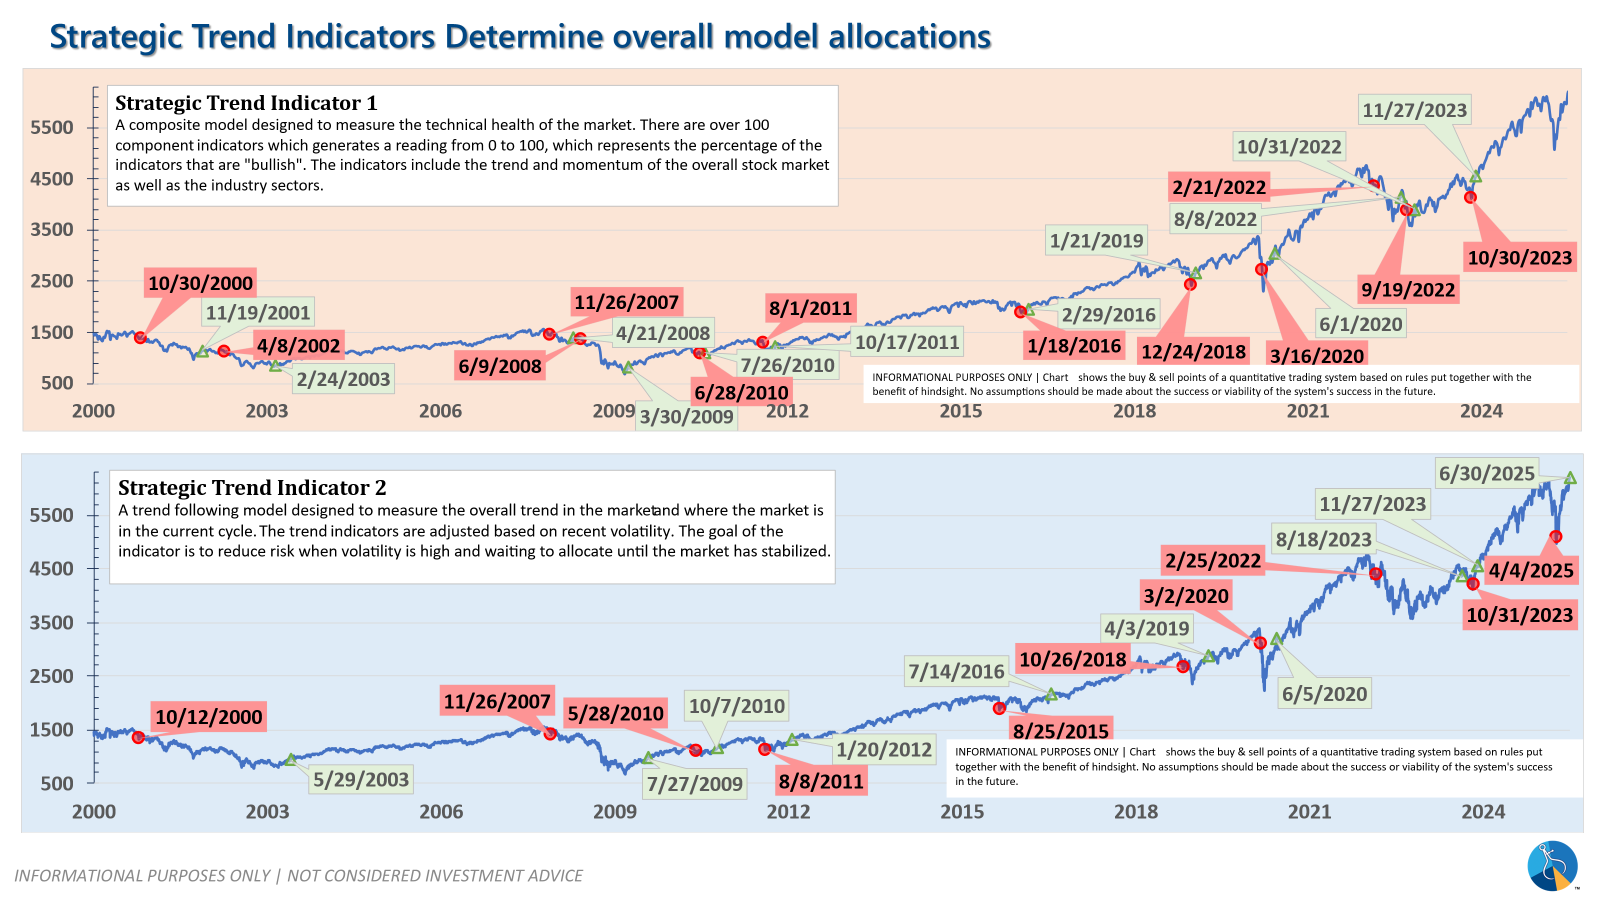
Strategic (quarterly)*: One Trend System sold on 4/4/2025; Re-entered on 6/30/2025
The core rotation is adjusted quarterly. On August 17 it rotated out of mid-cap growth and into small cap value. It also sold some large cap value to buy some large cap blend and growth. The large cap purchases were in actively managed funds with more diversification than the S&P 500 (banking on the market broadening out beyond the top 5-10 stocks.) On January 8 it rotated completely out of small cap value and mid-cap growth to purchase another broad (more diversified) large cap blend fund along with a Dividend Growth fund.
The * in quarterly is for the trend models. These models are watched daily but they trade infrequently based on readings of where each believe we are in the cycle. The trend systems can be susceptible to "whipsaws" as we saw with the recent sell and buy signals at the end of October and November. The goal of the systems is to miss major downturns in the market. Risks are high when the market has been stampeding higher as it has for most of 2023. This means sometimes selling too soon. As we saw with the recent trade, the systems can quickly reverse if they are wrong.
Overall, this is how our various models stack up based on the last allocation change:
Curious if your current investment allocation aligns with your overall objectives and risk tolerance? Take our risk questionnaire
We manage risk so advisors can focus on planning.
Questions or comments - drop us a note?
© 2025 SEM Wealth Management


