
Despite another week of trade-war drama and soft economic data, the stock market rallied again last week. It seems nothing will stop the market from going up. This has emboldened more investors looking for ways to get higher returns out of their accounts by moving into areas they previously hadn't considered. Is this a wise move? Unfortunately, we won't know until we have the benefit of hindsight to know whether we have entered an unprecedented new era or if this was simply yet another market mania that ended badly for those who chose to chase it.
Fortunately for us, we have nearly 100 years' worth of data to help frame the current environment and to make wise decisions. I often say "whether you go back to 1990, 1980, 1970, 1950, or all the way back to 1928, the long-term annualized return for the S&P 500 is right around 10%. My point being, over the VERY LONG-TERM you should expect to make about 10% if you invest in the stock market (and leave it alone). The chart below illustrates a few of the reasons few people are able to realize the same returns as the stock market.
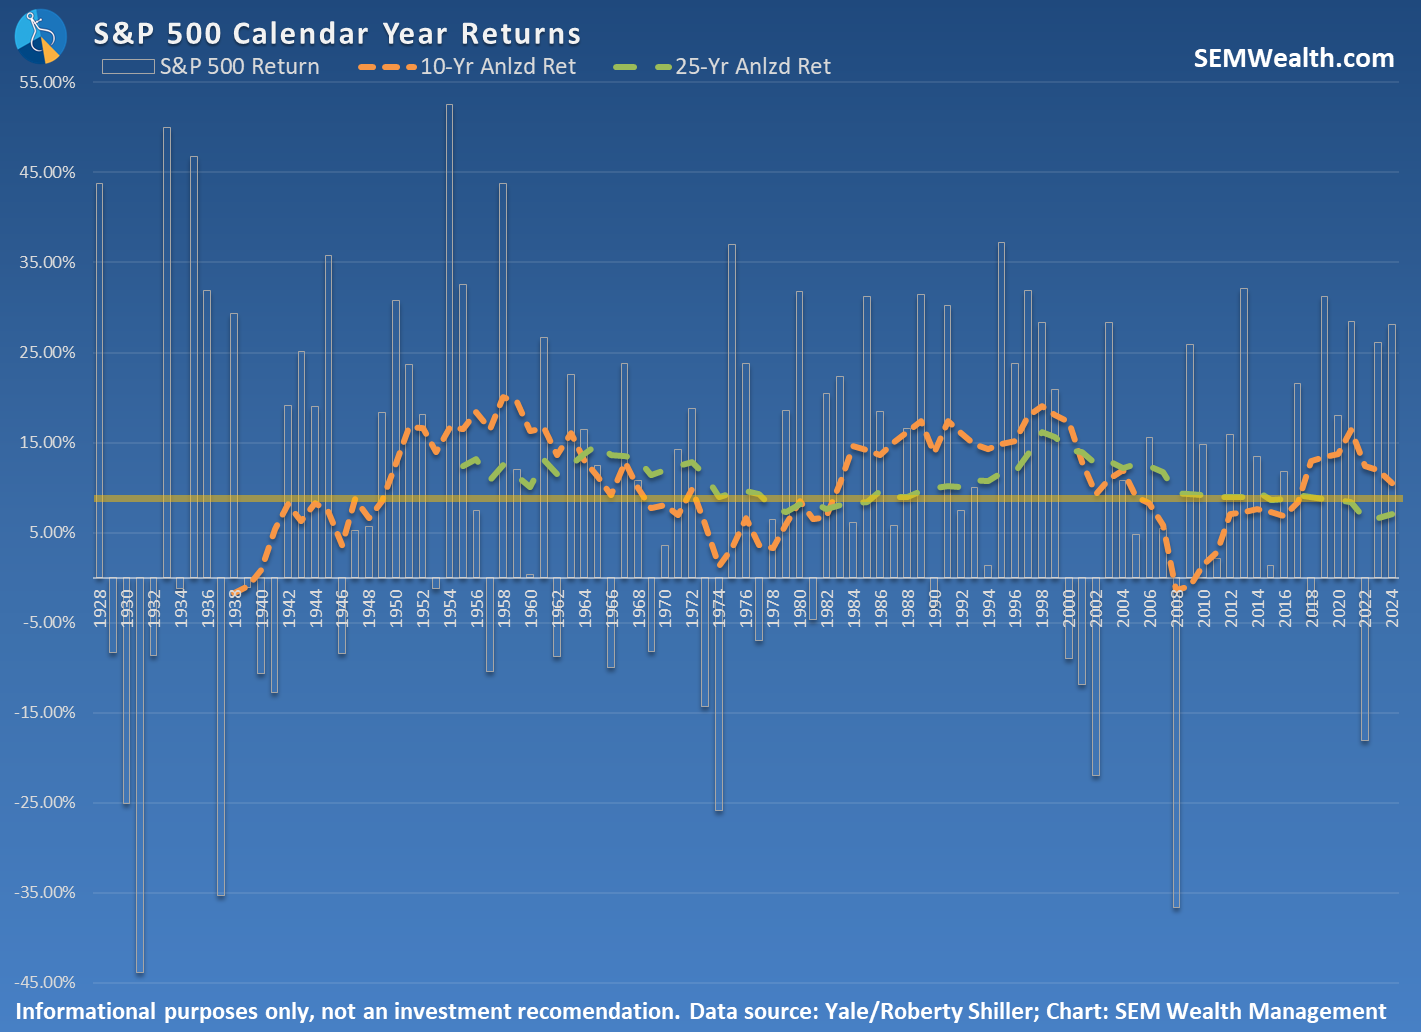
1.) Stocks very rarely return exactly 10% in a given year (the solid orange line), which is often the "evaluation period" investors use when looking at their investment accounts. This means many years of thinking "wow, this is way better than I expected", which typically leads us to then start expecting "better than average" returns. Unfortunately, those years are occasionally interrupted with deeply negative years, which could lead to panic that the "good times are over" and lead to selling out of those previously "great" investments.
2.) The rolling 10-year average return goes up and down in cycles (the dashed orange line), which magnifies our belief that we are in a "new era". Throughout the last 100 years, periods of well above average 10-year returns are followed by periods of well below average returns.
3.) Investing at the wrong time can lead to a decade (or more) of sub-par returns. This has always followed periods of well-above average returns and could completely derail somebody's retirement plans if they invest at the wrong time.
I've been managing money in the markets for over 30 years. There have been many times where it FEELS like the market has changed and we've entered a "new era" for the markets where the past is no longer relevant. Each time fundamental economic forces that have been in existence since the modern world began take over and those who chased the "new era" sectors near the end of the cycle end up getting hurt the worst.
Is it "different this time"? I'm open to believing that there could be forces at play which will change the market forces for the future. Is it likely? No. My opinion, however does not matter. We have developed our Behavioral Portfolio approach so we do not have to make those types of bold predictions.
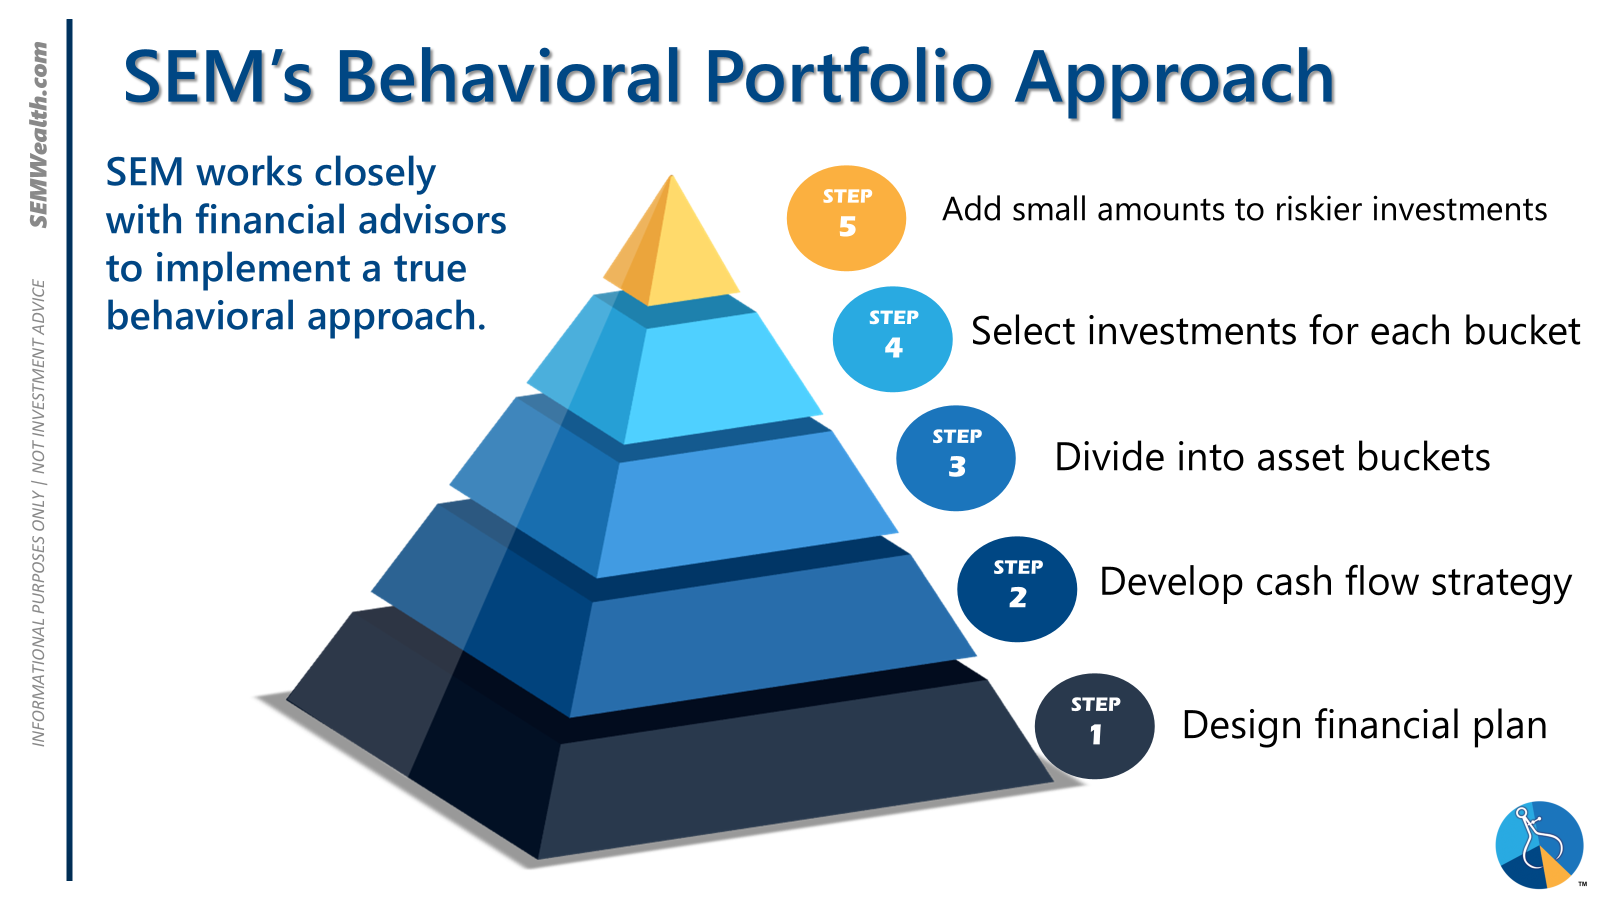
Whenever somebody wants to adjust their portfolio, the decision always comes down to 3 things:
1.) The Financial Plan – what return do you NEED to make the plan work and what level of RISK puts the plan in peril?
2.) The Cash Flow Strategy – are you adding money to your investments, letting them run, or using the investments for income. If you're adding money, you have more room for risk taking. If you are using it for income, the volatility of the investments you are drawing from is the most important part of the strategy.
3.) Your Investment Personality – Each person is different. Some love risk and are able to use market shocks as a buying opportunity (assuming they have left cash on the sidelines), while others feel a sense of panic when they go through a losing period. Matching the volatility of the account to the personality is the key to long-term investment success.
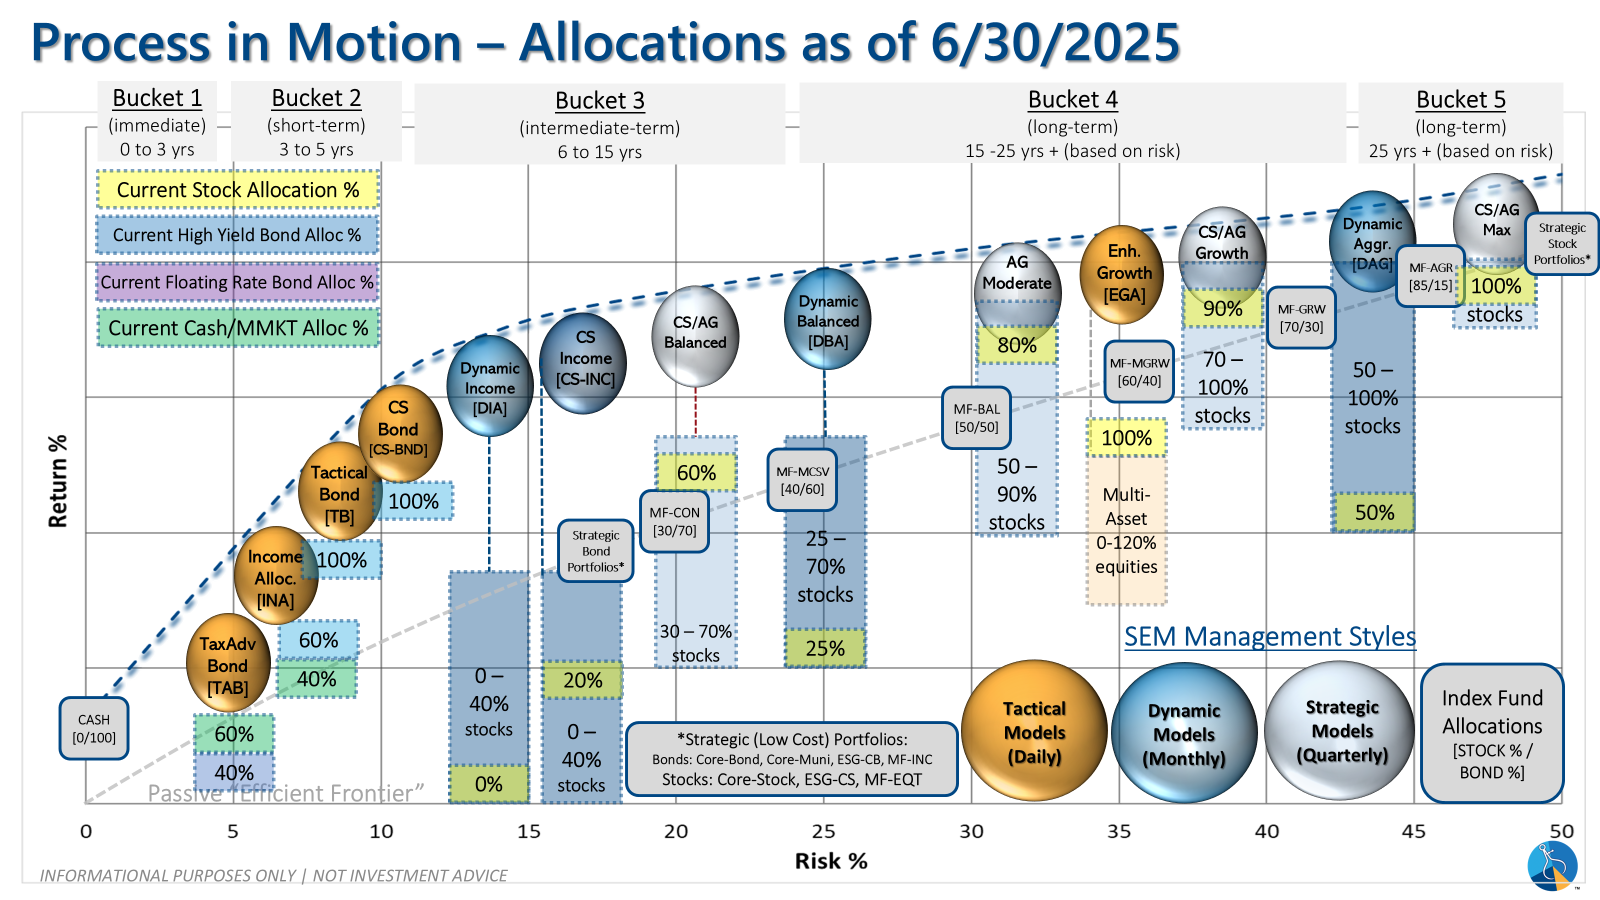
We also understand that we all have a desire to participate in the latest investment fad or something that is important to us personally. That is where the orange "top of the pyramid" comes in. This is the portion of the portfolio reserved for risk taking. The size of that pyramid depends on the individual situation of each client.
We have several investment models that fit this portion of the portfolio and are getting ready to launch another one soon. We also offer the ability for clients to choose specific investments "below the line" if there is an investment they would like for their "top of the pyramid" portfolio.
With all of that in mind, the trend is up for stocks. Here are the top 5 things I think were most important for the market last week:
📅 Last Week’s Market Movers
1. Bad economic data ignites rate cut hopes, fueling a stock rally
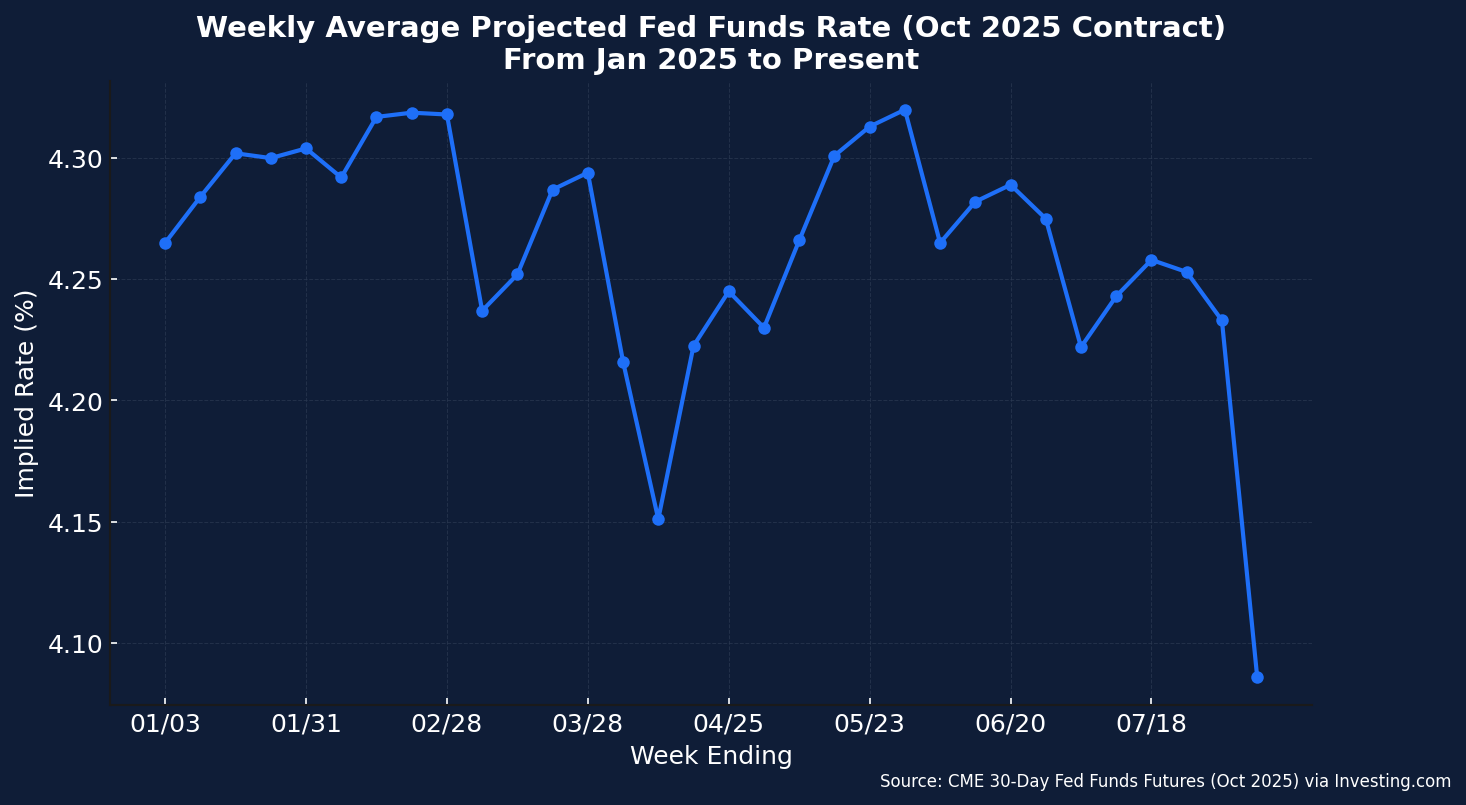
A weaker-than-expected July jobs report had traders pricing in an even higher chance of a Fed rate cut in September, sparking a broad market rally. (Sources: AP, Kiplinger)
2. Trade war still on-going with new threats to key partners and sectors
The White House announced fresh tariff threats on critical industries like semiconductors and pharmaceuticals, keeping uncertainty elevated for global trade partners. (Source: WSJ)
3. Apple’s $100B commitment seen as another win for President
Apple pledged $100 billion toward U.S.-based manufacturing and R&D, reinforcing administration efforts to bring supply chains home. (Source: Reuters)
4. Mixed earnings highlight underlying market risks
While some mega-cap tech names posted strong results, weakness in industrials, consumer discretionary, and transportation companies underscored uneven economic momentum. (Source: MarketWatch)
5. White House continues to boost crypto industry
President Trump reiterated his support for cryptocurrency, endorsing proposals to tokenize U.S. equities for 24/7 blockchain-based trading—fueling both enthusiasm and regulatory concerns. (Source: Politico) Regarding "crypto", stay tuned for a new investment model from SEM designed to give exposure to this industry (another "top of the Pyramid" model).
Here are the top events for the U.S. stock market during the week of August 11–15, 2025:
📊 Key Economic Data Releases
These will be closely watched by investors and could influence market direction:
- Tuesday, August 12
- Consumer Price Index (CPI) for July
- Hourly Earnings & Average Workweek (final July data)
- Treasury Budget for July
- Thursday, August 14
- Producer Price Index (PPI) for July
- Initial & Continuing Jobless Claims
- Friday, August 15
- Retail Sales for July
- Empire State Manufacturing Index (August)
- Import/Export Price Indexes
- Industrial Production & Capacity Utilization
- University of Michigan Consumer Sentiment Index (preliminary August)
💼 Earnings Reports
While earnings season is winding down, several notable companies are reporting:
- Tuesday, August 12
- Cardinal Health
- HUYA, ONON, TME, SE, HR Block, CAVA
- Wednesday, August 13
- Cisco Systems
- CAE, EAT, GLBE, PFGC, SPNS
- Thursday, August 14
- Applied Materials, Tapestry, Deere & Co.
- JD.com, NetEase, VIPS, WB
Market Charts
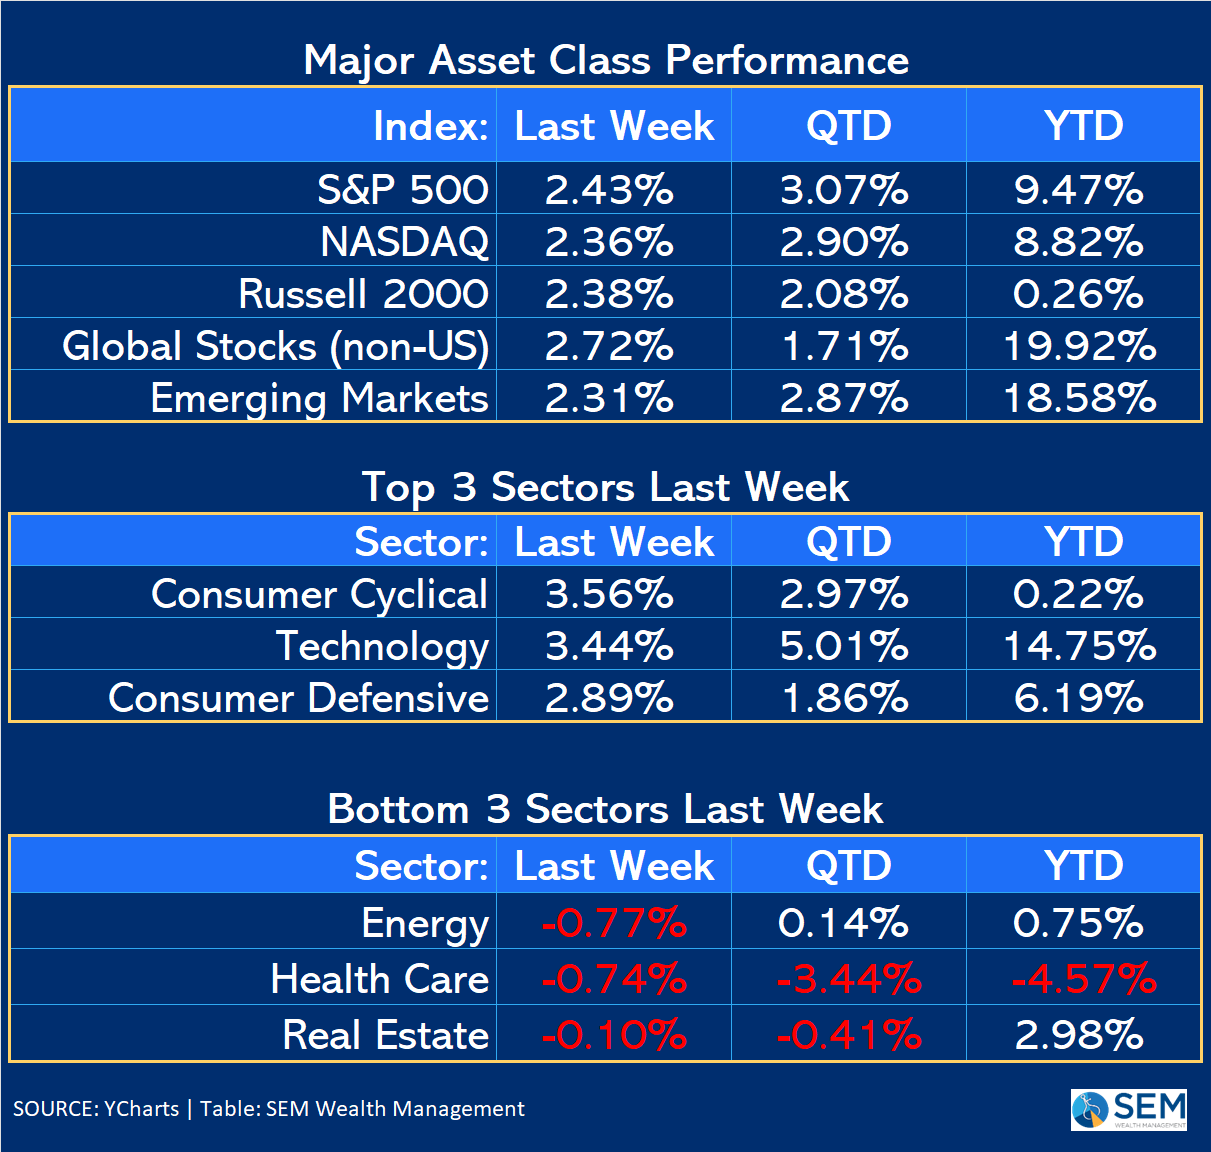
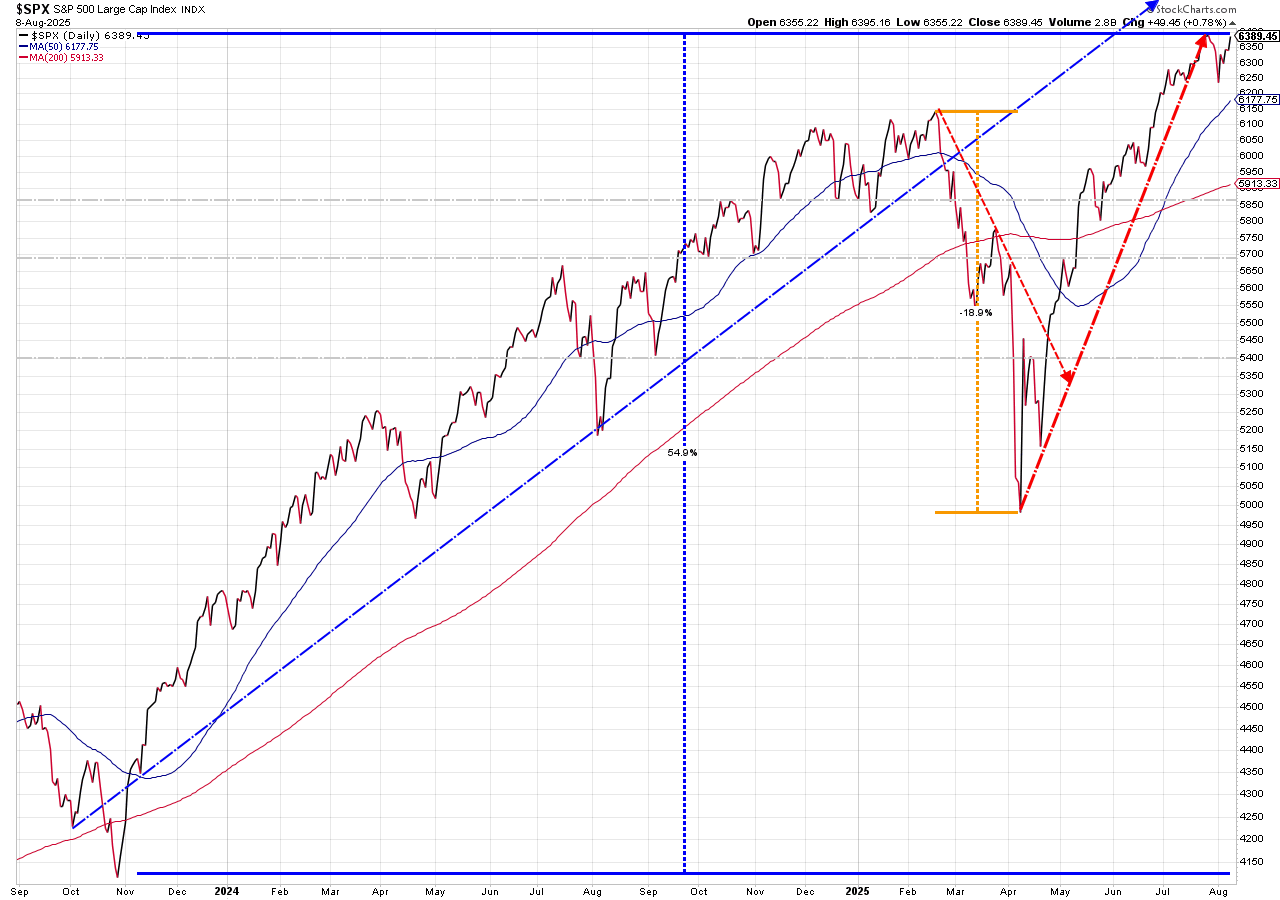
Stocks closed the week within a whisker of an all-time high, erasing the panic over weak economic data.
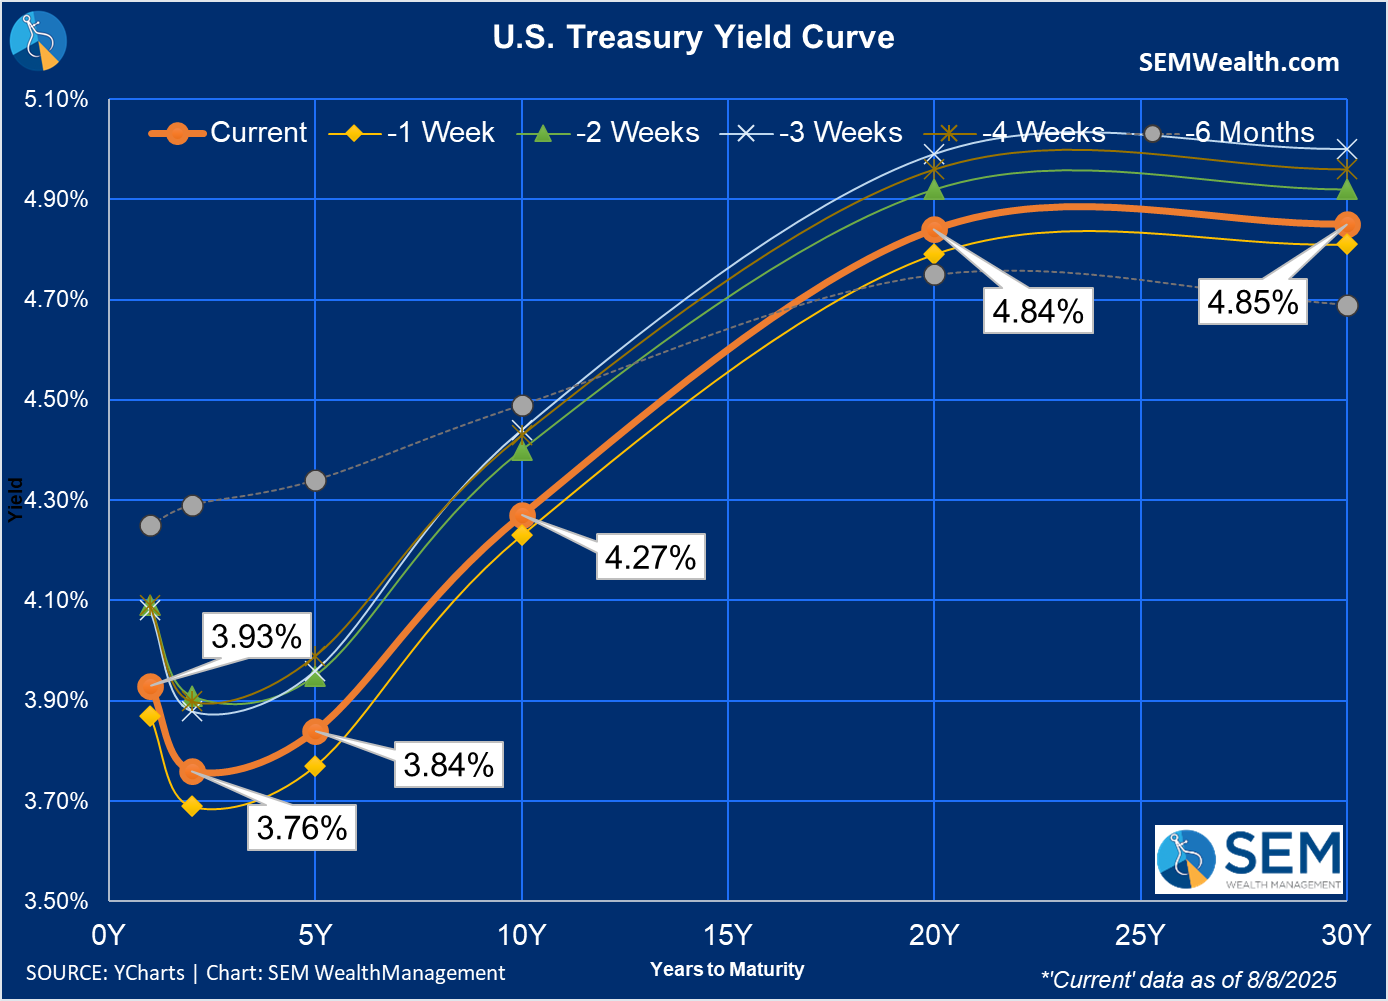
Bond yields rose a bit for the week, but are still significantly below where they were 2 weeks ago. The yield curve continues to be a critical indicator to watch, so we will keep following along each week here.
SEM Market Positioning
| Model Style | Current Stance | Notes |
|---|---|---|
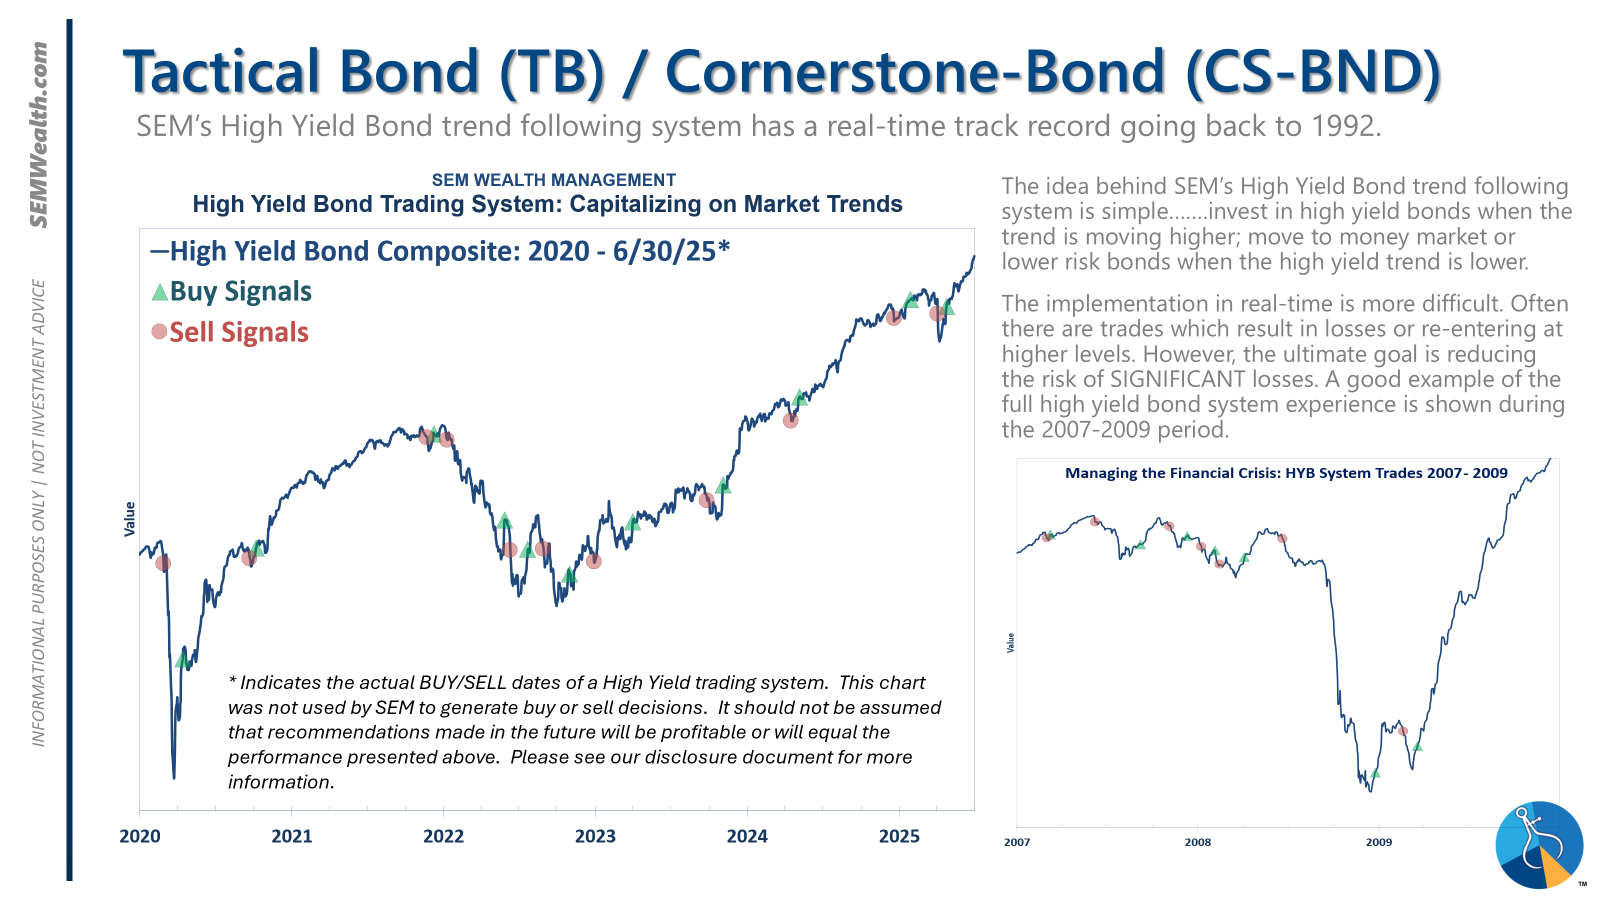
| Tactical | 100% high yield | High-yield spreads holding, but trend is slowing-watching closely |
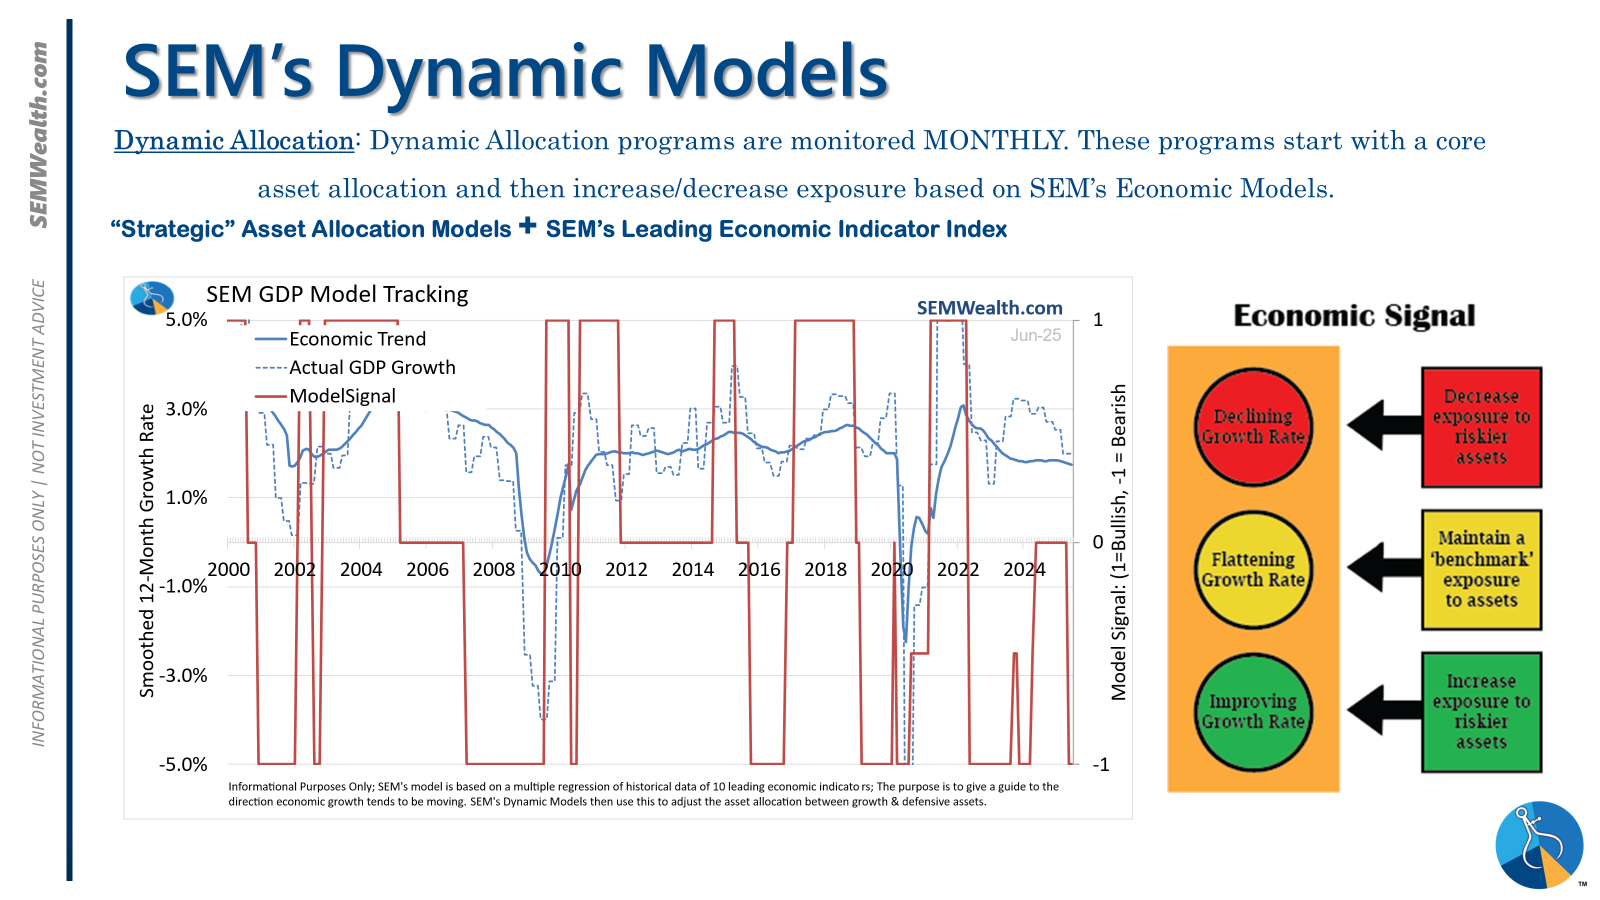
| Dynamic | Bearish | Economic model turned red – leaning defensive |
| Strategic | Slight under-weight | Trend overlay shaved 10 % equity in April -- added 5% back early July |
SEM deploys 3 distinct approaches – Tactical, Dynamic, and Strategic. These systems have been described as 'daily, monthly, quarterly' given how often they may make adjustments. Here is where they each stand.
Tactical (daily): The high yield system has been invested since 4/23/25 after a short time out of the market following the sell signal on 4/3/25.
Dynamic (monthly): The economic model went 'bearish' in June 2025 after being 'neutral' for 11 months. This means eliminating risky assets – sell the 20% dividend stocks in Dynamic Income and the 20% small cap stocks in Dynamic Aggressive Growth. The interest rate model is 'neutral' meaning low duration/money market investments for the bulk of the bonds.
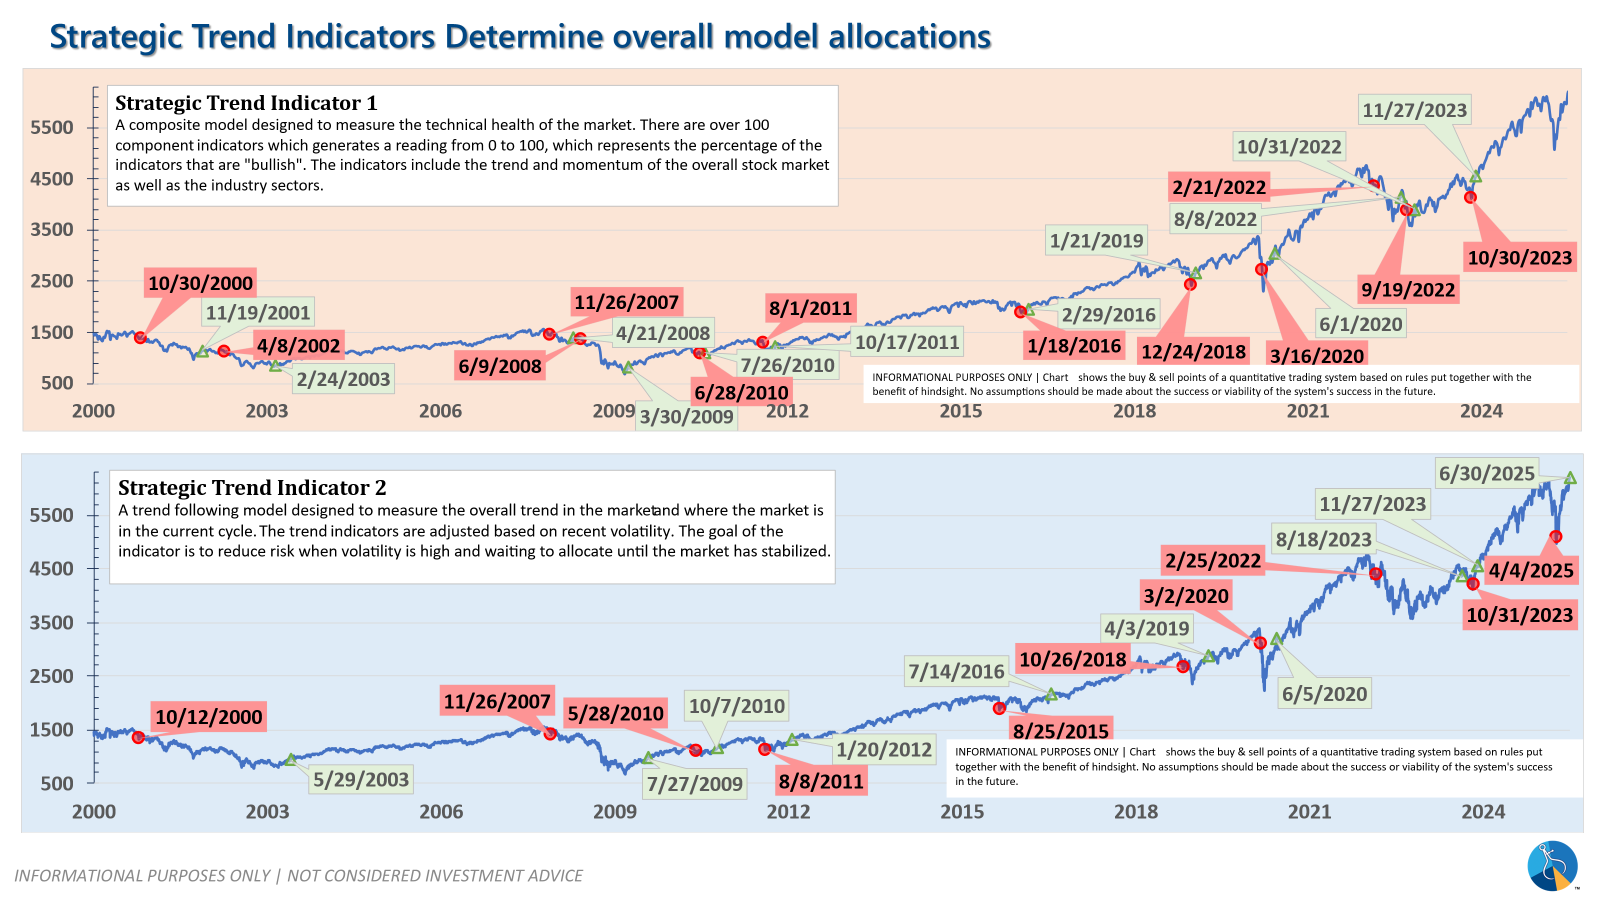
Strategic (quarterly)*: One Trend System sold on 4/4/2025; Re-entered on 6/30/2025
The core rotation is adjusted quarterly. On August 17 it rotated out of mid-cap growth and into small cap value. It also sold some large cap value to buy some large cap blend and growth. The large cap purchases were in actively managed funds with more diversification than the S&P 500 (banking on the market broadening out beyond the top 5-10 stocks.) On January 8 it rotated completely out of small cap value and mid-cap growth to purchase another broad (more diversified) large cap blend fund along with a Dividend Growth fund.
The * in quarterly is for the trend models. These models are watched daily but they trade infrequently based on readings of where each believe we are in the cycle. The trend systems can be susceptible to "whipsaws" as we saw with the recent sell and buy signals at the end of October and November. The goal of the systems is to miss major downturns in the market. Risks are high when the market has been stampeding higher as it has for most of 2023. This means sometimes selling too soon. As we saw with the recent trade, the systems can quickly reverse if they are wrong.
Overall, this is how our various models stack up based on the last allocation change:
Curious if your current investment allocation aligns with your overall objectives and risk tolerance? Take our risk questionnaire


