
“The balance of risks appears to be shifting.” — Jerome Powell, Jackson Hole August 22, 2025
In what is most certainly his final Jackson Hole appearance as Fed Chair, Jerome Powell delivered a speech that left market participants parsing every word. While he didn’t explicitly promise a rate cut, he opened the door wider than ever, signaling that the Fed is ready to act if economic risks continue to mount.
The tone was notably more "dovish" (leaning towards easing) than previous remarks, with Powell acknowledging that the labor market is "weakening" and inflation remains "stubbornly above target". He also pointed to external pressures like tariffs and immigration policy as contributors to economic uncertainty. Not mentioned, of course was the politics of it all.
We all know from the moment President Trump took office he resumed his attacks on the character, integrity, and capabilities of the Fed Chair, somebody he appointed during his first term and started attacking when the Fed raised rates in 2018. As JP Morgan Chase CEO Jamie Dimon said it late July "every president wants lower rates", which is why Fed independence is critically important. If the Fed was controlled by the White House (regardless of party) short-term rates would likely be too low, which would ironically cause long-term rates to be higher (because rates that are too low would cause inflation and erode the value of long-term coupon payments, which thus would cause bond investors to demand higher rates).
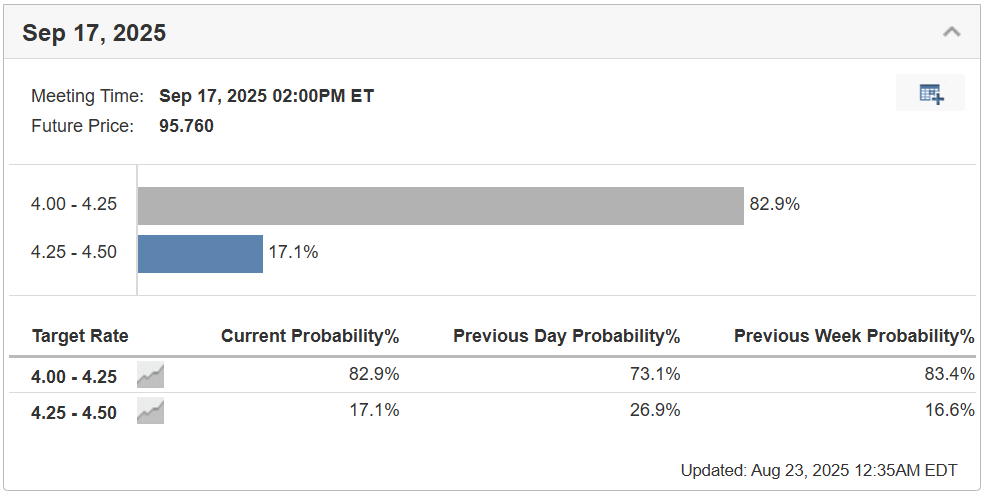
Following the speech, the market immediately increased the chances of a September rate cut of 25 bp (1/4%) form 73% to 83%. As a reminder, the week prior we saw the probability of a rate cut fall from 83% to 73% after much higher than expected inflation data (click here for last week's blog).
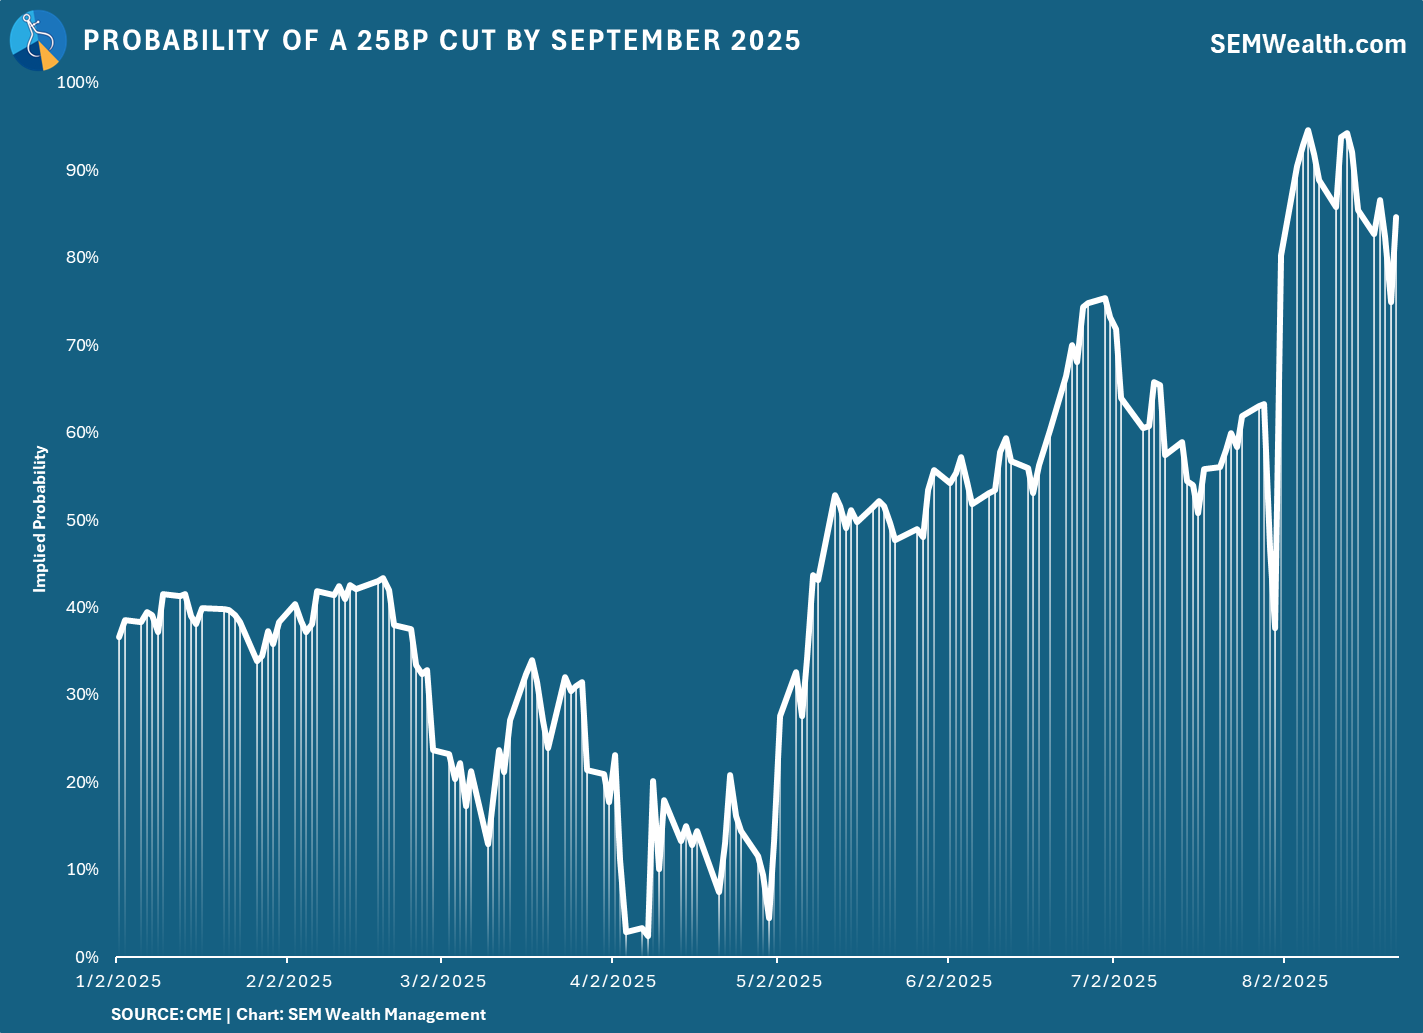
This chart shows the roller coaster of rate cut scenarios. As tariffs began being announced in early February, the chances of a rate cut plummeted. Following the "liberation day" tariff announcement the market saw basically no chance of a rate cut. After the "pause" and subsequent delays/deals/threats/announcements, the market started seeing a strong chance the Fed could cut rates. This also coincided with SEM's Economic Model turning "bearish" (meaning our DATA showed a slowing economy, which would indicate a need for some rate cuts). The chances for a cut again fell when the 90-day pause was over and tariffs took effect, but weak jobs numbers led to the belief the Fed would cut rates in September.
My guess – the Fed cuts rates 25 bp and then waits a couple more meetings. That won't be enough time to help the labor market or spark inflation, but it could pacify the White House for a bit and not upset a bond market which is now pricing in a rate cut next month.
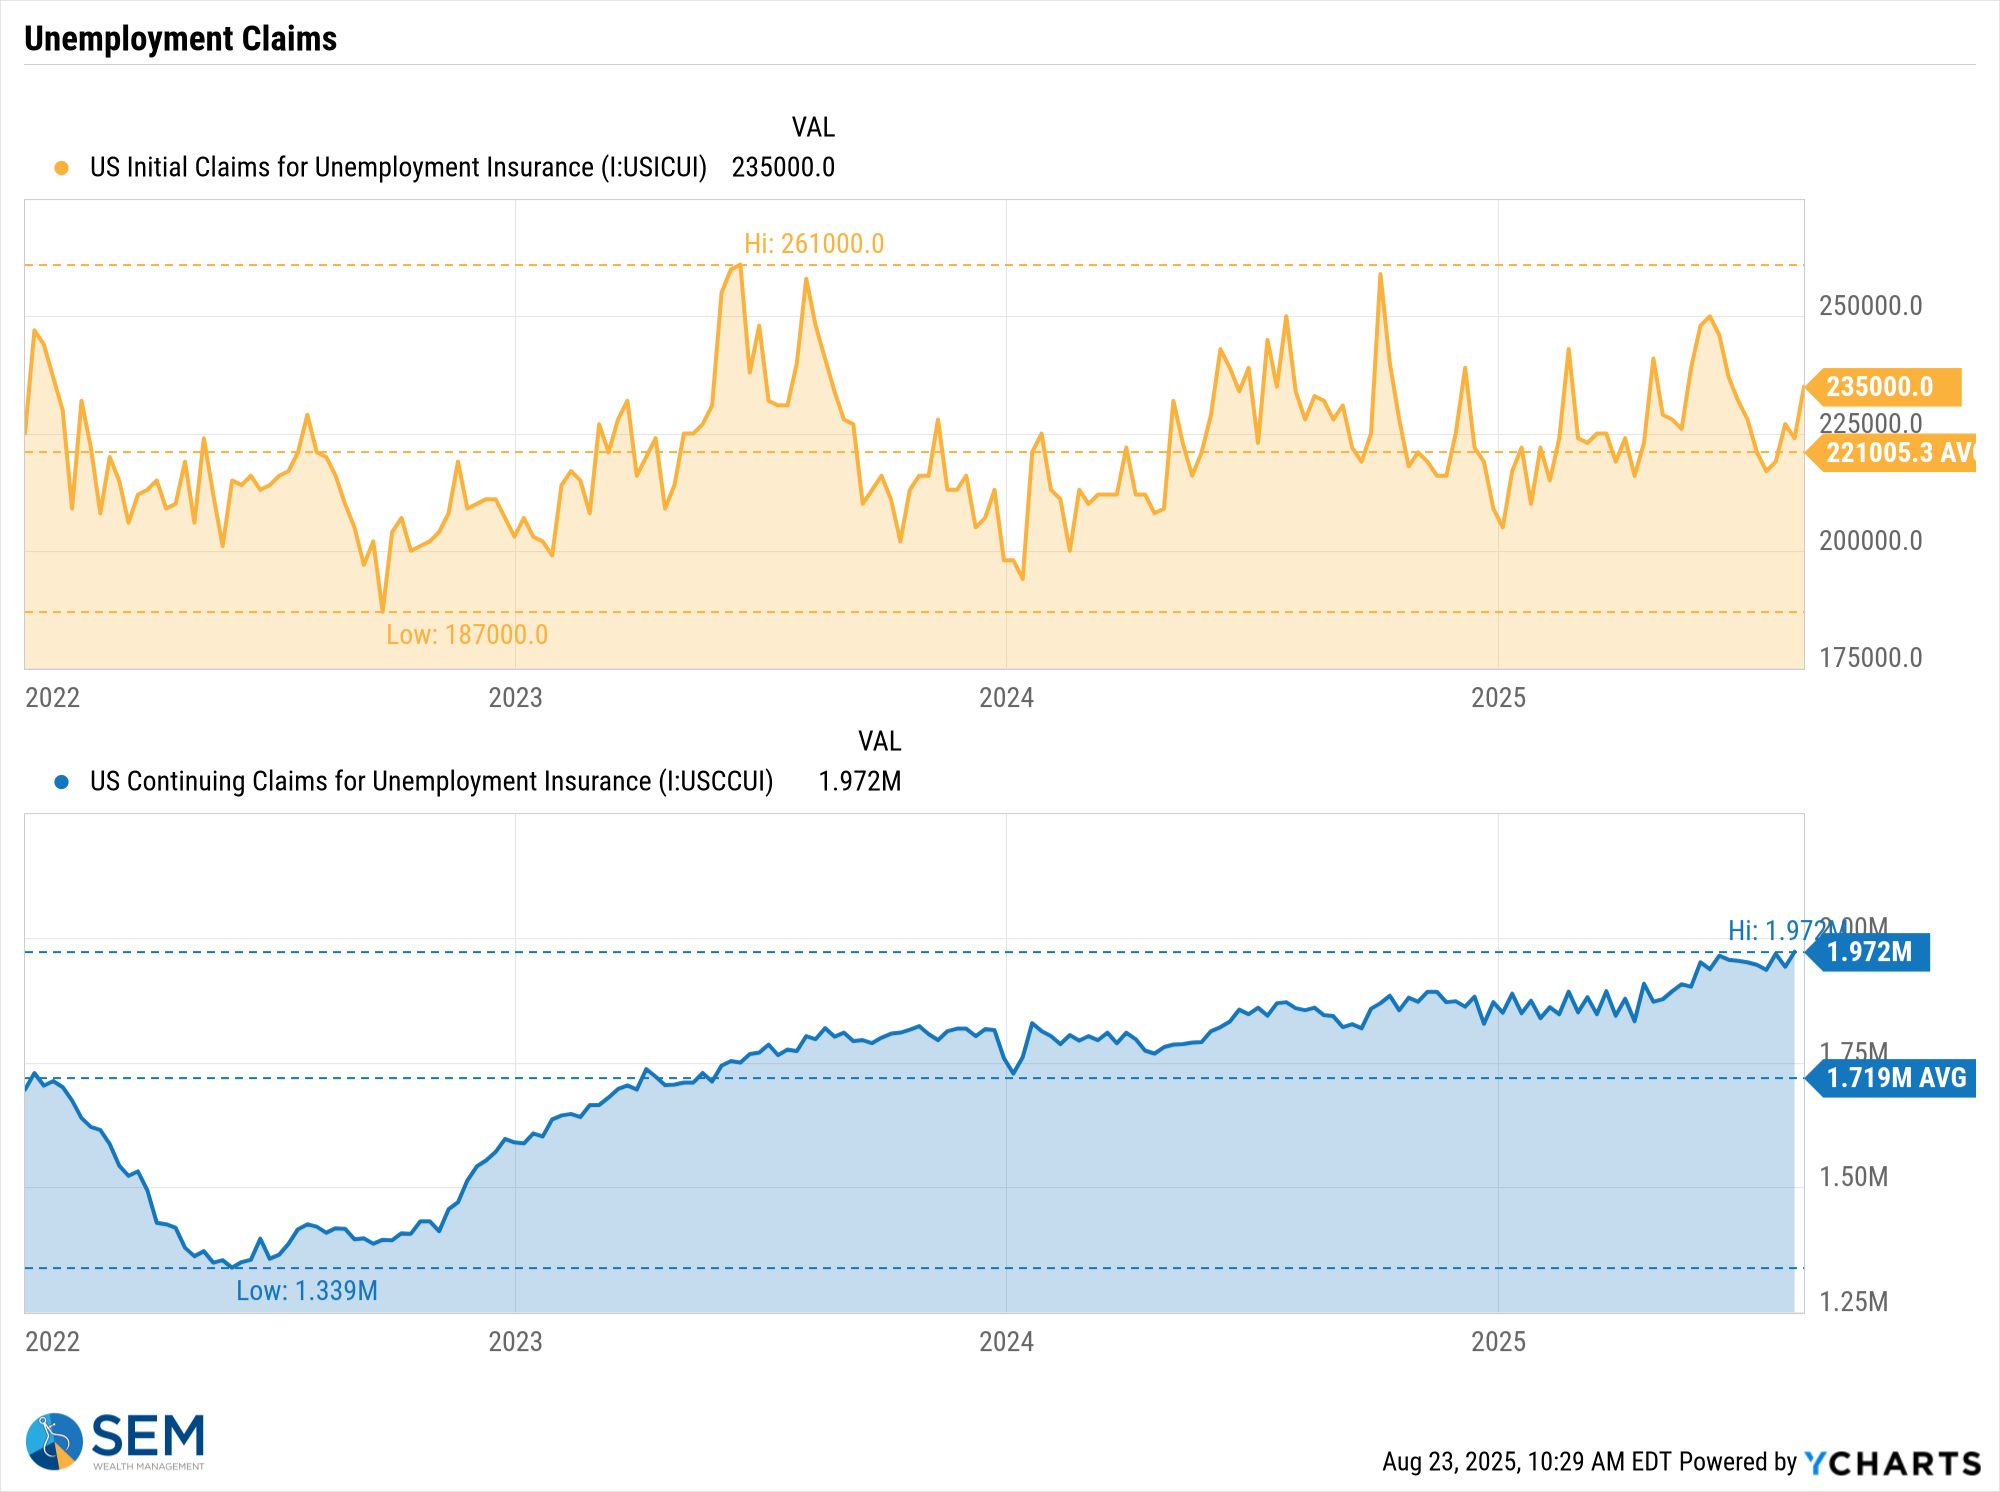
Unemployment claims data remains the most important indicator (in my opinion). Last week we saw initial claims move up and continuing claims remaining at post-COVID highs. A small drop in rates will not impact the labor market, which is why we are watching this so closely.
Anyway, I've rambled enough. Here's a brief summary of the speech and what we will be watching this week.
📋 Powell’s Jackson Hole Speech: Key Themes
| 🧭 Topic | 💬 Summary |
|---|---|
| Economy | Powell said the economy remains resilient but faces growing downside risks. He noted that recent data suggests slowing momentum, especially in consumer spending and housing . |
| Labor Market | Described as “a curious kind of balance,” Powell noted both supply and demand for workers are slowing. This raises downside risks to employment . |
| Interest Rates | Powell left the door open to a rate cut at the September 16–17 meeting, citing a “shifting balance of risks” and the need to “proceed carefully” . |
| Inflation | Still above the Fed’s 2% target. Powell warned that risks to inflation remain tilted to the upside, especially due to tariffs and supply chain disruptions. |
| Housing | Powell acknowledged that higher rates have slowed housing activity, but did not signal any targeted relief for the sector. |
| Trade & Tariffs | Tariffs were called out as a “one-time shift” in price levels, but Powell cautioned that their effects will take time to work through the economy. |
Sources: (1) Wall Street Journal (2) Goldman Sachs (3) Bloomberg (4) Forbes
📅 What to Watch This Week (Aug 26–30)
It's going to be a big week for the economy with reports on 3 key areas – housing, inflation, and consumer spending/sentiment. Here are the top economic releases this week:
| 📆 Date | 🕒 Time (ET) | 🧭 Event |
|---|---|---|
| Tue, Aug 26 | 8:30 AM | Durable Goods Orders (July) |
| 9:00 AM | S&P/Case-Shiller Home Price Index (June) | |
| 10:00 AM | New Home Sales (July) & Consumer Confidence Index (Aug) | |
| Thu, Aug 28 | 8:30 AM | Q2 GDP - second estimate & PCE data |
| 10:00 AM | Pending Home Sales (July) | |
| Fri, Aug 29 | 8:30 AM | Core PCE Deflator, Personal Income & Spending (July) |
| 9:45 AM | Chicago PMI (Aug) | |
| 10:00 AM | Univ. of Michigan Consumer Sentiment (Final Aug) |
Source: TradingCharts Economic Calendar
💼 Earnings to Watch
This week features earnings from several key companies that could influence sentiment, especially given the recent weakness in "AI" stocks:
- Wednesday (Aug 27):
- Nvidia (NVDA)
- CrowdStrike (CRWD)
- Snowflake (SNOW)
- HP (HPQ)
- Veeva Systems (VEEV)
- Thursday (Aug 28):
- Marvell (MRVL)
- Dell (DELL)
- Friday (Aug 29):
- Alibaba (BABA)
- Frontline (FRO)
Source: TipRanks Earnings Calendar
Market Charts
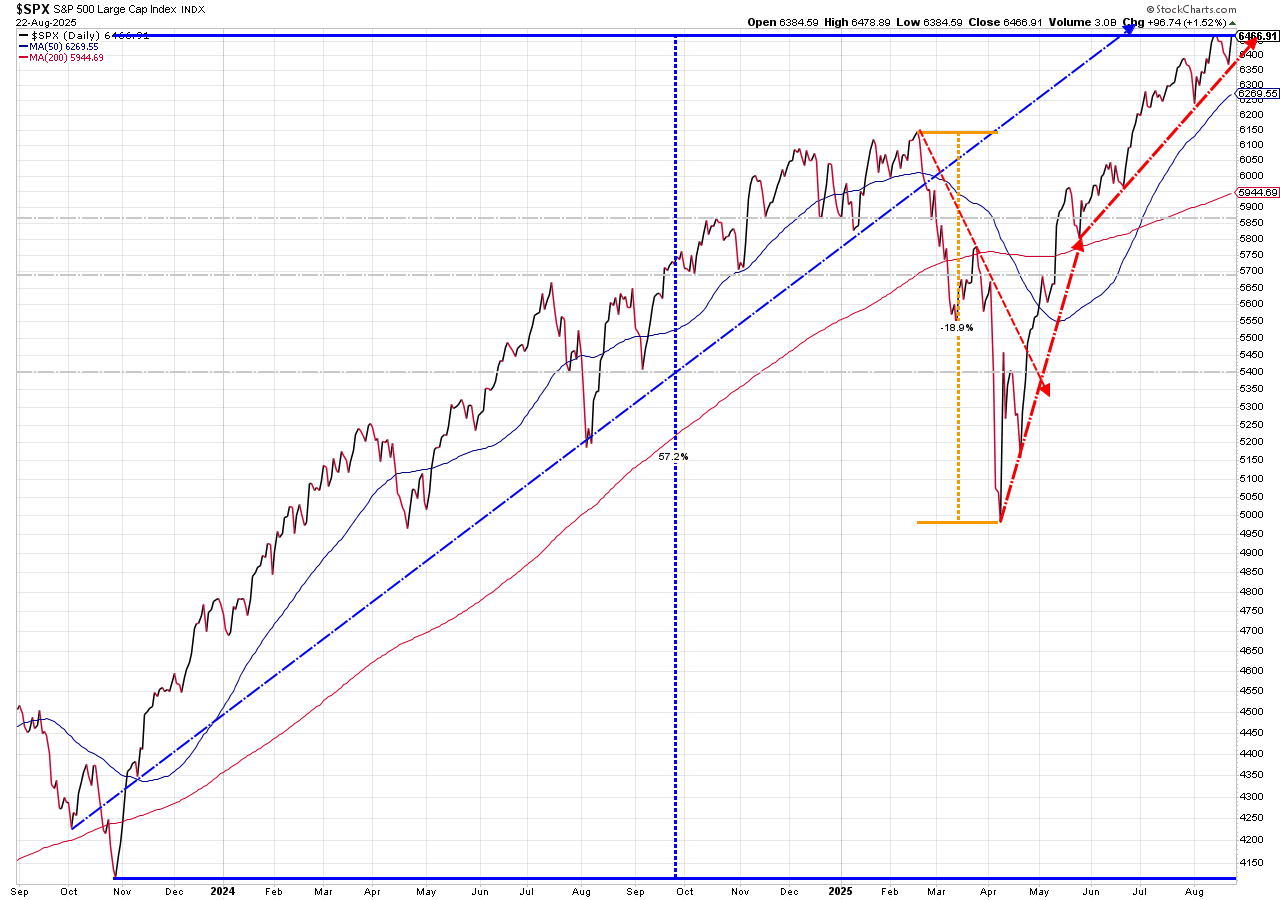
The rally on Friday actually saved the market from what was going to be a bad week.
The one-month hourly chart (a new blog feature with last week shaded), shows the sharp reversal on Friday. It also shows that the S&P is on the verge of a breakout (again).
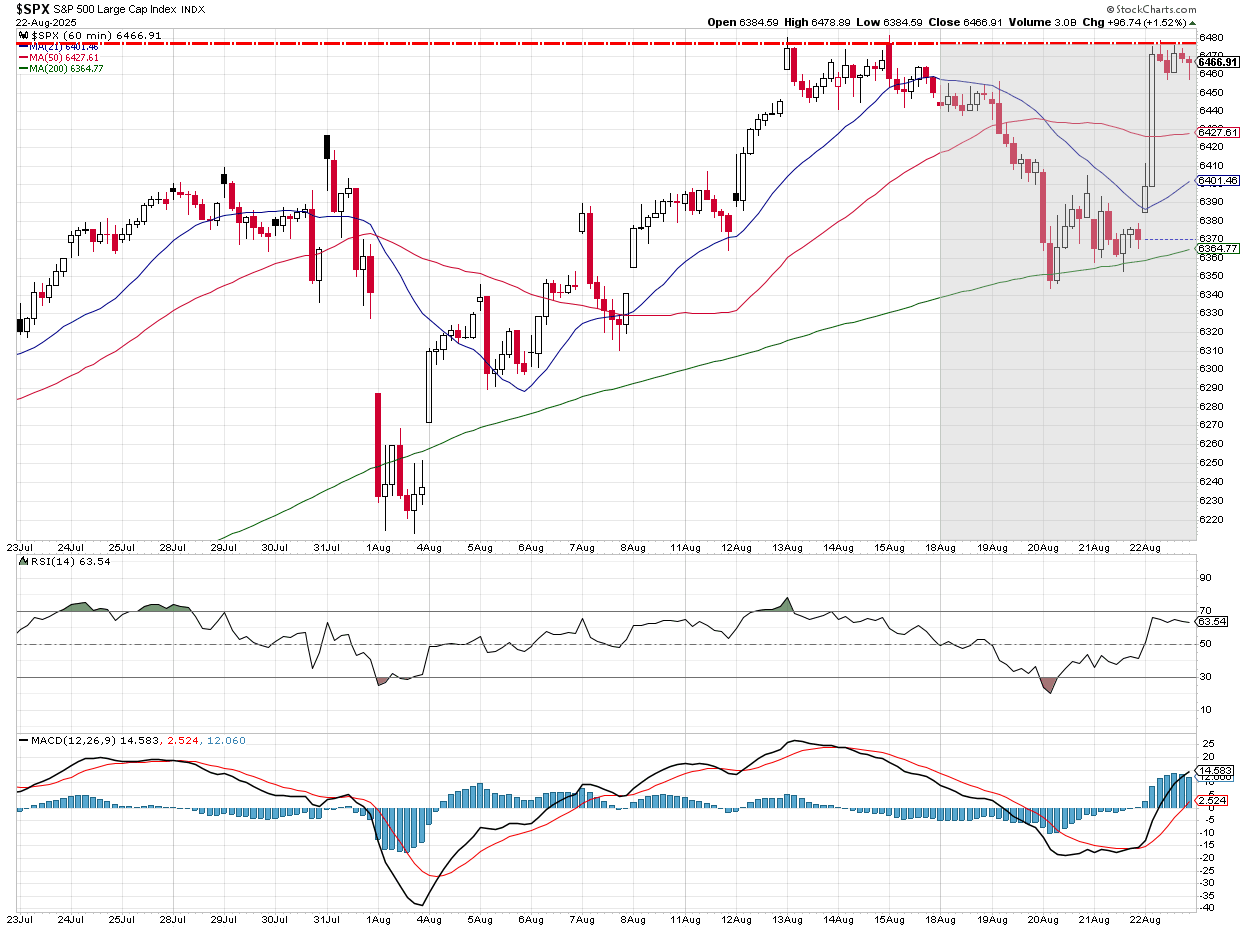
Yes, the market seems overvalued. Yes, there are a lot of things that could go wrong. Yes, just a handful of stocks are driving returns. But, until proven otherwise, the trend is up. If stocks can break out (again), it could lead to another stampede into stocks, especially if the AI-related earnings this week are strong. If not, there is quite a bit of room to fall and still remain in an uptrend.
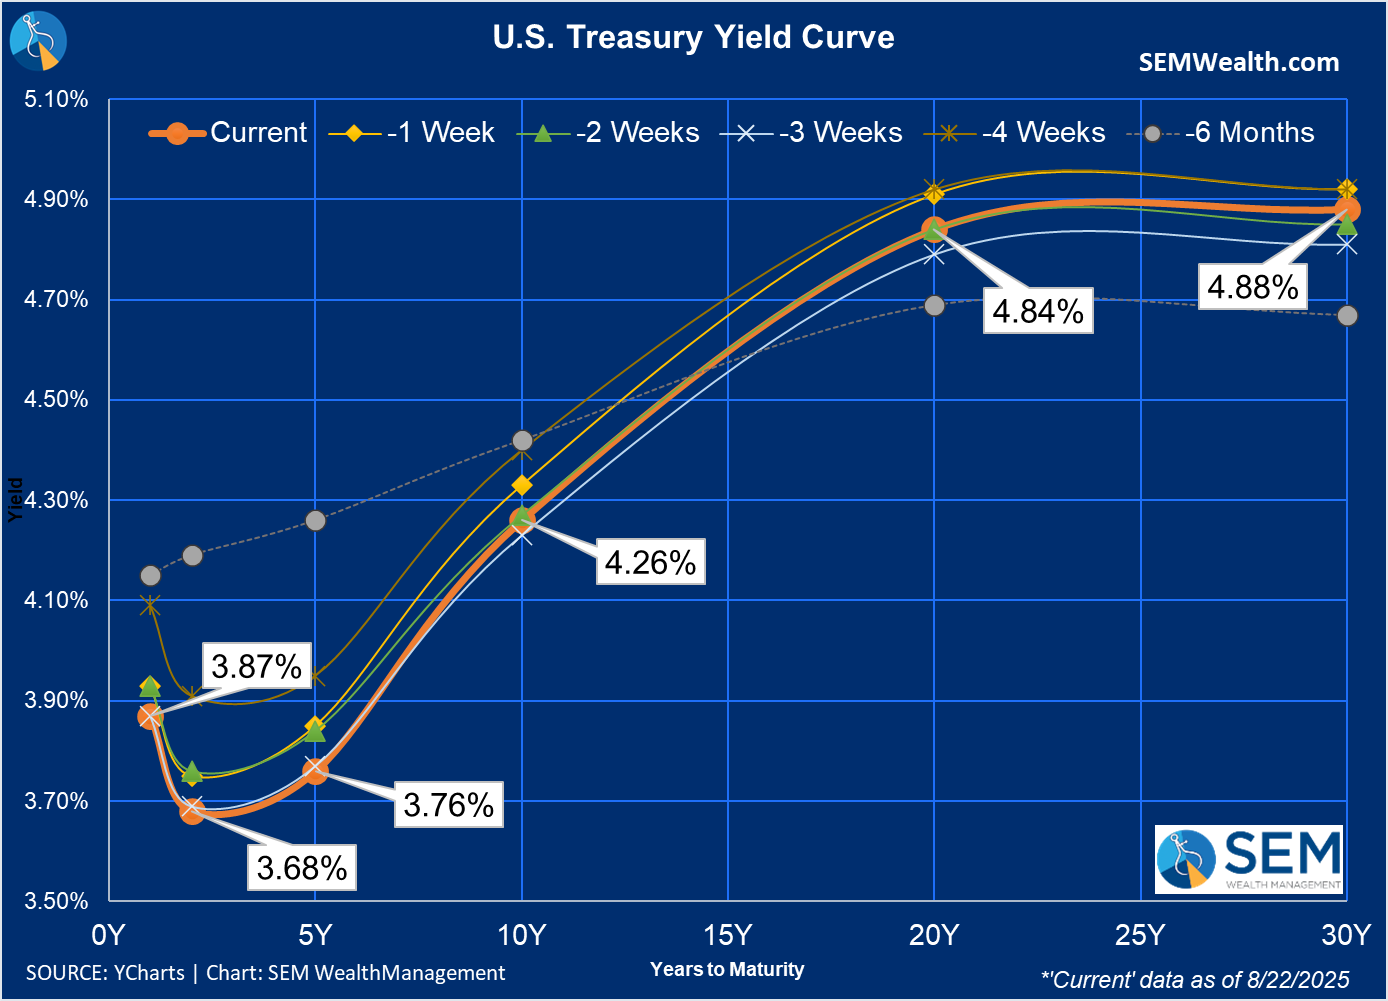
Once again the more important area to watch is in the bond market. Rates across the board fell last week. I think it's interesting looking at the 20 & 30 year rates to see those yields higher than they were 3 weeks ago while shorter-term rates are slightly lower. I'll be watching the divergence between short and long-term rates closely as that could be a sign the bond market is concerned about the direction of the economy and monetary policy. This could make it difficult for the year ahead.
The other area I watch weekly are Corporate Bond spreads. For whatever reason, the bond market sees little chance of a spike in defaults with yields within a whisker of the all-time lows.
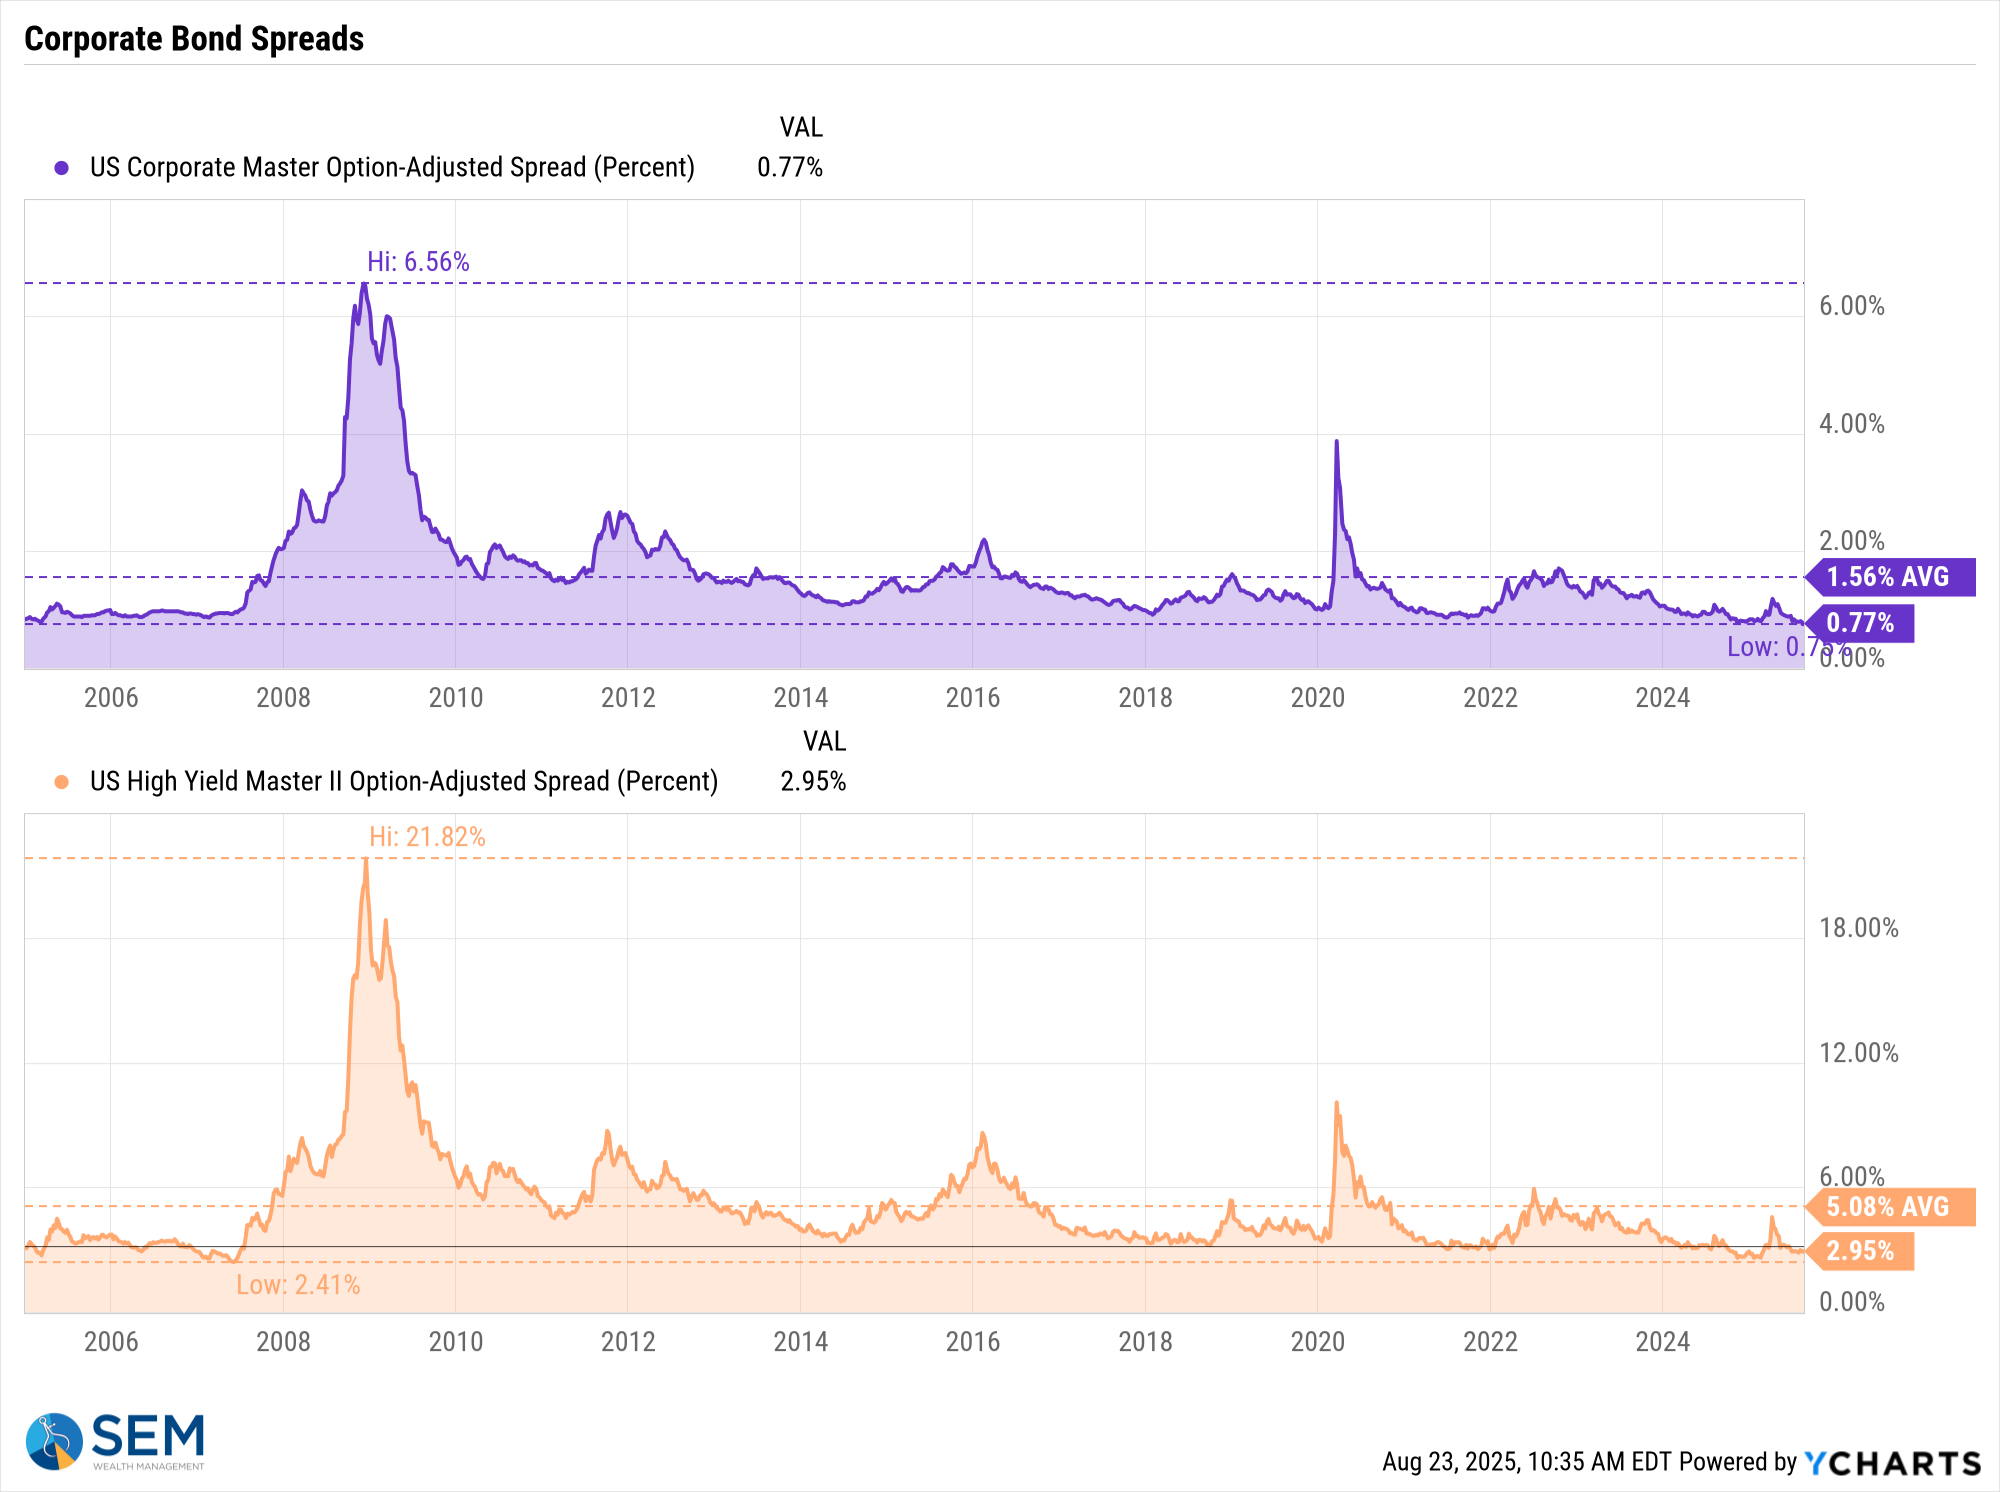
While the chart doesn't go back to the 90s, in both 1999 and 2007 a move higher in corporate spreads while stocks rallied was a key early warning sign something was failing inside the economy.
SEM Market Positioning
| Model Style | Current Stance | Notes |
|---|---|---|
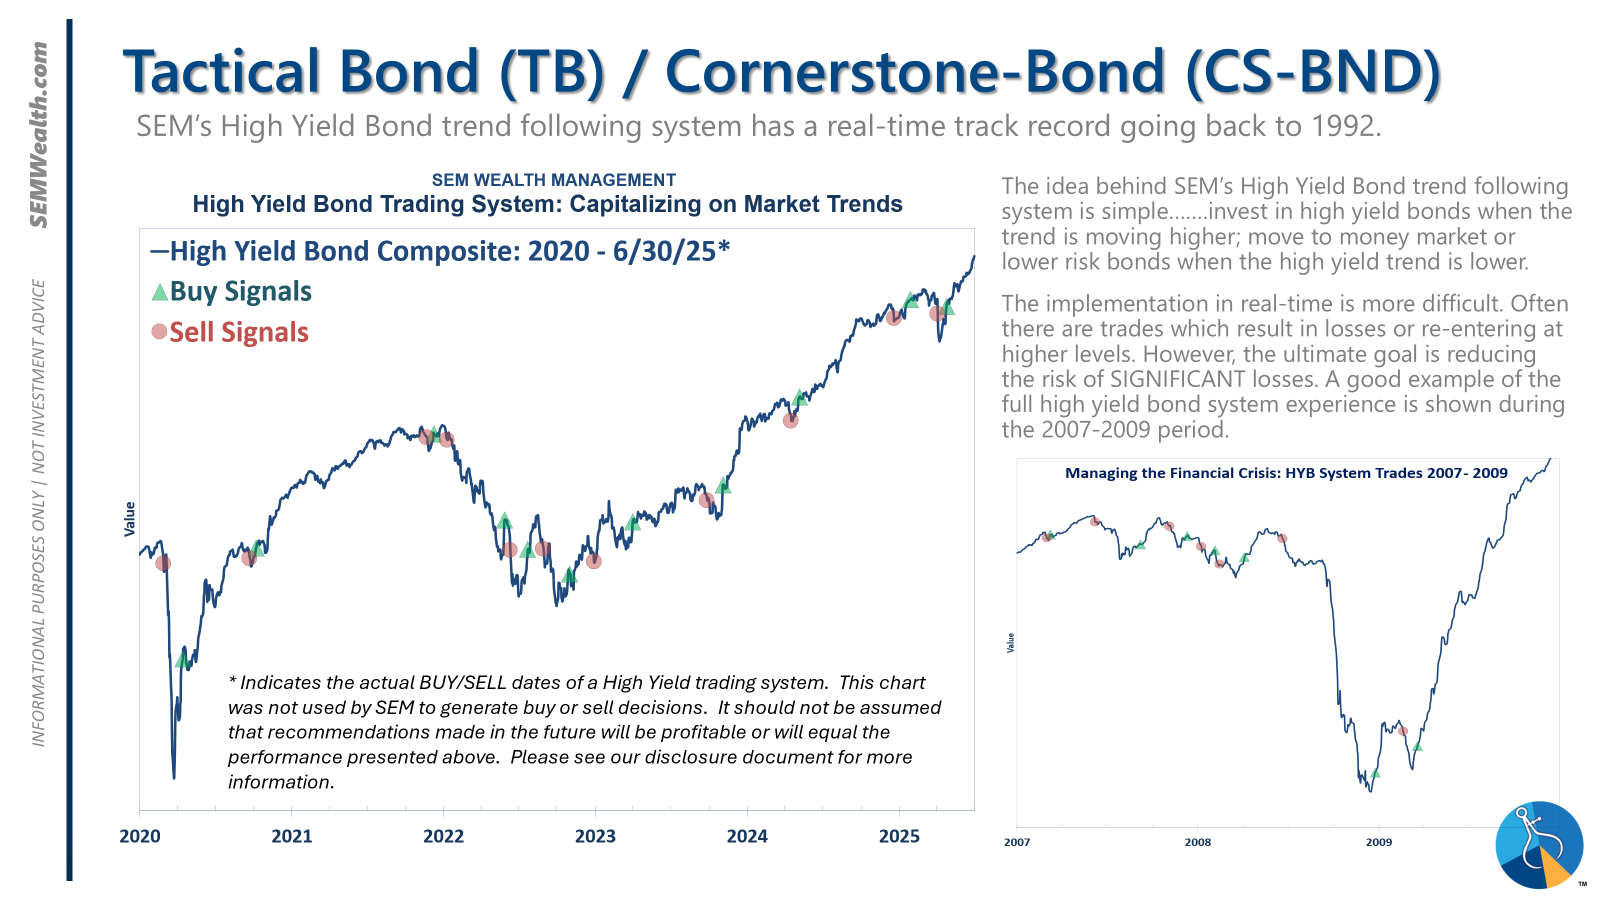
| Tactical | 100% high yield | High-yield spreads holding, but trend is slowing-watching closely |
| Dynamic | Bearish | Economic model turned red – leaning defensive |
| Strategic | Slight under-weight | Trend overlay shaved 10 % equity in April -- added 5% back early July |
SEM deploys 3 distinct approaches – Tactical, Dynamic, and Strategic. These systems have been described as 'daily, monthly, quarterly' given how often they may make adjustments. Here is where they each stand.
Tactical (daily): The high yield system has been invested since 4/23/25 after a short time out of the market following the sell signal on 4/3/25.
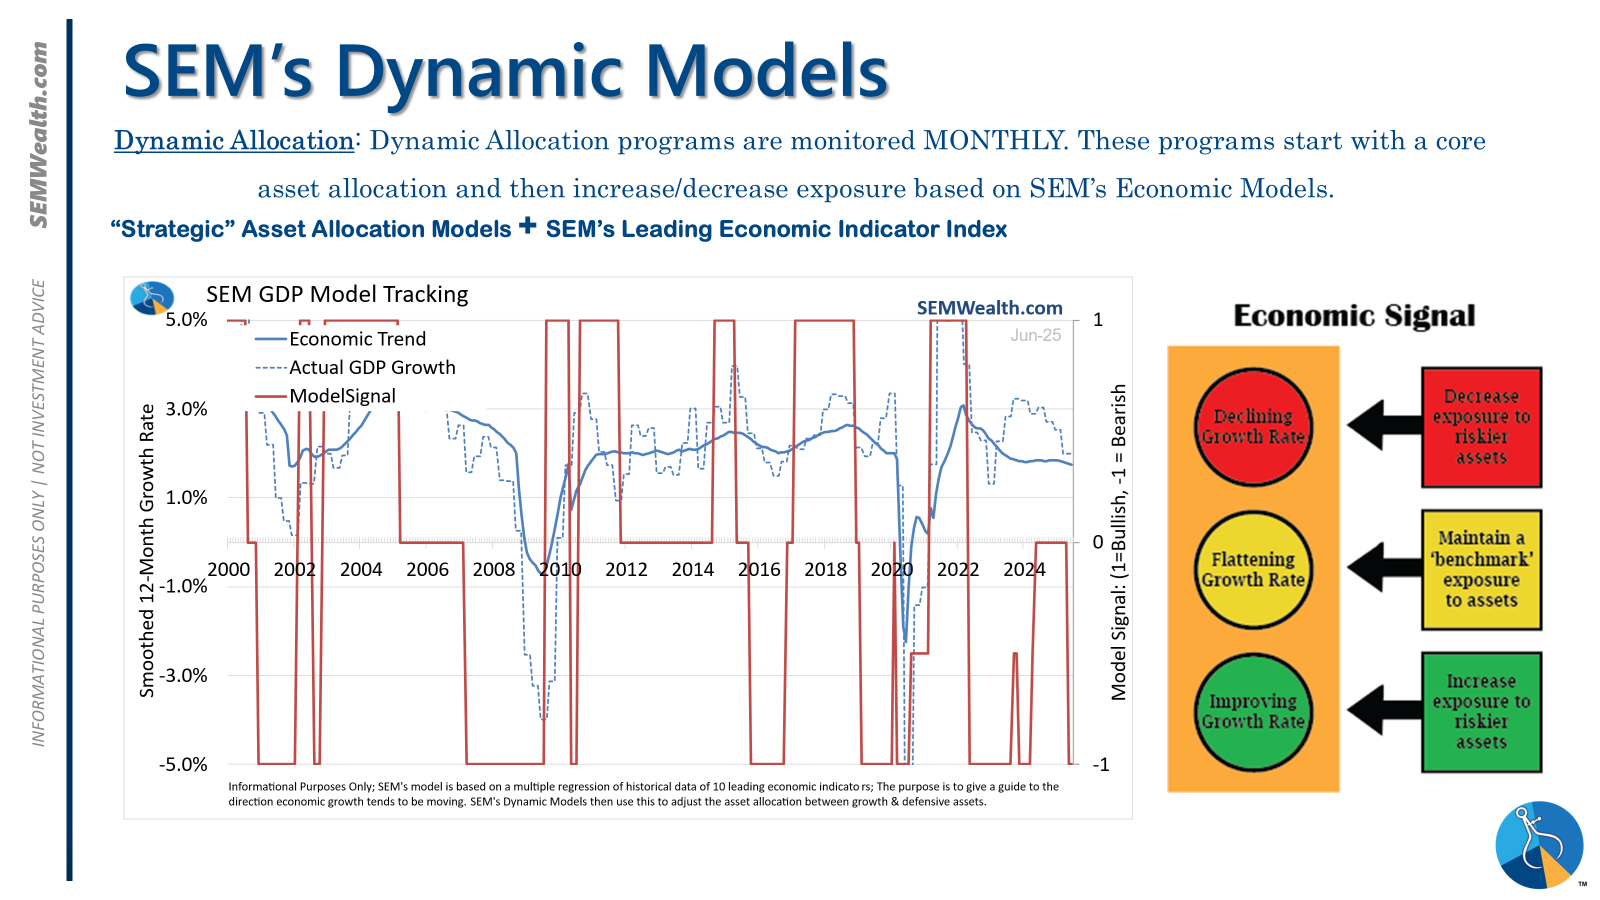
Dynamic (monthly): The economic model went 'bearish' in June 2025 after being 'neutral' for 11 months. This means eliminating risky assets – sell the 20% dividend stocks in Dynamic Income and the 20% small cap stocks in Dynamic Aggressive Growth. The interest rate model is 'bullish' meaning higher duration (Treasury Bond) investments for the bulk of the bonds.
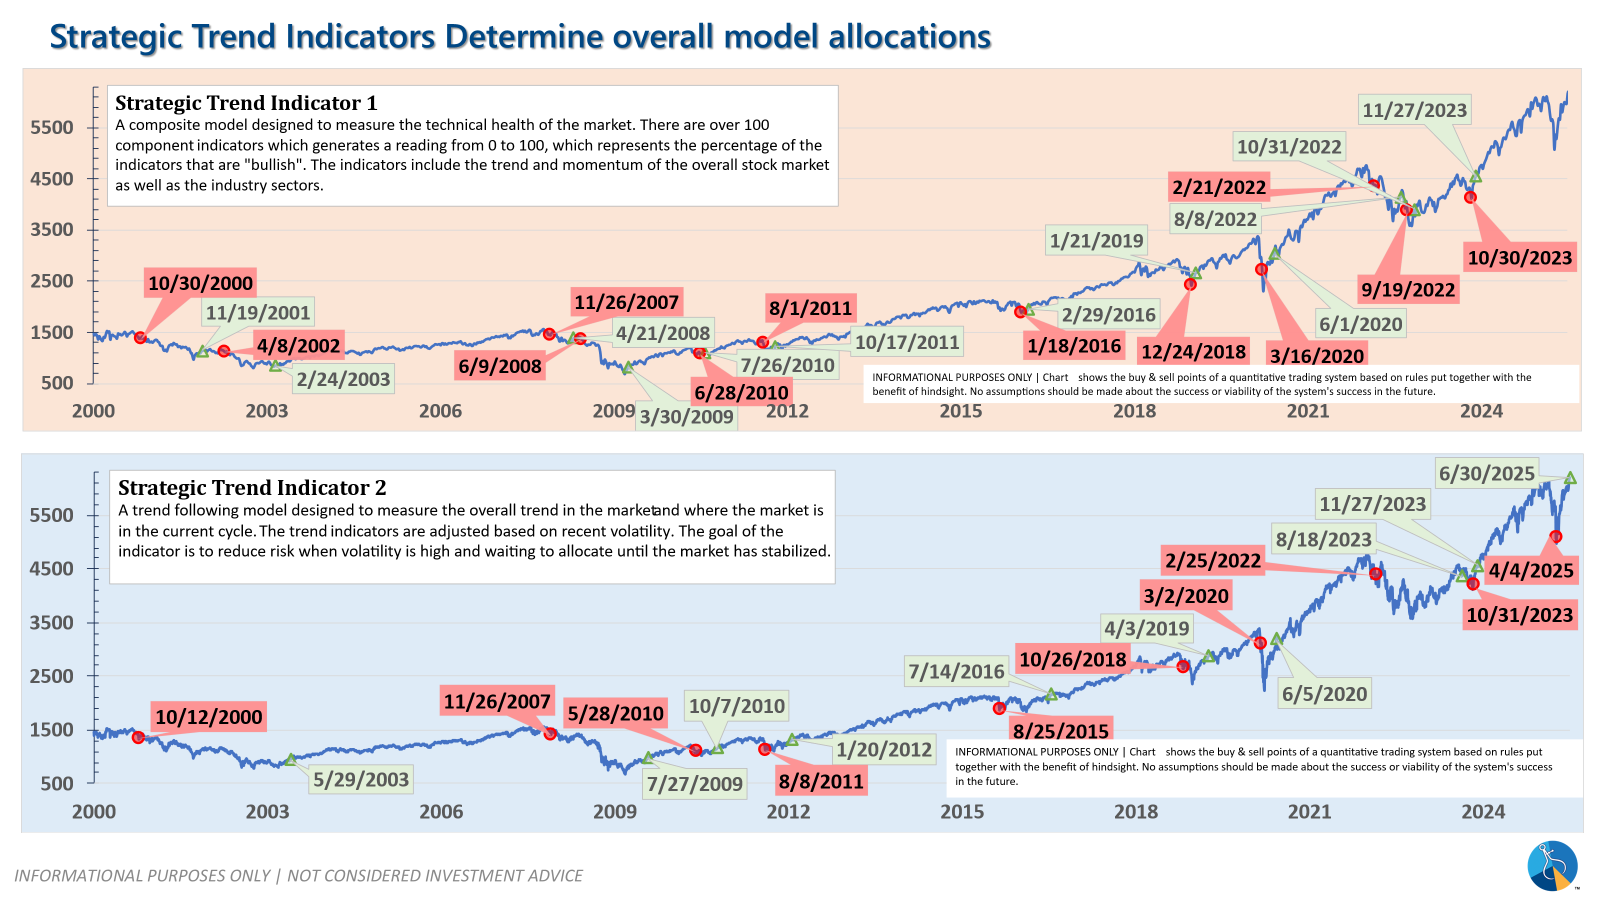
Strategic (quarterly)*: One Trend System sold on 4/4/2025; Re-entered on 6/30/2025
The core rotation is adjusted quarterly. On August 17 it rotated out of mid-cap growth and into small cap value. It also sold some large cap value to buy some large cap blend and growth. The large cap purchases were in actively managed funds with more diversification than the S&P 500 (banking on the market broadening out beyond the top 5-10 stocks.) On January 8 it rotated completely out of small cap value and mid-cap growth to purchase another broad (more diversified) large cap blend fund along with a Dividend Growth fund.
The * in quarterly is for the trend models. These models are watched daily but they trade infrequently based on readings of where each believe we are in the cycle. The trend systems can be susceptible to "whipsaws" as we saw with the recent sell and buy signals at the end of October and November. The goal of the systems is to miss major downturns in the market. Risks are high when the market has been stampeding higher as it has for most of 2023. This means sometimes selling too soon. As we saw with the recent trade, the systems can quickly reverse if they are wrong.
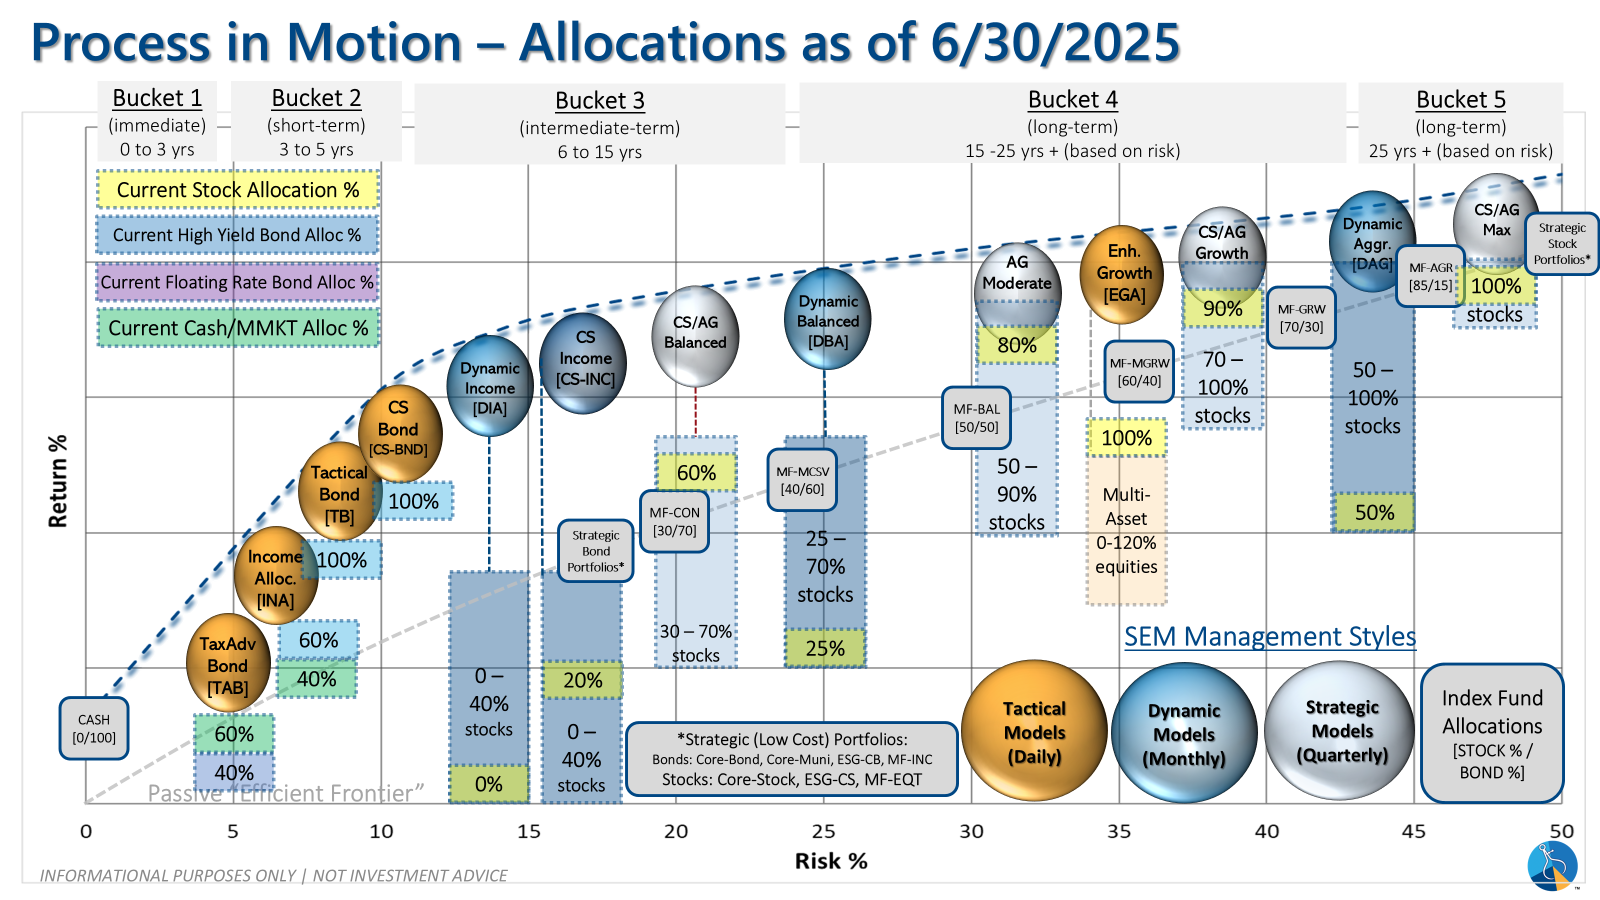
Overall, this is how our various models stack up based on the last allocation change:
Curious if your current investment allocation aligns with your overall objectives and risk tolerance? Take our risk questionnaire


