
Given the shortened week following the Labor Day weekend, I'm going to keep my normally much longer market commentary to a minimum and let the charts tell the story of last week.
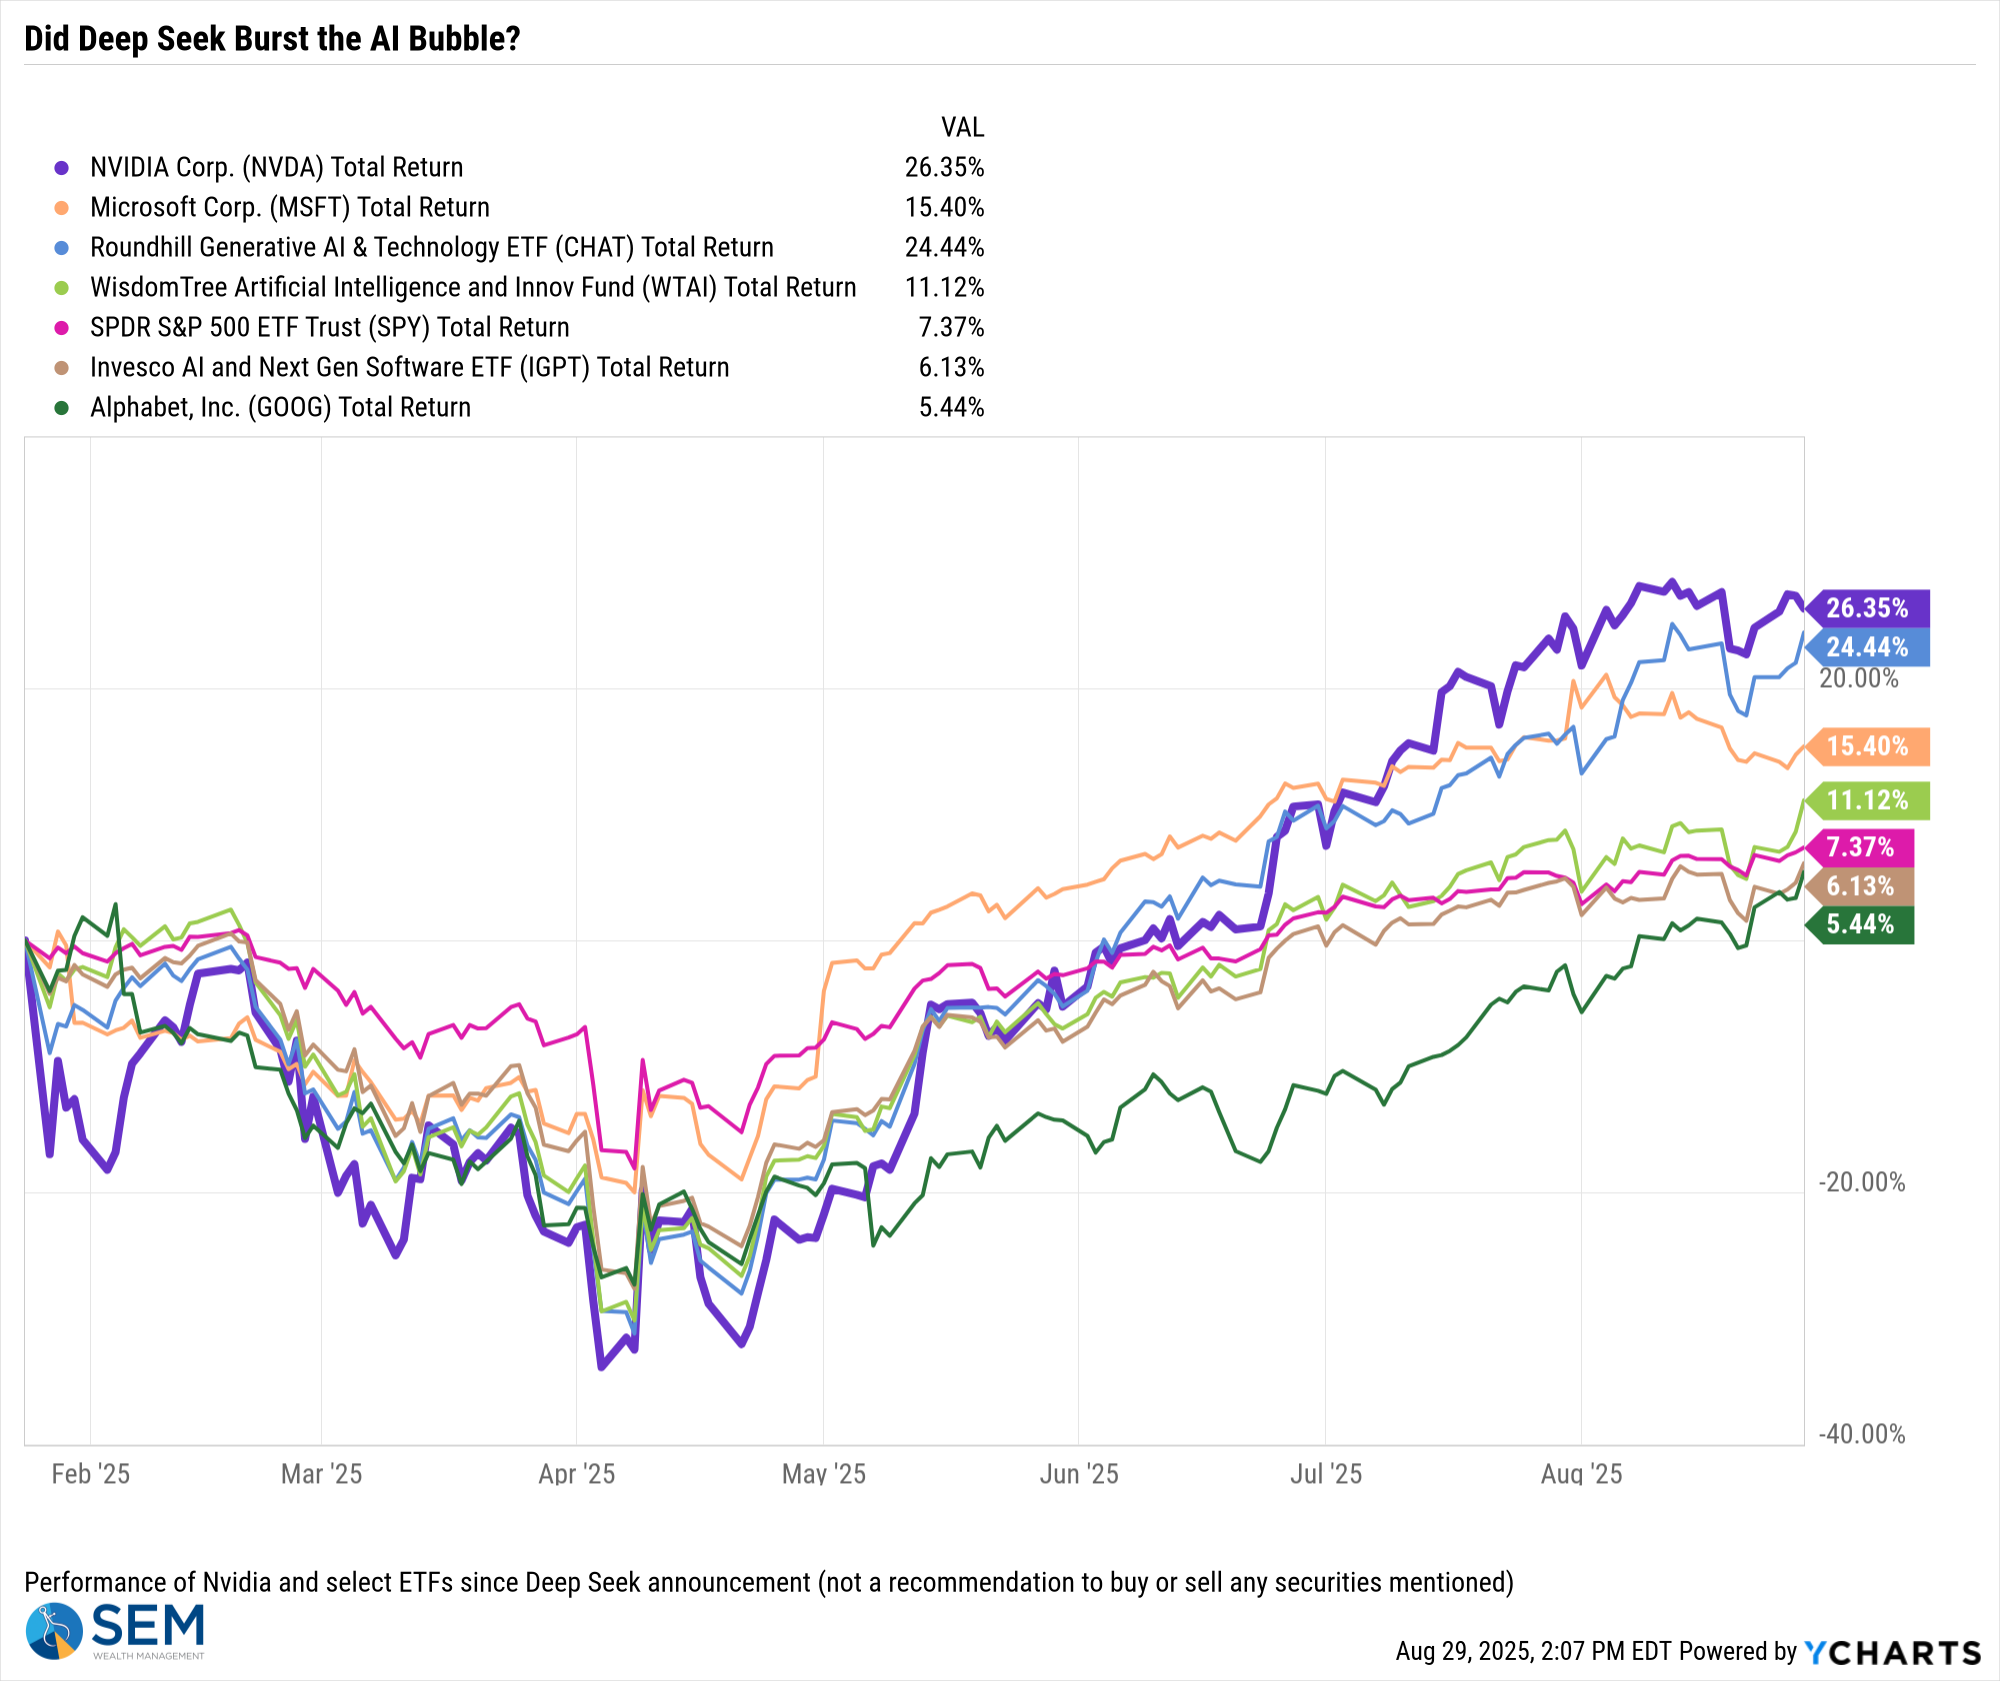
"AI" stocks took it on the chin on Friday, but are still a key driver of the market
Nvidia's earnings (see Toby's take below) were strong, but the market wanted more. That led to concerns over how much MORE growth we will see in AI-related earnings. We've seen a nice run since the "Deep Seek Scare" at the start of the year, so these stocks are due for a pullback. Will it turn into more? Time will tell.
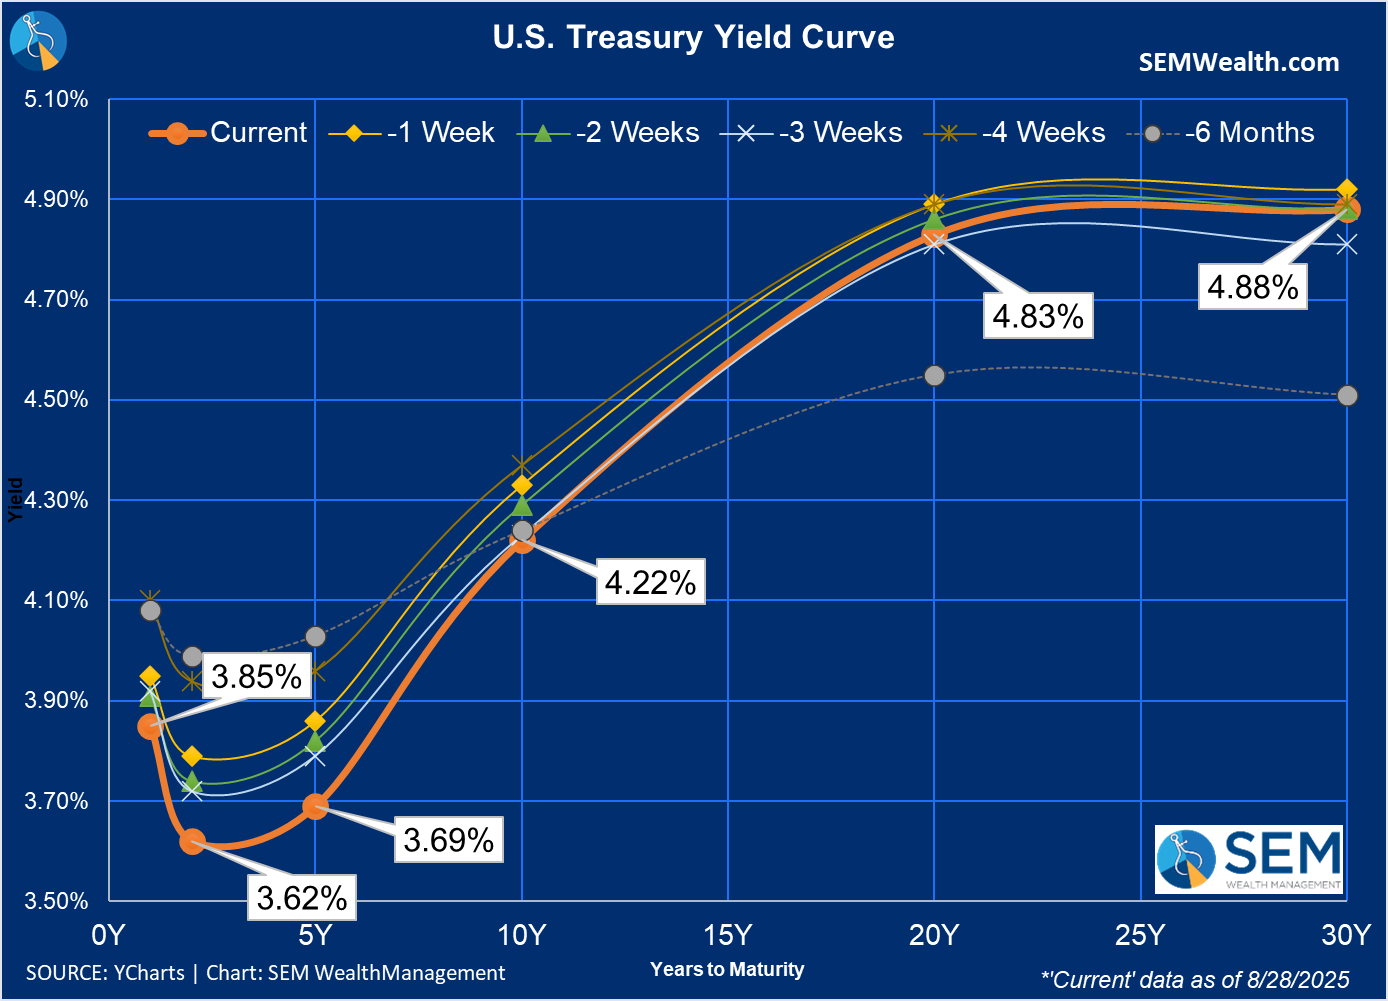
Rates are dropping, but the curve is still 'abnormal'
Even after Friday's increase in rates, we saw yields drop nicely across the board last week. The short-term inversion in rates between 3 month and 5 years remains a cause for concern for both the economy and normal financial market functions.
** The late Friday ruling from a Federal Appeals Court that declared that most of President Trump's tariffs are illegal has caused Treasury yields to spike over concerns the US may have to refund the revenue collected thus far. **
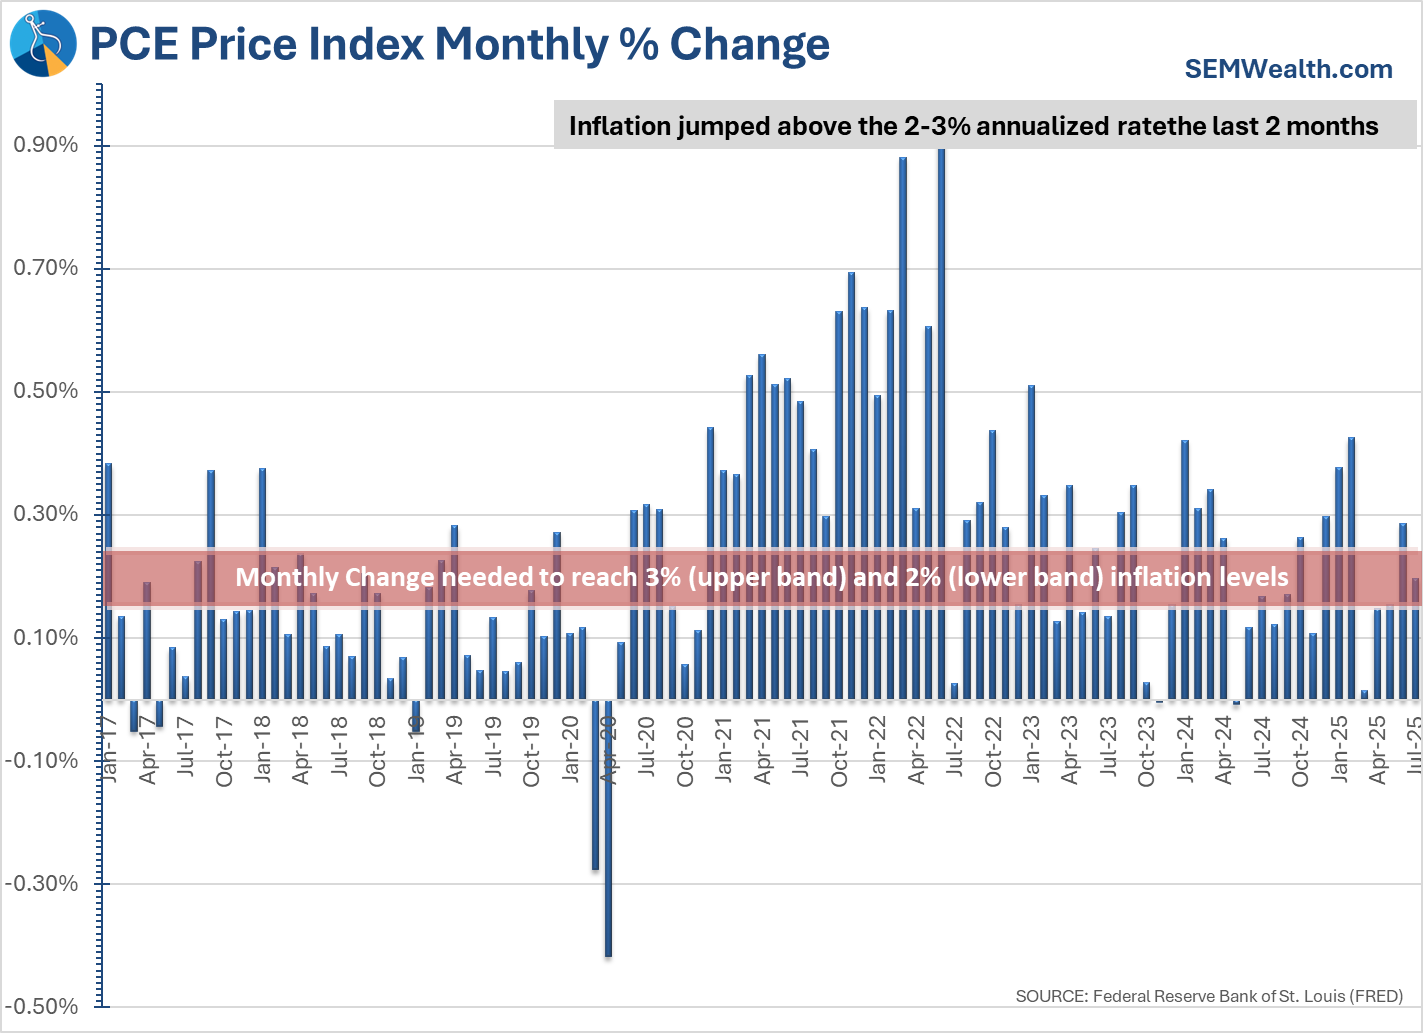
Inflation is increasing
Friday's other focus was the Fed's preferred inflation gauge, the PCE Price Index. Like the CPI and PPI earlier in the month, it does not tell the story Fed Chair Jerome Powell told a few weeks ago at Jackson Hole. Inflation is moving in the wrong direction.
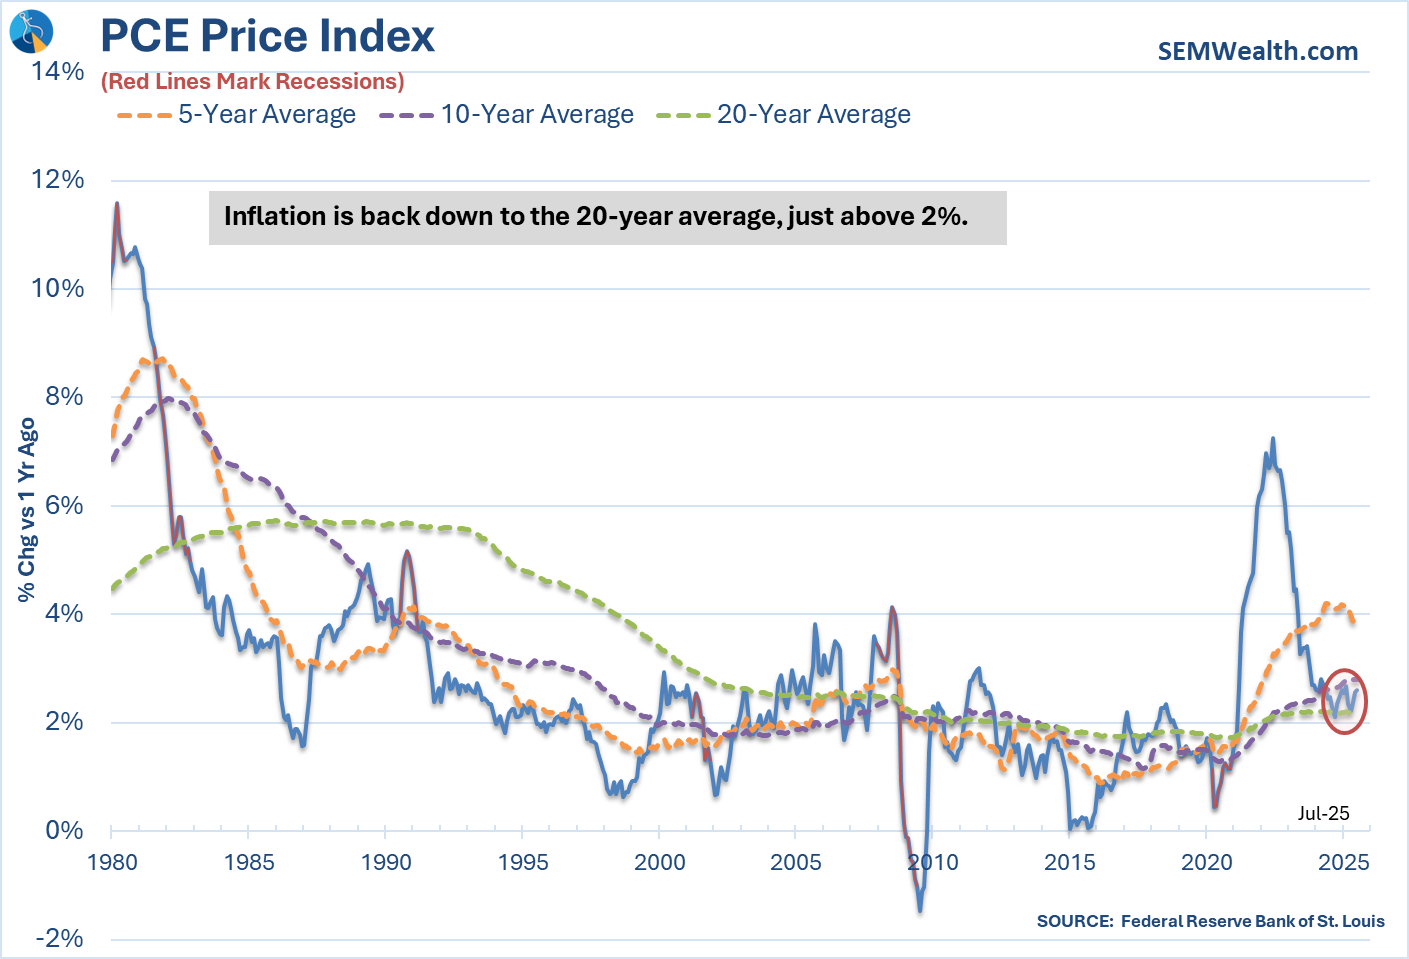
Longer-term, the 1-year number is again moving higher, currently above the 20-year average we've enjoyed and moving back to the new 10-year average near 3%.
Inflation and what it means for interest rates is hitting other areas of the economy.
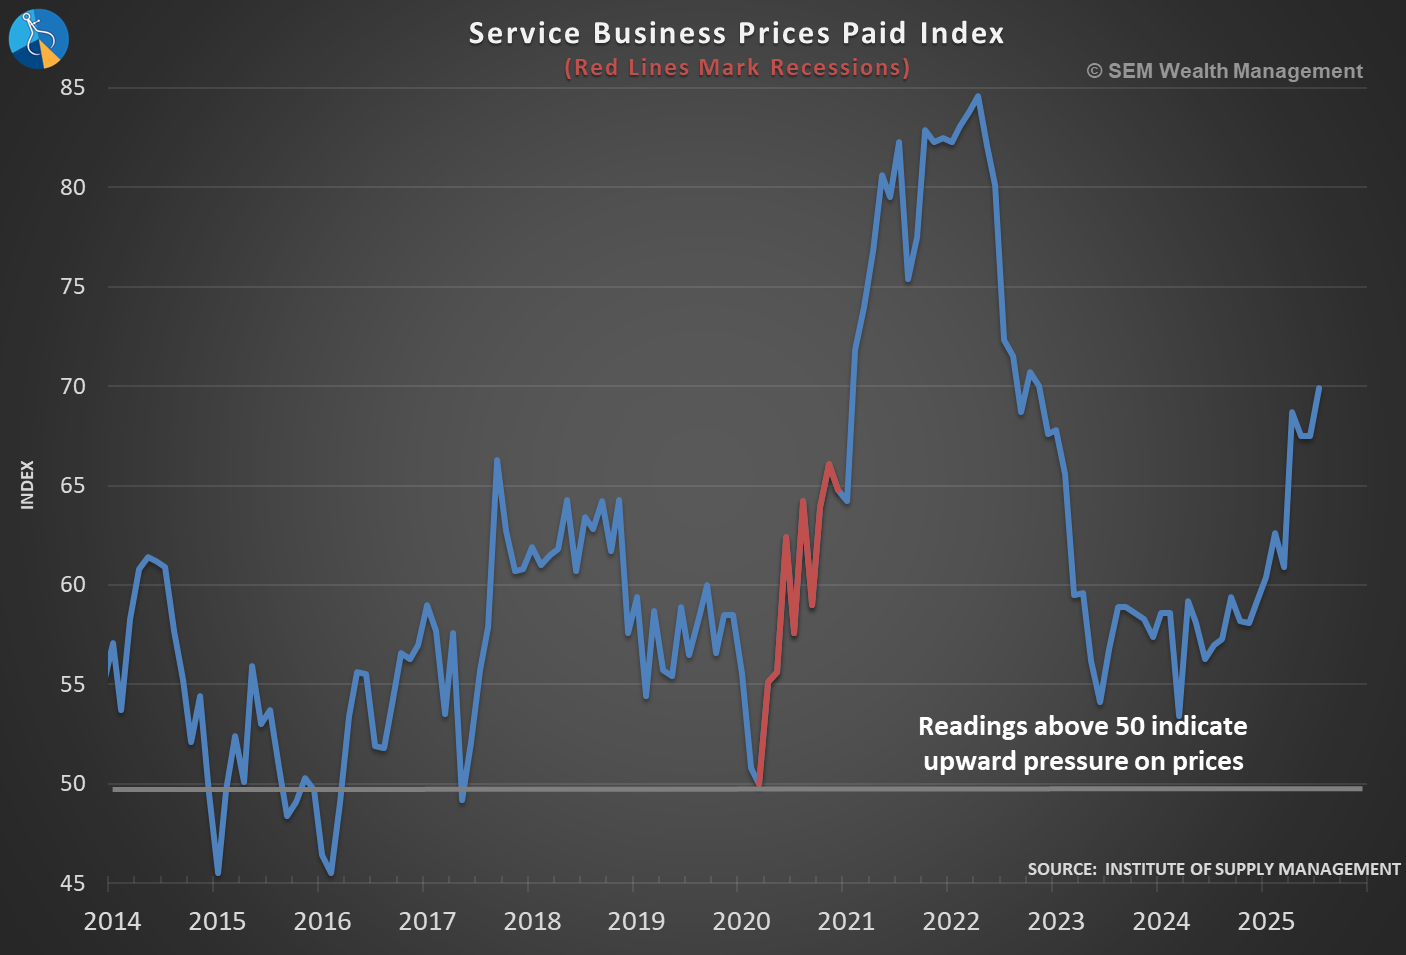
Service sector inflation is heating up rapidly
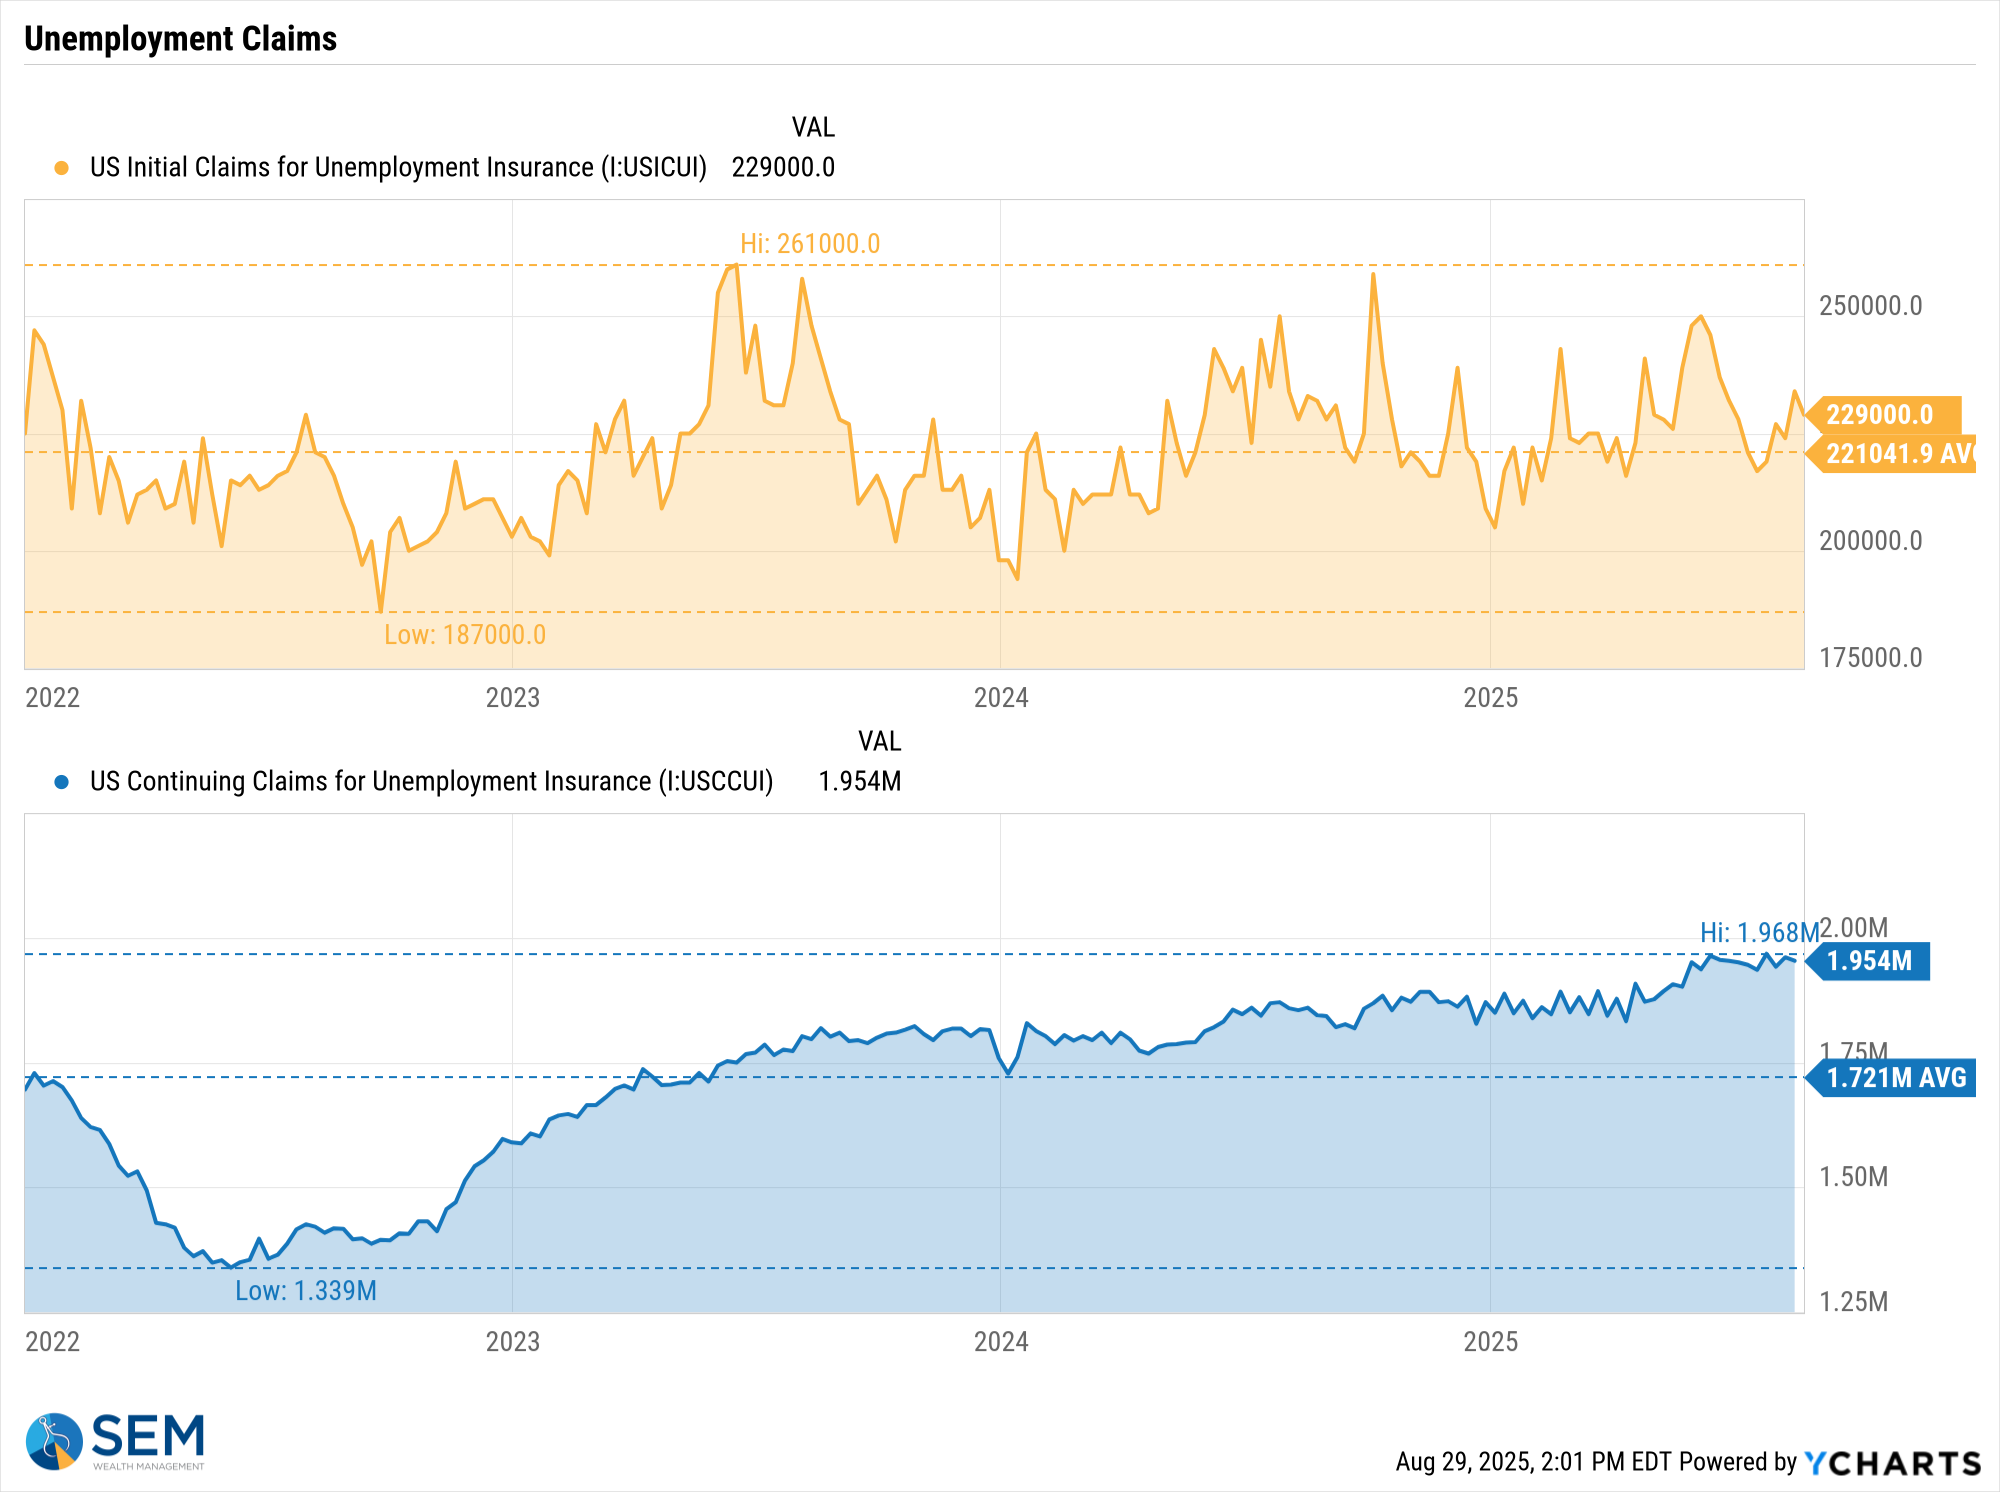
Labor market is stalling out
If you lose your job, you may not find another one anytime soon
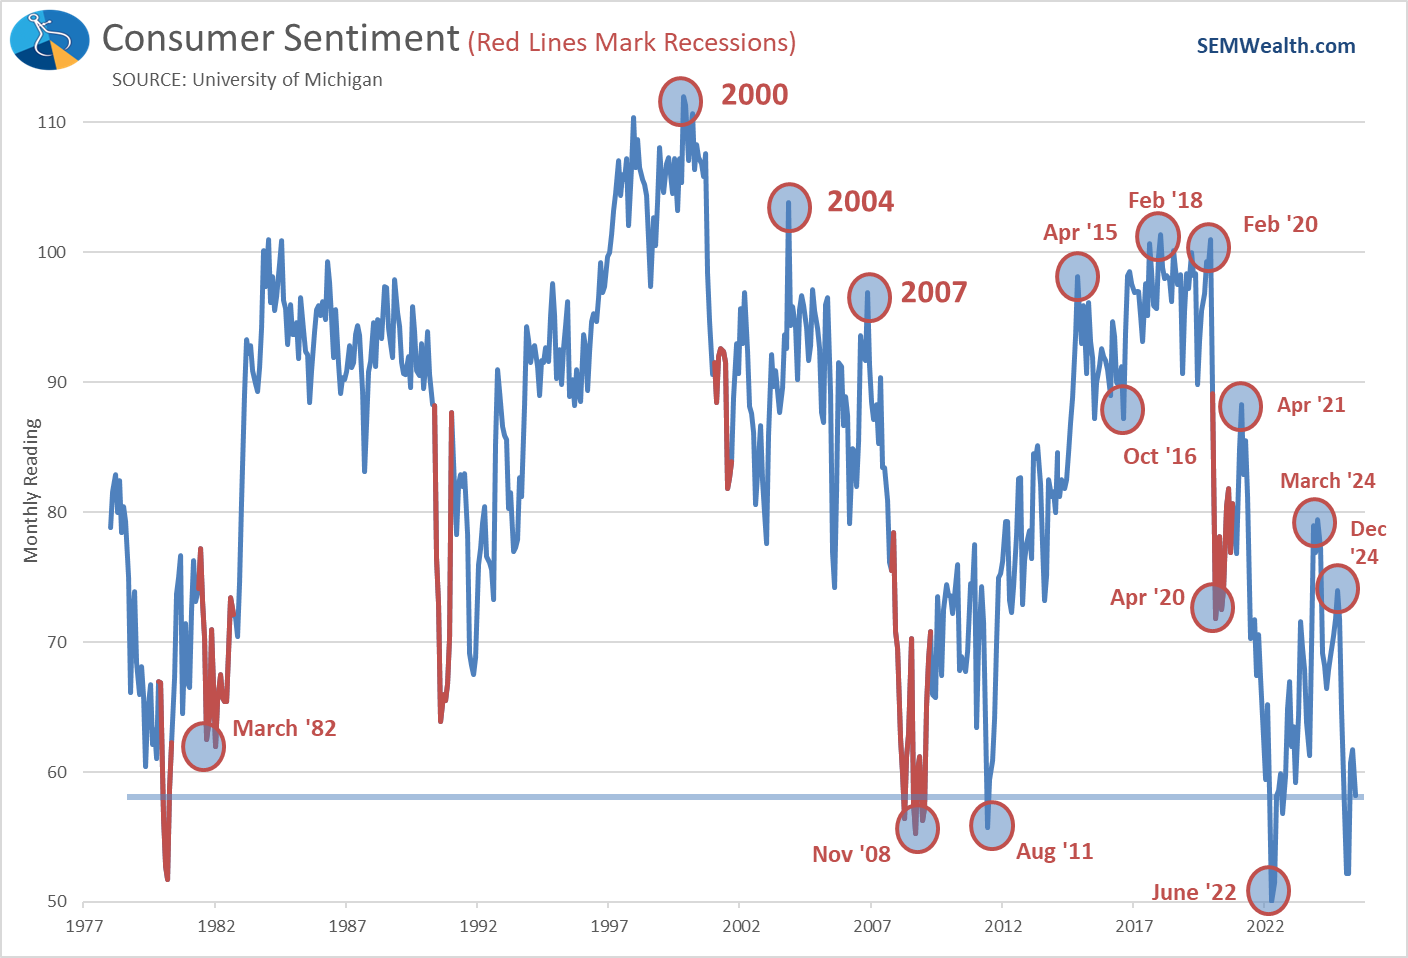
Consumer Sentiment is falling again.
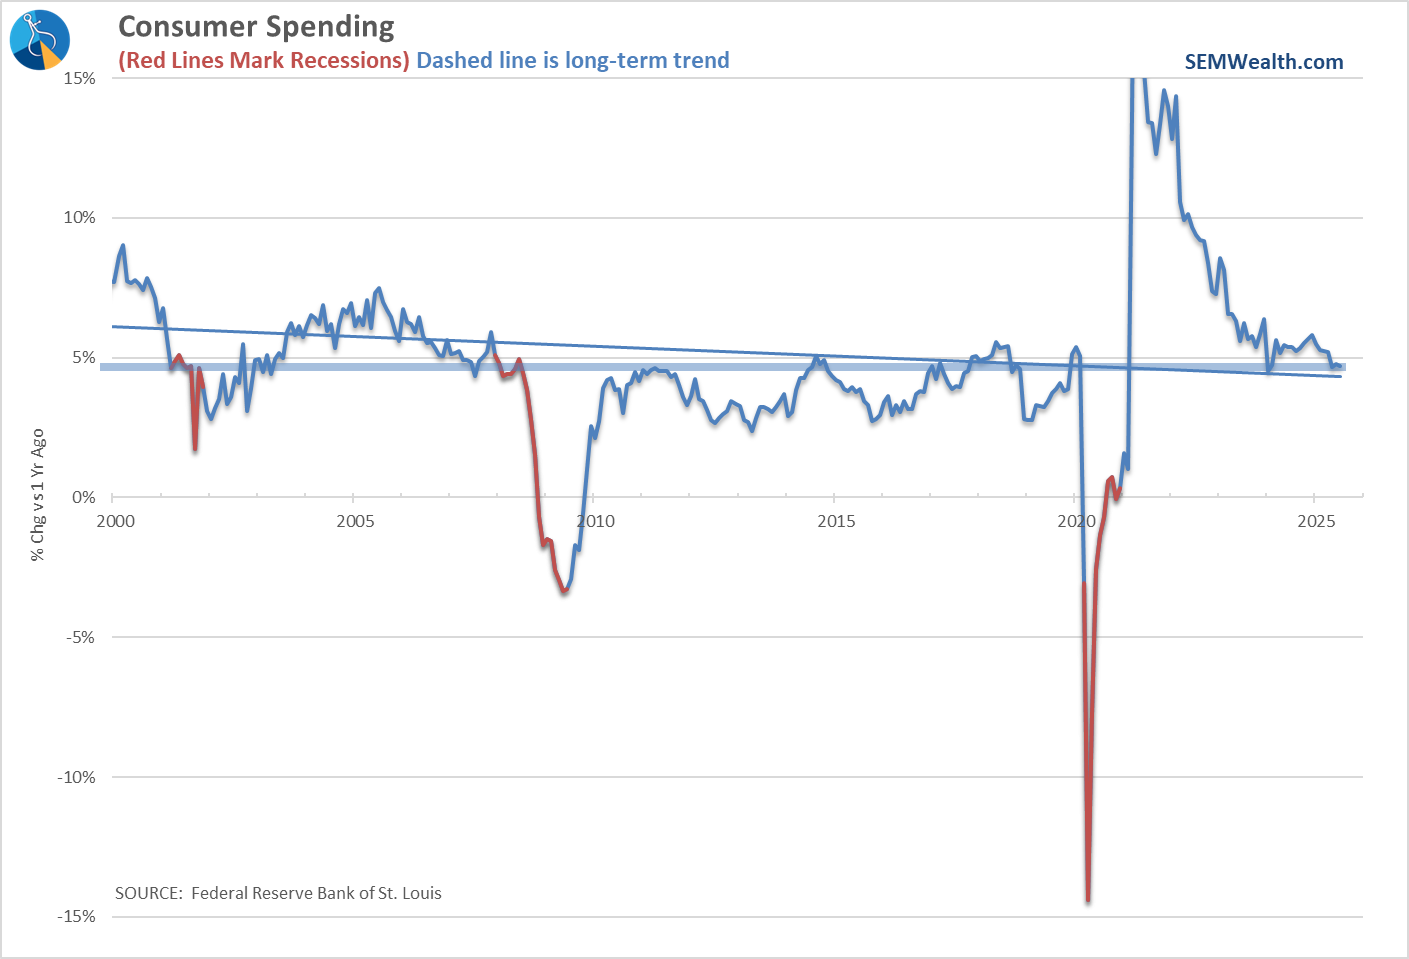
Consumer spending is leveling off
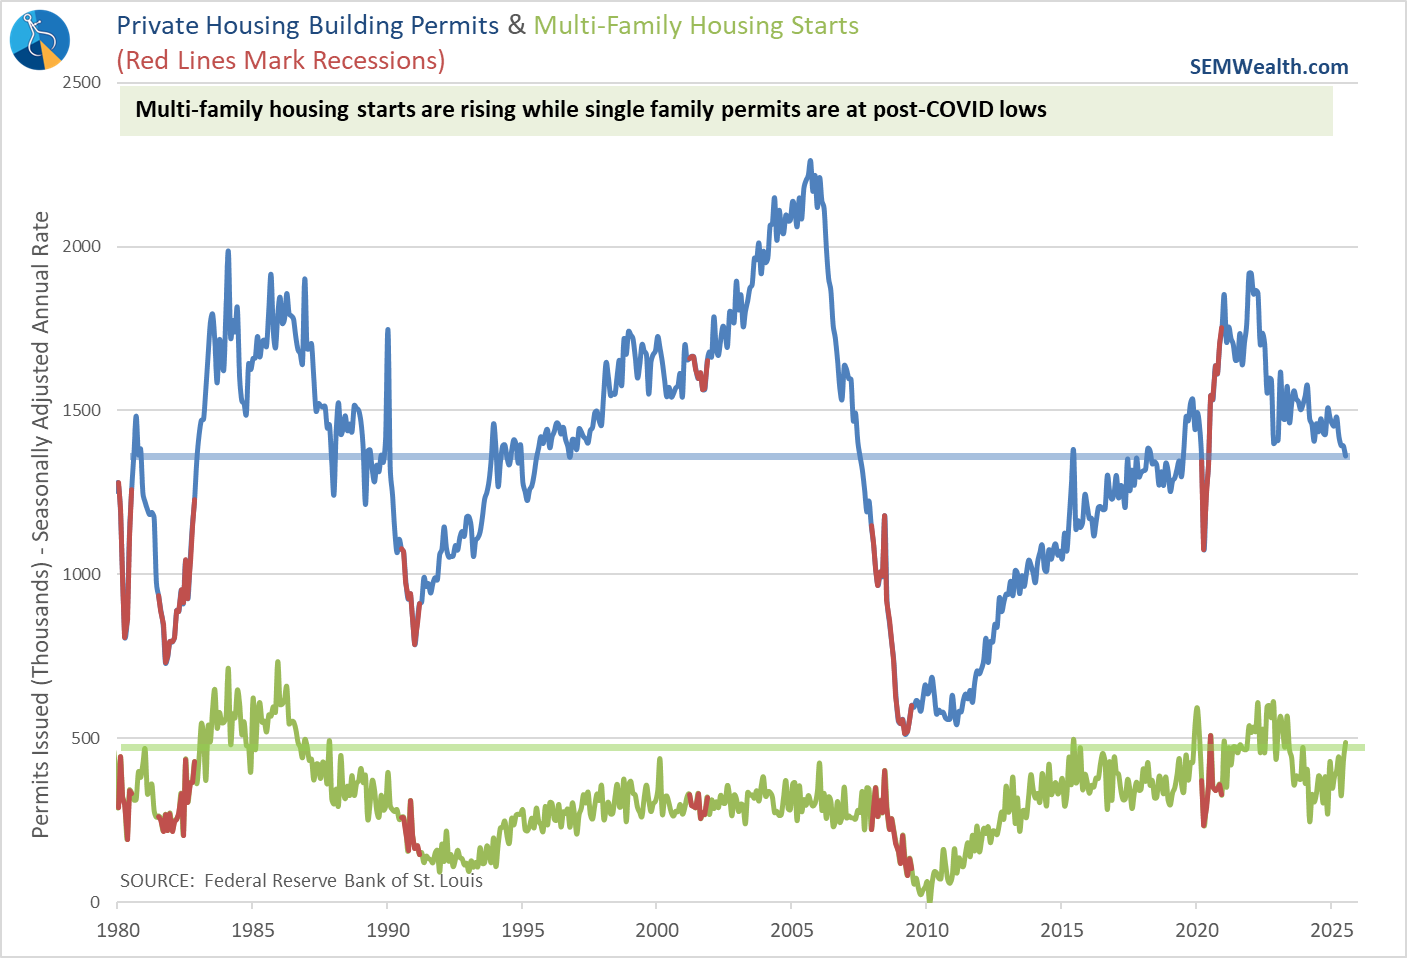
The housing market is a problem.
How big, I don't know just yet, but it's something we should keep our eye on. Cutting short-term rates may not help, especially if inflation continues higher.
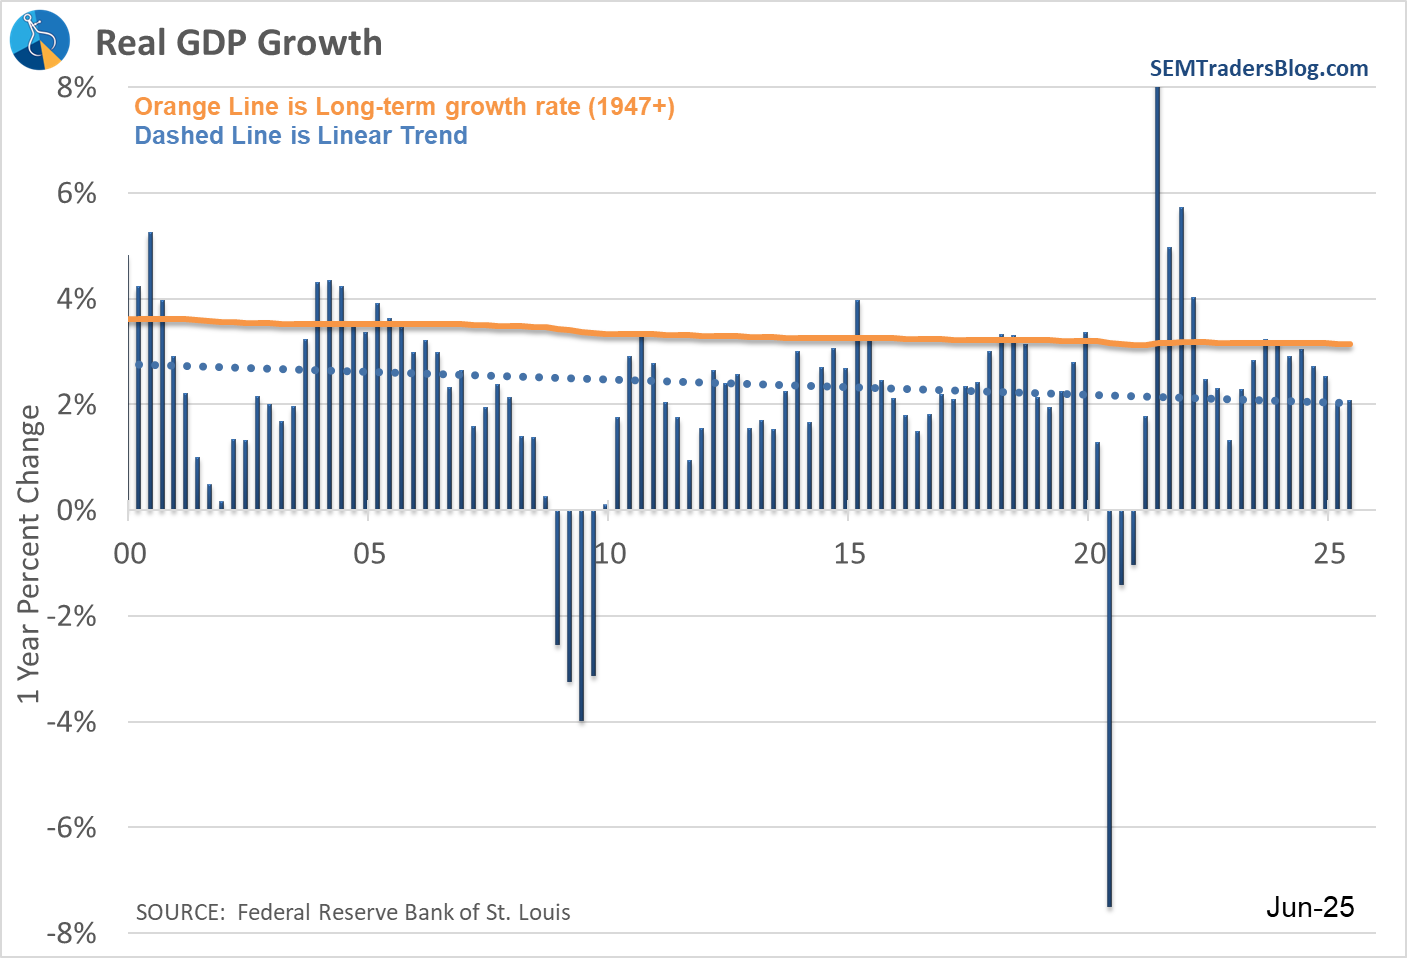
Overall economic growth is weak (around 2%)
Despite headlines of "better than expected" growth in Q2, the reality is the economy is not growing like it should given how much stimulus has been thrown at it. Worse, it is likely to slow further (based on SEM's economic model).
Toby's Take
Our intern Toby has been shadowing me and assisting with some technology projects (and our Podcast relaunch). One of his daily assignments has been to read the Wall Street Journal "10-Point" and pick an article that interests him. I asked him to write a summary paragraph each day. I thought I'd share it here to give our readers an idea of what a younger person who is new to the industry finds interesting in this non-stop news cycle.
8/25/25: Silicon Valley is launching Pro-AI PACs to help defend the growing AI industry in the Midterm elections. This is huge because despite the either intentional or unintentional, government interference with the growth of AI, companies are pushing hard to form policies that help the AI industry. With all of this we should keep a very close eye on different AI and all tech company exposure for our portfolios.
8/26/25: President Trump is trying to remove Fed Governor Lisa Cook from office because of alleged cause: “Cook sought mortgages on two properties, one in Michigan, the other in Atlanta—and described both of them as her primary residence in papers.” At the moment this isn’t really impacting us, but if positions change in the Fed, then we need to watch the market reaction.
8/27/25: Netflix and Sony released a movie at the beginning of summer that has been consistently getting 10s of millions of views every week since the release. K-pop Demon Hunters has surprisingly taken off. This is great for both Netflix and Sony stock meaning we should be watching those sectors and how it may help their prospects.
8/28/25: Although Nvidia is and has been doing very well, they showed signs of slowing down in this last quarter with sales going up 56% which is their slowest growth rate in over two years. Again, this company is still the largest tech company and is still growing rapidly. This is just something to take note of and keep our eye on if they continue to report slowed rates and how it impacts the rest of the market.
📅 U.S. Economic Events & Fed Speeches: Week of September 2–5, 2025
| Date | Time (ET) | Event / Speaker | Details / Focus |
|---|---|---|---|
| Tuesday, Sep 2 | 10:00 AM | ISM Manufacturing PMI (Aug) | Key gauge of U.S. manufacturing activity; market-sensitive |
| 2:00 PM | Fed Governor Lisa Cook (Speech) | Topic: “Labor Market Resilience and Inflation” | |
| Wednesday, Sep 3 | 8:15 AM | ADP Employment Report (Aug) | Private sector job growth; early read on labor market |
| 10:00 AM | JOLTS Job Openings (Jul) | Insight into labor demand and potential wage pressures | |
| 3:00 PM | Fed Vice Chair Philip Jefferson (Speech) | Topic: “Inflation Expectations and Policy Anchoring” | |
| Thursday, Sep 4 | 8:30 AM | Initial Jobless Claims | Weekly labor market pulse |
| 10:00 AM | ISM Services PMI (Aug) | Services sector health; closely watched by markets | |
| 1:00 PM | Fed Chair Jerome Powell (Speech) | Topic: “Policy Outlook and Economic Risks” – highly market-moving | |
| Friday, Sep 5 | 8:30 AM | Nonfarm Payrolls & Unemployment Rate (Aug) | Most important monthly labor market report |
| 10:00 AM | Fed Governor Christopher Waller (Speech) | Topic: “Monetary Policy and Financial Conditions” |
💼 U.S. Earnings Calendar: Week of September 2–5, 2025
|
Date |
Company |
Ticker |
Time |
Sector |
|
Tue, Sep 2 |
CrowdStrike |
CRWD |
After Mkt |
Cybersecurity |
|
HP Enterprise |
HPE |
After Mkt |
IT Services |
|
|
Wed, Sep 3 |
Salesforce |
CRM |
After Mkt |
Cloud Software |
|
Five Below |
FIVE |
After Mkt |
Retail |
|
|
Thu, Sep 4 |
Broadcom |
AVGO |
After Mkt |
Semiconductors |
|
Lululemon |
LULU |
After Mkt |
Apparel |
|
|
DocuSign |
DOCU |
After Mkt |
Digital Services |
|
|
Fri, Sep 5 |
Kroger |
KR |
Before Mkt |
Grocery/Retail |
Market Charts
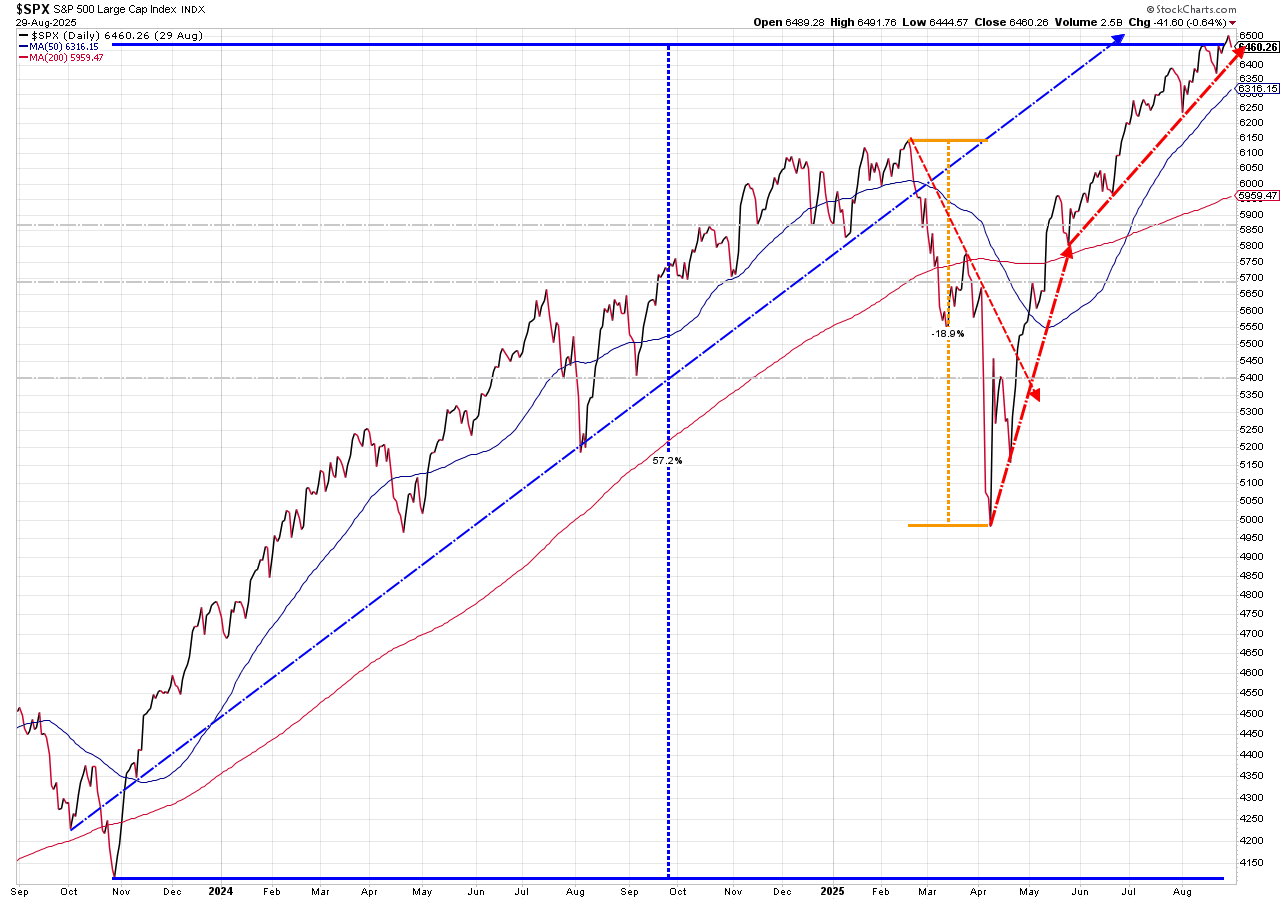
It was a strong week until Friday's sell-off.
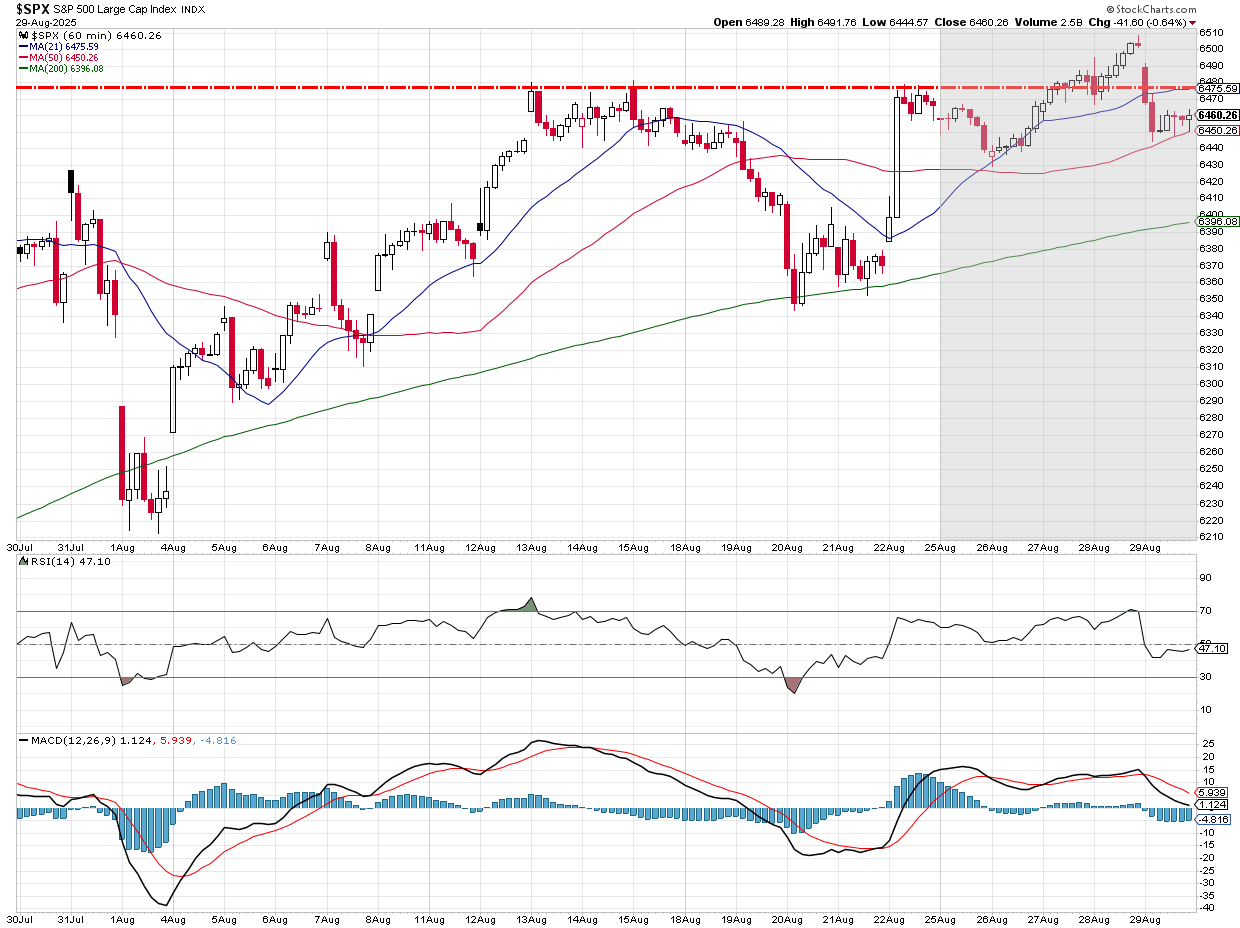
The uptrend, though is still in tact.
SEM Market Positioning
| Model Style | Current Stance | Notes |
|---|---|---|
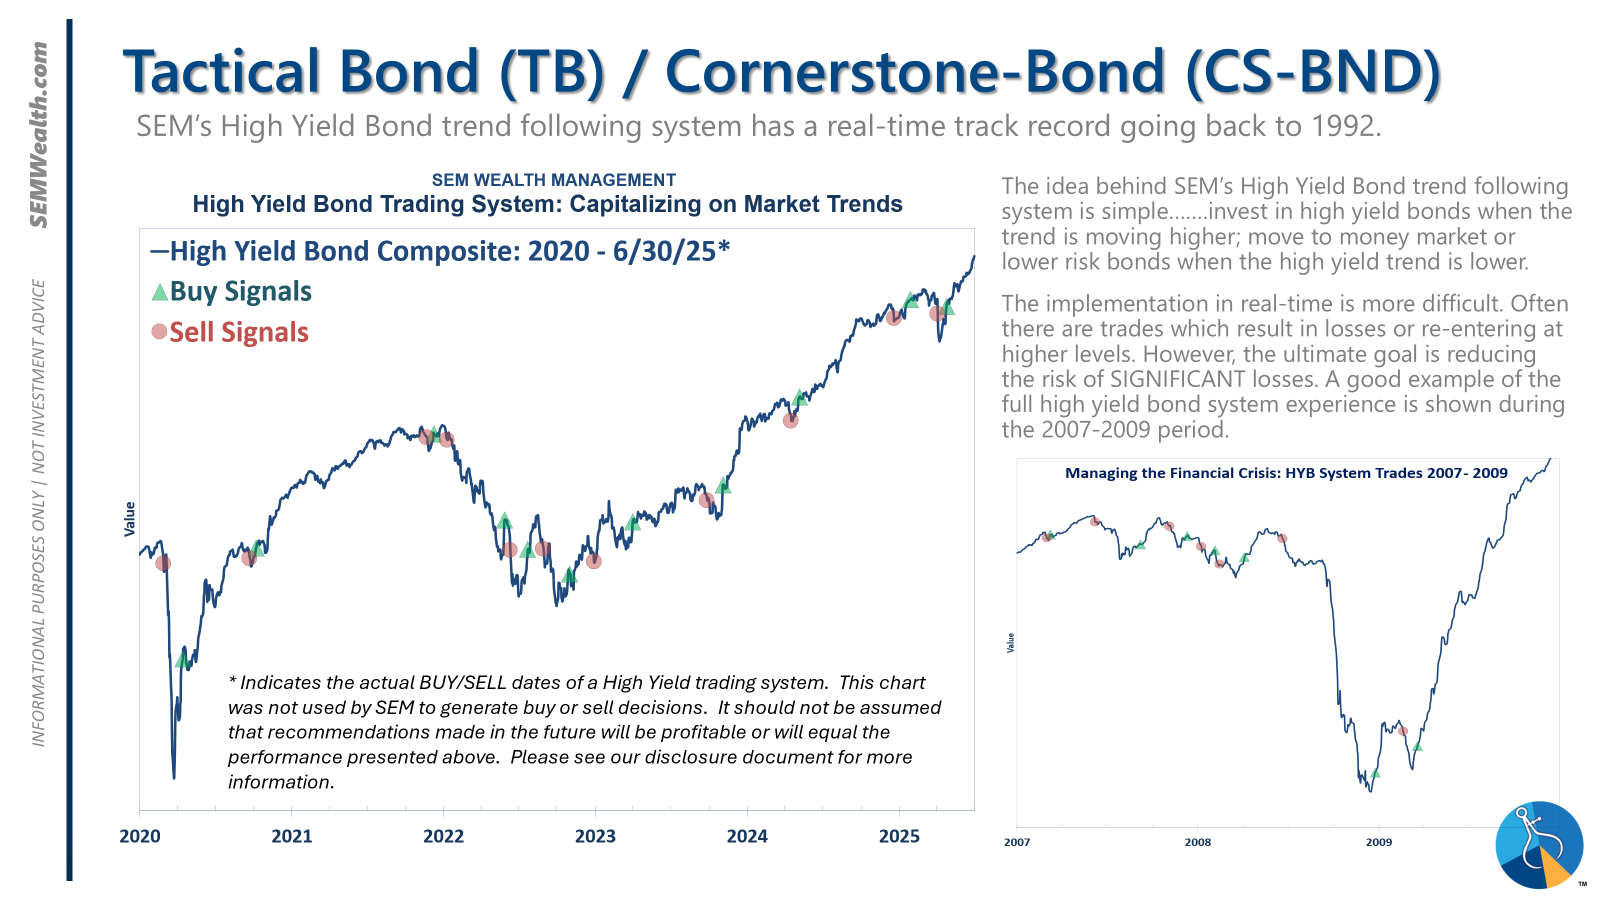
| Tactical | 100% high yield | High-yield spreads holding, but trend is slowing-watching closely |
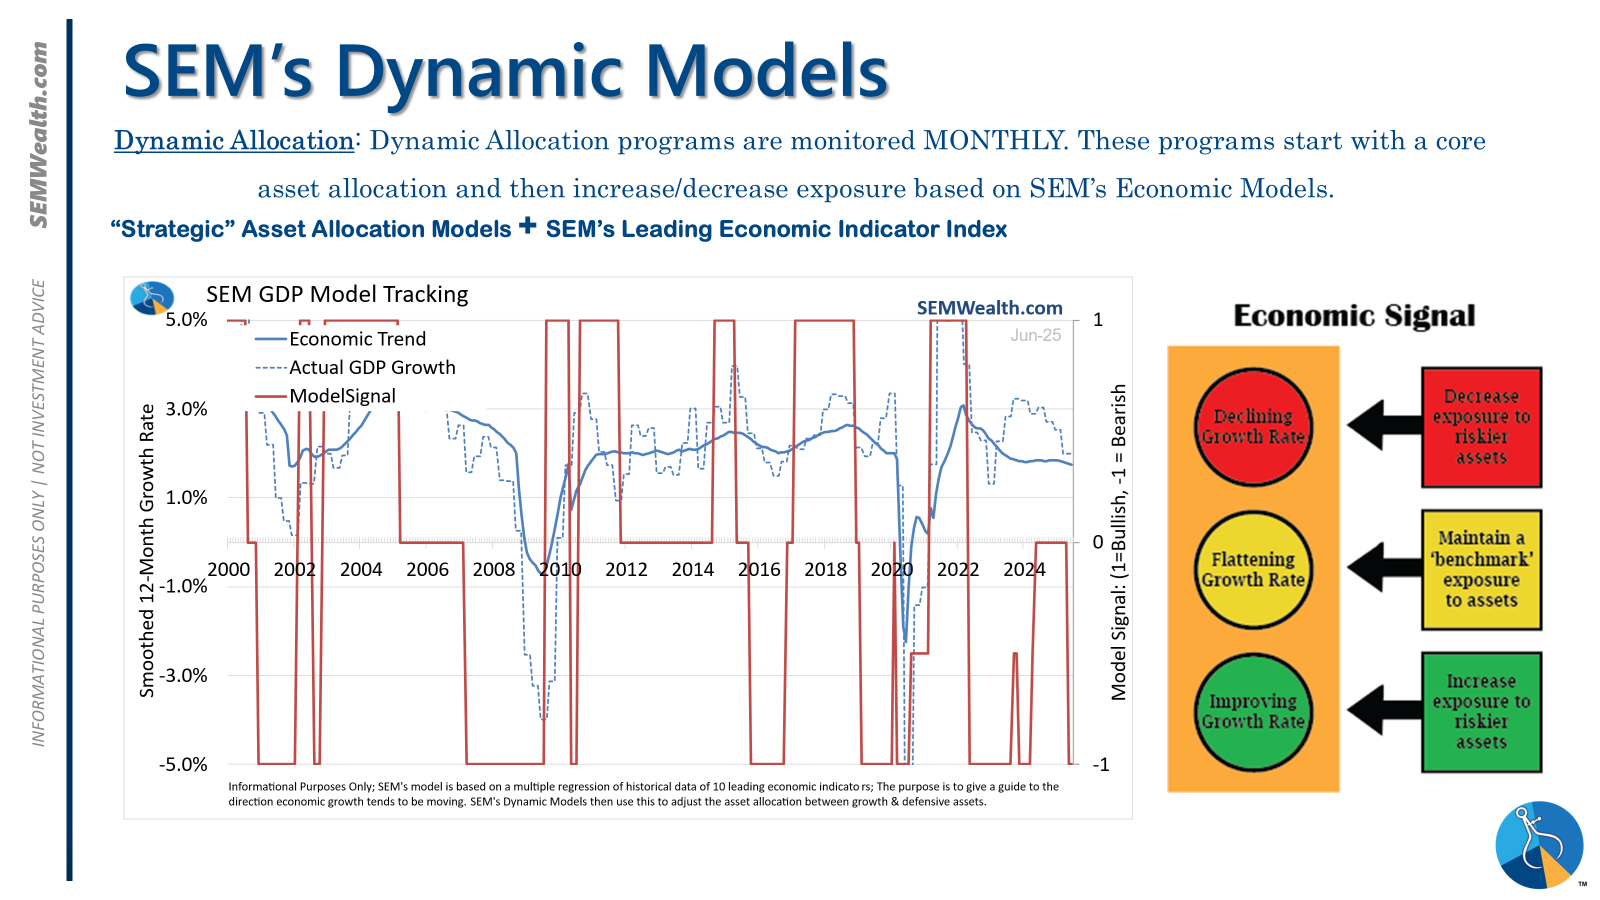
| Dynamic | Bearish | Economic model turned red – leaning defensive |
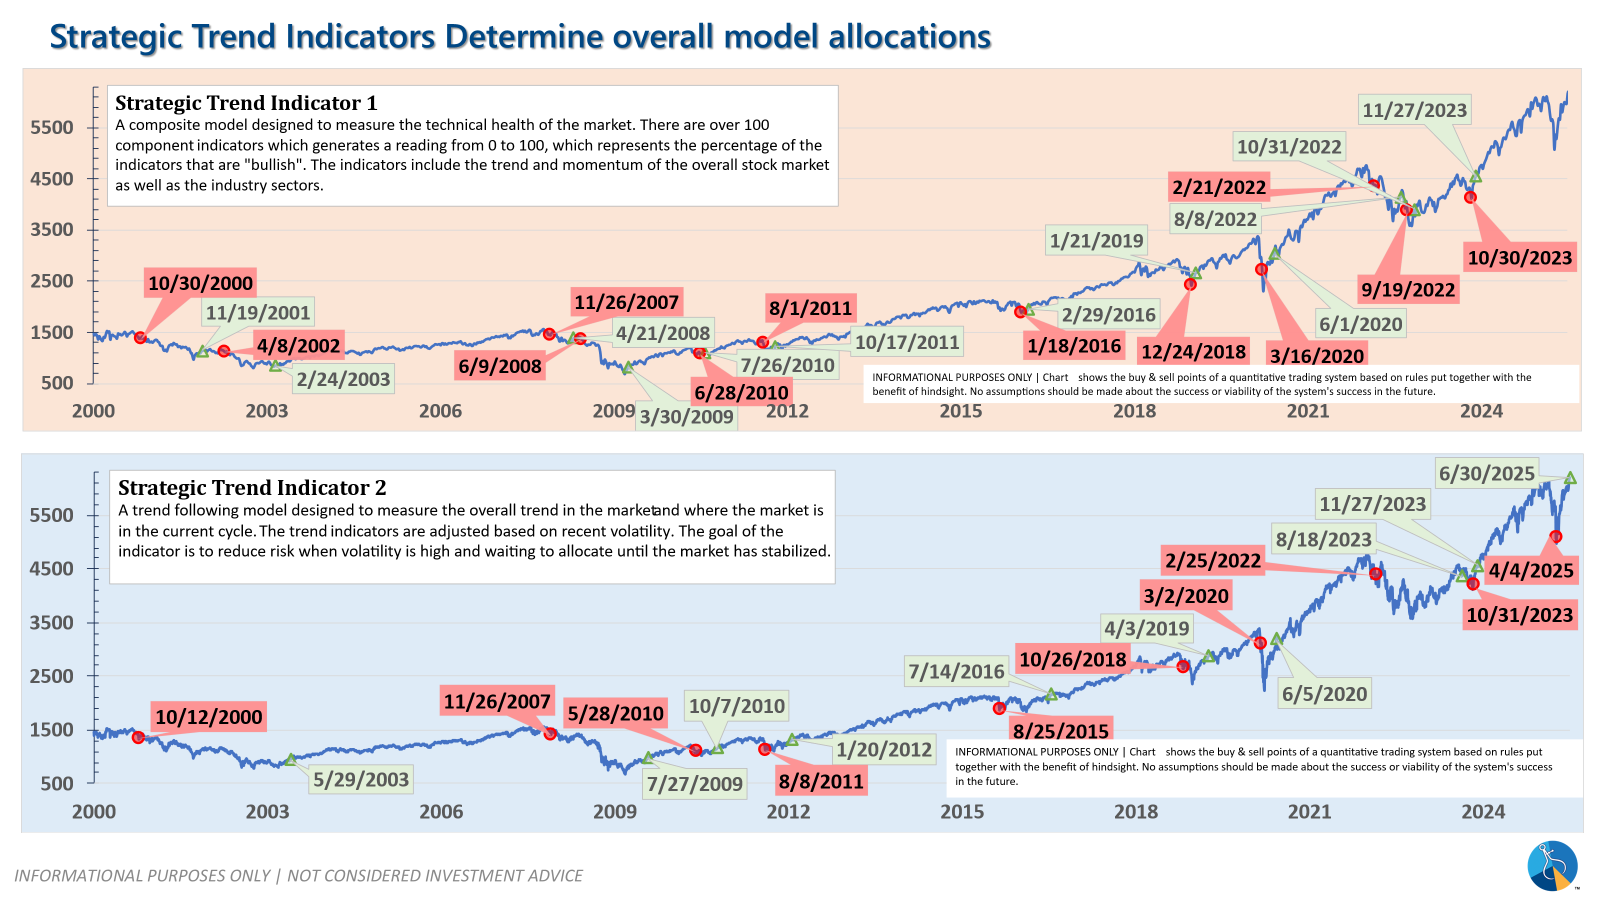
| Strategic | Slight under-weight | Trend overlay shaved 10 % equity in April -- added 5% back early July |
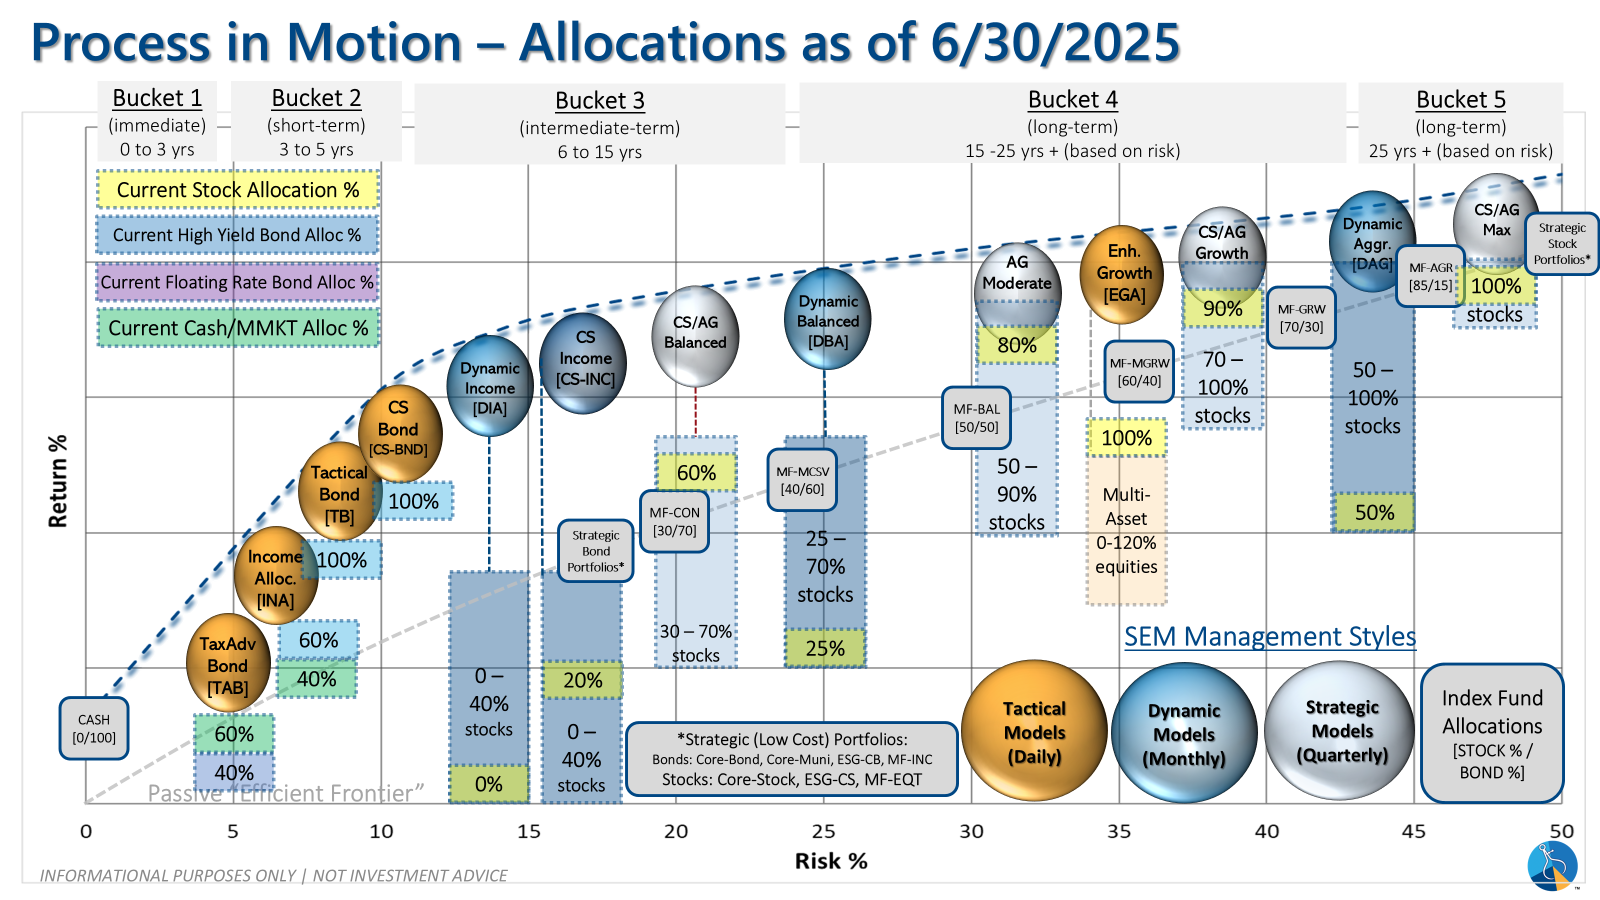
SEM deploys 3 distinct approaches – Tactical, Dynamic, and Strategic. These systems have been described as 'daily, monthly, quarterly' given how often they may make adjustments. Here is where they each stand.
Tactical (daily): The high yield system has been invested since 4/23/25 after a short time out of the market following the sell signal on 4/3/25.
Dynamic (monthly): The economic model went 'bearish' in June 2025 after being 'neutral' for 11 months. This means eliminating risky assets – sell the 20% dividend stocks in Dynamic Income and the 20% small cap stocks in Dynamic Aggressive Growth. The interest rate model is 'bullish' meaning higher duration (Treasury Bond) investments for the bulk of the bonds.
Strategic (quarterly)*: One Trend System sold on 4/4/2025; Re-entered on 6/30/2025
The core rotation is adjusted quarterly. On August 17 it rotated out of mid-cap growth and into small cap value. It also sold some large cap value to buy some large cap blend and growth. The large cap purchases were in actively managed funds with more diversification than the S&P 500 (banking on the market broadening out beyond the top 5-10 stocks.) On January 8 it rotated completely out of small cap value and mid-cap growth to purchase another broad (more diversified) large cap blend fund along with a Dividend Growth fund.
The * in quarterly is for the trend models. These models are watched daily but they trade infrequently based on readings of where each believe we are in the cycle. The trend systems can be susceptible to "whipsaws" as we saw with the recent sell and buy signals at the end of October and November. The goal of the systems is to miss major downturns in the market. Risks are high when the market has been stampeding higher as it has for most of 2023. This means sometimes selling too soon. As we saw with the recent trade, the systems can quickly reverse if they are wrong.
Overall, this is how our various models stack up based on the last allocation change:
Curious if your current investment allocation aligns with your overall objectives and risk tolerance? Take our risk questionnaire


