
The wild ride for the markets continued last week as once again the idea the US-Israel Was with Iran is thought to be near its end. Whether or not that comes to fruition is anybody's guess. More importantly, what happens with oil supply and thus energy prices is far more important than the end of the bombing. The stock market isn't focused on that (yet) and is simply relieved that the idea the US would need ground troops to reach some of the declared "goals" from the White House seems to be off the table (for now).
Last week we posted our quarterly newsletter. In case you missed it, you can check it out here:

Since it just posted and once again there is a good chunk of "Bonus Content" this week's blog will be brief. One of the things I included was a closer look at our recent adjustments in our portfolio. One of those was a sell in one of our "strategic" trend models. As humans, we are subject to "recency" bias, so it wasn't without some trepidation when we saw it appear on our screens on Monday. This was the same system which sold on the day of the exact bottom following the Liberation Week sell-0ff.
As we always do, whenever there is a "bad" trade (or an exceptionally good one) we look back at the data to see if something has shifted. In the case of last year's trade it was literally the first time (with data going back to 2000) where that system sold at the bottom. We've had 10 "bearish" signals since then – 9 of the 10 have been successful. In all other periods it helped avoid somewhat of an additional sell-off. We won't know until we get the reversing buy signal if once again this system sold at the "bottom".
Even if that is 2 consecutive "bad" trades (making it 9 for 11), it doesn't mean the system is broken. The goal of the system is to take money off the table when risks are high. It adjusts for volatility and doesn't sell until it is likely the depth of the sell-off has reached a technical level that says it is likely to accelerate.
I'm thankful for our quantitative approach. Let's say both last year following the sharp Liberation Week sell-off AND this week following what appeared to be a Gordian not-like conflict with Iran we just decided subjectively to "ride it out". What would our decision have been back in 2000-2002, or in 2007-2009, or in 2022, or even in 2011 or 2018 when the economy was teetering on recession and the market fell nearly 20% from high to low? WHEN do you sell if you don't have a system?
I've been in the markets for long enough to know it is VERY hard to subjectively get it right in the heat of the moment. The calm we have in our meetings and around our office when you have a month like March (or worse) is something that is underappreciated and is the key to us being around since 1992.
More importantly, the sell signal was for only a portion of our longer-term AmeriGuard and Cornerstone models. However, even by having a bit of money off the table for the "recovery" last week, our models still have a significant edge on the S&P 500 this year. This is due to the fact we are positioned for a "broadening" market and are overweight small caps and underweight large caps.
We will get back in when the data says the market has "normalized". As noted in our newsletter, there are more headwinds than just the War with Iran, including what happens with oil prices after the war is "officially" over.
Economic Update
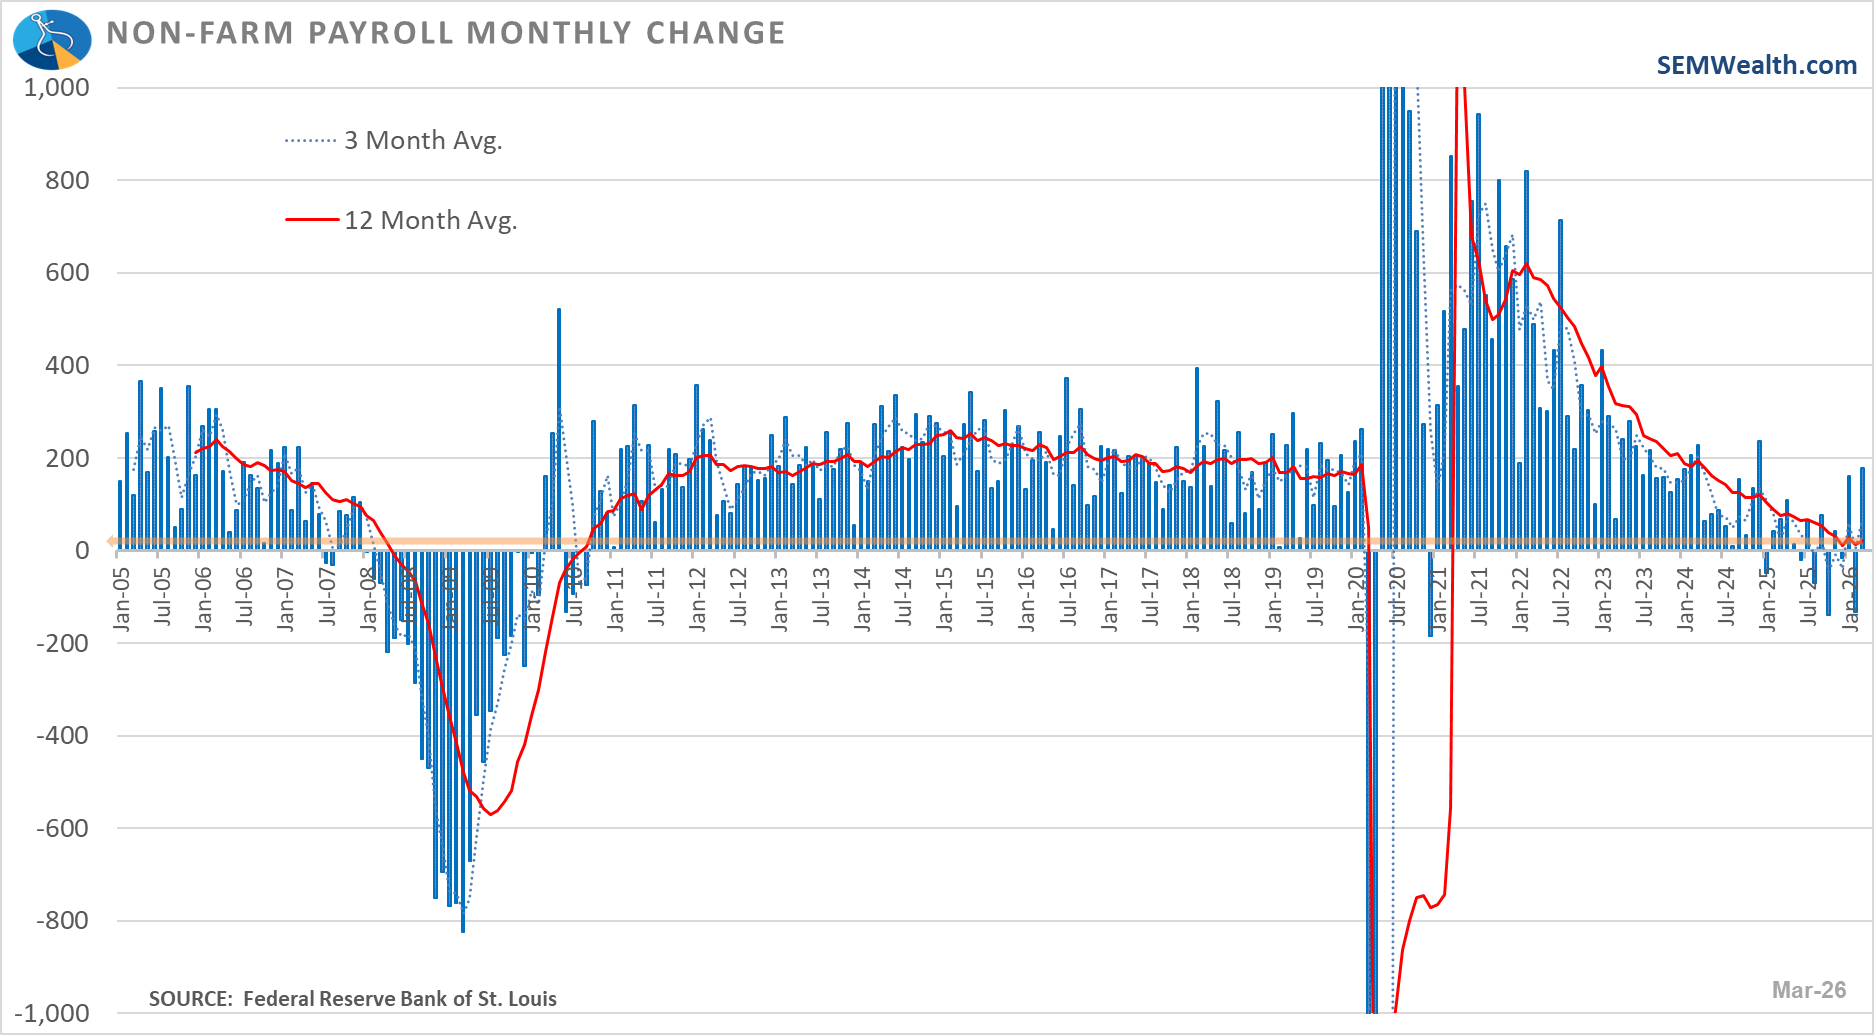
Friday's Jobs report showed a surprising increase of 178,000 jobs. There was some noise from prior month revisions and statistical adjustments in the estimates, so once again it's better to look at averages and longer-term trends.
3 Month Average: +68,000 jobs
12 Month Average: +22,000 jobs
36 Month Average: +97,000 jobs
Just looking at these stats, you could say, the labor market is better than it was last year, but still worse than it was for the prior 3 years. The 12 month average is still running close to 0.
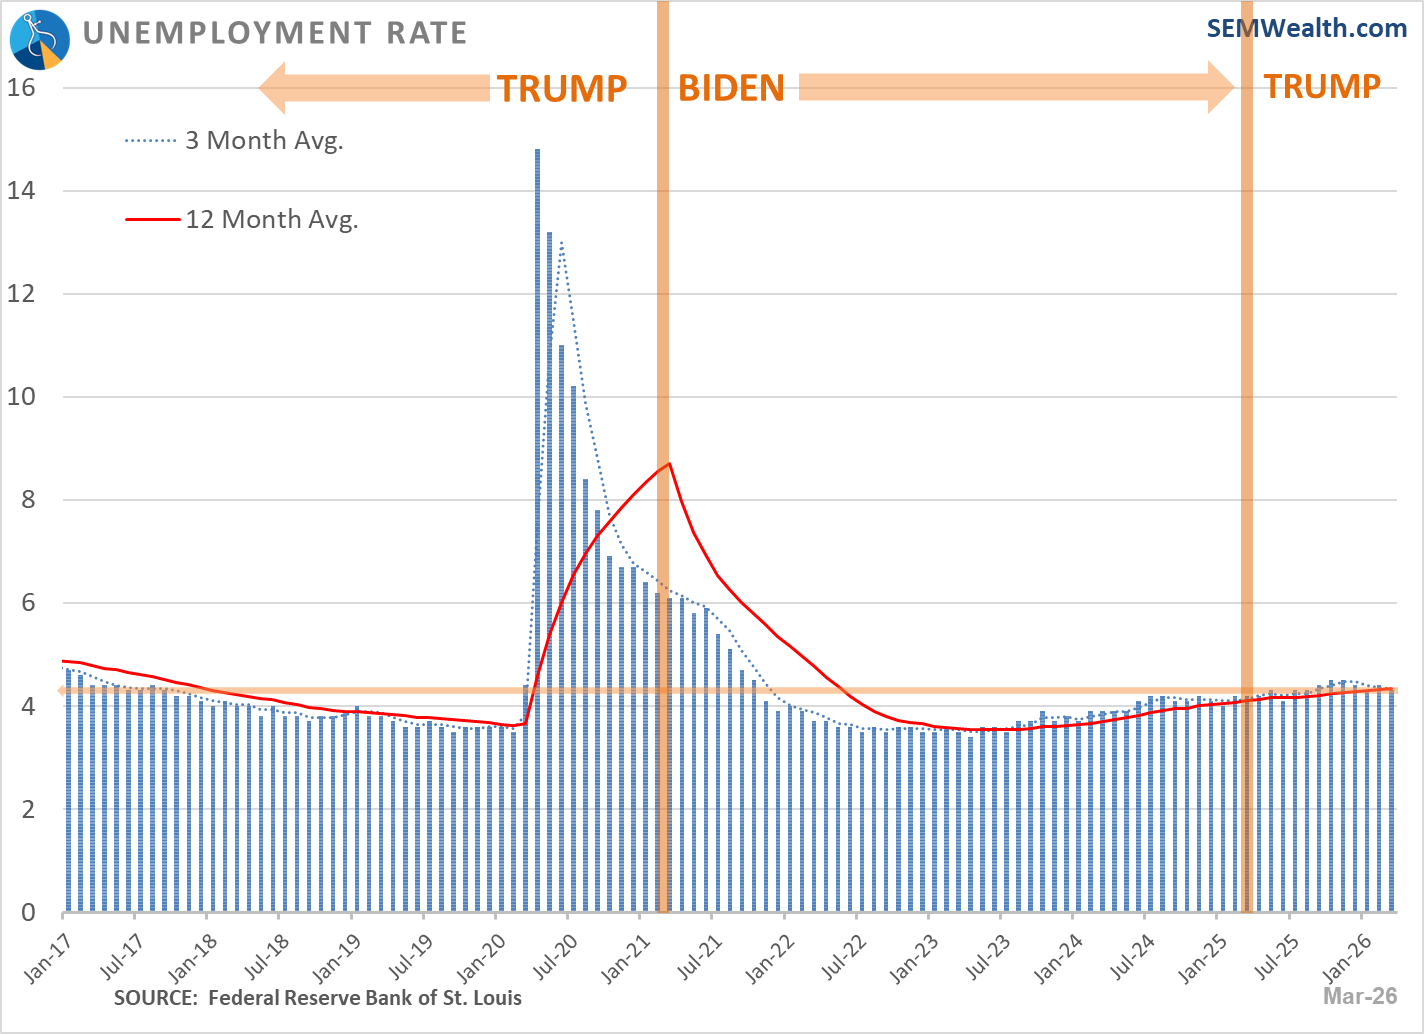
Adding in the unemployment rate the "no hire, no fire" nickname certainly still fits. Again, the slight downward revision was more due to statistical adjustments versus meaningful improvement (reduction in labor force participation amounted to the decline.)
Current Unemployment Rate: 4.3%
Rate 3 Months Ago: 4.4%
Rate 12 Months Ago: 4.2%
Rate 36 Months Ago: 3.5%
Again, our conclusion – the labor market is better than it was last year, but still worse than it was for the prior 3 years.
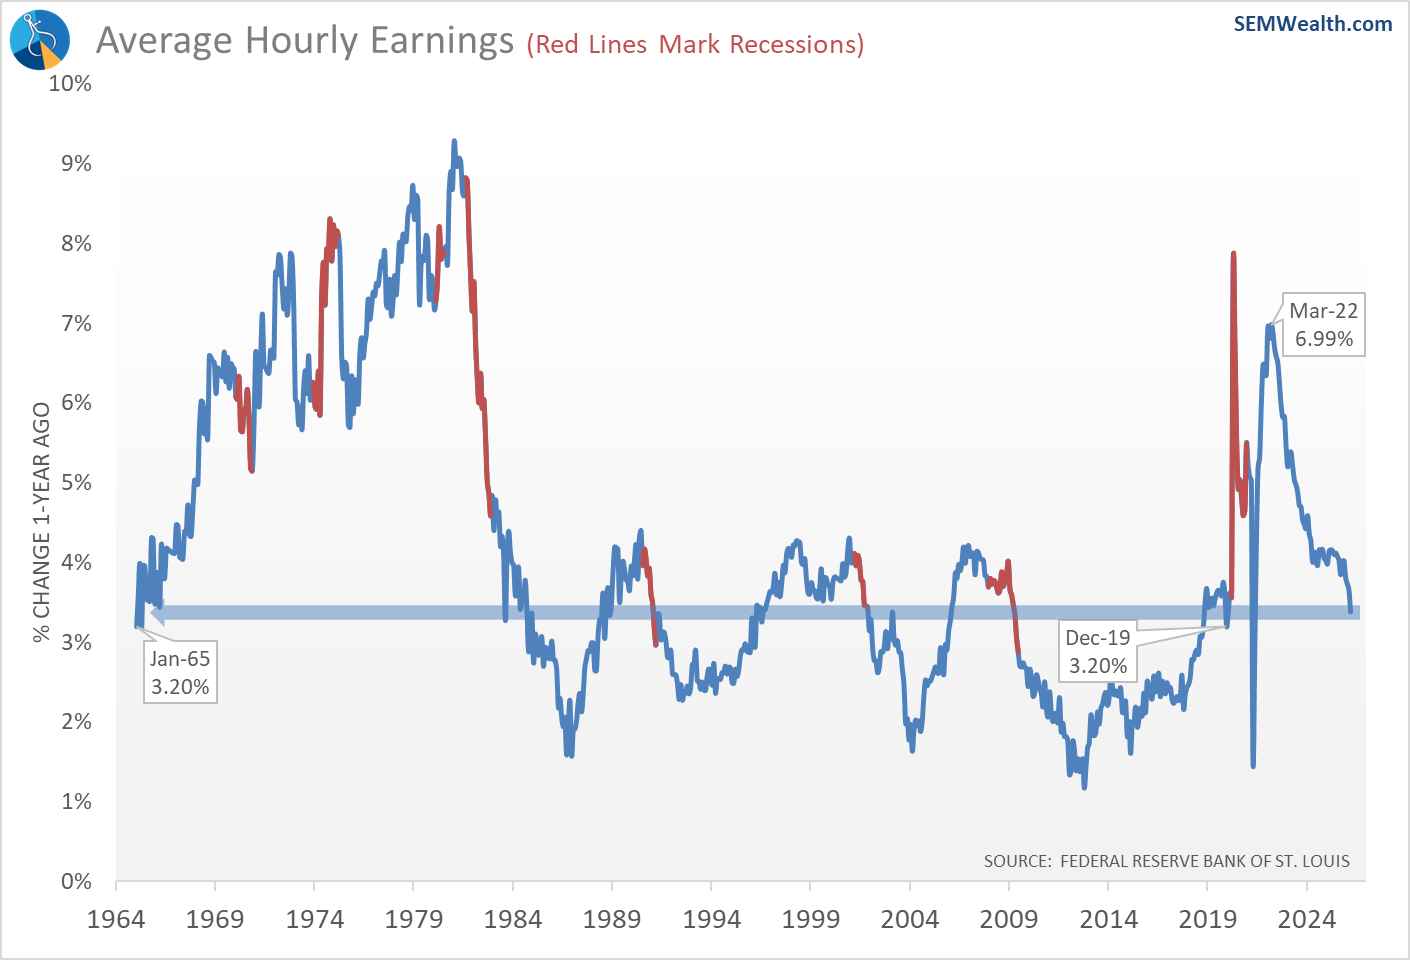
This tight labor market is not leading to any sort of wage pressure, with the growth in wages down to the same level we saw just before the COVID spike.
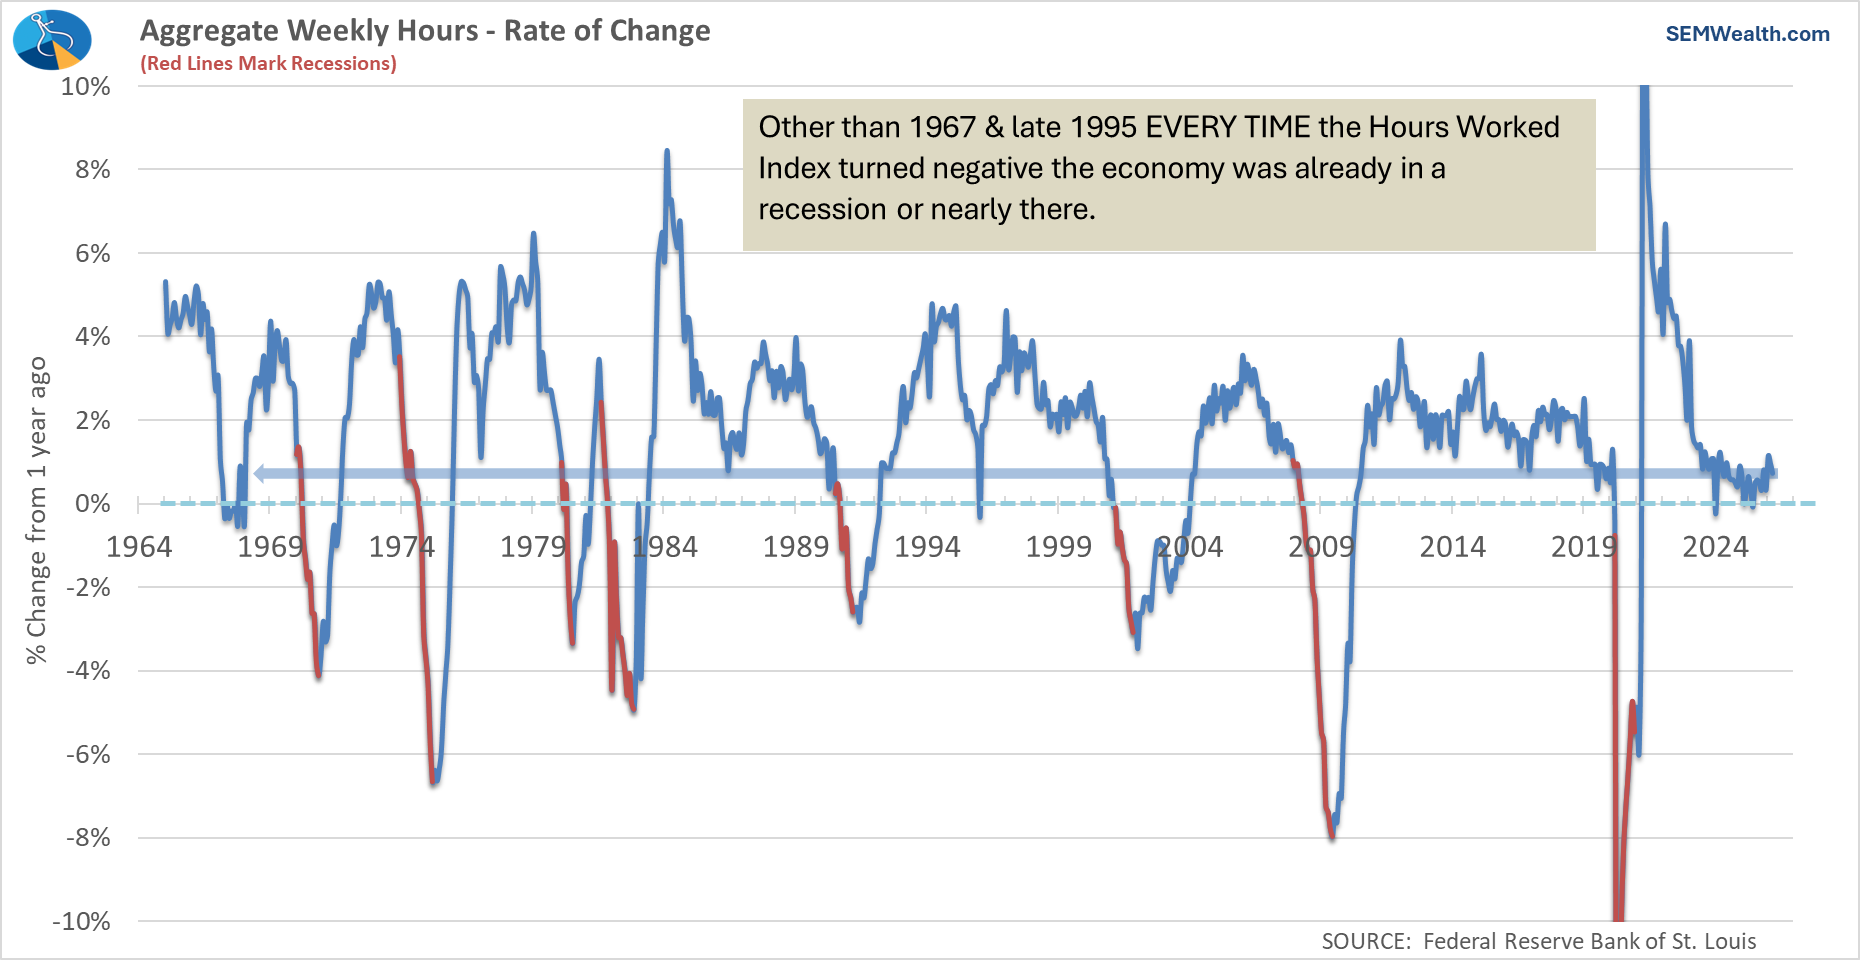
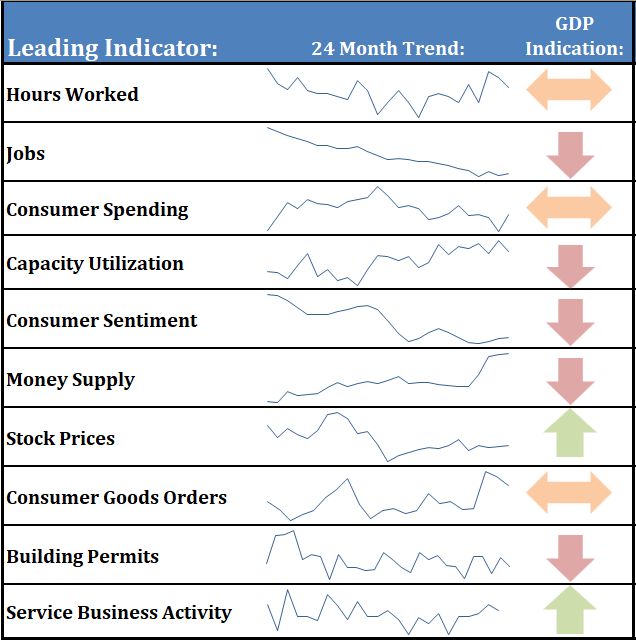
The more important indicator, Hours Worked slipped a bit, showing there isn't going to likely be an expansion of the 178,000 estimate jobs created in March. Normally this indicator is increasing ahead of any sustainable increase in new jobs.
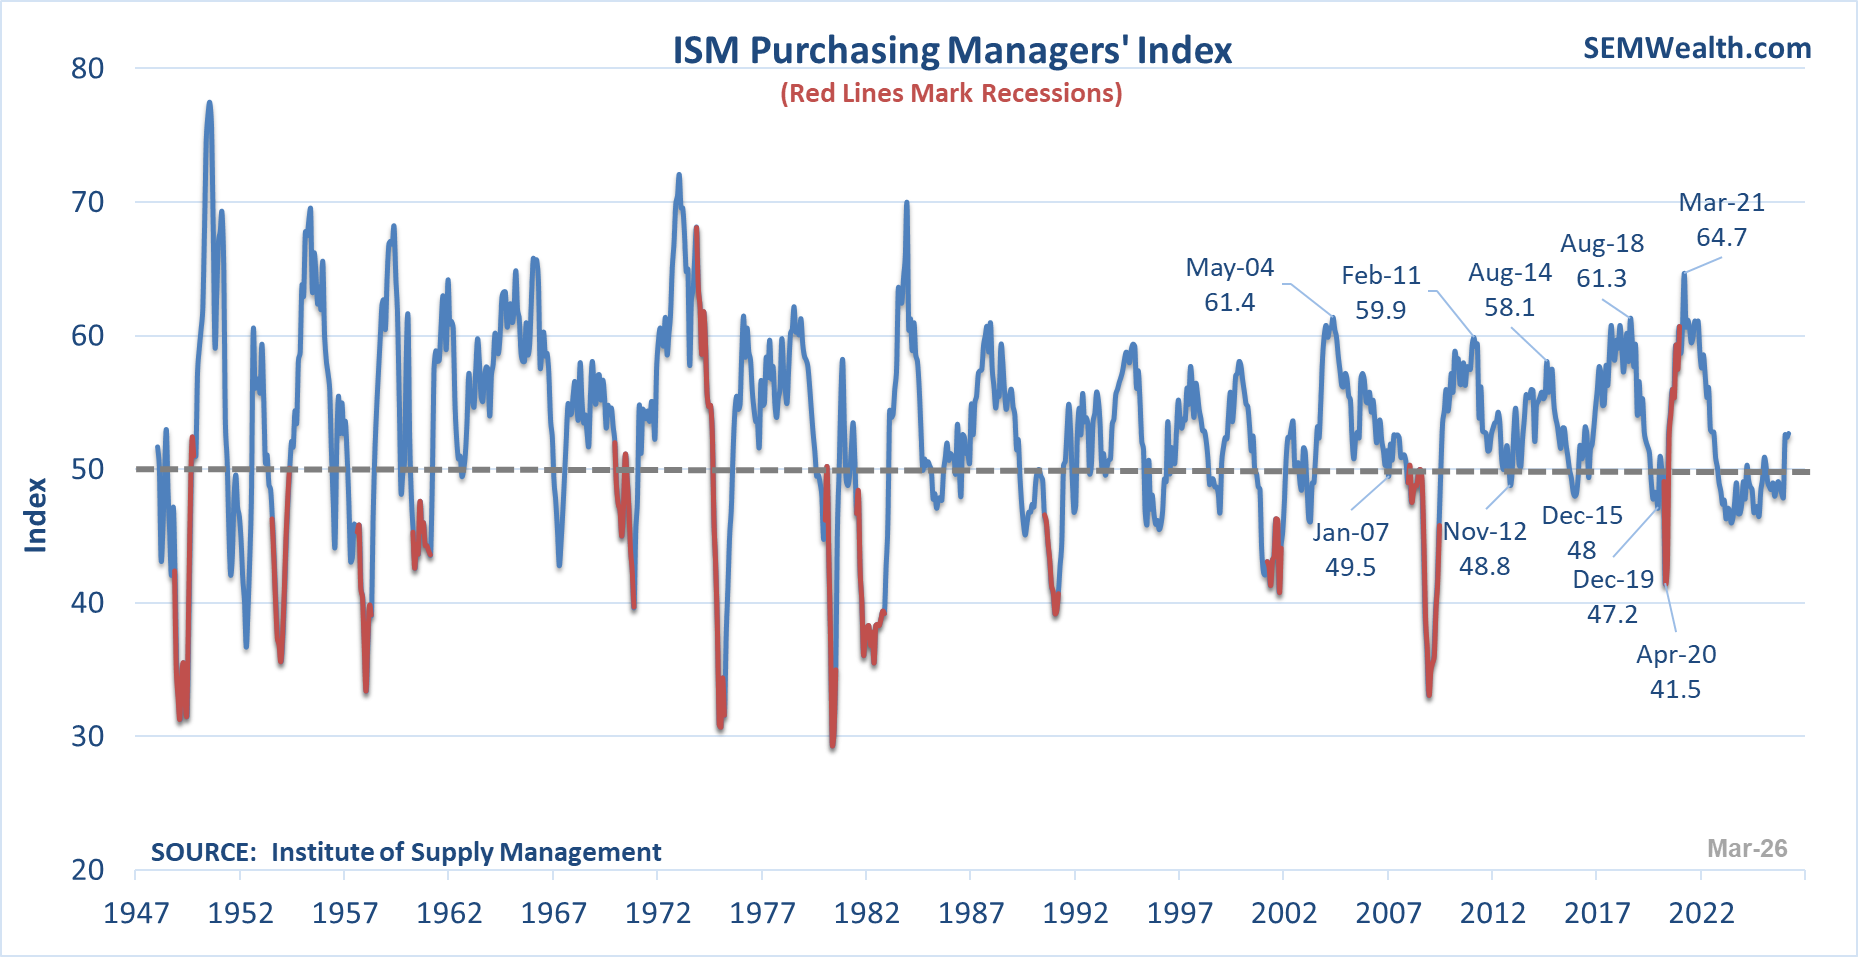
On the more positive front, the Manufacturing sector appears to be showing signs of expansion after spending the bulk of the last year in contractionary territory. The ISM Manufacturing Index moved solidly above 50 in March.
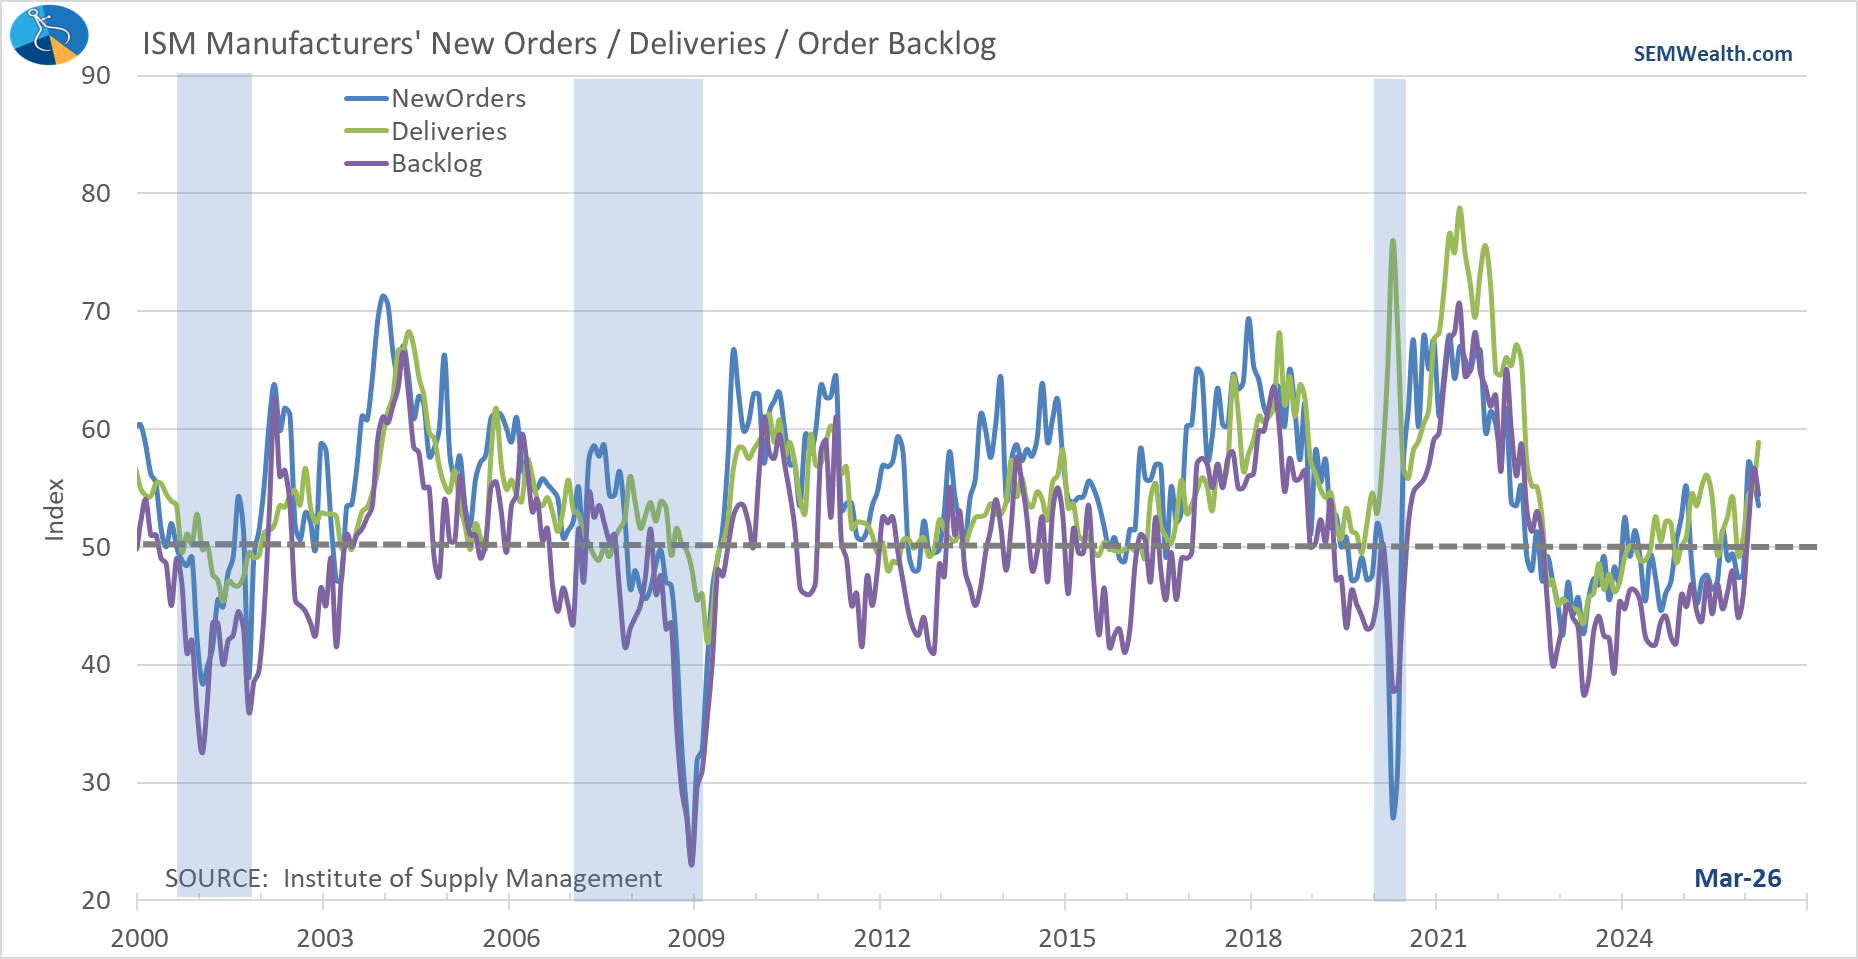
The leading indicators inside the index all remain above 50, although the Backlog and New Orders did slip a bit.
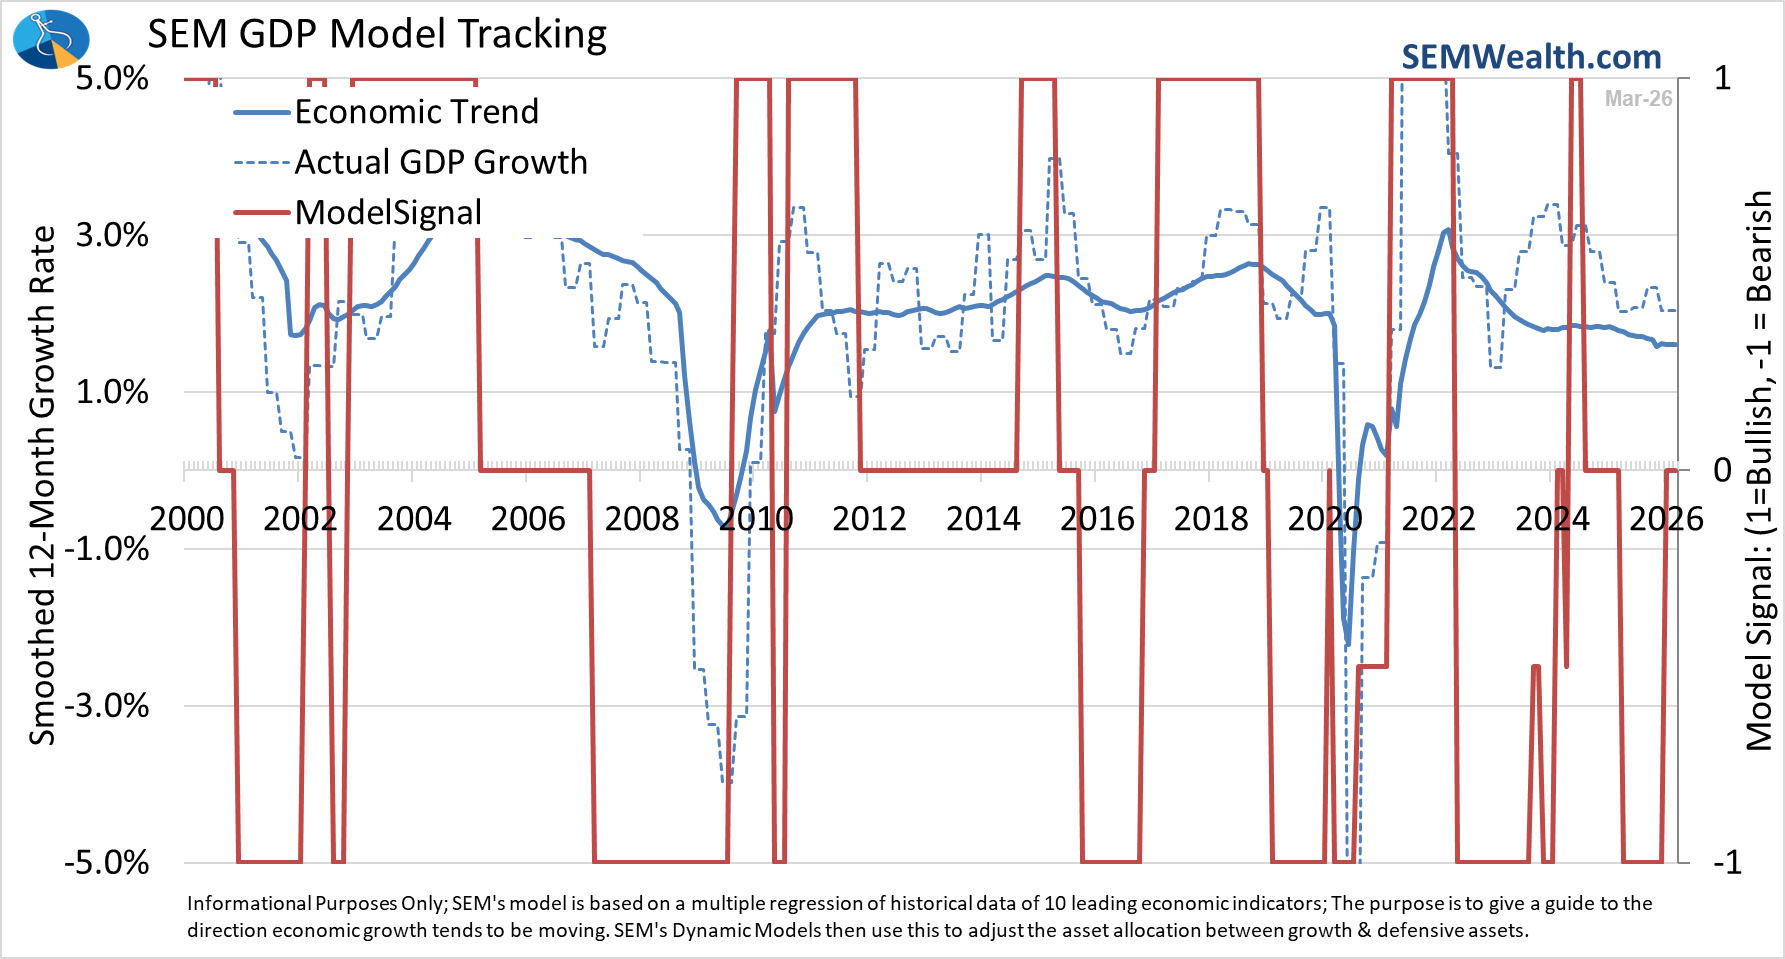
Normally the Payroll Report would "close the book" on our economic model, but since the government shutdown and the reshuffling of leadership at the BLS, the normal cadence of economic reports has been delayed, leaving key indicators out of our models. For instance, we are still missing JANUARY data on Building Permits and Consumer Spending. Those have been adjusted back post-shutdown to be 6-7 weeks after the end of the month. This means our model now closes in the middle of the month, once we get the Building Permit numbers.
For now, the model remains "neutral". It would take some strong Permit and Spending numbers to push us to bullish and another month or two of weak Payroll data to turn the model back to bearish.
This week is a busy week with the ISM Service Business Activity coming out Monday morning. We finally get the January Consumer Spending (and more important PCE Price Index – the Fed's Preferred Inflation metric.) On Friday the February Consumer Price Index will be released.
Toby's Take
A look at our intern's top WSJ stories from the past week
3/30/2026 - Exclusive | Trump Weighs Military Operation to Extract Iran’s Uranium - WSJ
The United States made clear that one of their conditions for the peace deal would be the surrender of their Uranium to ensure that they cannot build any nuclear weapons. Obviously Iran won't want to do that so now President Trump is considering sending in troops on the ground to seize the Uranium. This would be escalating the gravity of the war by risking troops in. We will continue to watch how this will grow and effect the market.
3/31/2026 - Trump Tells Aides He's Willing to End War Without Hormuz
President Trump said that he is willing to end the war without reopening the Strait of Hormuz. The strait being controlled and blocked by Iran has been the biggest issue with the war driving up prices. Trump said that if they were to execute a mission to pry open the strait it would push the length of the conflict by four to six weeks. He decided that the United States main focus needs to be weakening Iran's navy and missile stocks. Hopefully centering our focus on the attack will bring President Trump to end the conflict soon allowing the U.S. and Iran to work out the Strait of Hormuz diplomatically.
4/1/2026 - Exclusive | U.A.E. Wants to Force Hormuz Open and Is Willing to Join the Fight - WSJ
The United States has been in this fight against Iran alone despite our vast amount of allies. Most other countries disagree with the choice to attack them, however no matter the political view, Iran is holding the Strait of Hormuz using it as a hostage heavily effecting world economies. Now, the United Arab Emirates is preparing to join the fight against Iran in order to force the strait open.
4/2/2026 - The Investors Moving Early Into Venezuela Are Bullish and Ready for Risk - WSJ
After the United States extracted the dictator from Venezuela the opportunity for U.S. oil producers to grow much larger was finally open. Now both Colombian and American investors are moving in to execute on this opportunity. This could be a good way for America to become more self-reliant and not be hit so hard when things like the conflict in Iran happen. We could see a lot of growth in this sector.
Market Charts
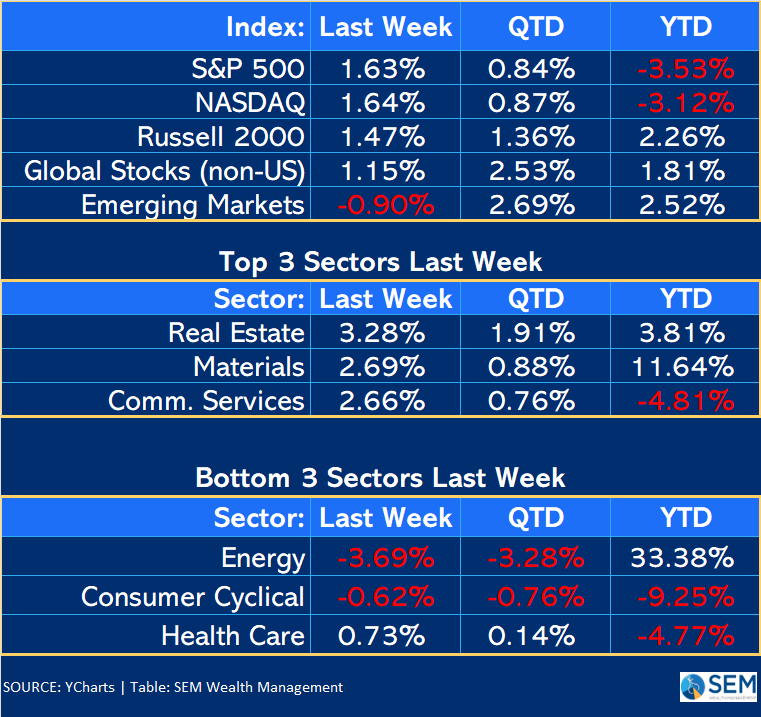
*Note: The "Last Week" column is actually for the last 5 trading days (Friday, March 27 - Thursday, April 2). Y-Charts does not have "weekly" performance numbers.
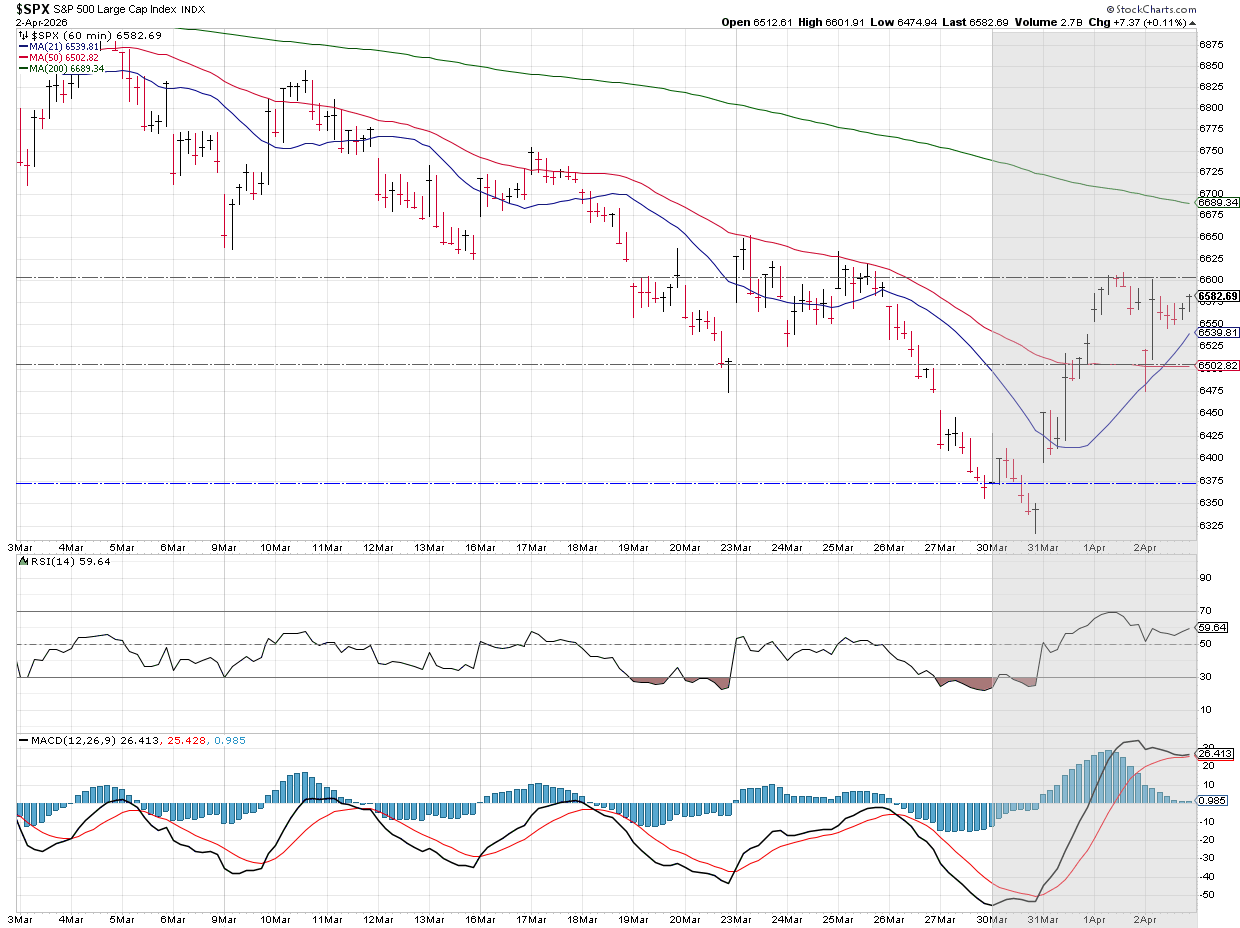
The market action was the opposite of the pattern we saw throughout March where the week would start with optimism over a short war with Iran and ended with fear of it going on longer than everyone anticipated. Last week, as reported in "Toby's Take" the week started on a negative note until reports started circulating that the President was willing to end the war without control of the Straight of Hormuz. It was off to the races and even a sell-off to start Thursday after the President's televised address Wednesday night indicating at least 2-3 more weeks of fierce bombing was reversed by the end of the week.
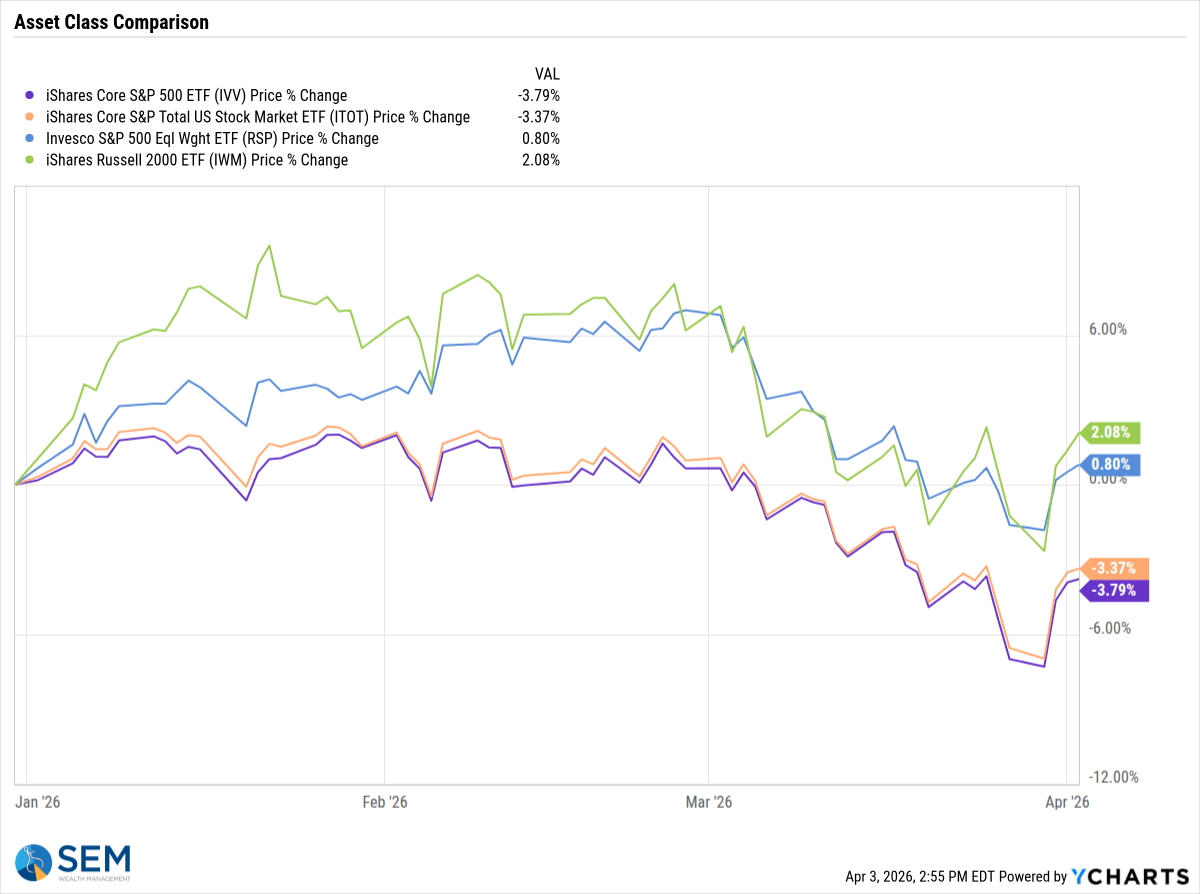
Zooming out a bit the technical picture did improve, but the S&P still remains below the key 200 day moving average (an often used measure of the longer-term "trend" in the market.) The S&P is still off 6% from the late January highs.
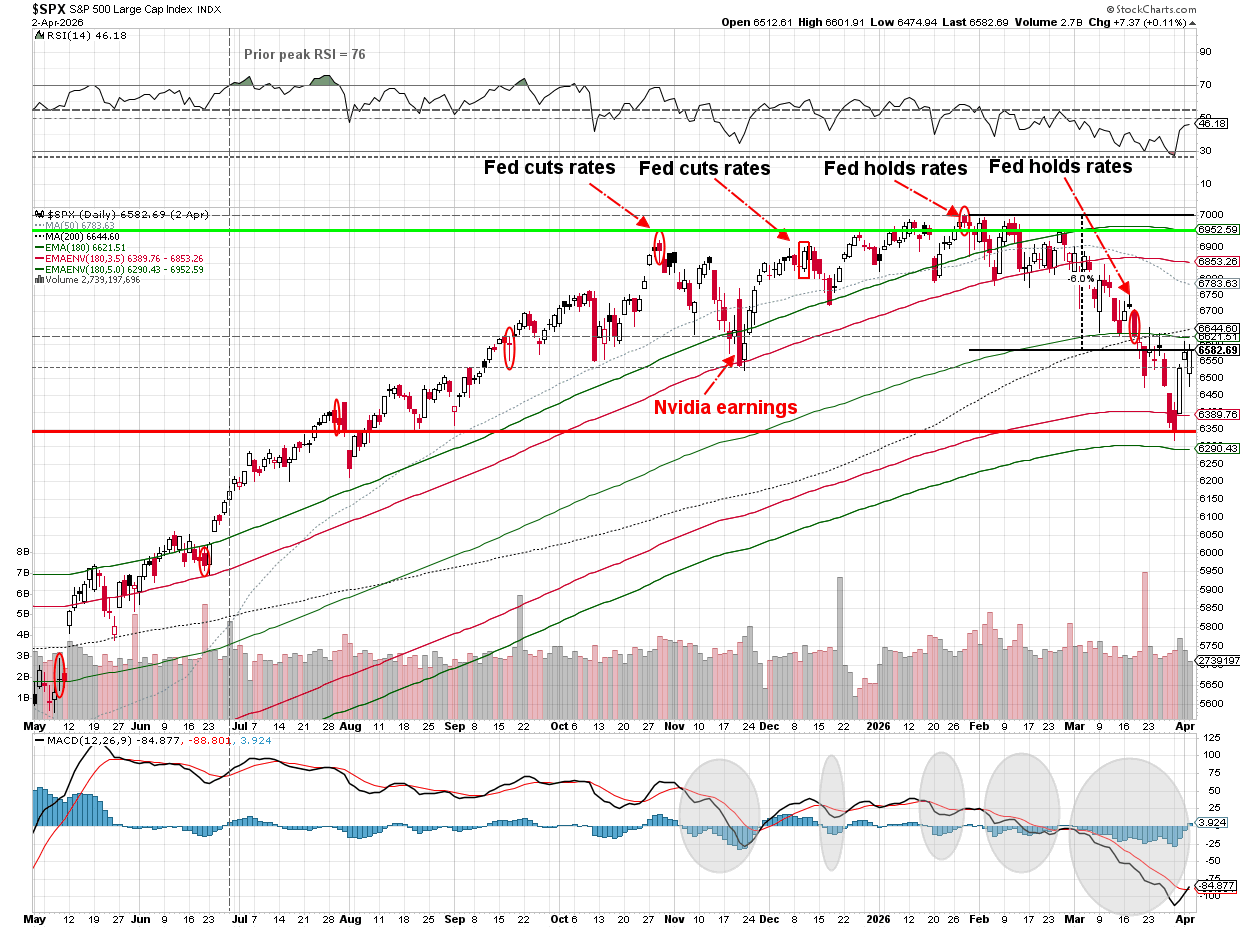
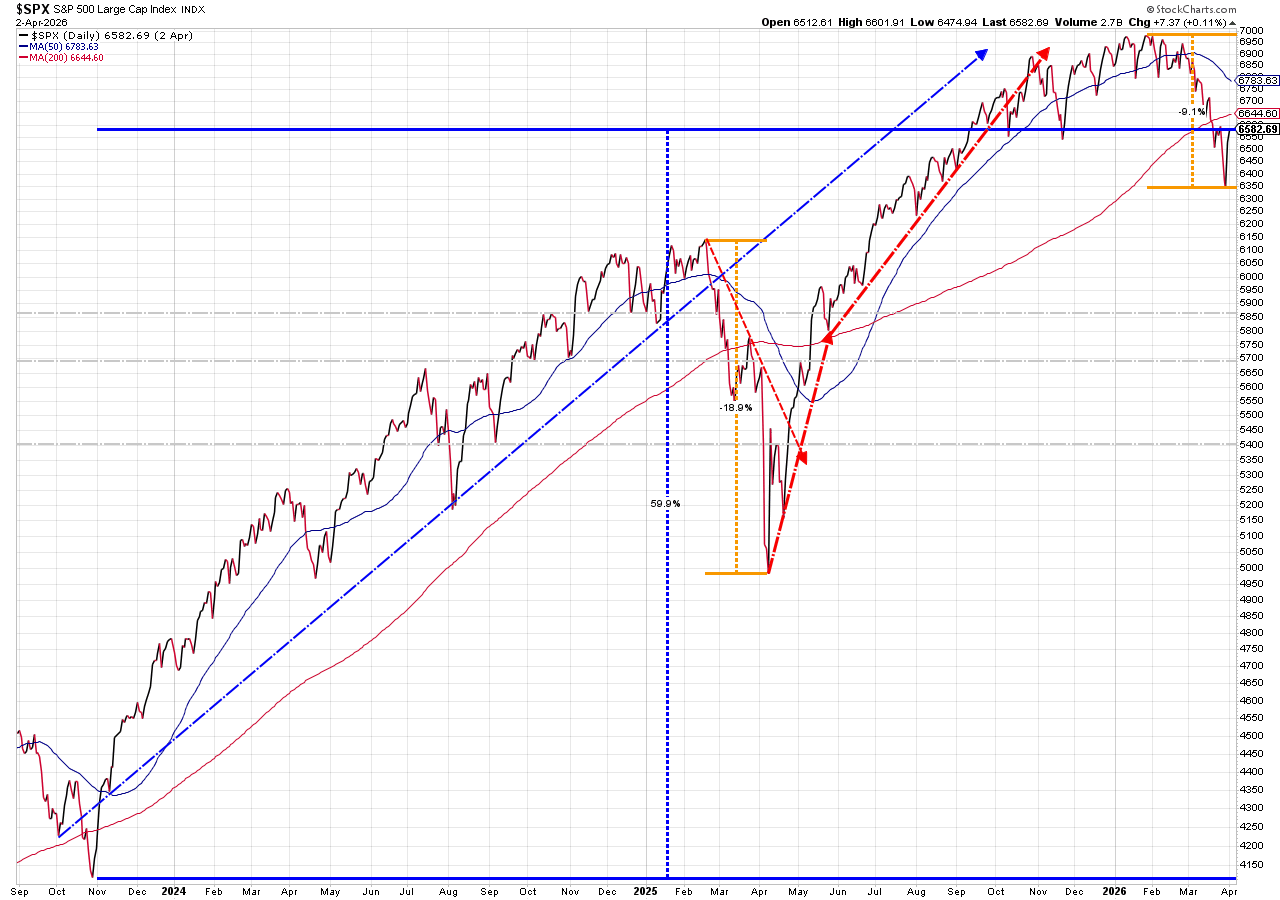
Going even further out to when the Fed announced the end of their rate tightening cycle shows the market back to last October's level. Bulls would argue this is a healthy sell-off and it's time to get back to the uptrend. Bears would argue stocks still remain overvalued. That's not our call.
The rally last week pulled small cap stocks back into positive territory for the year (which also boosted SEM's models given our overweight position in small caps.)
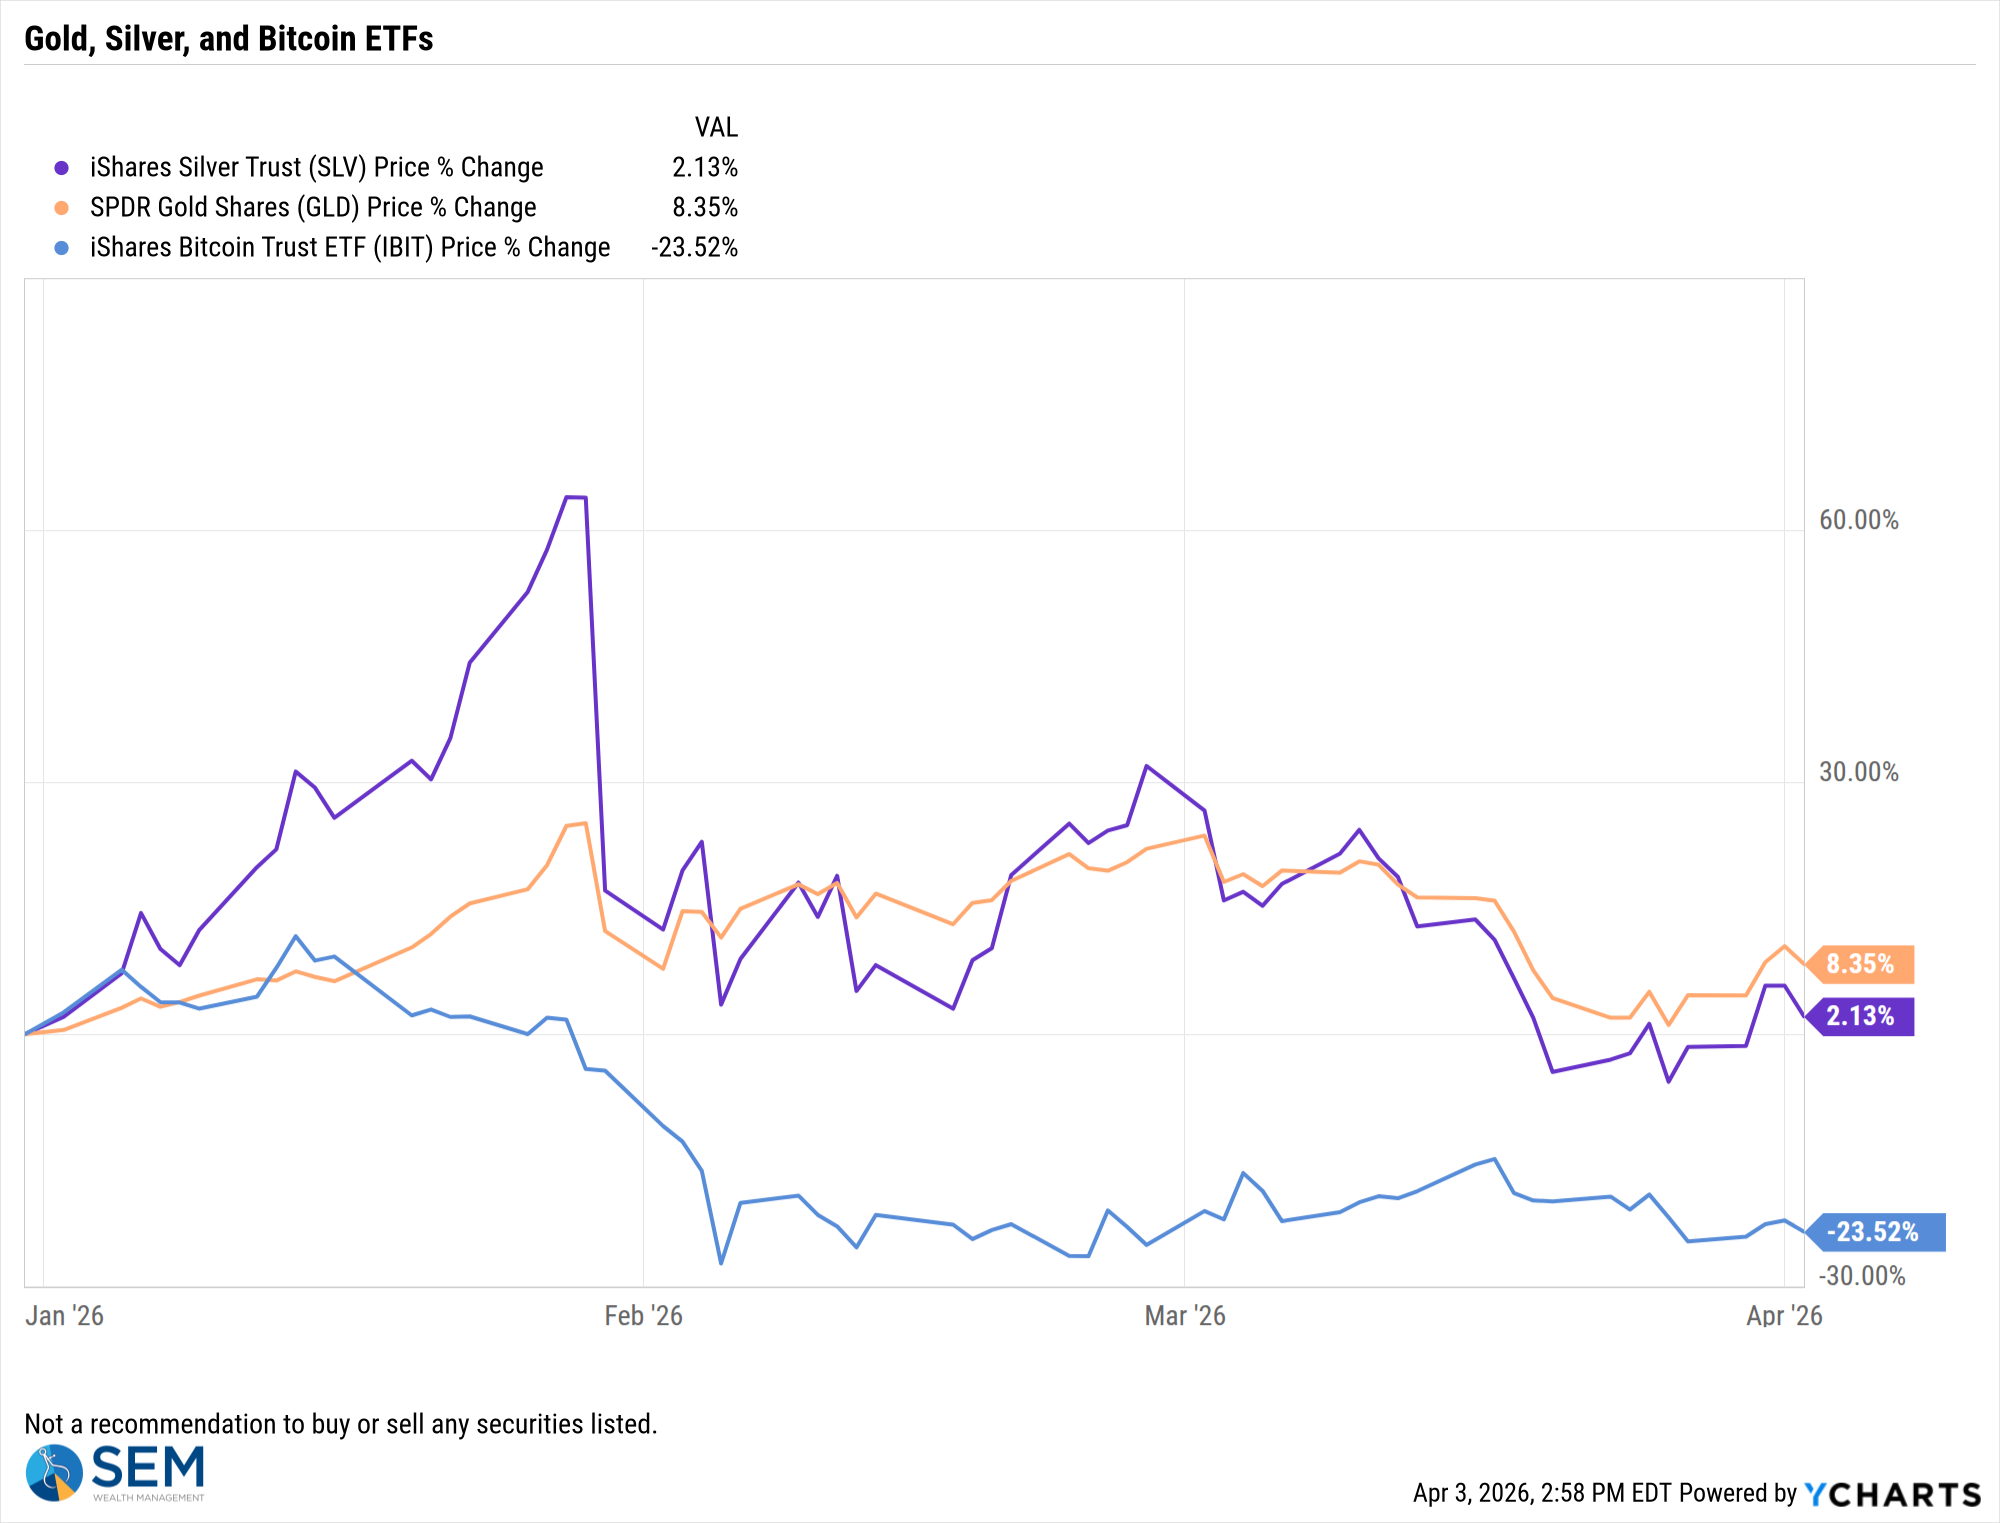
The baffling part of the sell-off in March was the beating gold took. If you'd told me at any point in my life that the US and Israel were going to be at war with Iran I would say, "buy gold, oil, and Treasury Bonds." Only oil (and energy stocks) rallied in March. Everything else went down along with the rest of the market. They pulled back into positive territory after a big rally last week. Bitcoin sold off once again and continues its difficult year.
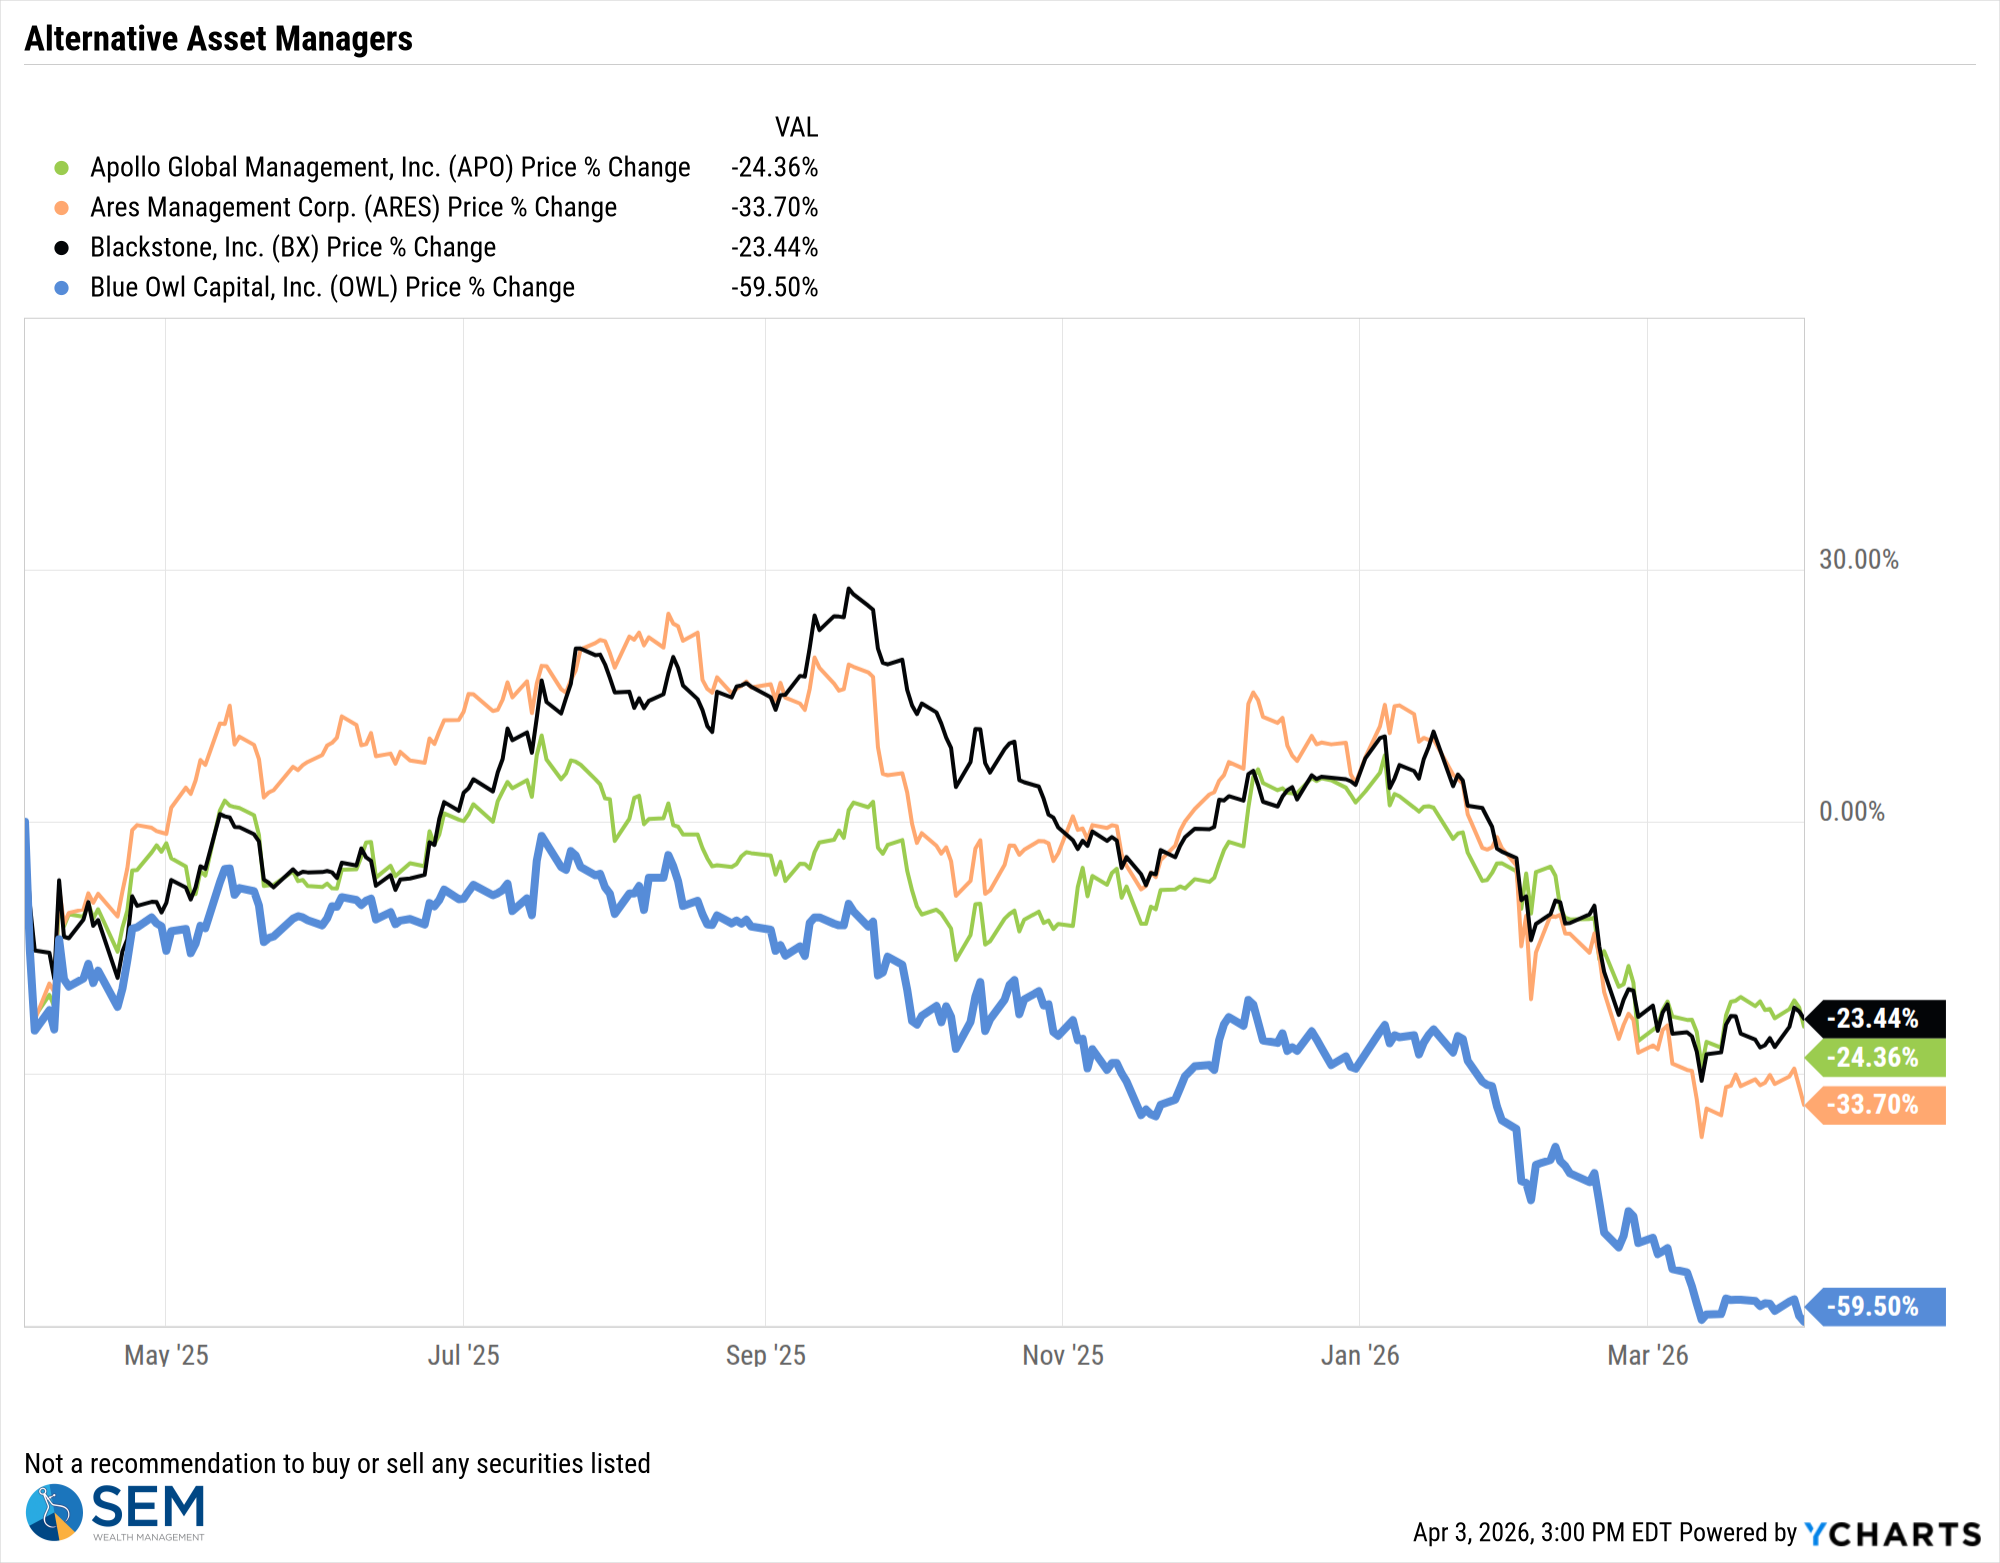
Turning to the issue I was most focused on prior to the war in Iran, Private Credit, it was another difficult week for the companies running those funds as more funds restricted withdrawals as redemption requests continue to pile in.
This hasn't hit high yield bonds too much, which is good news. It also hasn't been the reason interest rates shot higher last month. With the prospects of the Iran War deescalating, the yield curve shifted down last week. It is still higher than it was for most of the last 12 months, but it was a nice change given the big sell off in bonds during March.
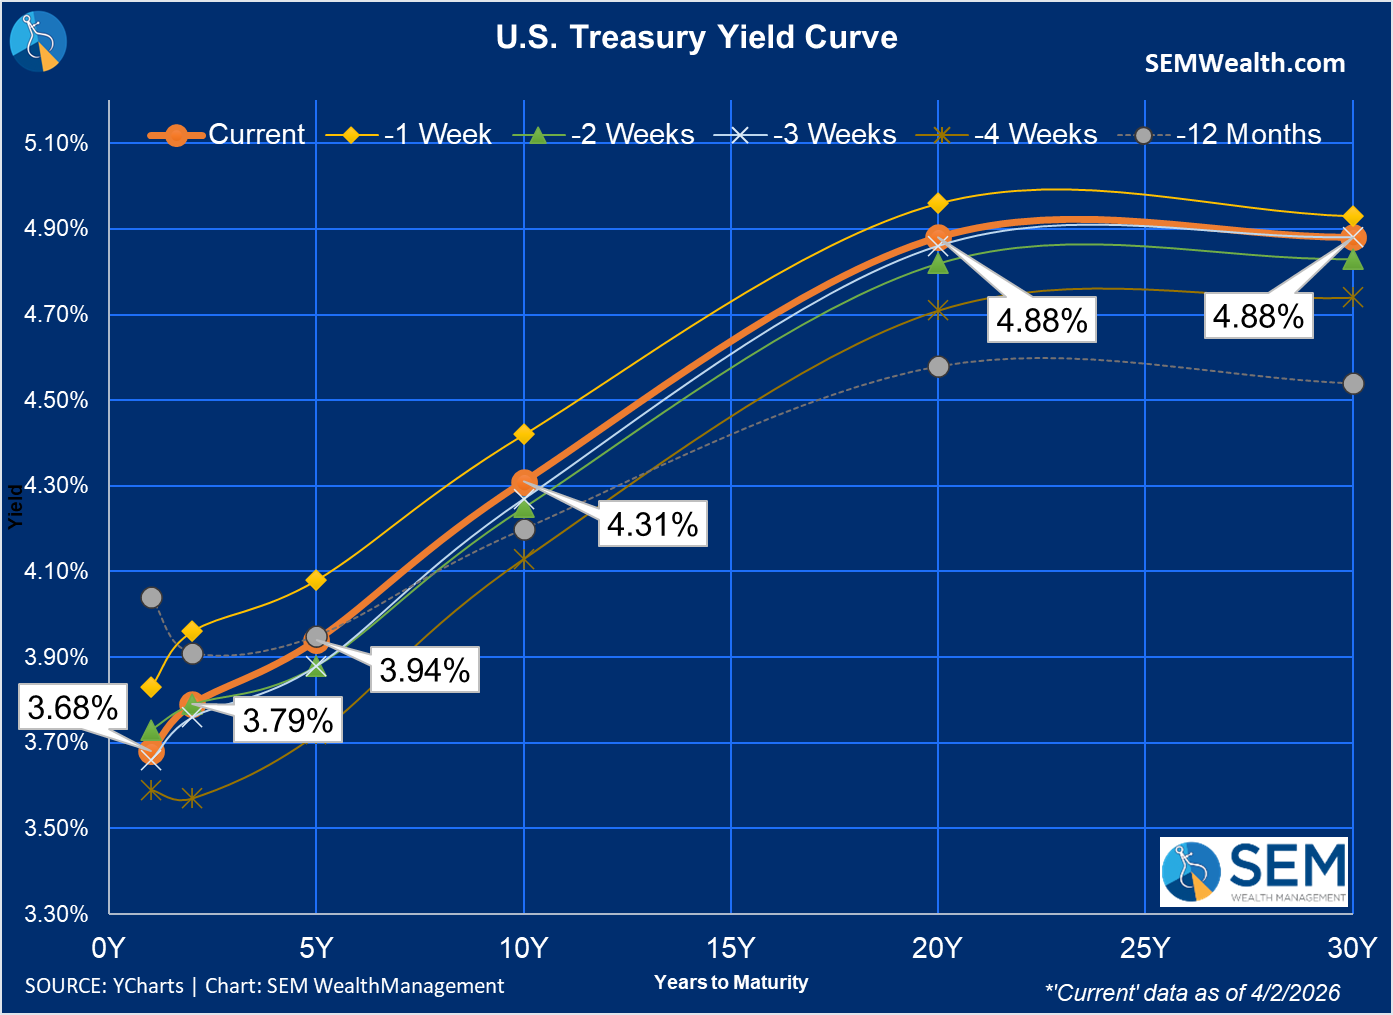
This chart shows how volatile yields have been since the start of the year.
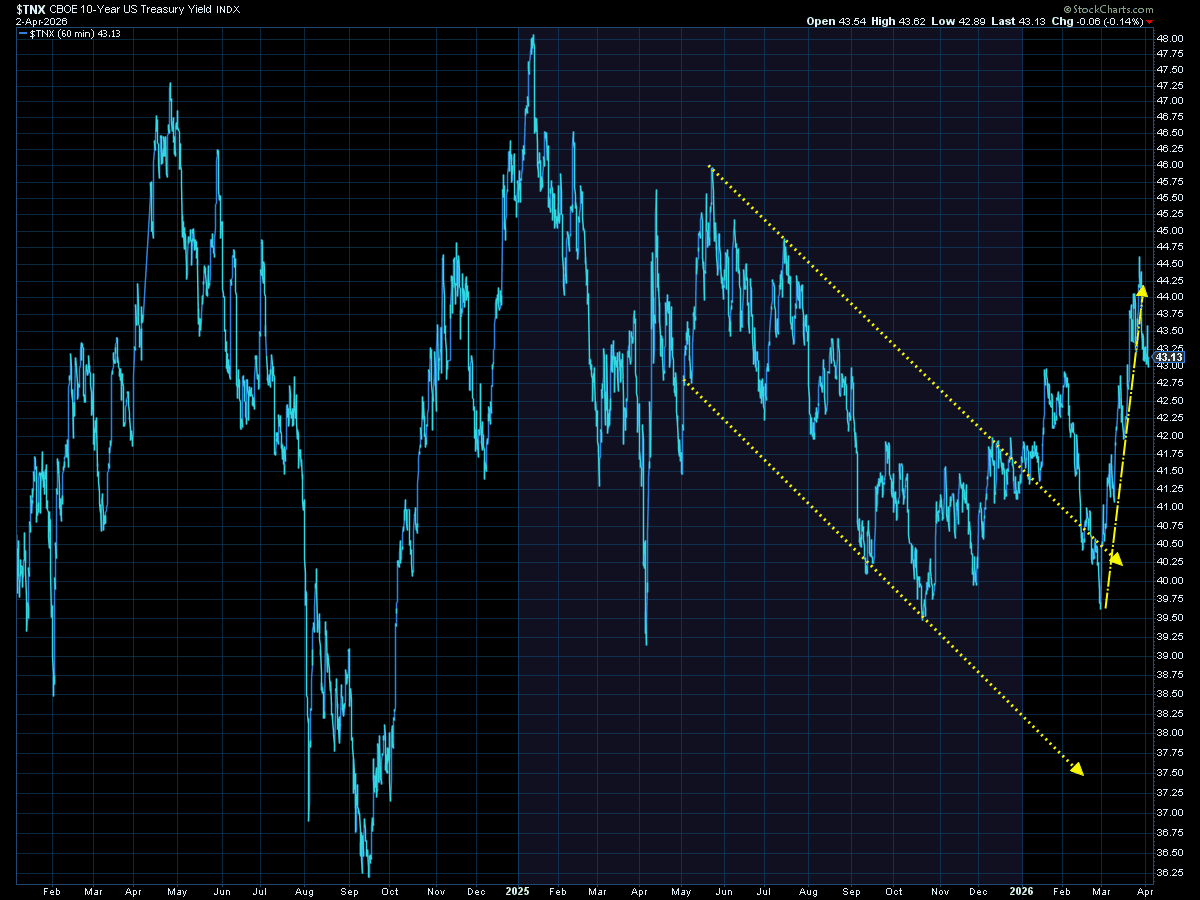
We remain slightly "bearish" on interest rates (meaning we prefer Money Markets) and are (for now) out of high yield bonds.
SEM Market Positioning
SEM deploys 3 distinct approaches – Tactical, Dynamic, and Strategic. These systems have been described as 'daily, monthly, quarterly' given how often they may make adjustments. Here is where they each stand.
- Tactical = BEARISH | 100% Money Market (3/13/2026) | High-yield spreads are narrow & trend reversed lower
- Dynamic = NEUTRAL (2/15/2026) | "Benchmark" Allocation | Economic model inconclusive
- Strategic = NEUTRAL (3/30/2026) | Trend has reversed indicating possibility of further downside
Tactical (daily):
- Monitored DAILY
- Models: Tactical Bond, Cornerstone Bond, Income Allocator, Tax Advantaged Bond
- Designed to follow the trends for use in our lower risk models
- SELL Signal issued March 13, 2026 (exiting the buy from April 25, 2025)

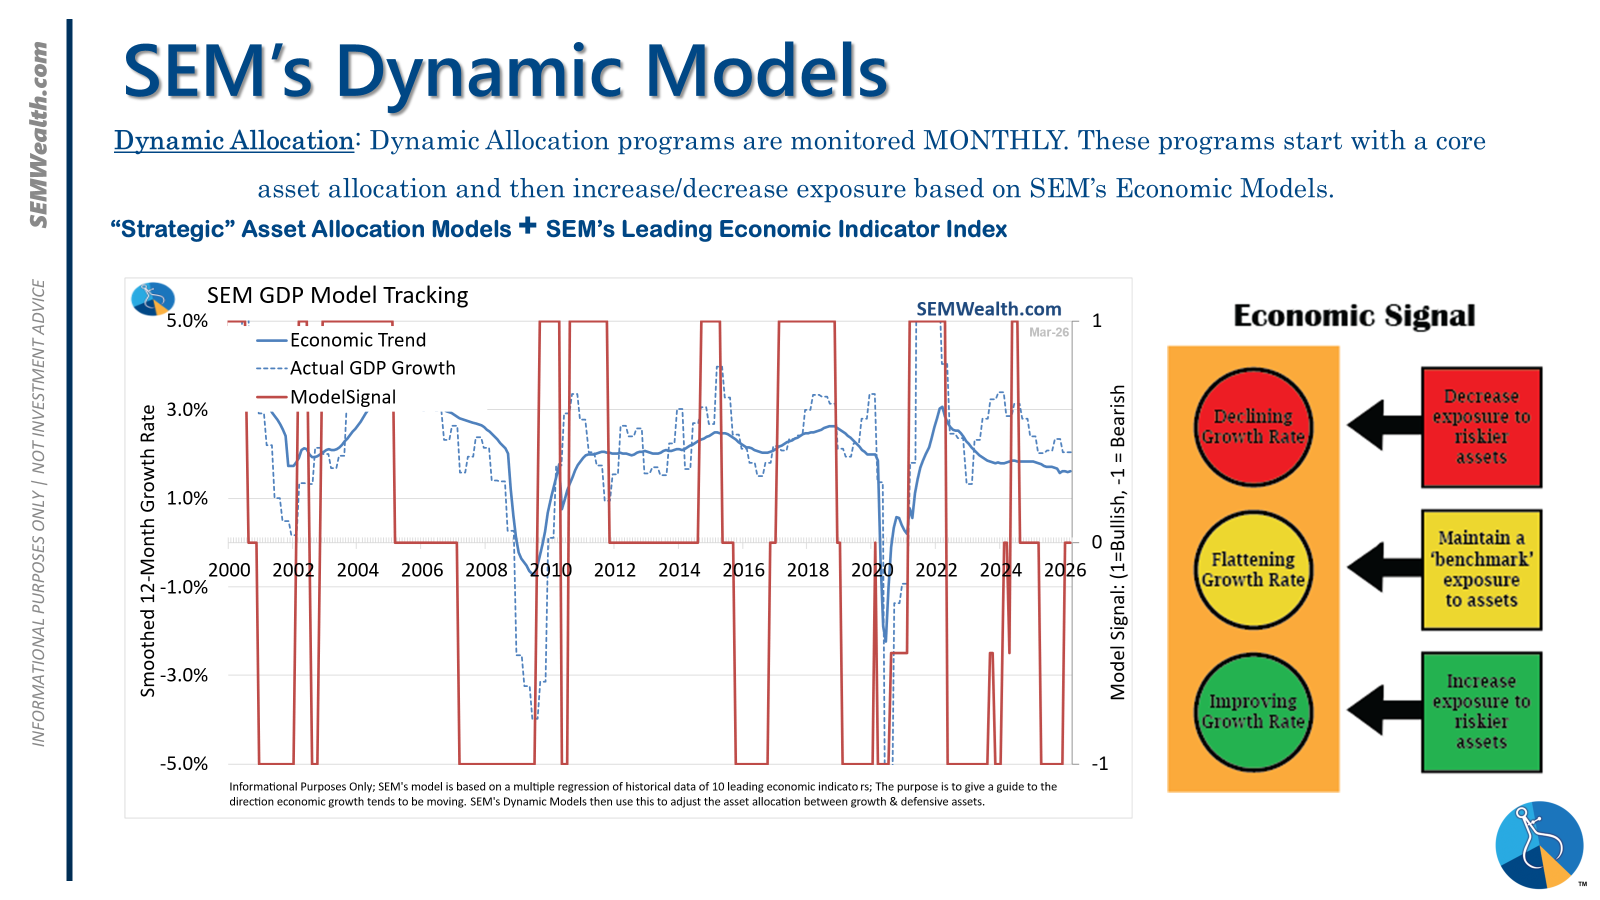
Dynamic (monthly):
- Monitored MONTHLY
- Models: All "Dynamic" Models (Income, Balanced, Growth, and Asset Allocator)
- Uses SEM's Quantitative Economic Model
- Designed to overweight riskier assets if economic trend is higher & underweight those assets if economic trend is lower.
- NEUTRAL signal issued February 15, 2026 (following BEARISH signal from July 2025)
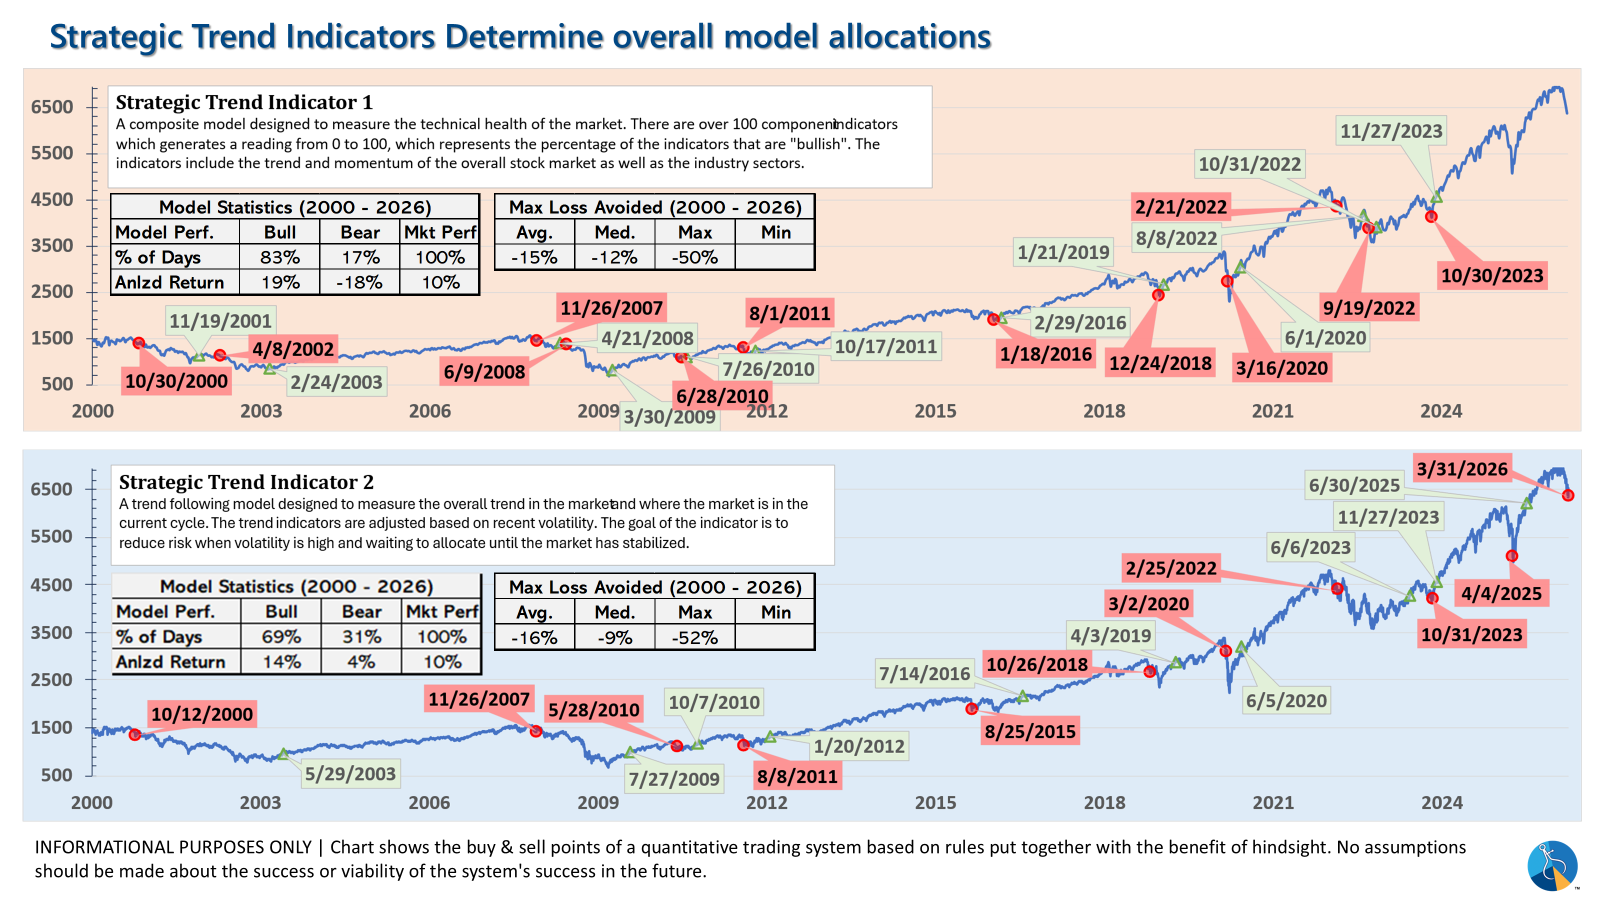
Strategic (quarterly)*:
- Monitored QUARTERLY
- Models: AmeriGuard (Balanced, Moderate, & Growth) and Cornerstone (Balanced & Growth)
- Core Component: Quantitative Filter using 4 different time horizons across universe of asset classes
- Trend Indicator: Two different Quantitative Systems monitoring the intermediate-term trend, health of the market, and volatility
- CORE has been overweight small cap and international since October 2025 – overweight increased slightly in January
- One TREND indicator issued a SELL on March 30, 2026 bringing stock allocation down to 50% in Balanced, 70% in Moderate, and 85% in Growth)
- AmeriGuard & Cornerstone Max DO NOT use the Trend indicator and are always 100% invested in stocks using our CORE rotation model.
The core rotation is adjusted quarterly. This quarter we saw half of our international positions reduced (we sold developed markets and kept our emerging markets exposure). We also saw the remaining share of mid-cap reduced in favor of more small cap exposure. We remain with a "barbell" core portfolio – about half in large cap and half in small cap as the models expect the market to "broaden".
The * in quarterly is for the trend models. These models are watched daily but they trade infrequently based on readings of where each believe we are in the cycle. The trend systems can be susceptible to "whipsaws" as we saw with the recent sell and buy signals at the end of October and November. The goal of the systems is to miss major downturns in the market. Risks are high when the market has been stampeding higher as it has for most of 2023. This means sometimes selling too soon. As we saw with the recent trade, the systems can quickly reverse if they are wrong.
Overall, this is how our various models stack up based on the last allocation change:
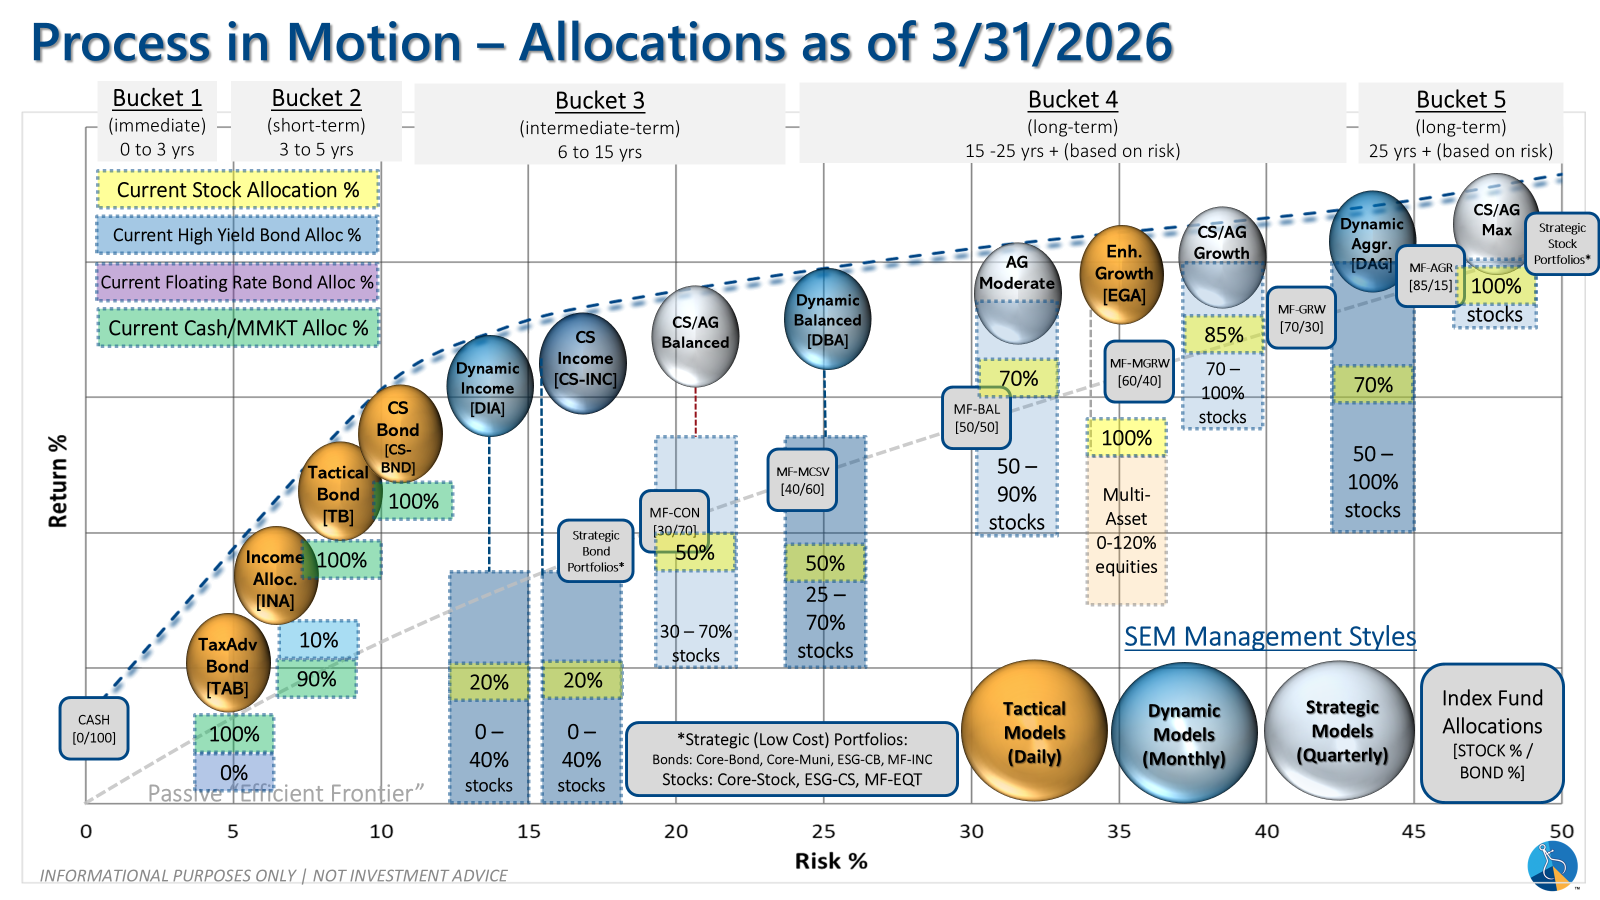
Curious if your current investment allocation aligns with your overall objectives and risk tolerance?


