
Officially the economy grew at a 4.3% rate in the 3rd quarter and by some estimates may (officially) grow at a 5.3% rate in the 4th quarter. You would think we'd see all of the leading economic indicators humming along, but other than stock prices and the money supply (despite criticism of the Fed for being "too tight" with their policies), all of the indicators that normally drive the economy are acting more like we are heading towards a recession.
As discussed two weeks ago, the economy actually grew at a 2.3% ANNUAL rate during the 12 months ended September 30. With current estimates for the 4th Quarter at an ANNUALIZED (3 month change compounded 4 times) of 5.3%, the ANNUAL growth rate would be at 3.1%. That would put us back to AVERAGE (long-term) growth. Even an economy growing at 3% is not supported by the underlying DATA. Are we truly in a 'new era' where all of the spending and economic activity to build AI data centers will be the primary driver of growth? We spent the better part of the 4th quarter discussing the idea of whether or not AI is a "Boom, Bubble, or Both". My take is BOTH. Like the personal computing/BROADBAND internet revolution of the 90s and 00s this WILL change things, but the changes being priced into the stock market are likely to lead to disappointment for investors who chase it too far.
SEM has been around for over 30 years and has seen our fair share of changes. The secret to our survival is our study of market, economic, and human history and using DATA, not our opinions to make adjustments. We most certainly could see another year of AI data center build outs driving GDP higher. We also could see that spending questioned, the financing behind it running into problems, communities fighting any further expansion, or any number of other things we haven't thought of.
Long-term, any economy grows from a simple formula – how many people are working and how much are they producing. When we presented our 2026 Economic and Market Outlook we discussed this in great detail.
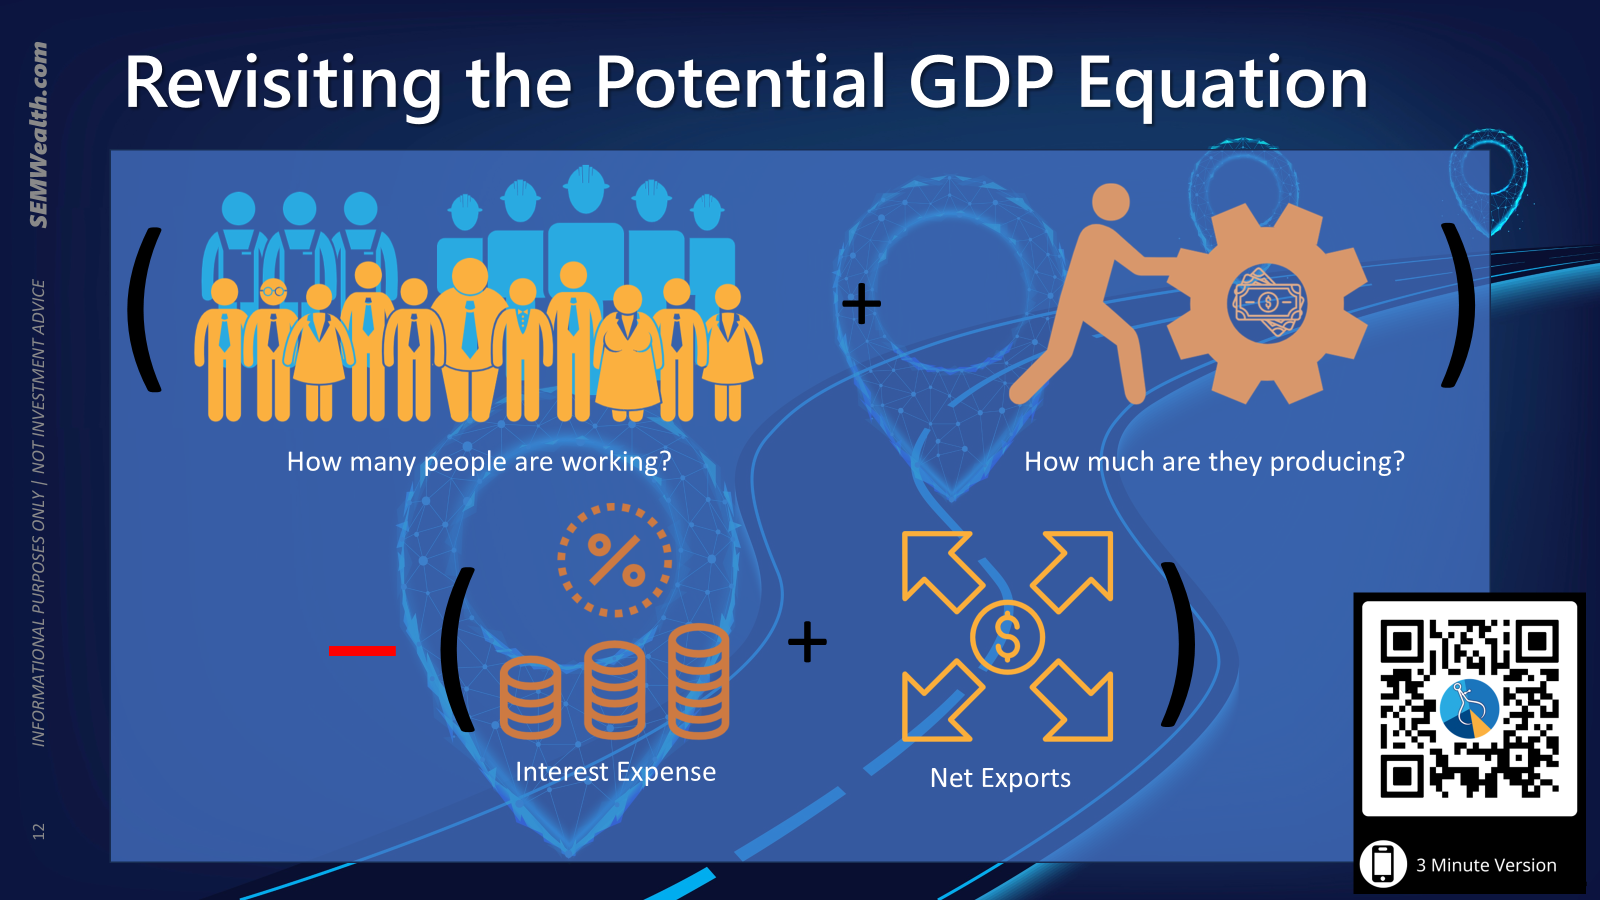
The latest data shows it is not the number of workers driving the economy. Instead, the (temporary?) building of data centers and the (temporary?) improvement in the trade deficit (net exports) has been the key. I added "temporary?" above because unless we see this become a long-term trend, those drivers will go away. That will lead to the question of how much will AI spending actually increase revenue versus how many jobs will it take away. The trade deficit improvement, while nice, usually only represents +/- 0.25-0.50% each quarter, soit isn't something that will make as big of an impact of the number of jobs or productivity gains.
IMPORTANT NOTE: As I proofread this it came off much more negative than I intended. Some may see it as an intentional disparagement of President Trump. That is not the intent. I'm trying to take my experience, study of history, and understanding of economics to explain what was a whirlwind of ideas floating around last week. I will say what I have said many times since President Trump first took office in 2017 — at least SOMEBODY has the guts to do something (or at least say something to start the conversation). For too many years politicians were afraid to speak out against major industries or countries. I've spoken about the "social crisis" we would be facing in the 2020s since the early 2010s. We have some major cracks in our foundation that need healed for our country to remain viable. Right or wrong, the President is looking at ideas few in Washington have the guts to bring up.
All of that said, I completely disagree with the way the President is trying to assert his control and demands on the Federal Reserve. I know the President claims he isn't behind the Department of Justice criminal investigation of Jerome Powell, but his on-going insults and threats to the Fed Chair make it clear he wants to be able to control what the Fed does. Giving ANY President the authority to dictate interest rate and other Fed policies is a disaster waiting to happen. It would risk the US's status as the world's reserve currency and more importantly make it very difficult (and thus more expensive) to finance our on-going deficits. Inflation would be significantly higher (easy money + a weaker dollar = higher prices for consumers and businesses). Of all the Fed Chairs in my lifetime, Jerome Powell is by far the most competent (and market friendly). This vendetta against Chair Powell risks all of the positives the President has been working on for the economy.
With that, let's take a look at the news from last week.
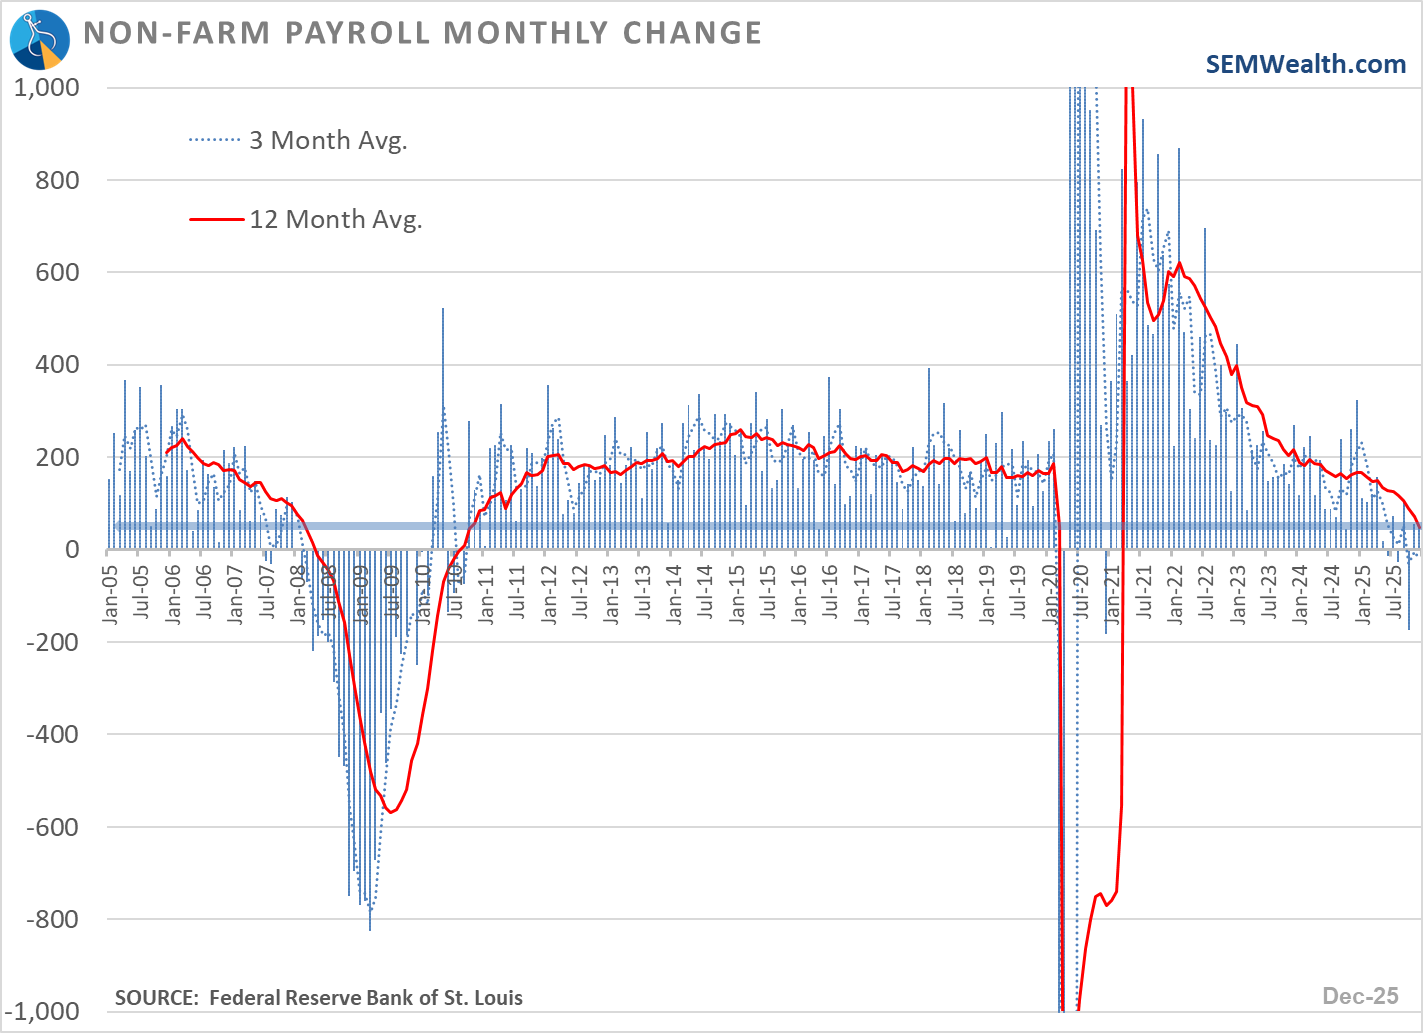
The labor market is struggling
Going back to 1990, we've never had a 12-month average as low as it is currently outside of a recession. The lackluster job gains in December were made worse by large revisions to the previously released October and November numbers. The growth came from restaurants and health care. Most other sectors were flat to down.
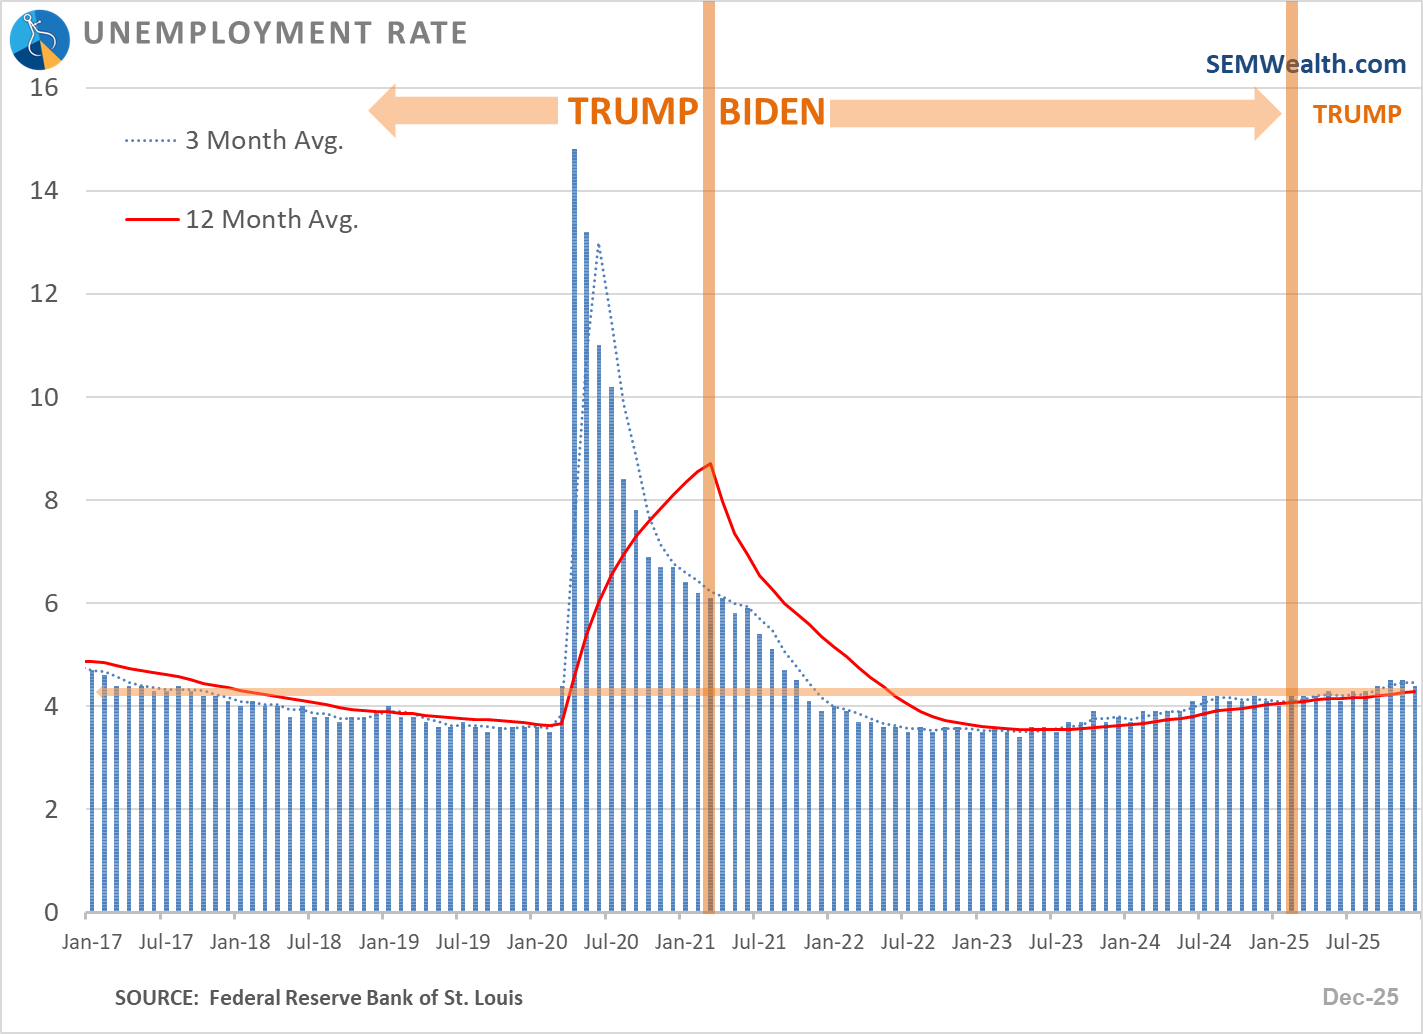
The unemployment rate ticked down by 0.1%, but is still the highest non-COVID related number we've seen going back to the early days of President Trump's 1st term.
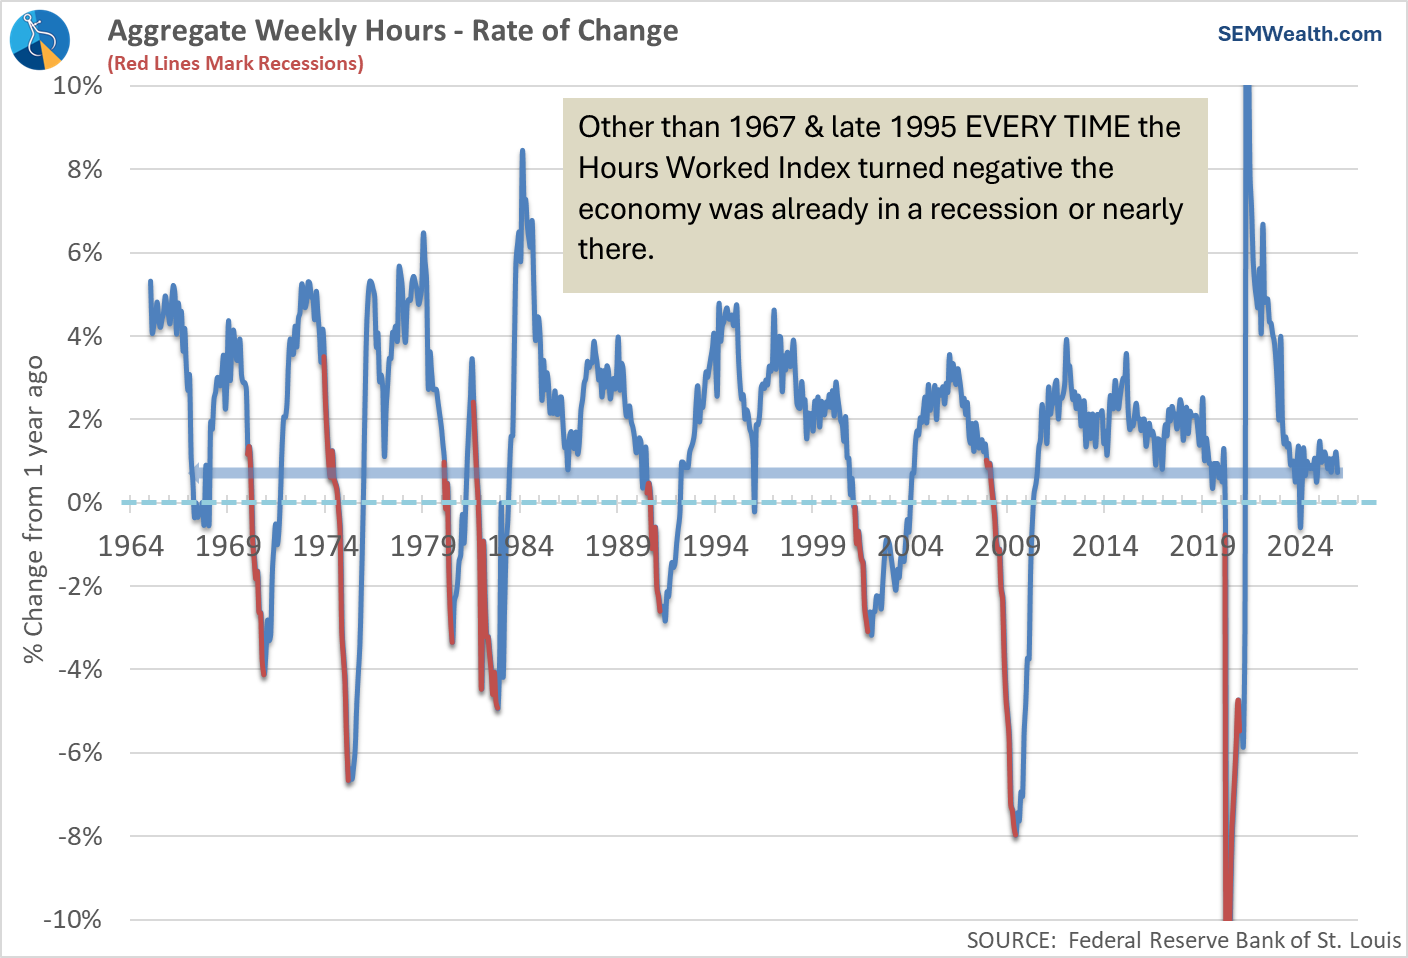
Hours worked, one of our key leading indicators, increased slightly, but is now flashing a warning sign as it waivers towards a decline.
Few positive signs
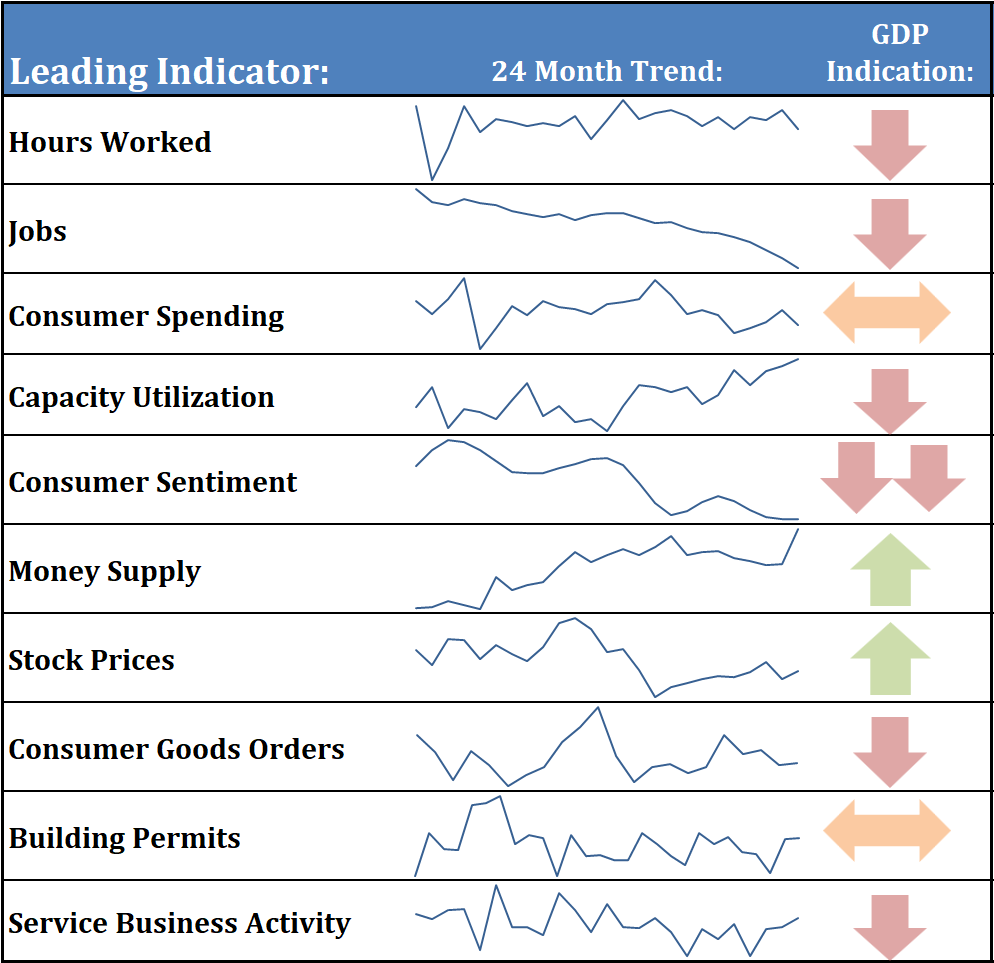
As for the rest of the economy? There are few bright spots. Our economic dashboard helps us tell the story of each of our leading indicators.
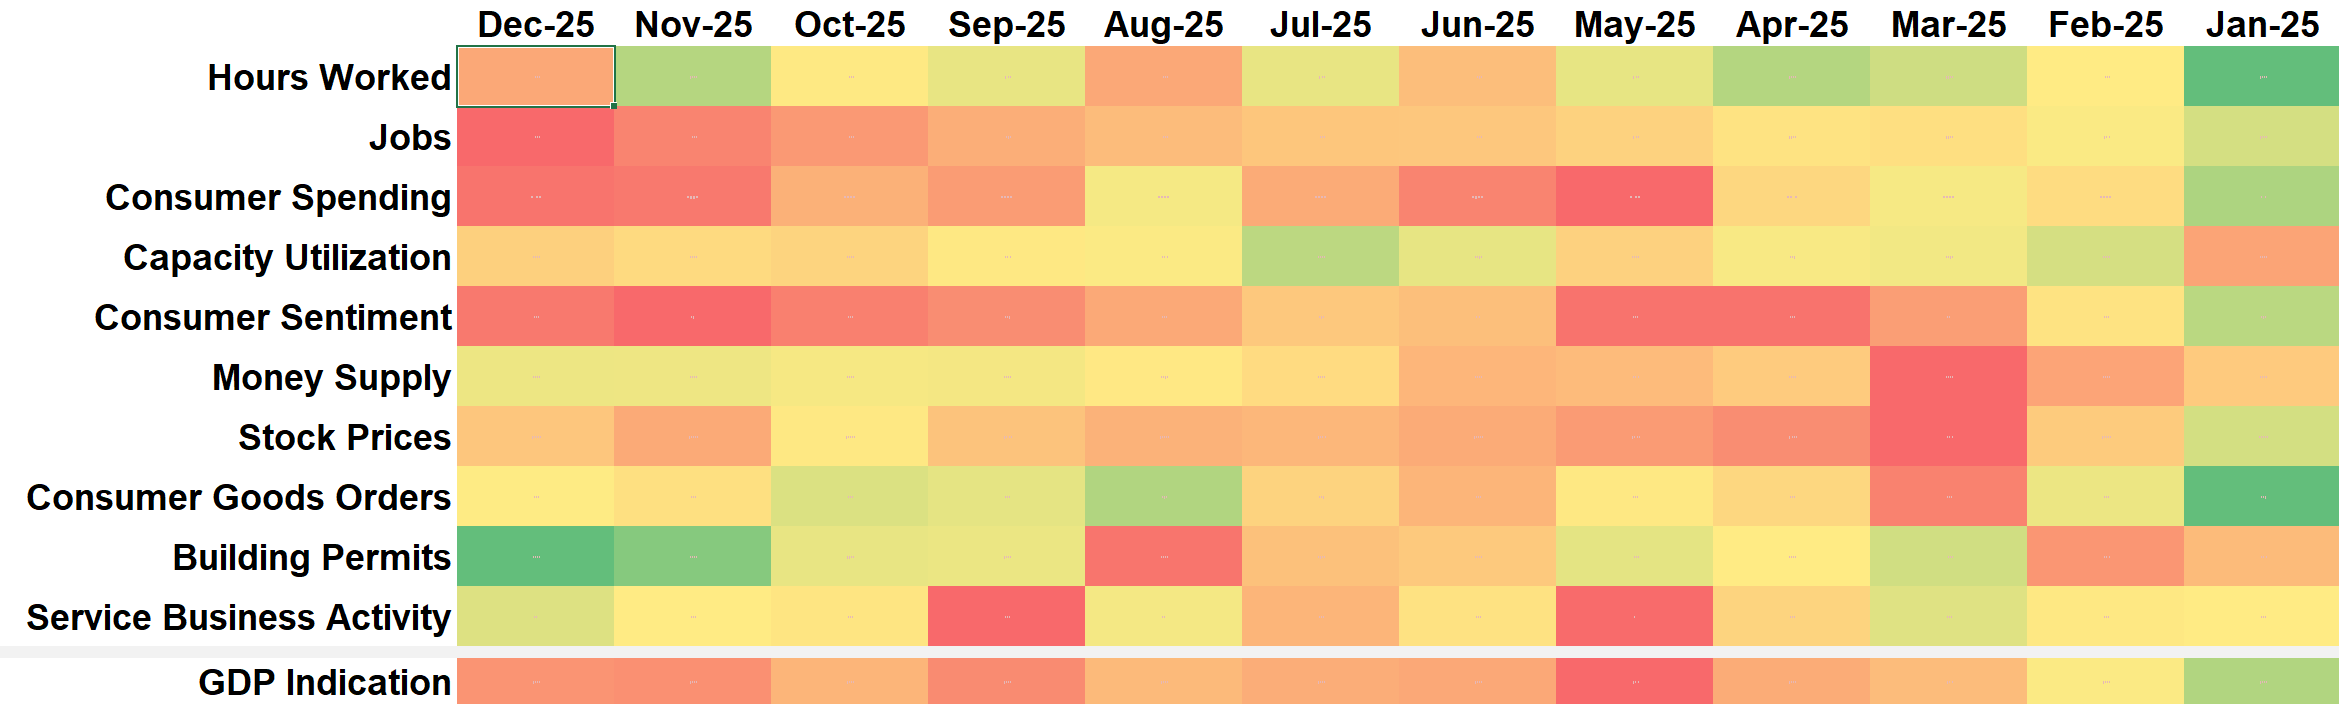
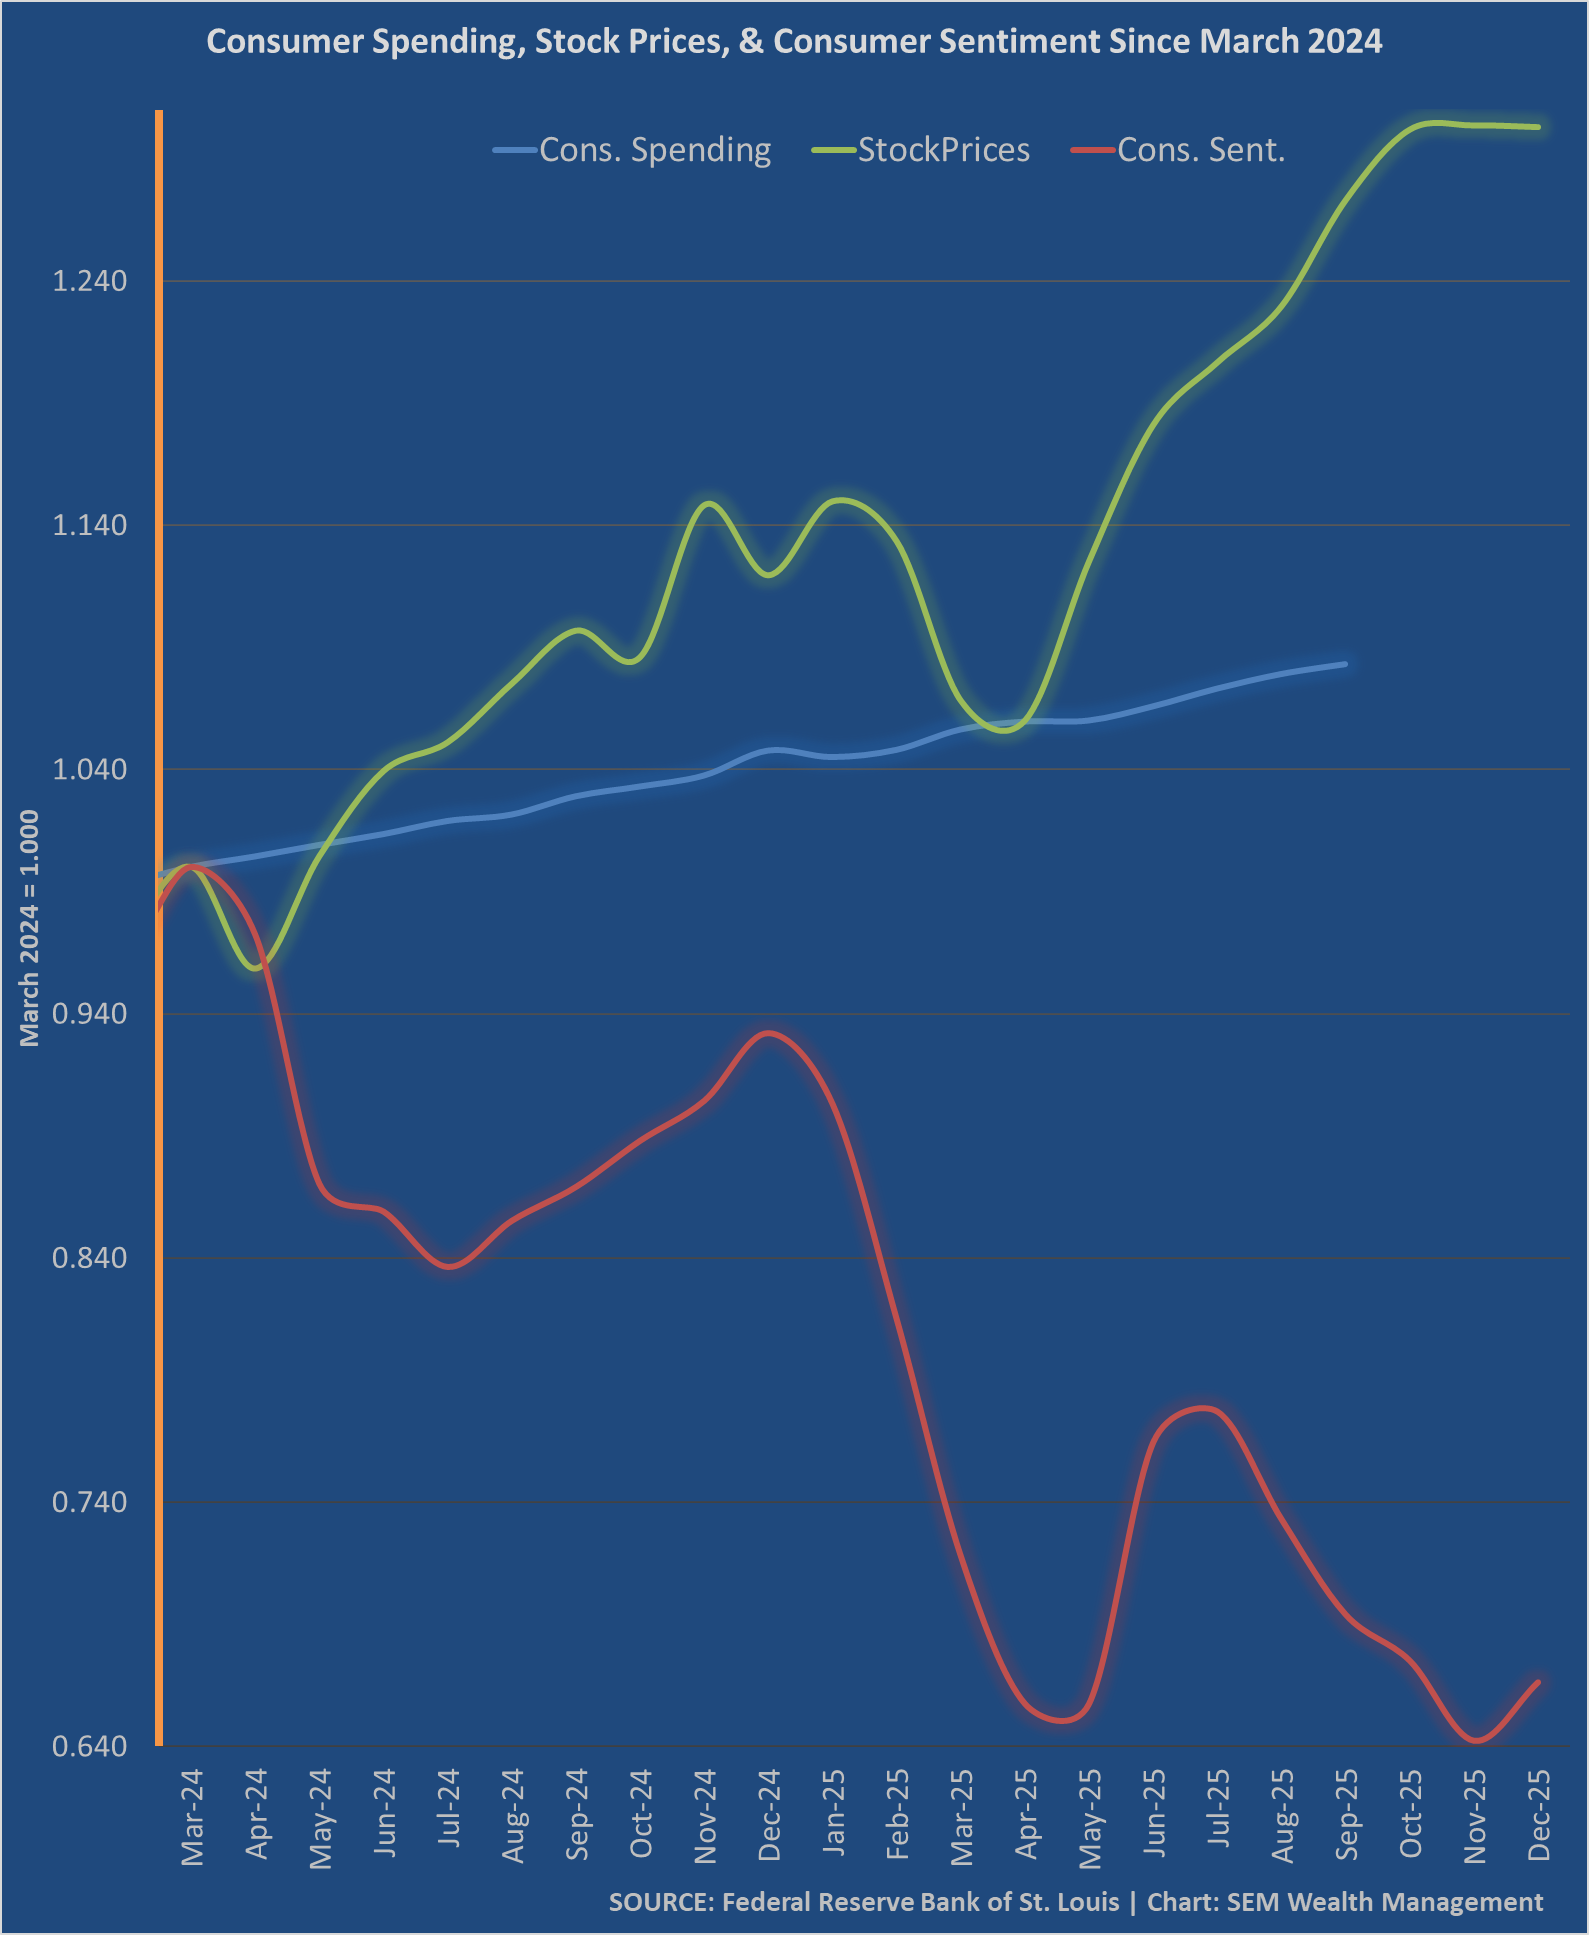
Our heatmap highlights the areas of strength and weakness. We already highlighted the troublesome labor market. The official consumer spending data we have has not been updated since September. We are currently using privately sourced data and trend models, which show a continued slowdown in spending. We are (again) supposed to get updated numbers through November early next week (although the government has been saying that since the 3rd week of December.)
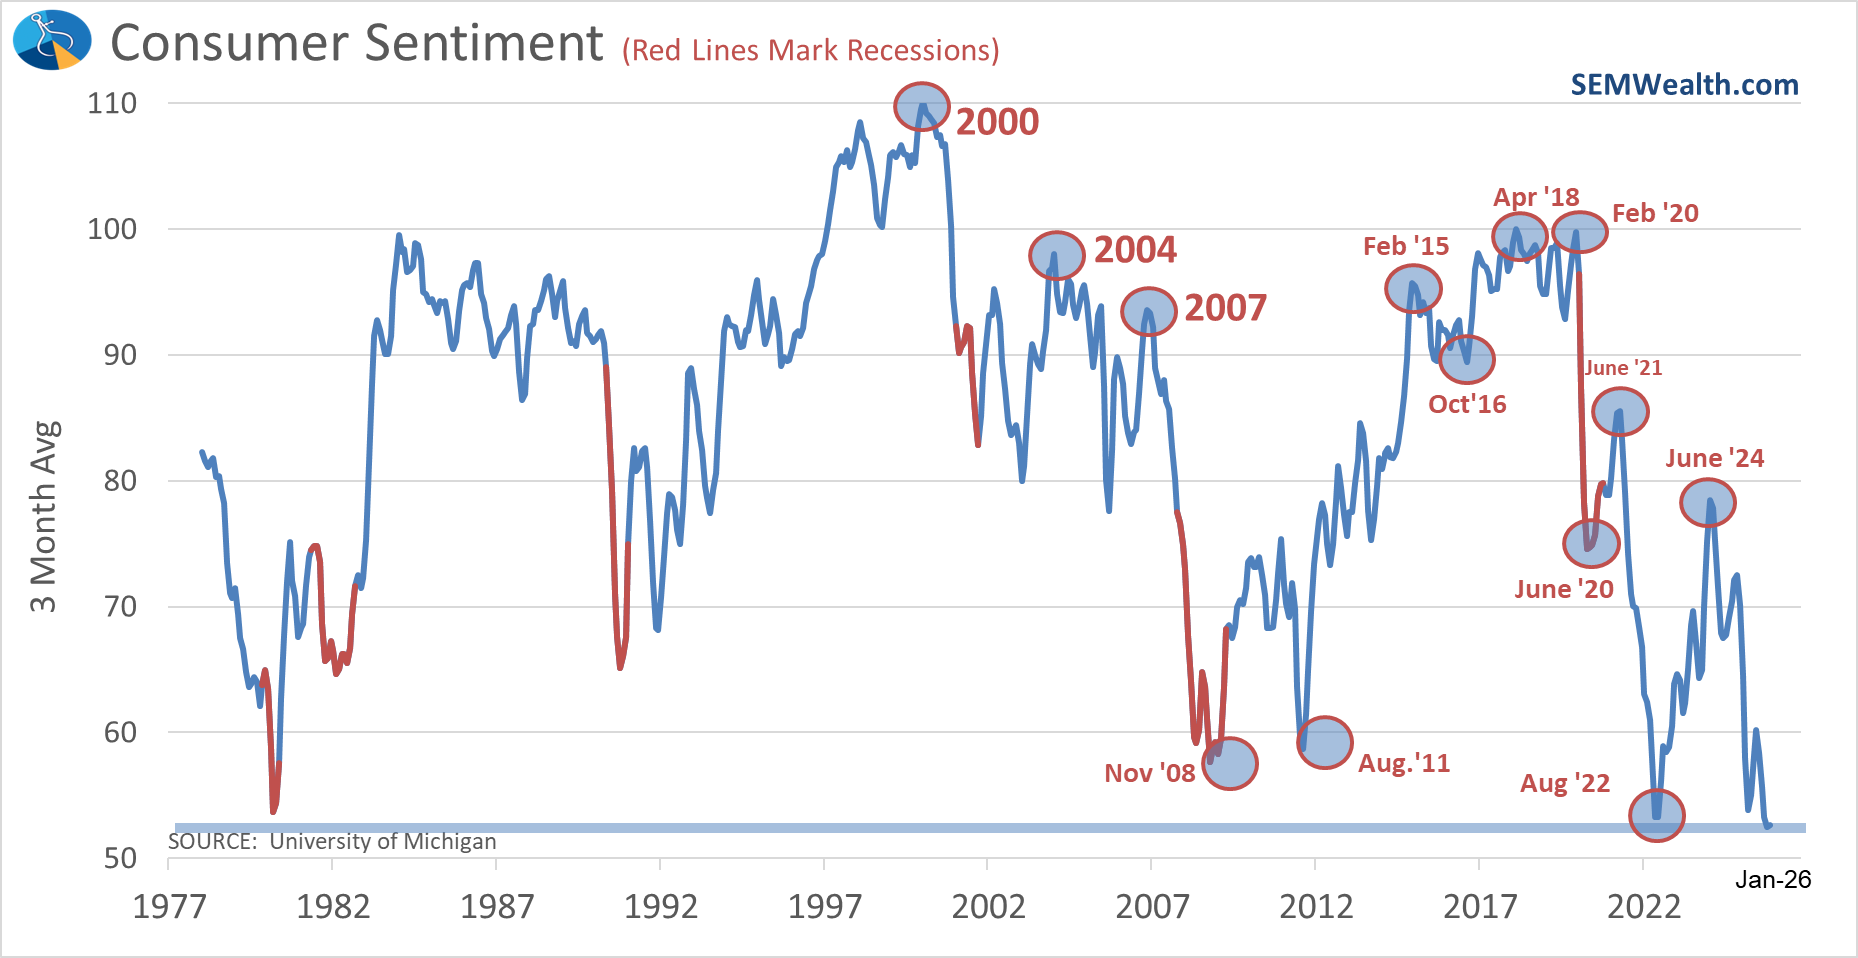
Consumer Sentiment is something we've spoken about for the past six months. This does not always lead to a direct slowdown in spending, but it is a sign that the foundation is weak.
With the updated December numbers the 3-month average is the lowest on record.
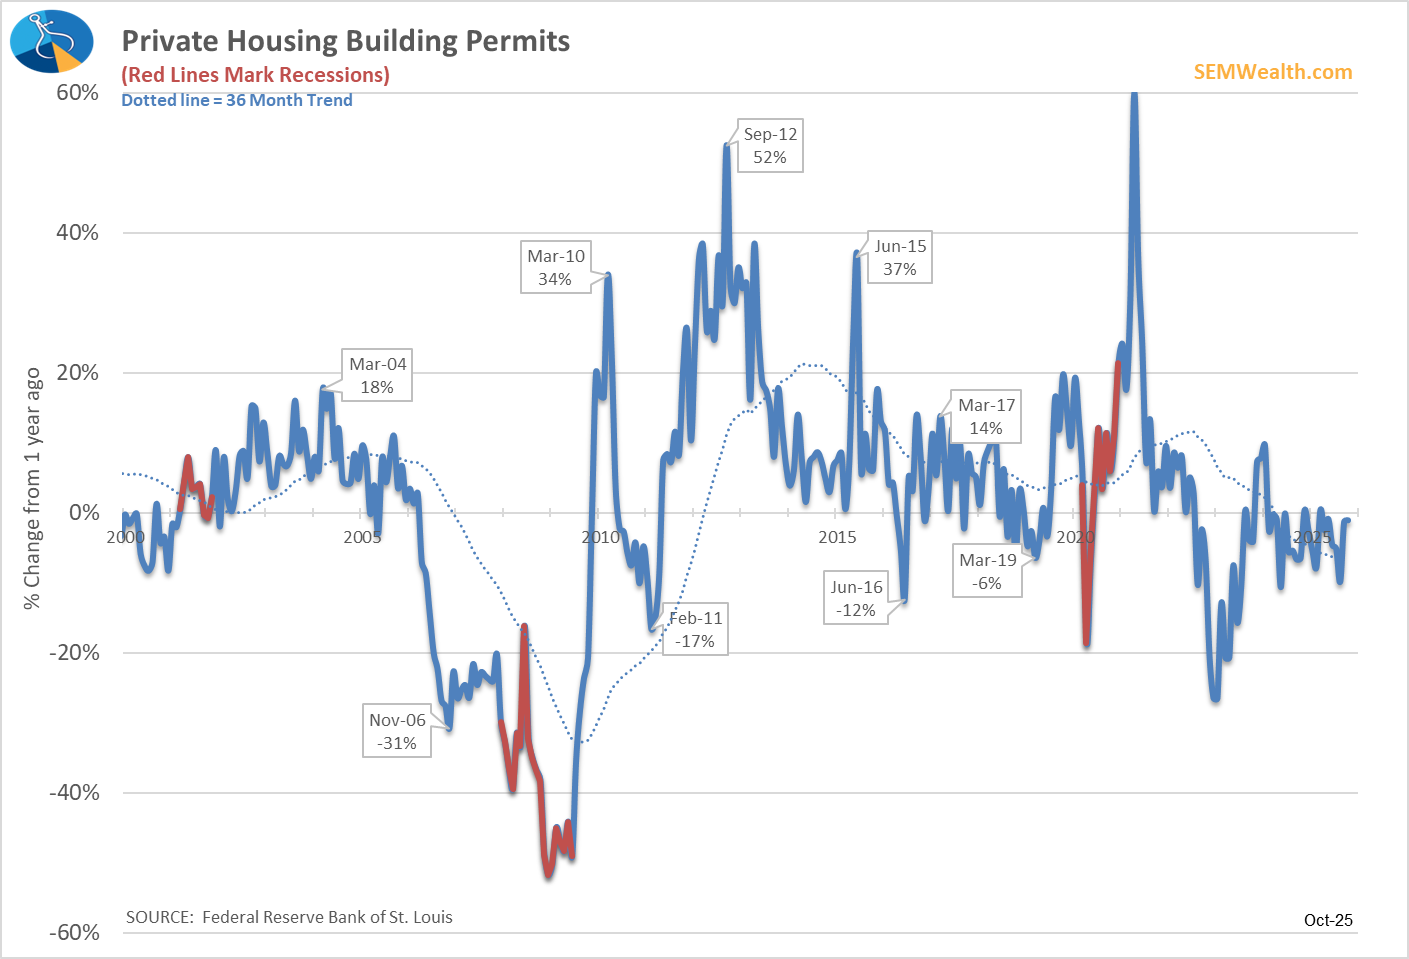
The biggest positive surprise is from the housing market. While the overall activity is still weak, building permits have improved after a sharp summer slowdown and are nearly back to the same activity we had a year ago.
Here's the updated model chart:
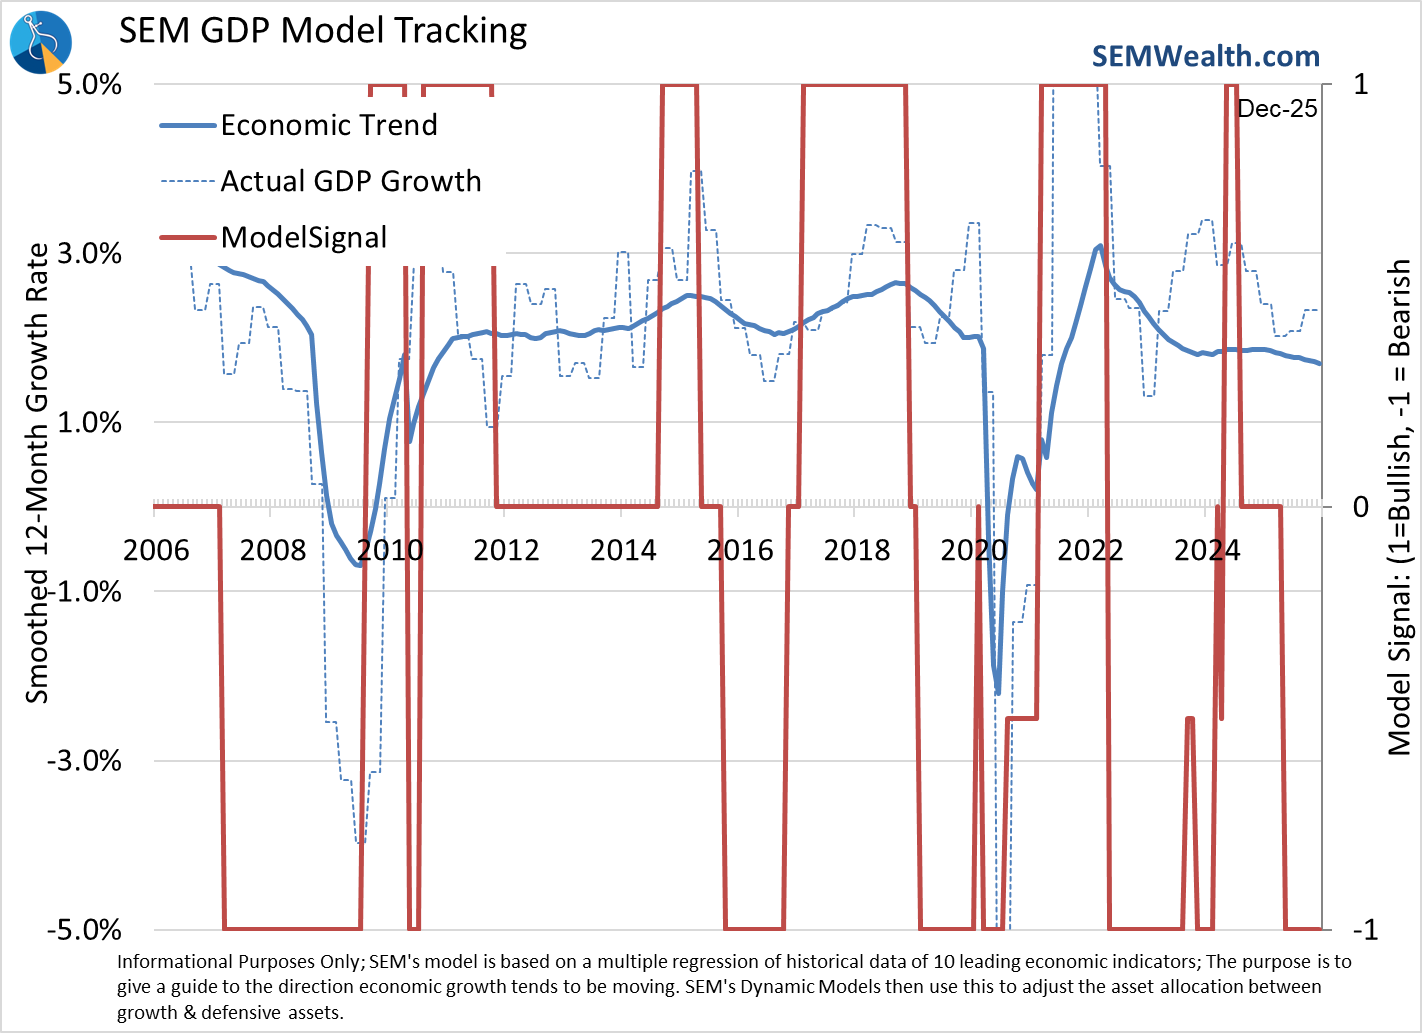
Based on the data that we have, the trend remains down. Will this be another year where Capital Expenditures on data centers are able to drive continued slowing in consumer spending and other key areas? Will health care spending be another source of growth like it was in the 3rd quarter last year or will the lack of subsidies lead to more uninsured Americans not spending money on health care? What will happen with tariffs? We know a key reason the trade deficit improved so much in the 2nd and 3rd quarter was the huge surge in inventories that started the year. Companies rushed to stock their warehouses ahead of the tariffs and as they burn that inventory off, will need to replenish.
We cannot guess what will happen next. The economic model was created in 1995 using data going back to 1950. It has been used in real-time since 2001. It is not always right. It will have times where outliers drive growth. It is designed to recalibrate each quarter to adjust to any new drivers. The adjustments may not occur as fast as we'd like, but that is by design. The reason for our success and the ability of the model to navigate the various market cycles is the use of data, not our opinions. In the moment things may seem simple with "new" trends taking over, but our mind will play tricks on us. If the data shows real changes it will adjust accordingly.
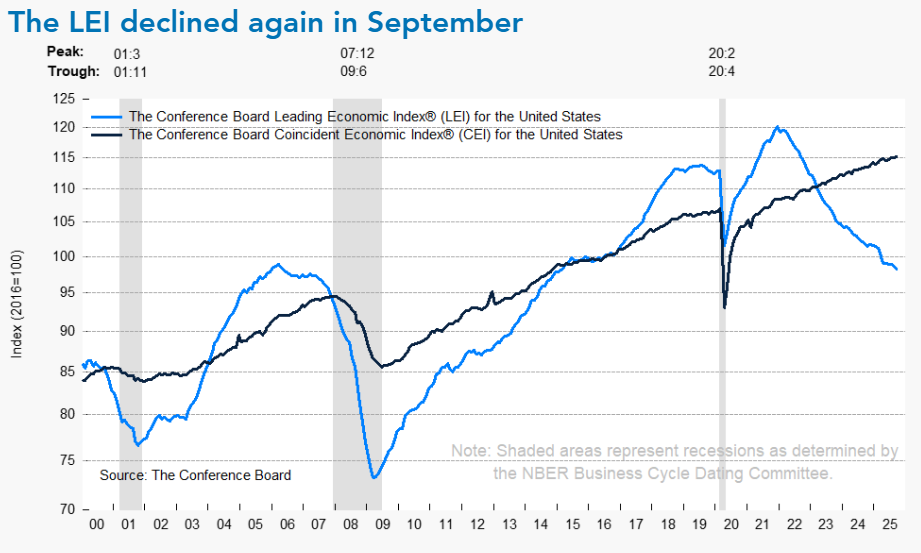
For what it's worth, its not just SEM's economic models not seeing the improvement in the growth rate the second half of 2025. The Conference Board's leading economic indicators have also been pointing towards a slowdown since the beginning of 2022. The "coincident" indicators thus far as still moving higher (although not anywhere near the pace of the overall economy).
Will housing proclamations fix the K-shaped economy?
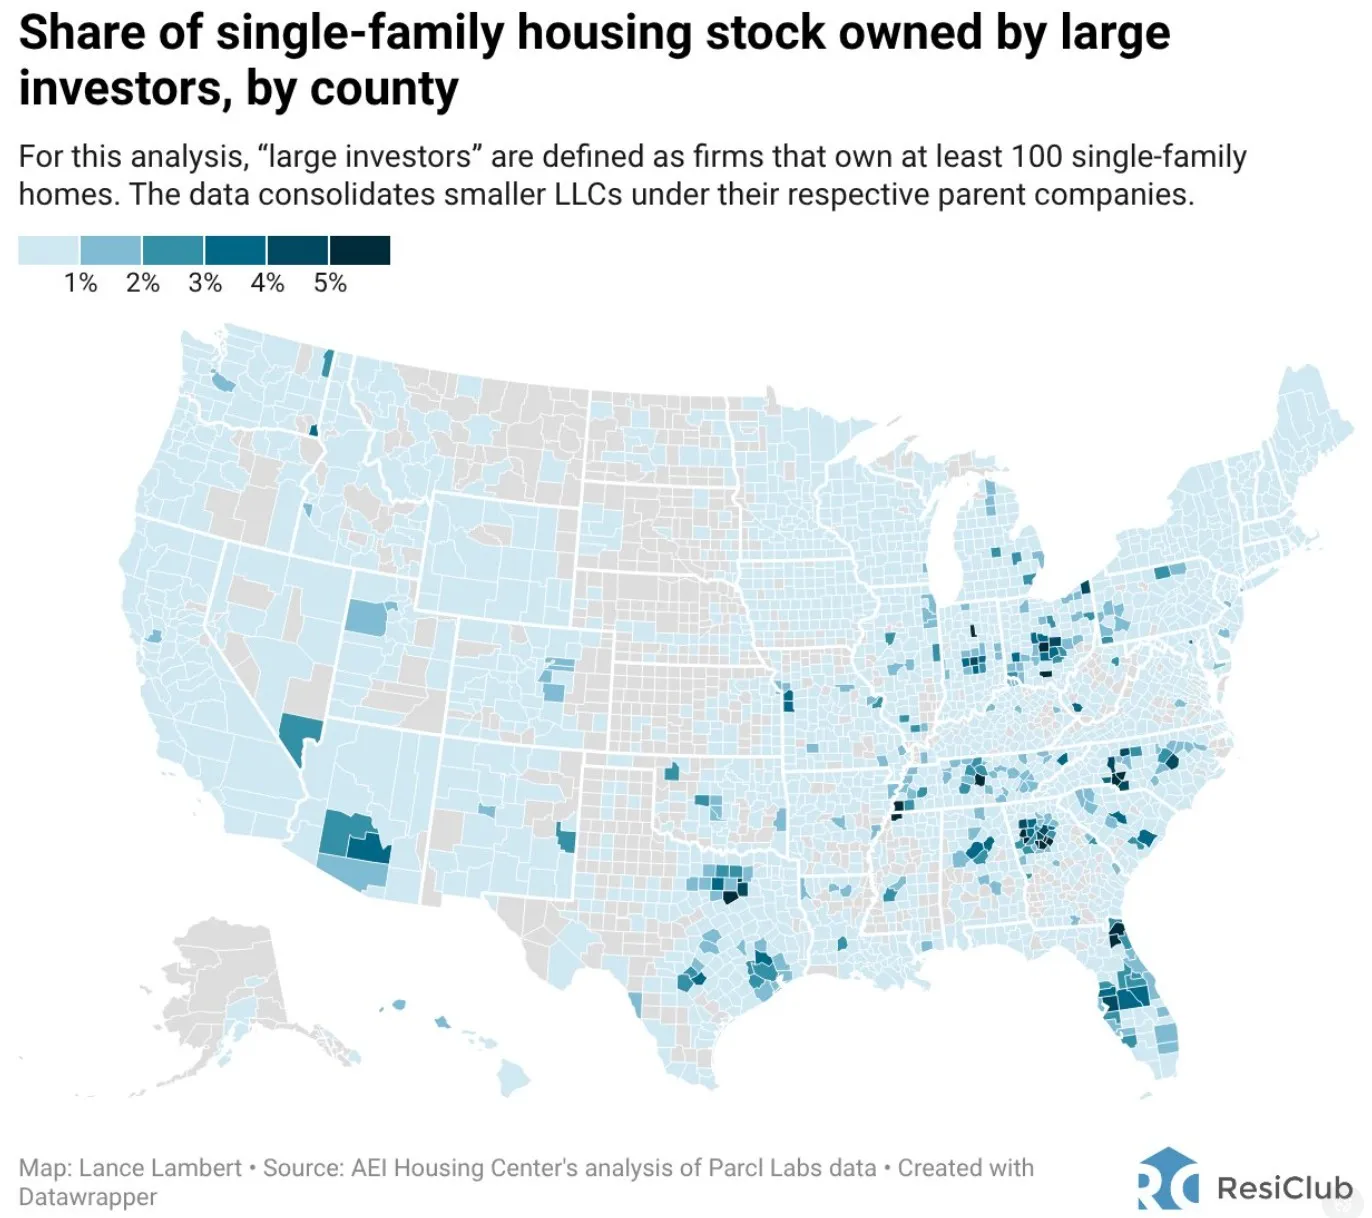
Late last week, two Truth Social posts from President Trump jolted the housing market. The first, was a proposed ban on institutional ownership of single family homes. Being from Tucson and seeing this happening for years, I've been a long-time critic of this practice (as have the Democrats who proposed something similar under President Obama.) The problem is, in most localities, institutional ownership isn't the problem.
The second (and more important) post suggested the President's "representatives" were going to purchase $200 Billion of Mortgage Backed Securities. It turns out the "representatives" are Fannie Mae and Freddie Mac, who coincidently are sitting on $200 Billion of reserves. Now, let's forget for a second that those reserves are in place for economic emergencies to stem problems in the housing market, not to spark MORE housing activity. Will this actually help address the "affordability" problem?
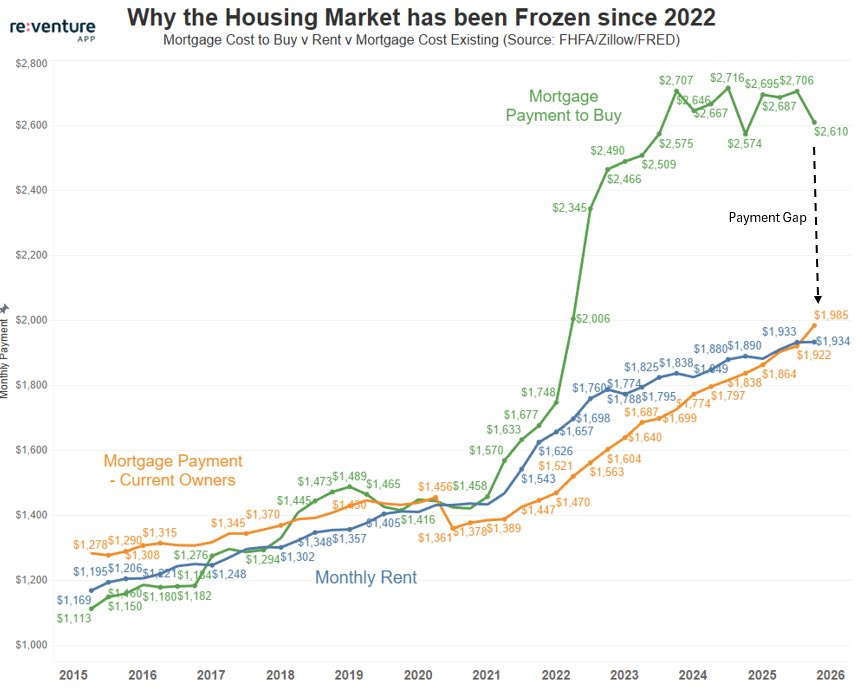
Mortgage rates fell below 6% on Friday (down about 0.22%). Based on past Federal Reserve purchases of this amount of mortgage backed securities, this is a large chunk of the expected 0.25-0.50% reduction in mortgage rates. Here's the problem – mortgage payments for NEW homebuyers became disconnected with rent payments and payments from EXISTING homeowners in 2022. This essentially locked out new homebuyers.
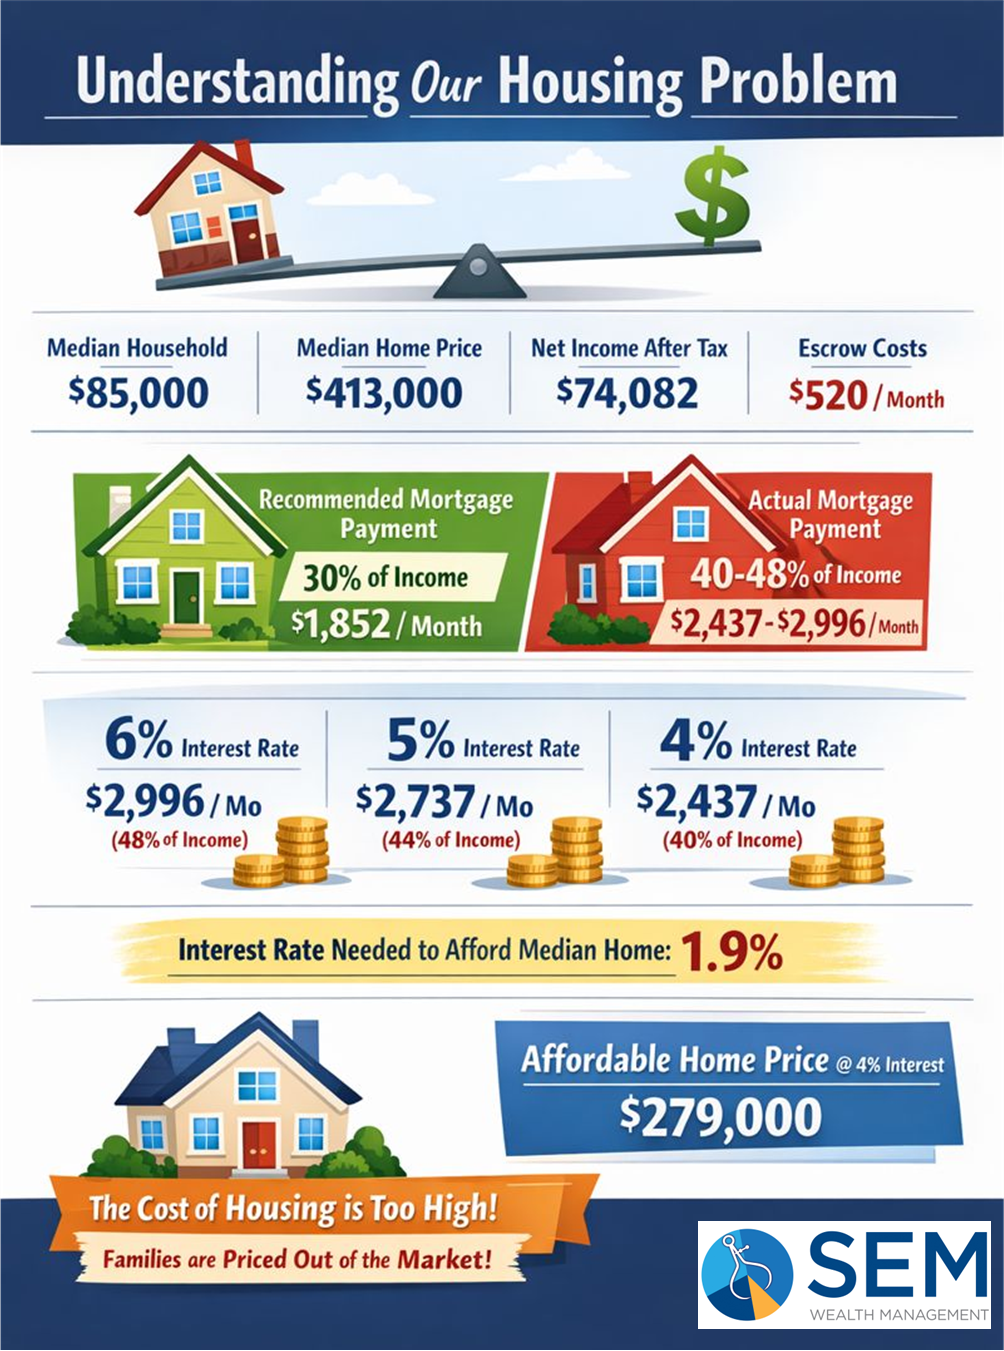
We all realize real estate is "local", but the Federal Government is trying to address the problem with national policies, so let's look at some averages:
- Median Household Income = $85,000
- Median Home Price = $413,000
- Estimated escrow payment = $520/month
- Effective tax rate (median family of 4): = 12.8%
- Net Household Income = $74,082
- Recommended Mortgage Payment (30% of income) = $1852/month
- Mortgage Payment @6%: $2476 + $520 = $2996 (48% of income)
- Mortgage Payment @5%: $2217 + $520 = $2737 (44% of income)
- Mortgage Payment @4%: $1971 + $520 = $2437 (40% of income)
- Recommended Mortgage/Rent Payment (30% of income) = $1852
- INTEREST RATE NECESSARY to PURCHASE MEDIAN PRICED HOME = 1.9%
- HOME PRICE available at 4% INTEREST & 30% of INCOME: $279,000
The last two bullet points are important. In order to stick with the recommendation to spend no more than 30% of household income on mortgage (or rent), we'd have to see interest rates fall all the way down to below 2%. Conversely, if we saw mortgage rates at 4%, the average American household could still only afford a house priced at $279,000 (assuming no down payment).
The middle class has been left behind in the post-COVID surge. Rent payments on average take up 32% of the MEDIAN household income. If your family makes less than $85,000, you are struggling mightily. It's no wonder Consumer Sentiment is so low. The lower half of the K feels left behind because they have been. We truly have two economies.
What is truly being missed in the President's requests is the fact it does nothing to address the supply/demand equation. Making payments more affordable would INCREASE prices. If we see prices go up the impact of the lowered mortgage rates will simply vanish.
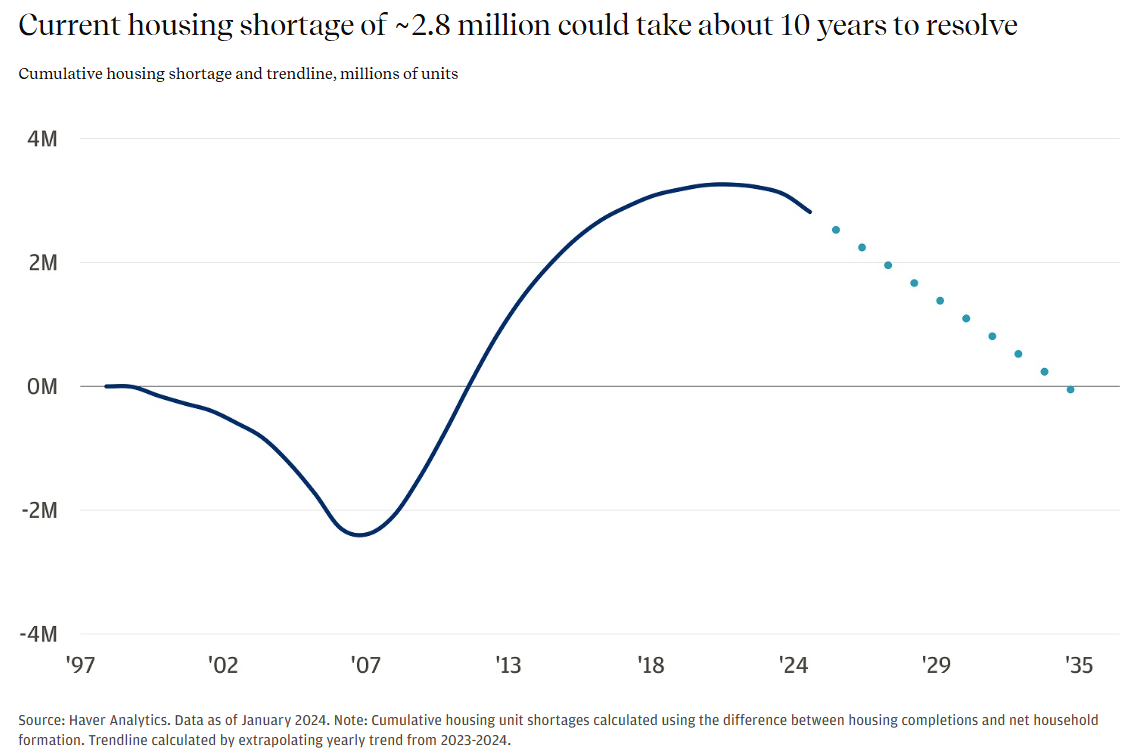
The biggest issue is the SUPPLY of AFFORDABLE housing for first-time (middle class) homebuyers. Too much of the supply is in homes the average American under the age of 40 simply cannot afford (if they didn't already own a home before COVID). JP Morgan had this interesting chart showing the supply problem.
Now, if I were President or one of his advisors, I would use my influence to propose some sort of incentive program for home builders to build affordable homes for first time homebuyers. Right now, it simply isn't economical for home builders to build a home priced at $250K when they can build homes at $500-700K. The president could also use the FHA, HUD, Fannie, and Freddie to offer not only reduced interest rates, but no down payment programs (without the P&I payments required if you put less than 20% down). If the president were to do something like this, not only would it ignite the future growth of communities embracing this, but also do something measurable and helpful to a very large chunk of voters under the age of 40.
I don't need the credit for this idea, but I would love to see people with a line of communication inside the Republican party start pushing this to become reality. This would be meaningful and help two generations stand a chance of getting ahead economically (which is good for all of us.)
A bull market for defense stocks
Two more Truth Social proclamations last week hit another sector of the economy – defense stocks. The first post generally targeted defense companies using their record profits to buy back stocks and pay excessively high executive salaries and bonuses. It also specifically targeted Raytheon (now known as "RTX") and demanded they spend more on plants and equipment than they are on compensating their executives or risk losing their government contracts. The entire segment, which had started the year up 7%, gave up about half of those returns that day.
The following day, they made all of it back and then some when the President said he was going to ask for a $1.5 Trillion defense budget for 2027 (which is $500 Billion higher than his proposed 2026 budget.) To put that in perspective, the defense budget was $700 Billion in 2018 the first year he was able to set his own budget levels.
While the post suggested "tariff revenue" would be used to pay for this surge, the math doesn't math (especially given all the other things the estimated $250-350 Billion of tariff revenue currently projected by the administration has been promised. The $2,000 dividend checks alone would cost $280 Billion of money that was also accounted for in the "One Big Beautiful Bill" scoring.) At 3% interest, just the proposed defense spending would cost us $45 Billion in interest expense each year — nearly the entire amount currently allocated to the Department of Education.
This chart from the non-profit Committee for a Responsible Federal Budget helps put this in perspective:
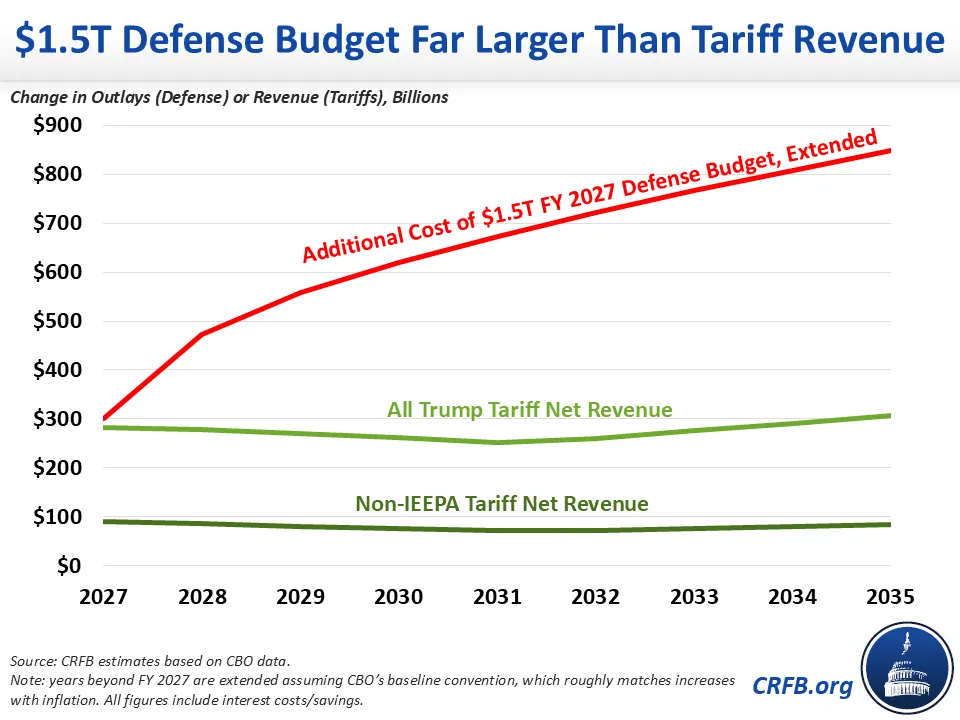
The CRFB used the Non-IEEPA tariff revenue as a benchmark just in case the Supreme Court rules the President lacked the authority to implement the bulk of the 2025 tariff orders.
Look, I'm all for a stronger military. There's a reason we have our Patriot Portfolio. It is a critical part of our country and our economy and is under-represented in the S&P 500 (in my opinion). That said, this type of spending is reckless and not sustainable. Borrowing from other countries to fund our military (and our runaway retirement expenses via Social Security, Medicare, and Federal Government Pensions) will make us WEAKER, not stronger in the long-run.
For now, though we have enjoyed a nice S&P 500 beating run in the Patriot Portfolio since the election of President Trump. Will it continue? That is anybody's guess, but if Republicans lose Congress in November, all of these proposals will not happen and growth expectations will need to be adjusted downward.
Speaking of the tariff revenue, last week the Supreme Court postponed their expected ruling on the legality of the tariffs, but we could hear as soon as this week whether or not they are able to stand.
IMPORTANT NOTE (repeated from the introduction above): As I proofread this it came off much more negative than I intended. Some may see it as an intentional disparagement of President Trump. That is not the intent. I'm trying to take my experience, study of history, and understanding of economics to explain what was a whirlwind of ideas floating around last week. I will say what I have said many times since President Trump first took office in 2017 — at least SOMEBODY has the guts to do something (or at least say something to start the conversation). For too many years politicians were afraid to speak out against major industries or countries. I've spoken about the "social crisis" we would be facing in the 2020s since the early 2010s. We have some major cracks in our foundation that need healed for our country to remain viable. Right or wrong, the President is looking at ideas few in Washington have the guts to bring up.
Toby's Take
A look at our intern's top WSJ stories from last week
1/5/2026 - Hospitals Are a Proving Ground for What AI Can Do, and What It Can’t - WSJ
AI is beginning to do what people have talked about it doing for a long time now. AI is starting to fill in certain jobs such as in the medical field. Radiology is one of these jobs that AI is able to help take some load off. Using AI, X-ray reports are able to be reviewed in about 45 seconds compared to a professional getting no faster than 75 seconds. It sounds scary for people in that position, but it is still required that a human double checks and it is better the patients because they are able to get their reports faster. There have been experiences that AI can be used to get a second opinion using studies, however a doctor found that the AI fabricated the studies to agree. Humans are still necessary to have in workplaces, but these further AI advances is already looking helpful for such important roles to help with patient health.
1/6/2026 - Exclusive | Trump’s Hint to Oil Executives Weeks Before Maduro Ouster: ‘Get Ready’ - WSJ
The strike on Venezuela and capture of their President Maduro could benefit the oil business in the United States. President Trump hinted to oil companies in America to "Get Ready" about a month before the strike. Now, President Trump has a plan to have U.S. energy companies revitalize Venezuela's oil fields. Chevron is the last major U.S. company that still operates in Venezuela, so we may want to watch them closely to see their value potentially rise and gas prices maybe go down!
1/7/2026 - Who is Diosdado Cabello? The Brutal Maduro Enforcer Standing in Trump’s Way in Venezuela - WSJ
President Trump's vision for a friendly U.S. oil power in Venezuela is close to happening. However, there is a man there named Diosdado Cabello who is the leader of their security forces and militias. Because of this man's potential interference with this oil take over, it may shake up the stock value for certain oil producers.
1/8/2026 - Consumers Love Cheap Gas, but the Oil Patch Will Pay the Price - WSJ
With the boosted supply in oil in the United States citizens are benefiting with the lowest average cost in gas at $2.80 since 2021! That's obviously great for us, however oil companies are beginning to struggle with this experiencing layoffs and slowed growth. So despite more oil being sold, the price has gone down so much it could end up hurting the U.S. economy just as much as it is helping. We definitely need to continue watching how the U.S. oil producers are reacting.
1/9/2026 - Trump’s Risky Fixation With Other Countries’ Oil - WSJ
It seems that oil is the topic of the week! President Trump seems to have a wild fixation on other countries' oil. When he was 41 he said in an interview that the U.S. should be getting 25% of what Kuwait is making on oil because we protected their tankers in the Iraq-Iran War. We also know that President Trump has talked recently about "taking" Greenland. There's obviously a lot of controversy surrounding all of these actions and talks, however, looking at it from a finance perspective we may see our patriot portfolio value raise a bit based on these military actions.
Market Charts
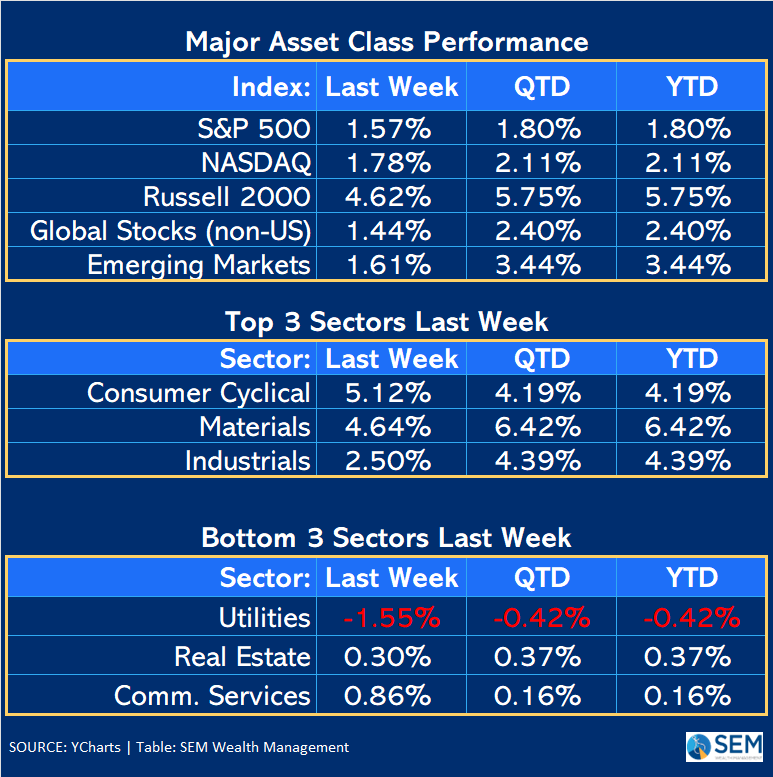
It was another "bull market" type week last week (market was up 4 out of 5 days).
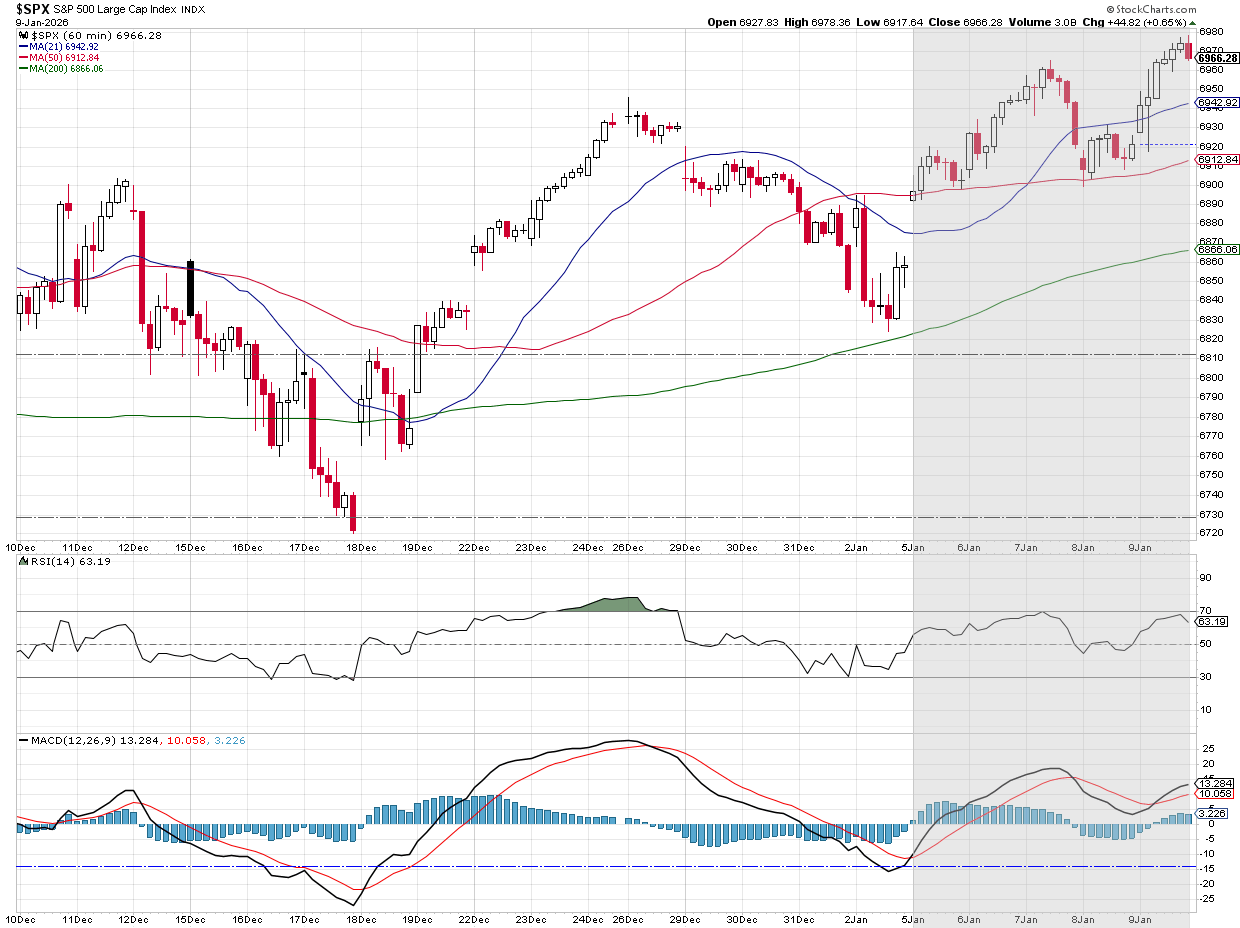
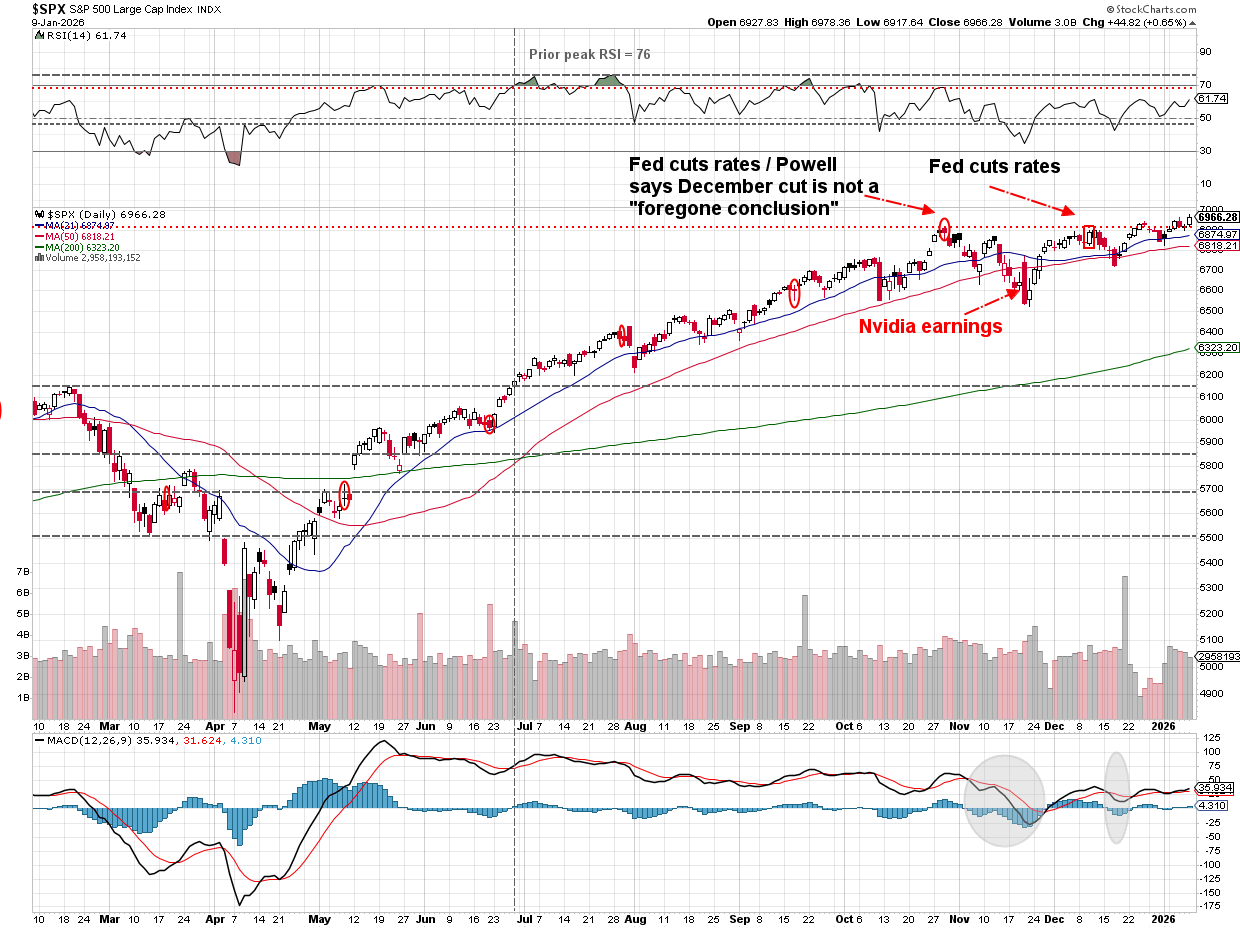
From a technical perspective I'd like to see the RSI Index "confirm" the push above the previous "Fed" highs from October and December, but for now with the S&P 500 (barely) at all-time highs, the trend is technically up, meaning unless something comes along to force a change, we should expect more of the same.
Of course, the flurry of Truth Social posts may continue which could move markets. The latest one over the weekend comes just ahead of Banking stocks releasing their quarterly earnings reports this week. The financial sector, which has had a tremendous run the last 6 months obviously would not be happy if they suddenly found one of their profit centers capped.
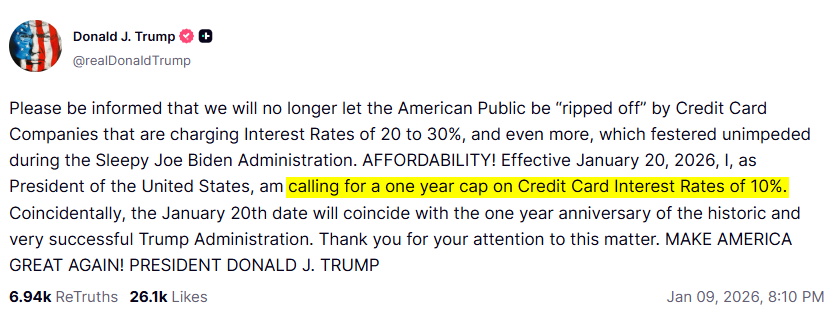
From everything I've read it would take Congress to actually implement this, although the President could provide pressure to the banks to do this "voluntarily".
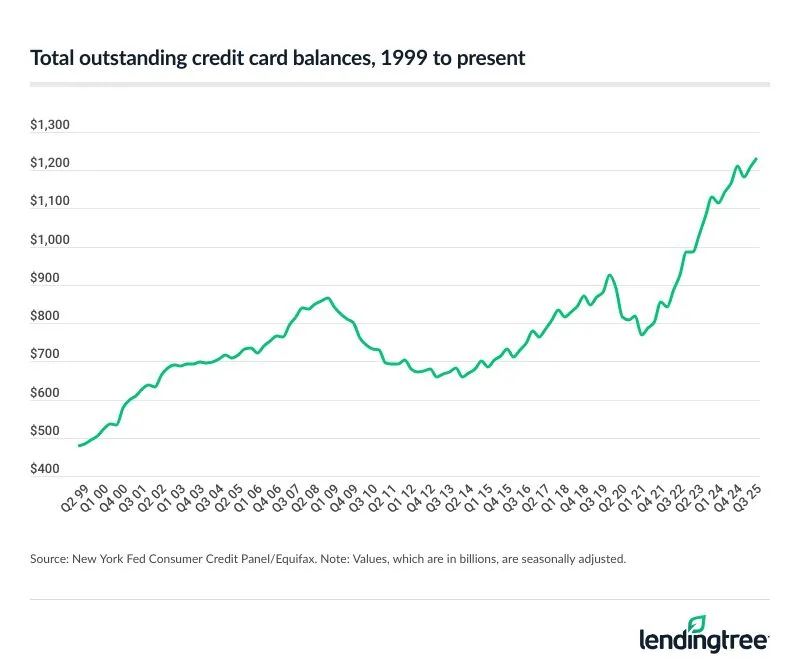
Our country does have a major issue with Credit Cards. Overall Credit Card Debt is $306 billion higher than the pre-pandemic "record" (up 33% since that time).
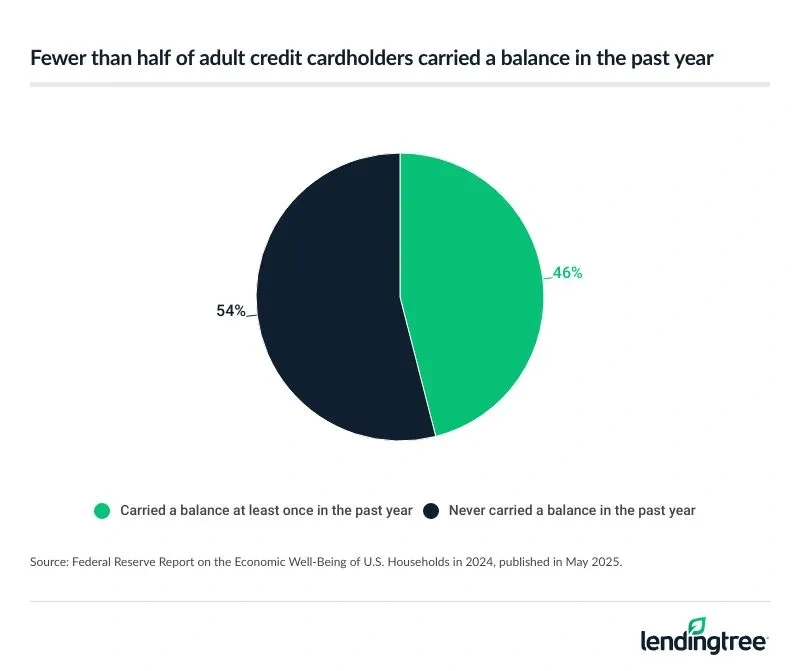
A very large number of Americans carry a balance, which means they are paying excessively high interest rates.
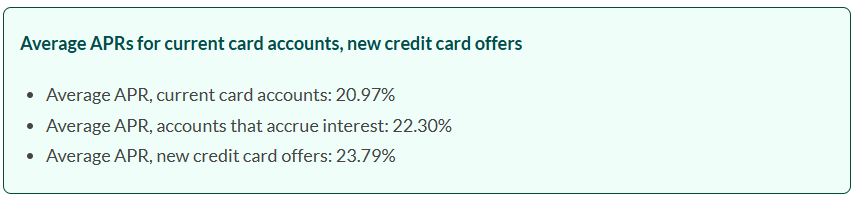
Based on these numbers, Americans are paying $240 BILLION per year in INTEREST CHARGES just for Credit Cards!
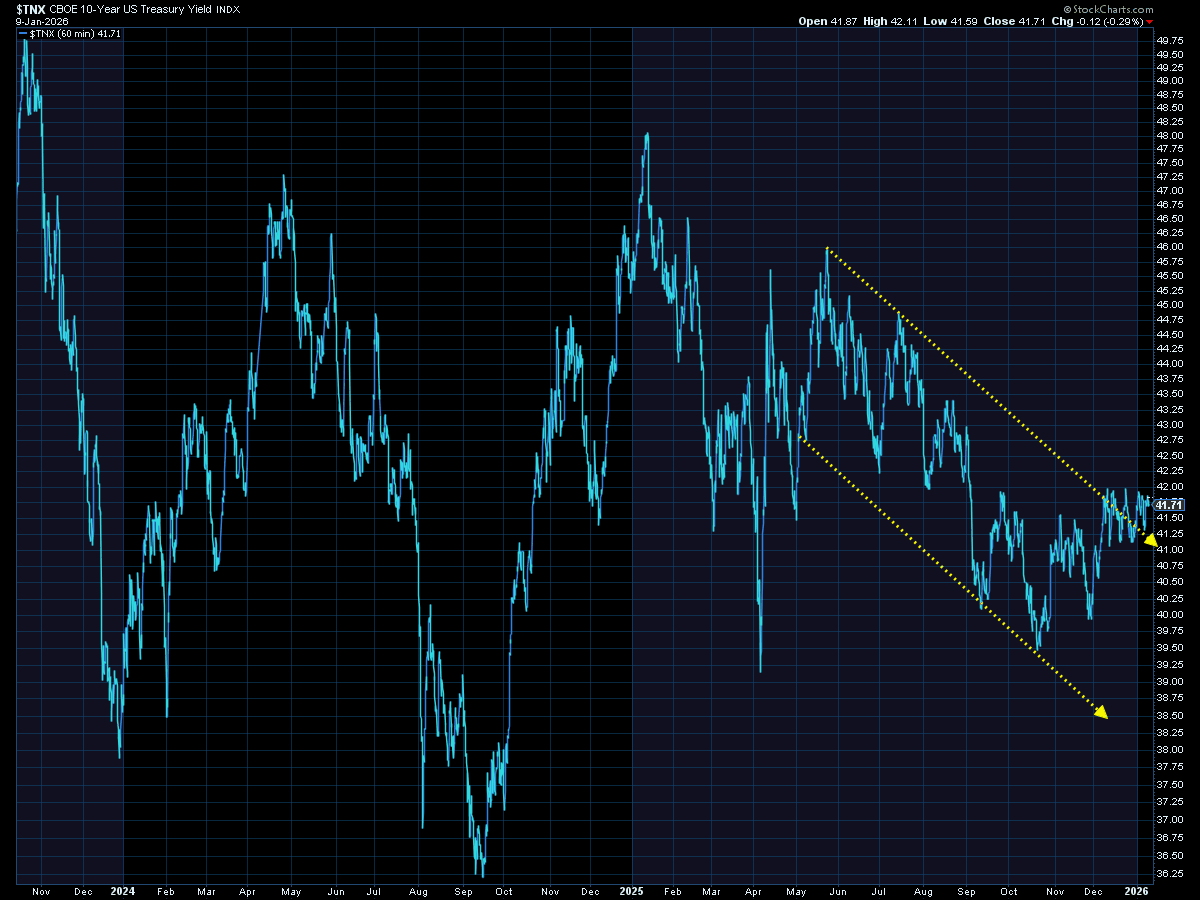
Speaking of banks, yields will remain in focus especially given the jobs data and the MBS Purchases announced last week. The news Sunday night about the DOJ opening an investigation into the Fed Chair could also put pressure on yields. Last week was interesting as shorter-term yields increased a bit, while longer-term yields declined slightly.
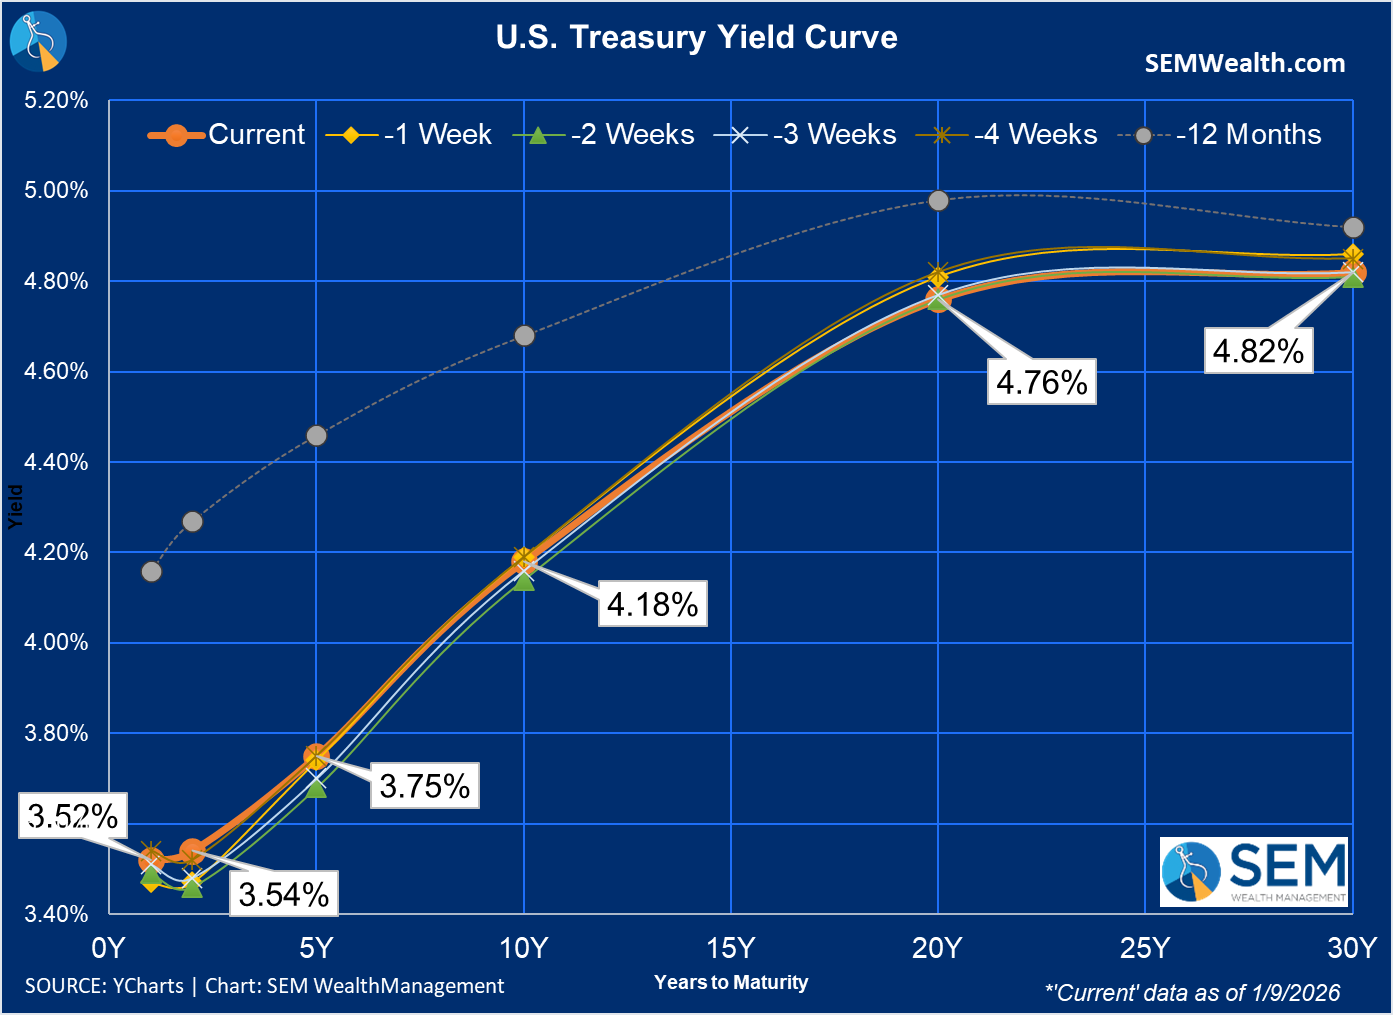
As we've been highlighting the past 5-6 weeks, the 10-year Treasury has broken its downtrend channel. It appears to be consolidating in the 4.1-4.2% range. Any move above that would be cause for alarm as it would indicate inflationary pressures, which will not only make the Fed's job harder, but also hit the lower half of the K.
SEM Market Positioning
| Model Style | Current Stance | Notes |
|---|---|---|
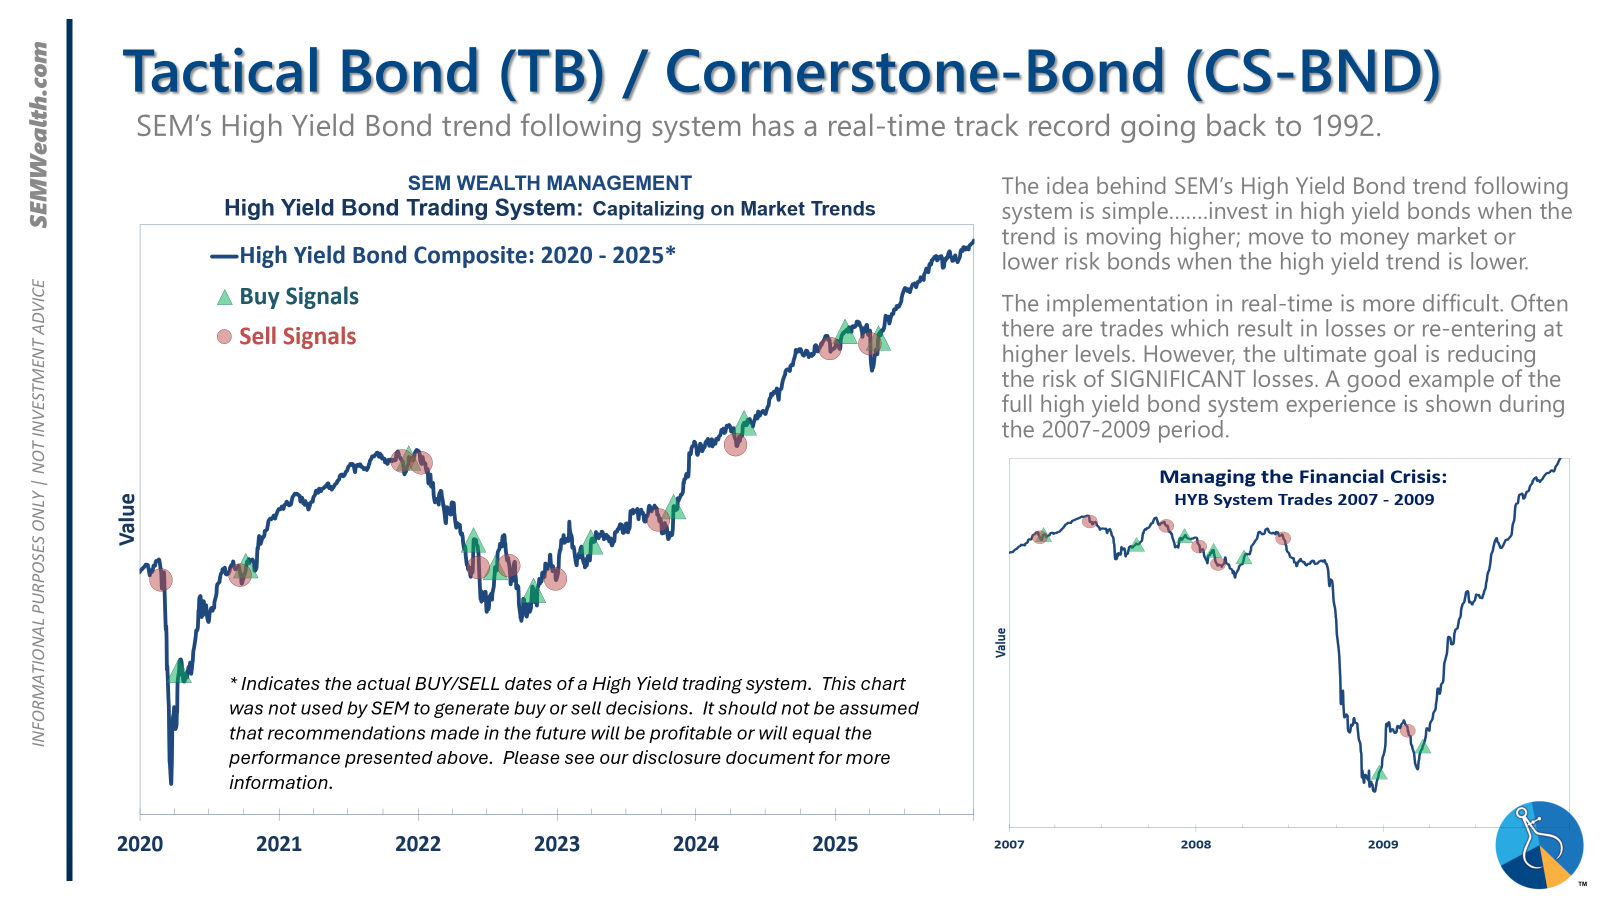
| Tactical | 100% high yield | High-yield spreads holding, but trend is slowing-watching closely |
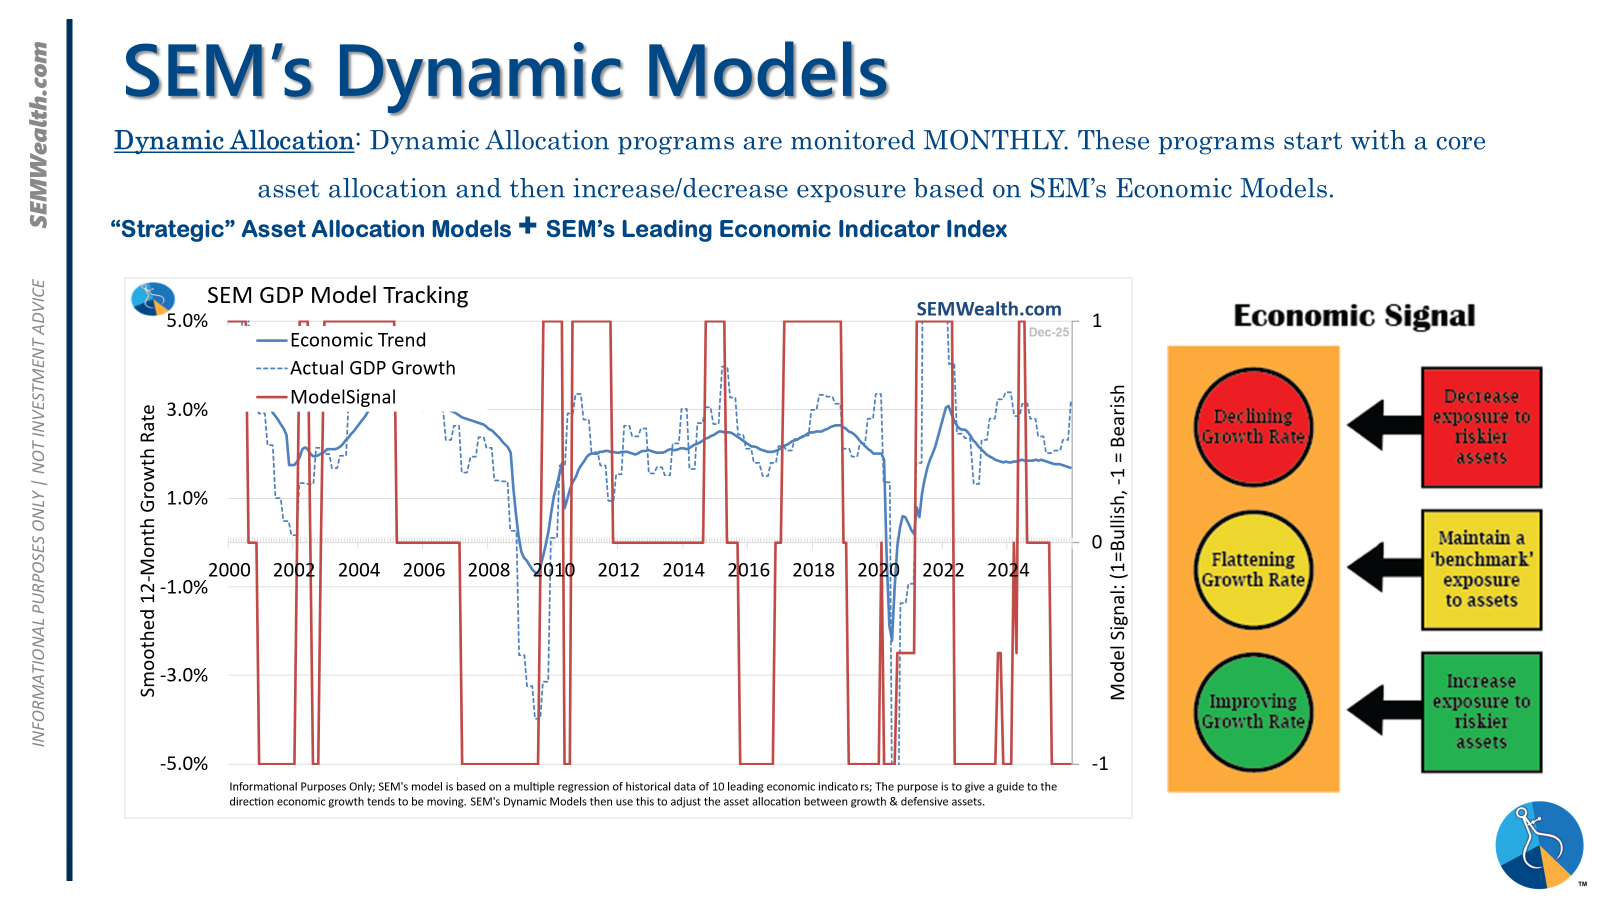
| Dynamic | Bearish | Economic model turned red June 30 '25' – leaning defensive |
| Strategic | Fully invested | Trend overlay shaved 10 % equity in April -- added back early July |
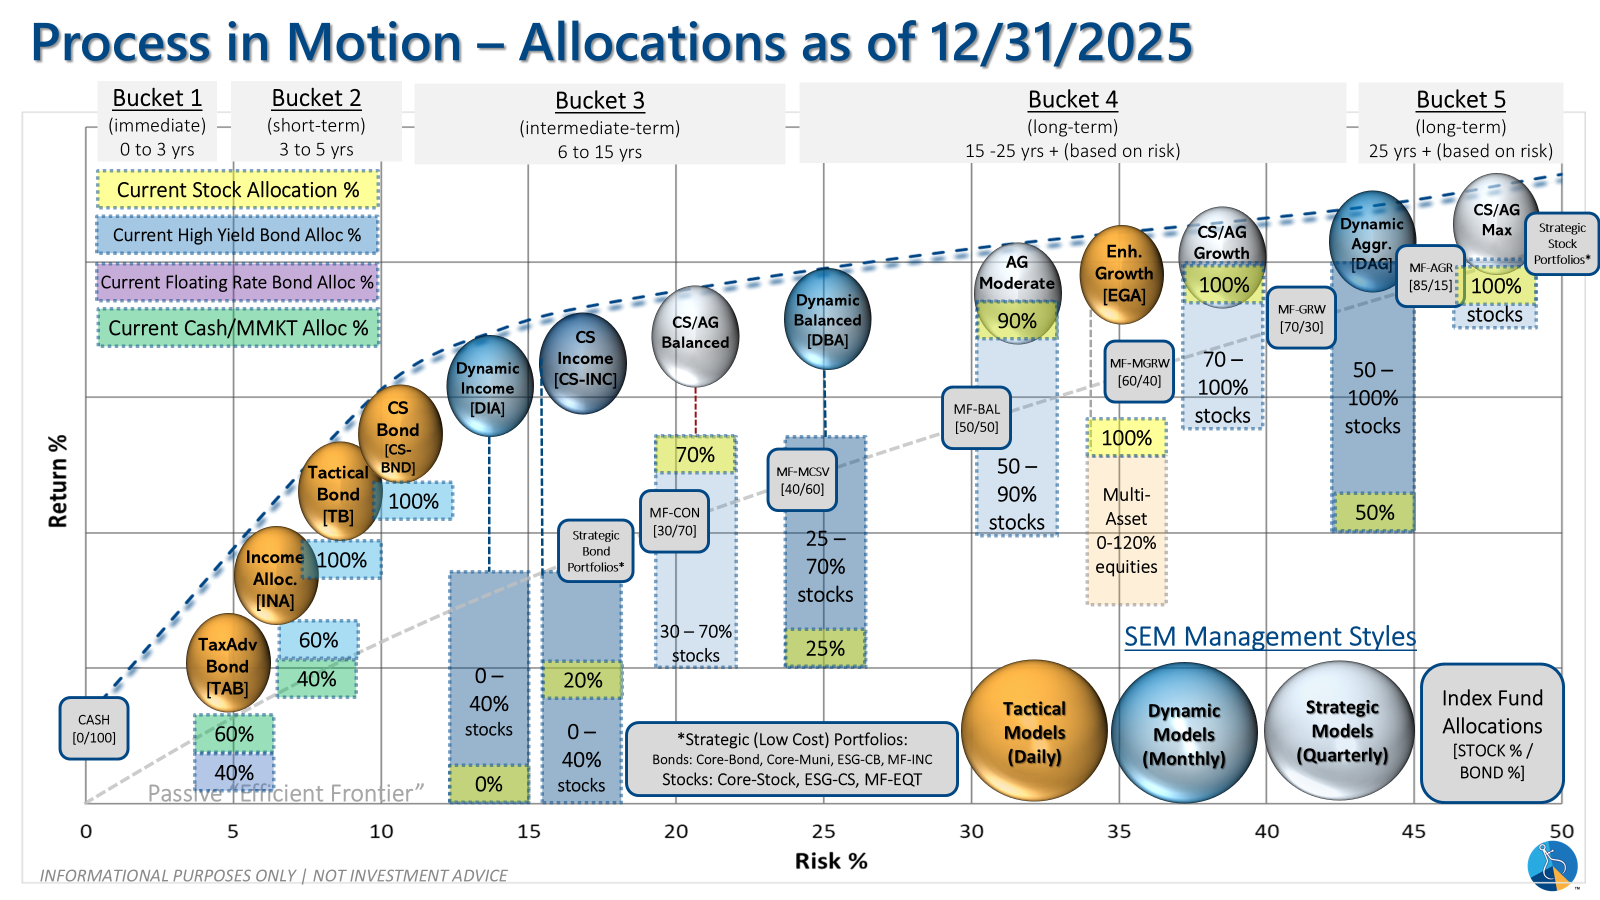
SEM deploys 3 distinct approaches – Tactical, Dynamic, and Strategic. These systems have been described as 'daily, monthly, quarterly' given how often they may make adjustments. Here is where they each stand.
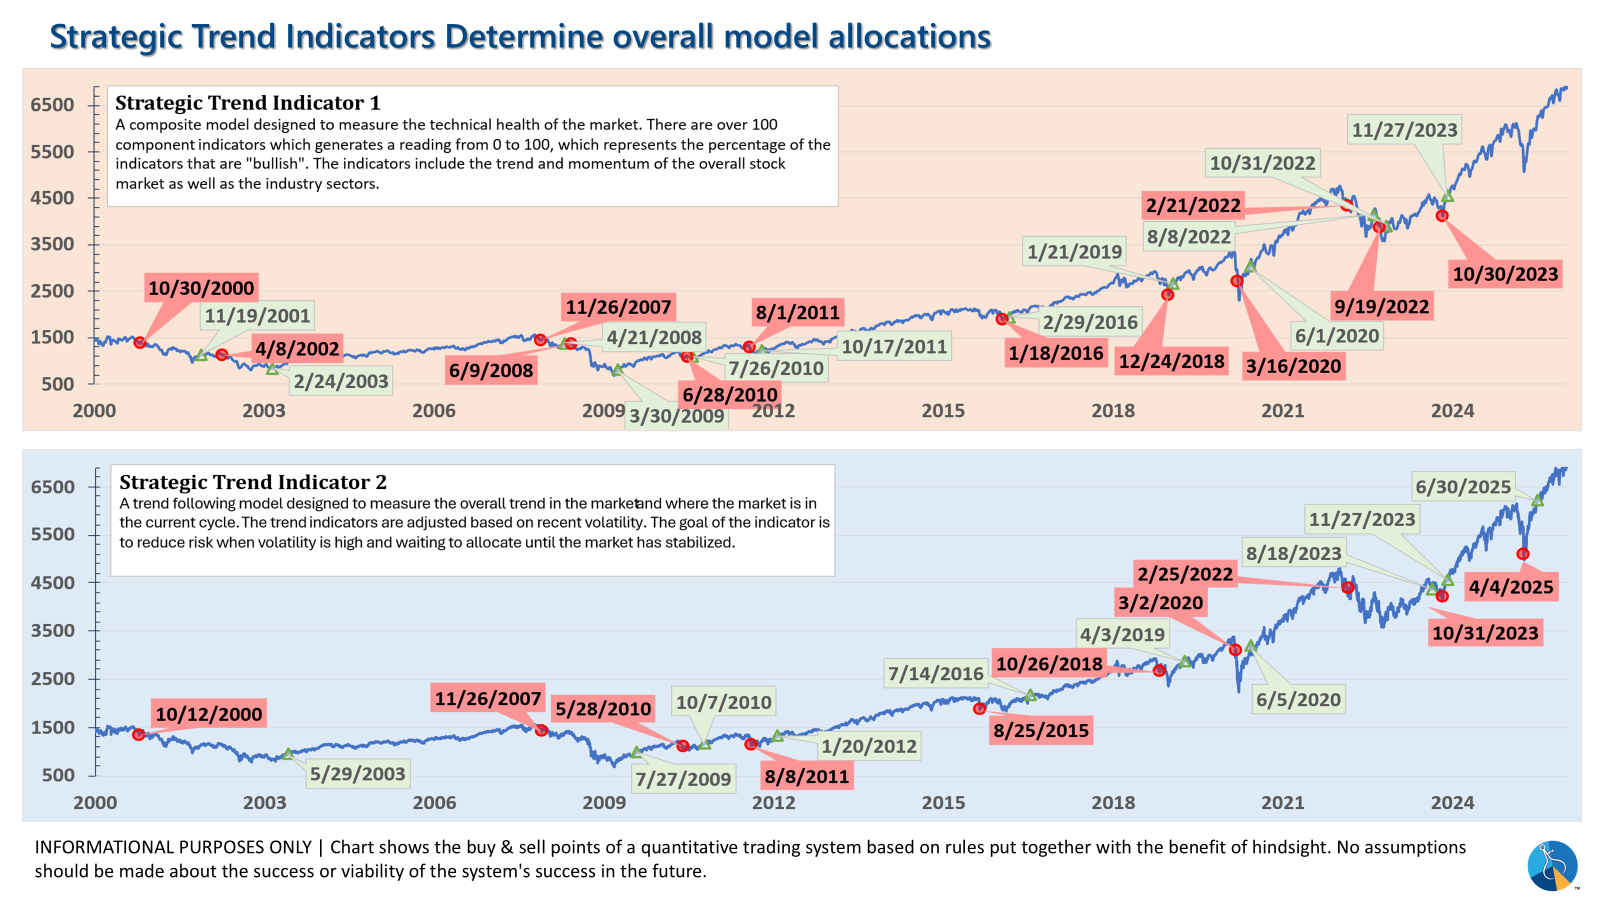
Tactical (daily): The high yield system has been invested since 4/23/25 after a short time out of the market following the sell signal on 4/3/25.
Dynamic (monthly): The economic model went 'bearish' in June 2025 after being 'neutral' for 11 months. This means eliminating risky assets – sell the 20% dividend stocks in Dynamic Income and the 20% small cap stocks in Dynamic Aggressive Growth. The interest rate model is 'bullish' meaning higher duration (Treasury Bond) investments for the bulk of the bonds.
Strategic (quarterly)*: One Trend System sold on 4/4/2025; Re-entered on 6/30/2025
The core rotation is adjusted quarterly. This quarter we saw half of our international positions reduced (we sold developed markets and kept our emerging markets exposure). We also saw the remaining share of mid-cap reduced in favor of more small cap exposure. We remain with a "barbell" core portfolio – about half in large cap and half in small cap as the models expect the market to "broaden".
The * in quarterly is for the trend models. These models are watched daily but they trade infrequently based on readings of where each believe we are in the cycle. The trend systems can be susceptible to "whipsaws" as we saw with the recent sell and buy signals at the end of October and November. The goal of the systems is to miss major downturns in the market. Risks are high when the market has been stampeding higher as it has for most of 2023. This means sometimes selling too soon. As we saw with the recent trade, the systems can quickly reverse if they are wrong.
Overall, this is how our various models stack up based on the last allocation change:
Curious if your current investment allocation aligns with your overall objectives and risk tolerance? Take our risk questionnaire


