
As the East Coast spent the week chipping away at layers of ice, markets were digging themselves out from a freeze of their own — a hard freeze of expectations. Big tech earnings, a no‑surprise Fed decision, and a new Fed chair nominee all hit at once, cracking the surface of what had looked like a steady start to earnings season. What followed was a melt‑and‑refreeze cycle across assets: precious metals spiked then shattered, mega caps swung sharply, and investors tried to find stable footing on increasingly slippery ground.
I debated how much (or little) to discuss from the events of last week. There are some much bigger picture issues that last week's moves amplified, but maybe the frozen temperatures are not allowing my brain to fully dissect them. I did find myself all week saying, "how can anyone say the market is efficient when we see tiny stories cause gigantic moves?" I think deep down even the most optimistic bulls have to believe the market is priced for a prefect outcome. That makes even the slightest question lead to overly sensitive reactions.
Here's a whittled down list of things that caught my attention last week:
Gold & Silver: A Melt‑Up, Then a Flash Freeze
Gold broke above 5,000/oz for the first time and silver hit record highs early in the week amid geopolitical tension and a continuation of the "run hot" stance we see out of Washington. On Friday, both snapped violently lower — silver plunged over 35% intraday and gold fell 11% following President Trump's announcement of his next Fed Chair (see more in story #2).
The 6 month chart shows the crazy run from gold and silver.
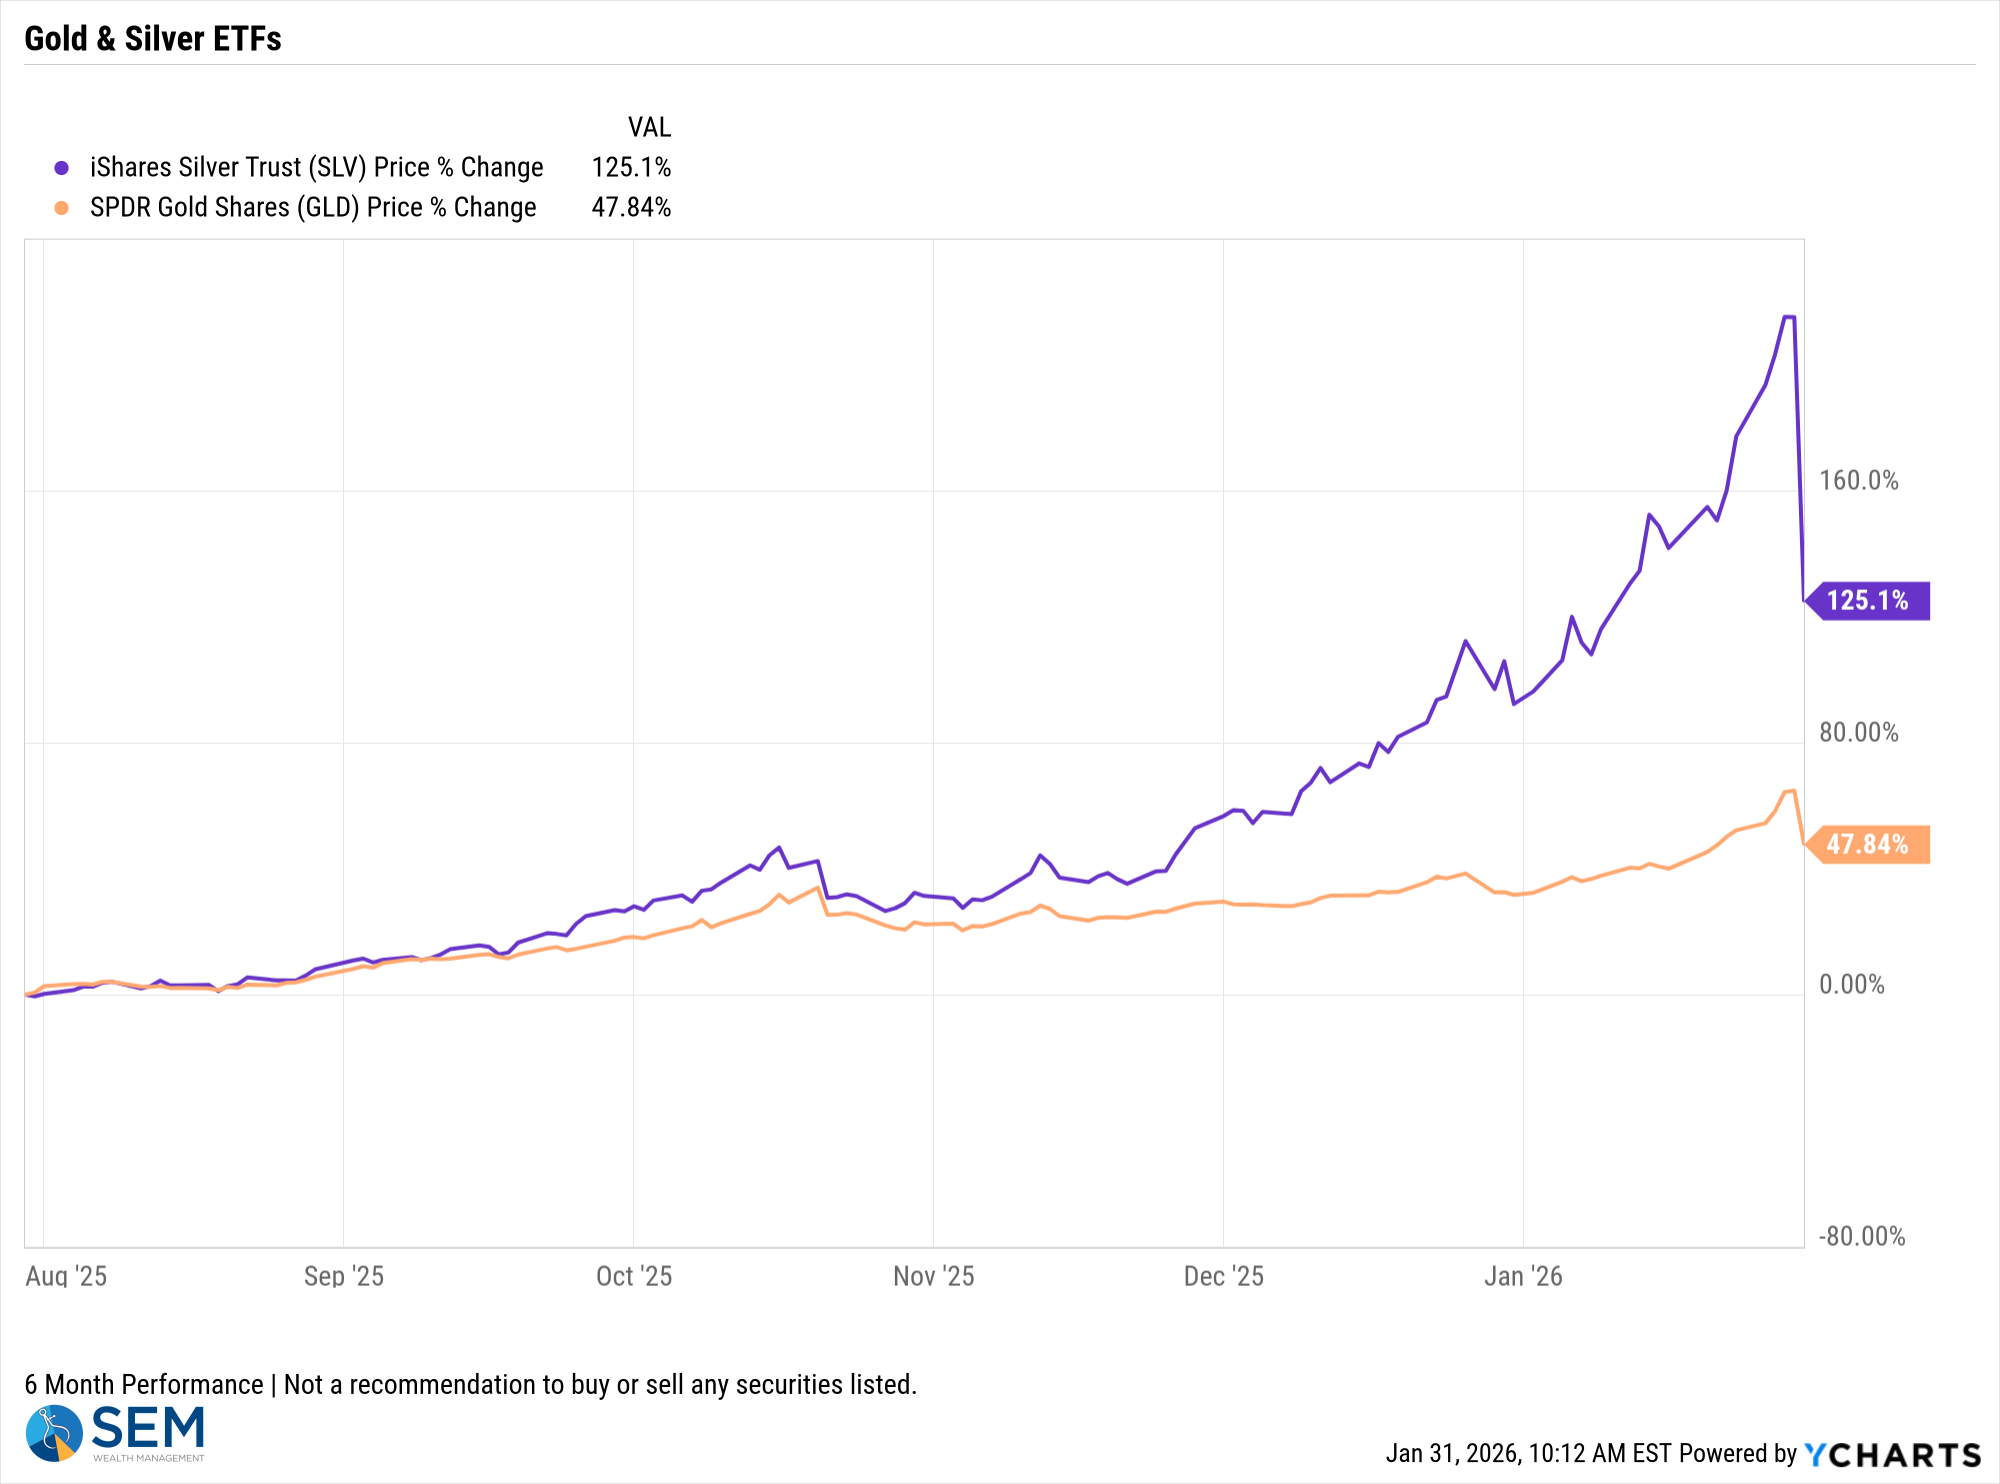
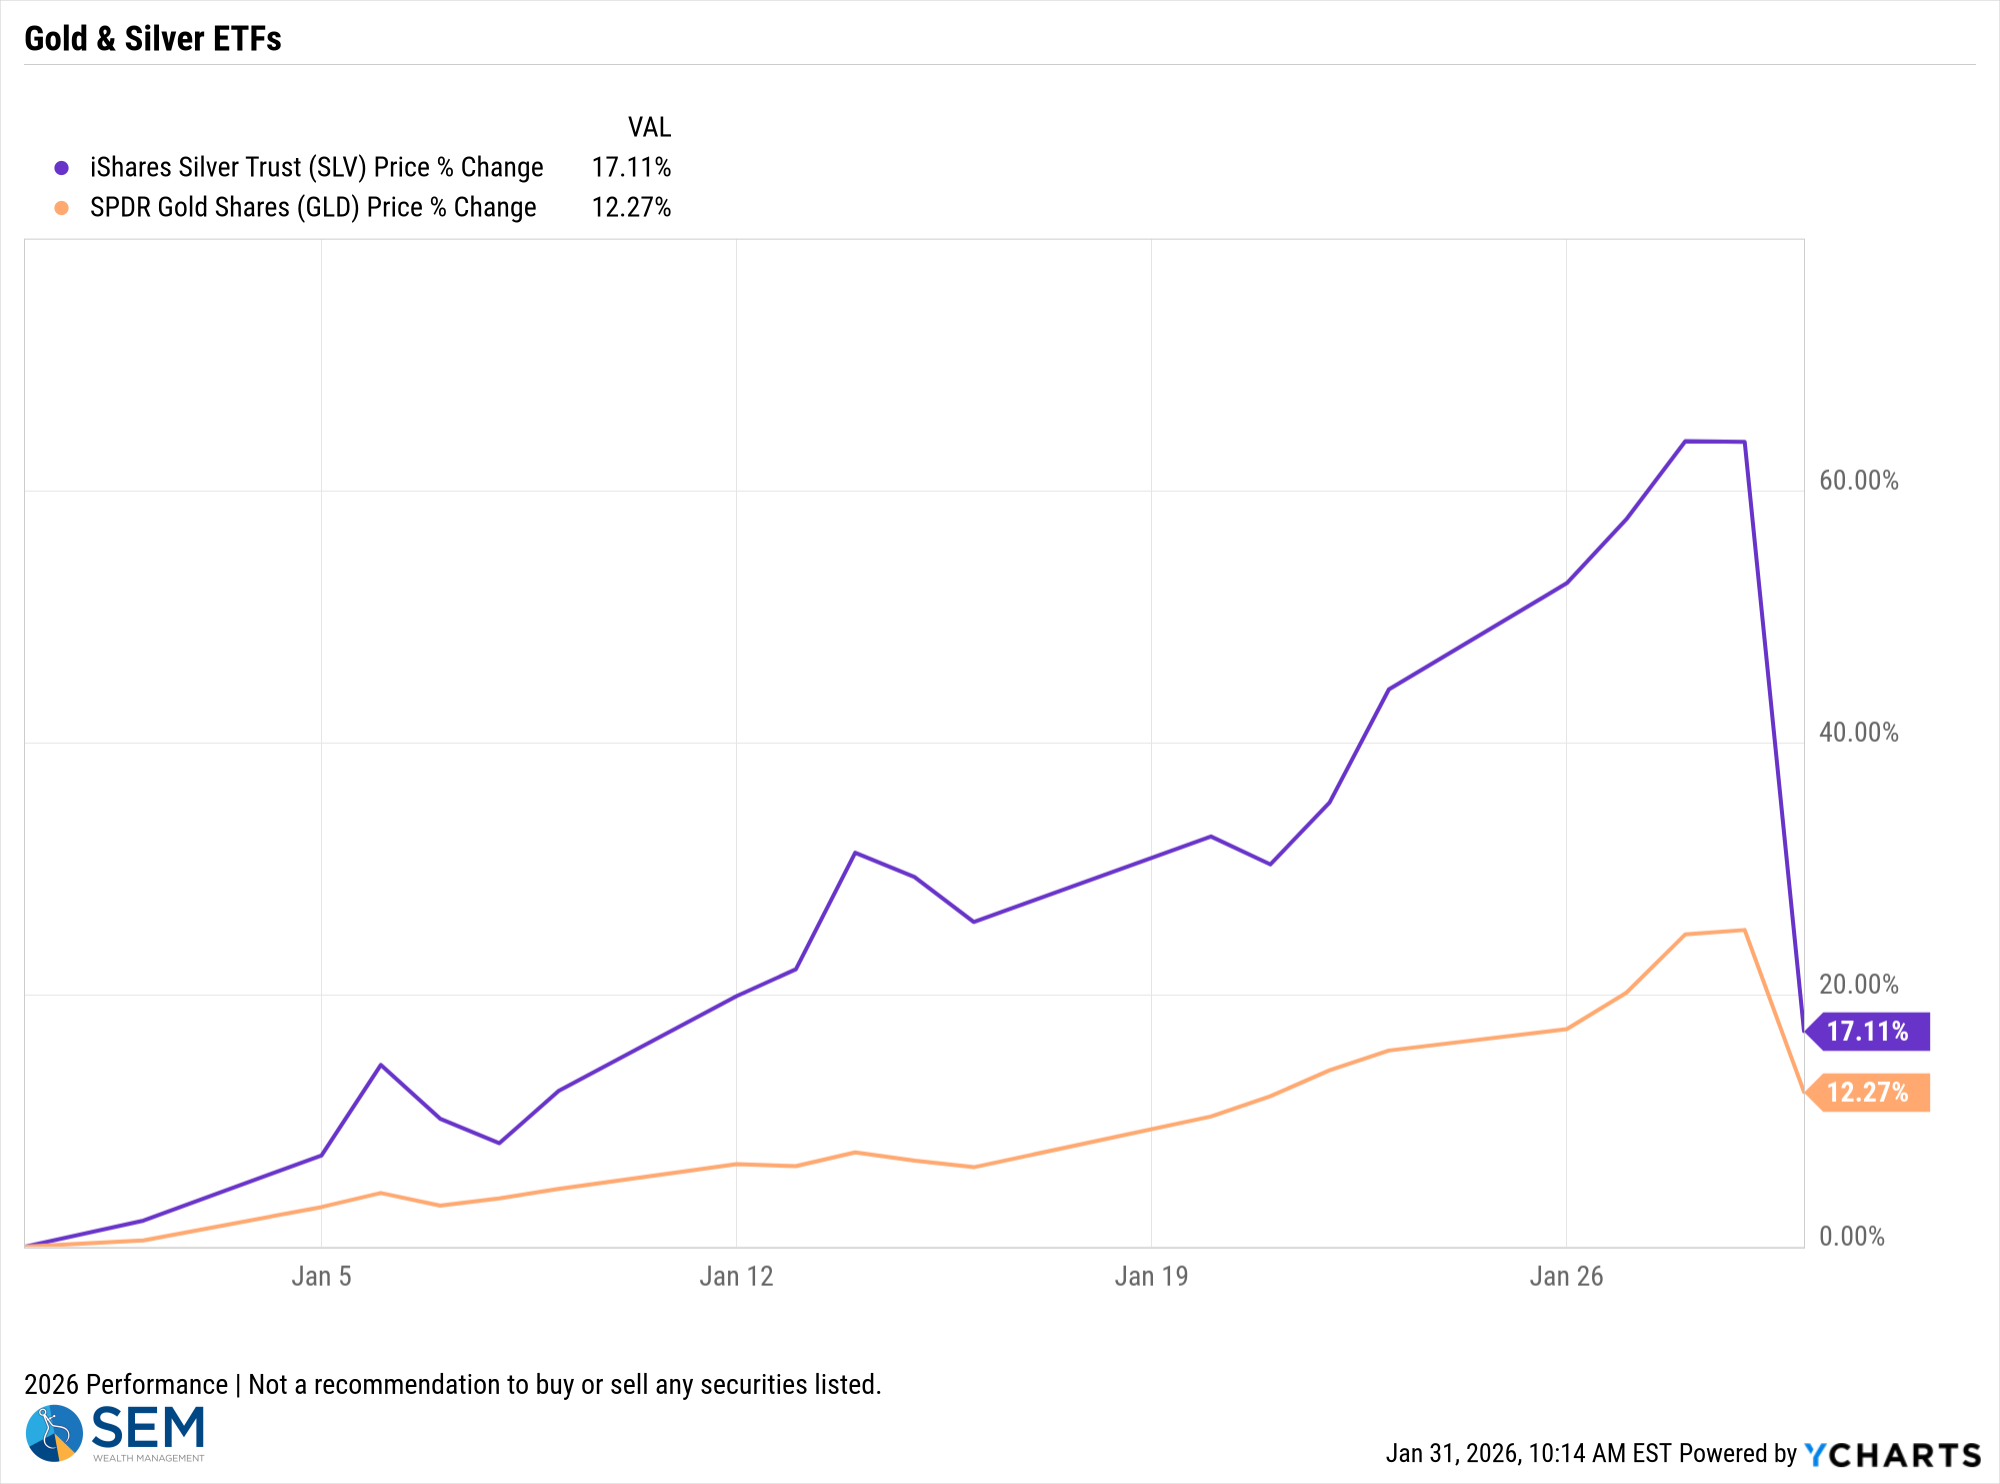
Even after the huge drop on Friday (SLV was down 27% & GLD was down 9%), both ETFs are still up nicely the first 4 weeks of the year.
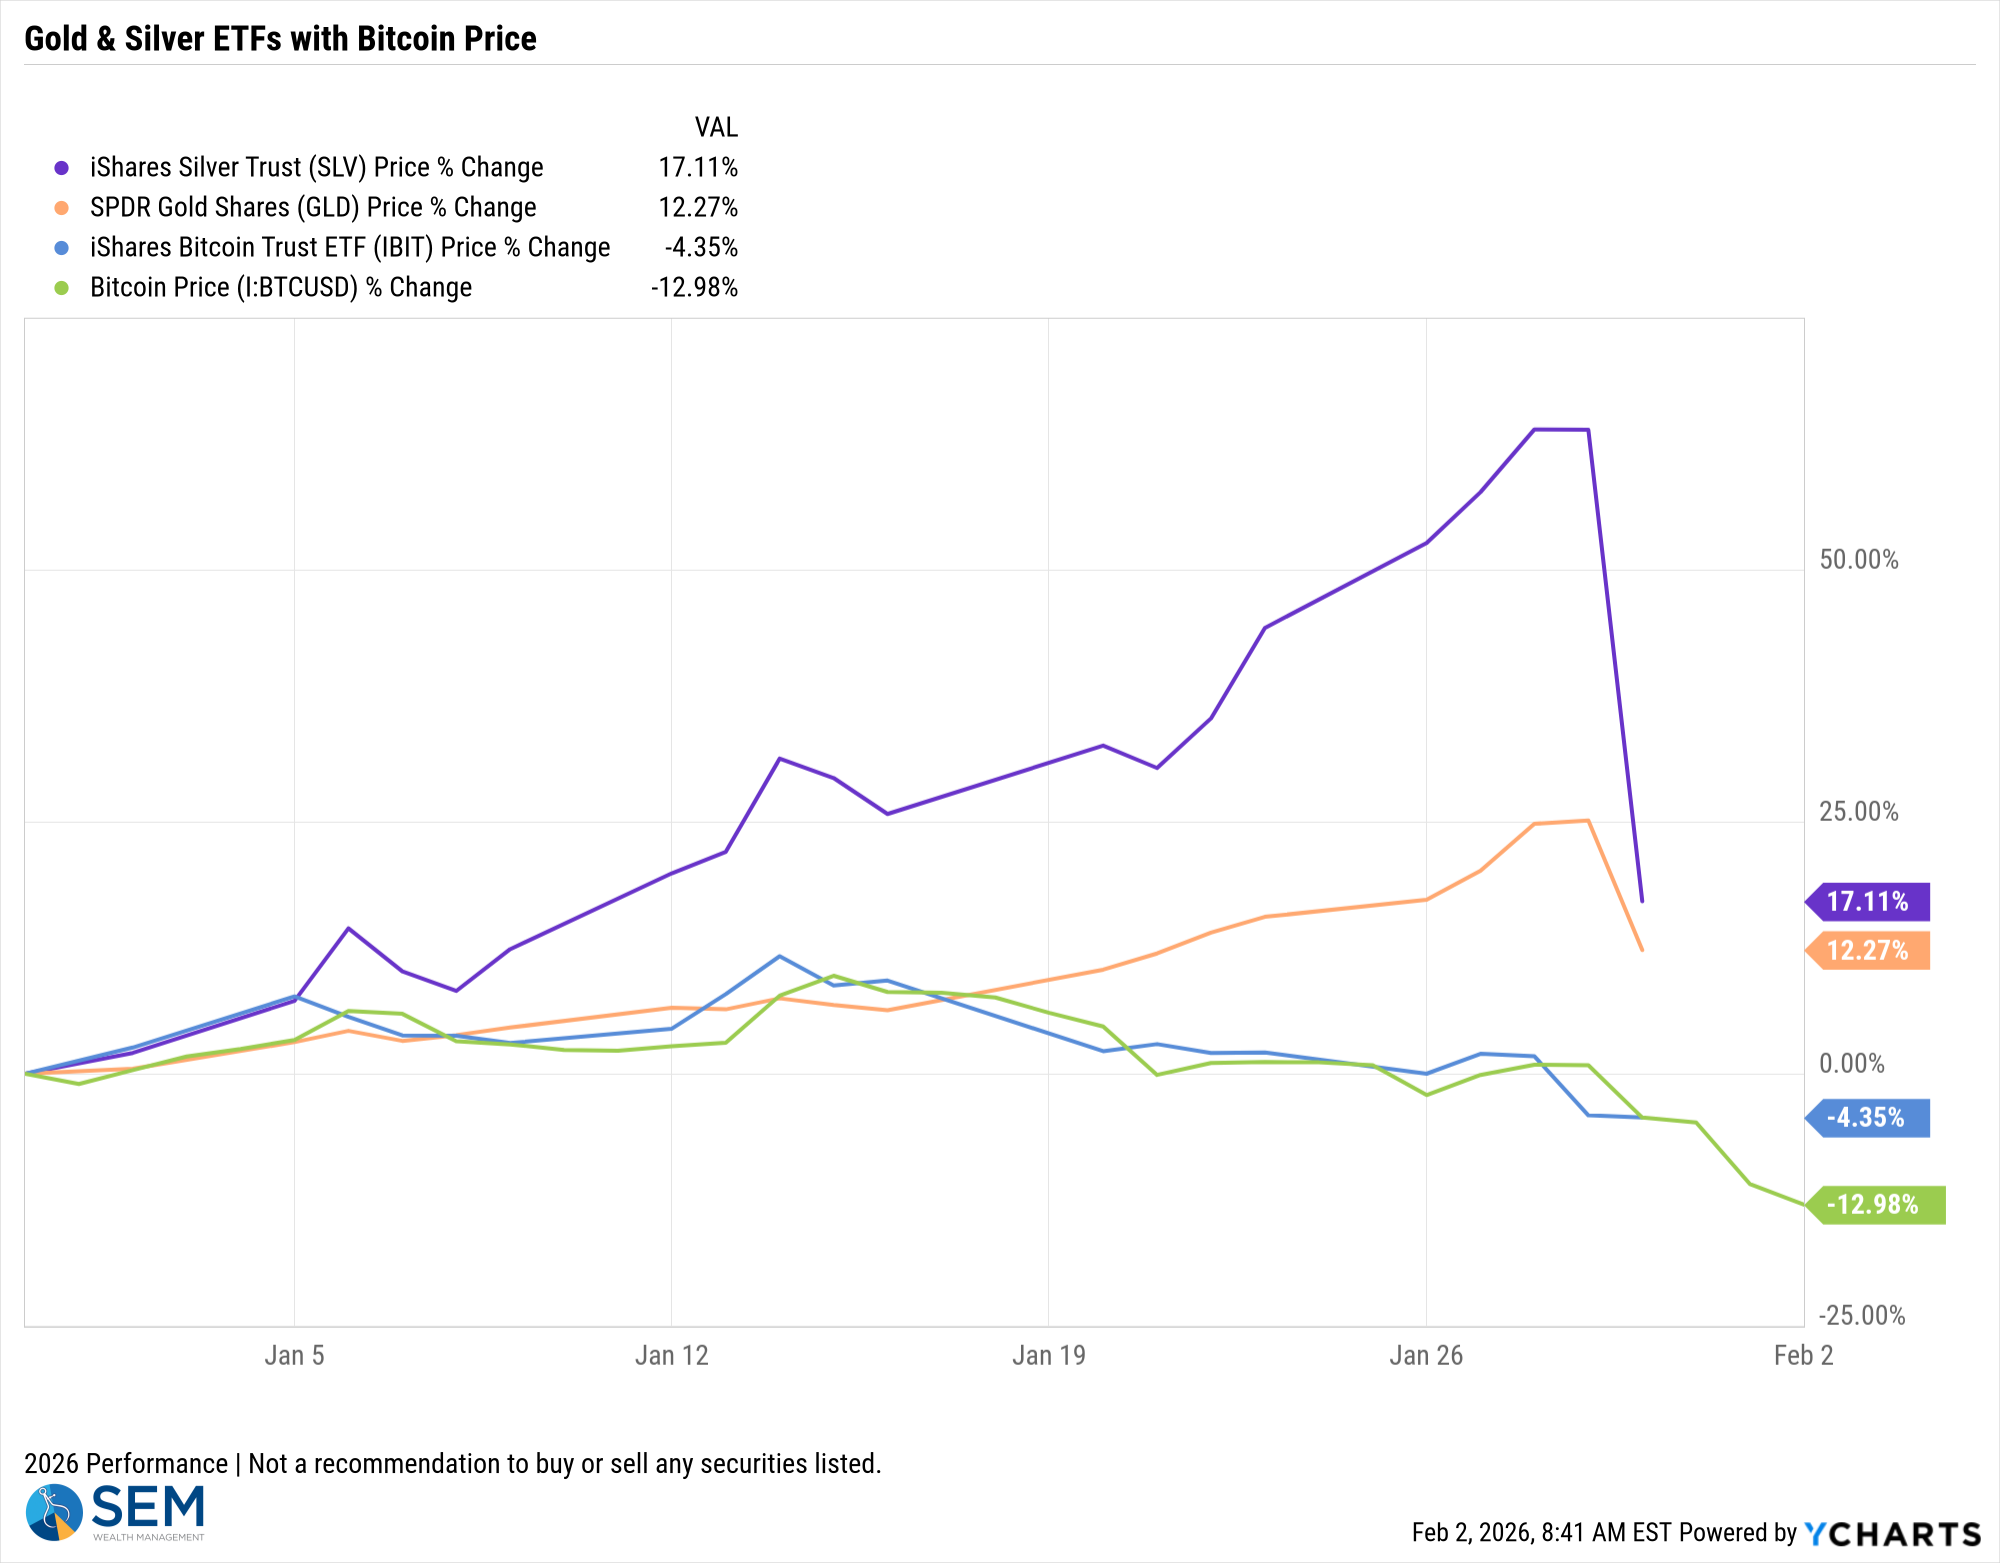
Bitcoin, which was supposed to be another way to hedge inflation risk has gone through a severe correction since breaking the $125,000 level in October. It is now down 33% from its high and all the way back to the lows of April of last year.
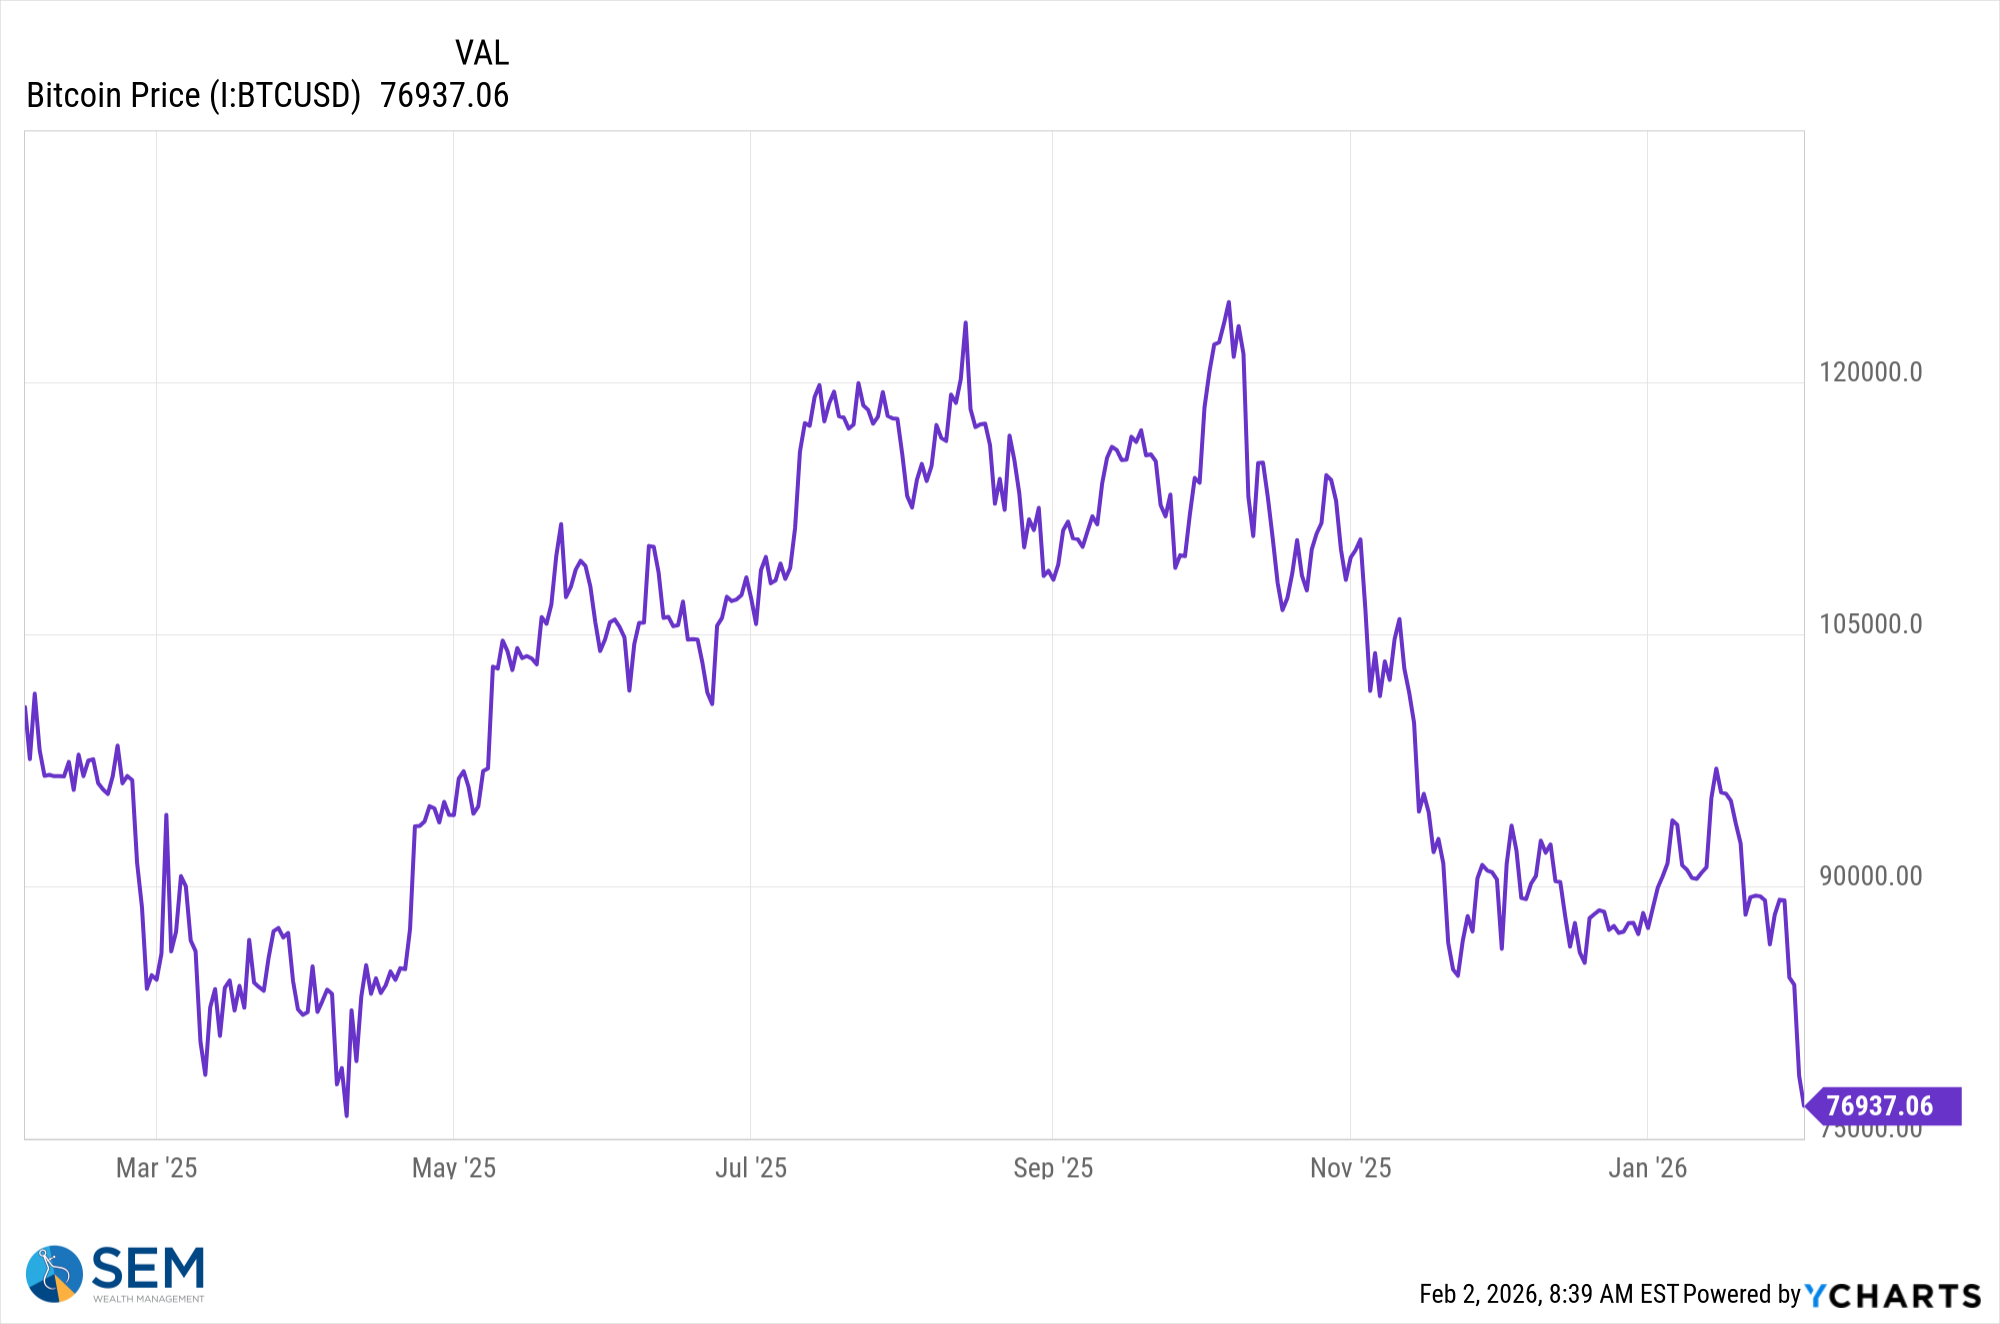
Bitcoin has recovered a bit this morning after a big drop on Saturday and Sunday.
The last few weeks I've been discussing the FUNDAMENTAL reason you MAY want to consider having Precious Metals exposure, especially Gold inside your portfolio.
1.) The K-Shaped economy where a large portion of our country has been left behind has led to "populism". This historically leads to "protectionism" (among many other things). This usually then leads to the dollar losing value (which is inflationary). The "among other things" items such as more business restrictions and higher taxes are also inflationary. Precious metals could be a hedge against that environment.
2.) The "run hot" economy that the Trump administration is pushing, which could include heavy influence on the Fed, stimulus checks (in the form of "tariff dividend checks"), unchecked spending (on things like defense/war) will likely lead to both higher inflation and downward pressure on the dollar.
3.) Our national debt and the lack of concern from either party about handling it. The "fiscally conservative" party that is in control of Congress and the White House is anything but fiscally conservative. How else do you explain a $1.8 Trillion projected budget deficit which is HIGHER than the party known for running high deficits? Social Security, Medicare, and Federal Government pensions currently represent 50% of our spending. They ARE NOT FUNDED by past payments, but instead are a PAY AS YOU GO entitlement. Nobody dares address this because they know the people receiving the funds will not vote for them. Higher debt loads leads to more risk, which leads to higher inflation.
Does the nomination of Kevin Warsh change the FUNDAMENTALs of any of the above? I would say no. The K-Shaped economy will continue to get worse, Mr. Warsh himself is an advocate of dropping interest rates by another 100 basis points (cementing the 'run hot' economy), and the national debt will continue to be an increasing problem. Is the drop on Friday a buying opportunity? That's a much harder question, especially with silver, which had all the traits of a 'mania' bubble similar to what we've seen in the past with various crypto-currencies and "meme" stocks.
The Fed: No Cut, New Chair, Questionable Impact
In his 3rd to last meeting as Fed Chair, Jerome Powell and the Fed held rates steady. This wasn't really a surprise as the labor market is still (technically) adding jobs and the drop in the inflation rate appears to be slowing (if not reversing up.) The real surprise came on Friday with President Trump’s plan to nominate Kevin Warsh as the next Fed Chair. Mr. Warsh's position on rate cuts has been clear – he believes rates should be much lower, but it is his past stance on Quantitative Easing and the Fed's Balance sheet that apparently worries those who thought he was a rubber stamp on "easy" Fed policies.
Chair Powell announced late last year the Fed was going to not only stop the "run-off" of their balance sheet assets, but also would see it start to increase. Mr. Warsh has for years criticized the large Fed Balance Sheet. It is far too early in the process to know what that means for future Fed policies, but for whatever reason the market made some very quick assumptions.
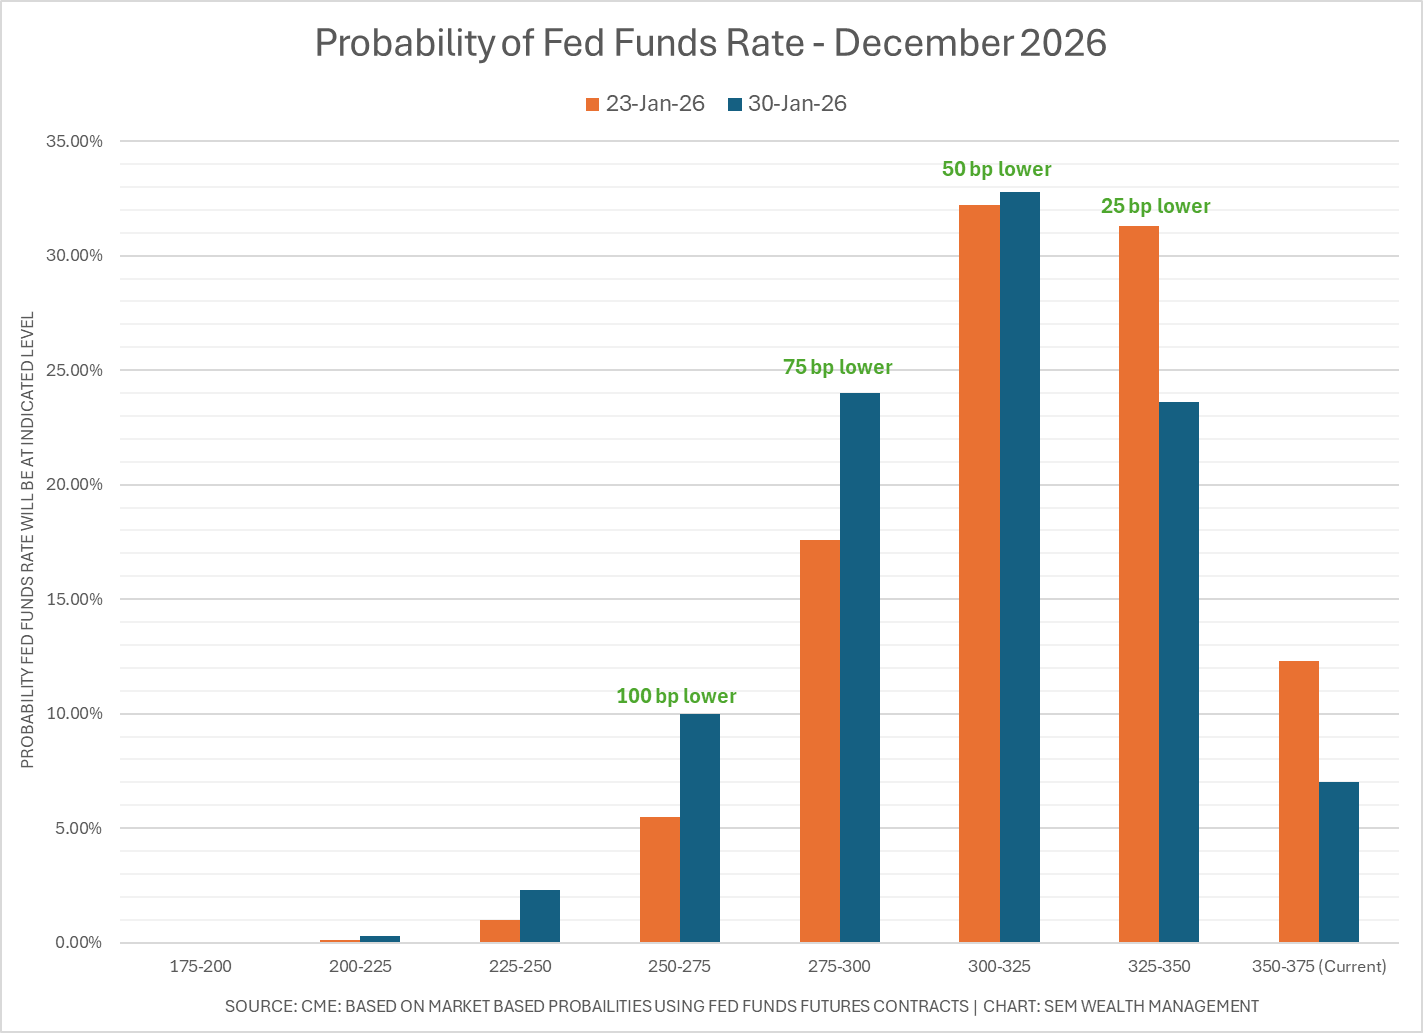
Interestingly enough, despite the collapse in silver and gold on this news, the market now sees an INCREASED probability of the Fed Funds rate being 0.75% to 1% LOWER (or more) by this December (which would add to the "run hot" trade.)
Tech Earnings: Nobody knows what they want
Pleasing the market, especially in the midst of a "new era" (bubble) is never easy. Last week was a perfect example:
- Microsoft beat expectations on revenue earnings, but Azure growth "slowed" to 39% and margin guidance disappointed. Investors reacted sharply — the stock was down over 12% as concerns around AI‑related spending overshadowed the very strong earnings report.
- Meta delivered a solid earnings beat, with revenue up 24% over the last 12 months, powered by strong ad impressions and higher pricing. Shares surged over 10%, making Meta the week’s standout mega‑cap performer.
- Apple reported stronger‑than‑expected Q1 results, driven by a "shockingly high" surge in iPhone sales. The stock was up as much as 3% and held up better than the rest of the market on Friday.
These reports as well as last week's other tech earnings is a prime example of how the market shifts in their expectations. Last quarter both Meta and Apple suffered as the market became concerned about the massive amount of spending on "AI" both firms were showing while falling "behind" everyone else. Microsoft rallied last quarter, but now a 39% growth rate is "too slow". I'm not making recommendations on any of these companies, but it is another reminder of how difficult it is to pick the "winners" in an evolving industry.
Over the past 3 months, the S&P 500 is up 2%. The performance of the big name "AI" stocks has been all over the map.
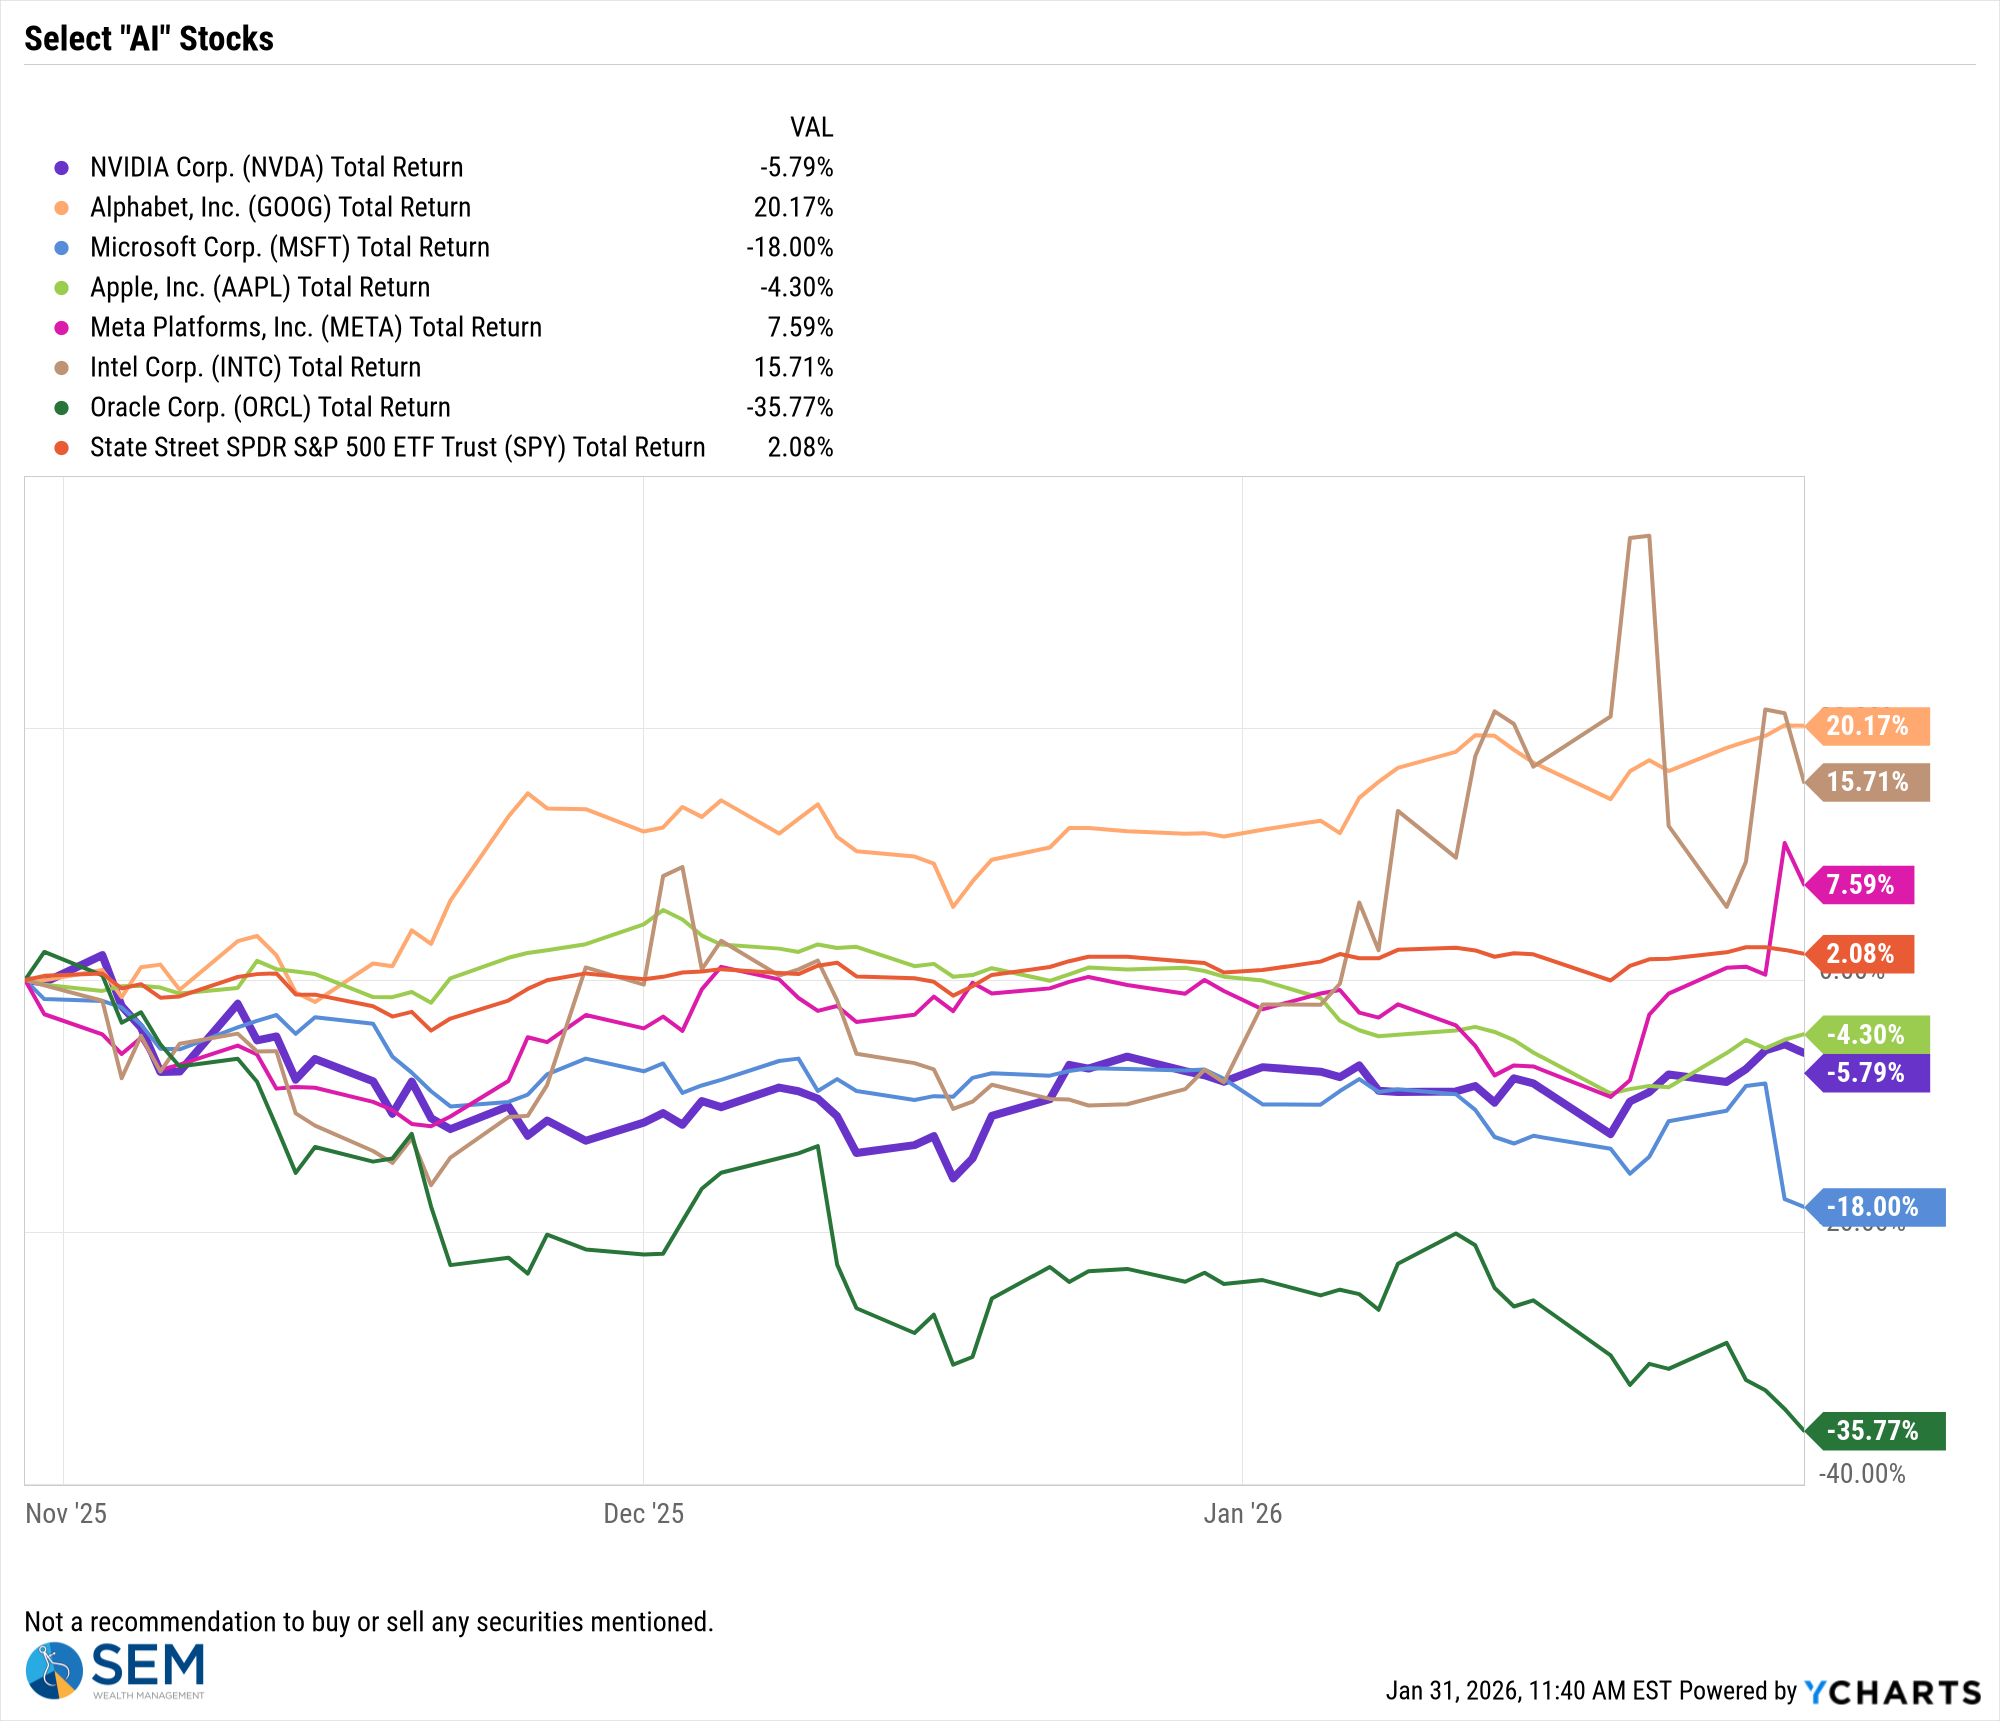
It's important to remember the market has a very short memory. This week's "leaders" can be next month's "laggard".
Market Charts
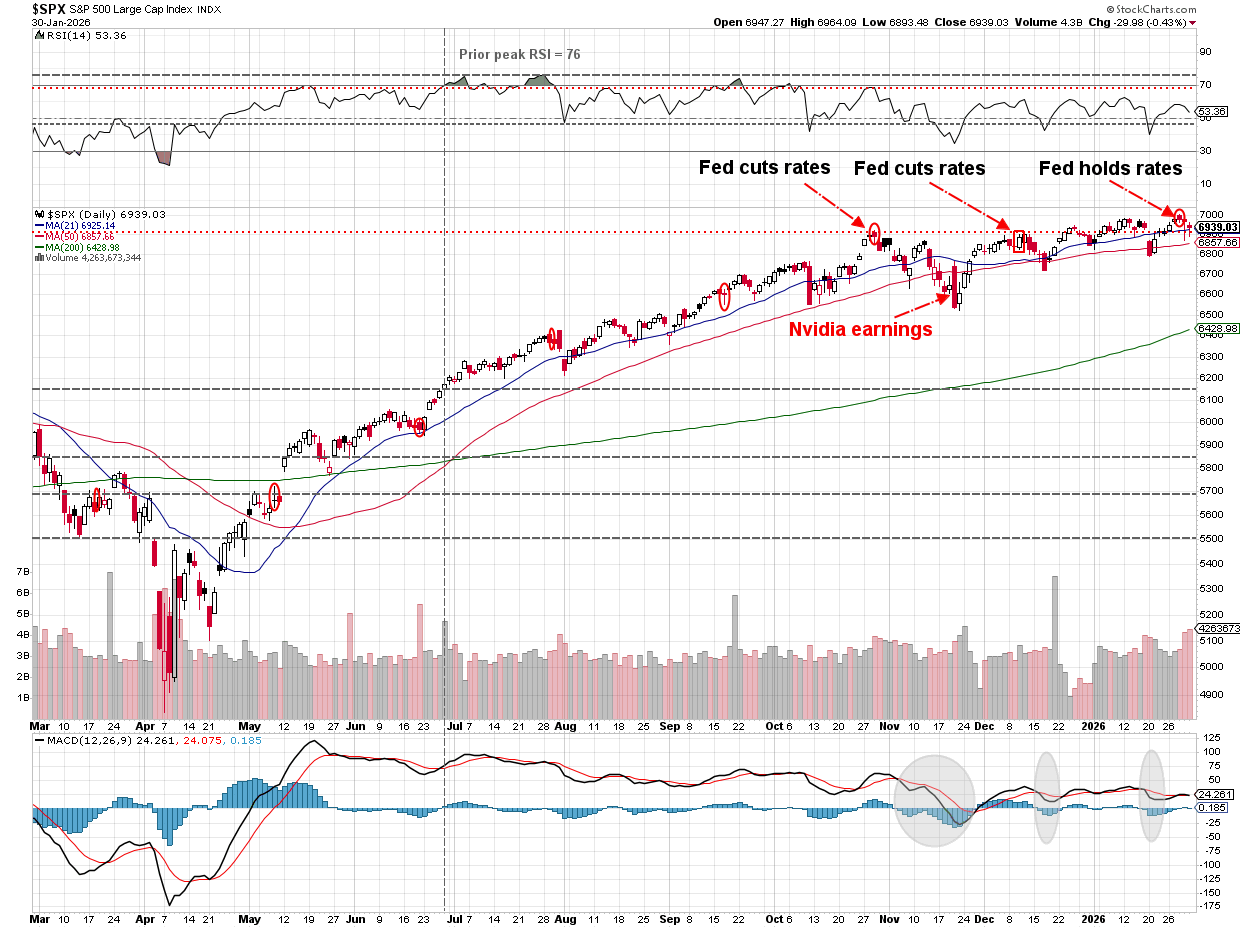
It was technically a winning week for the S&P 500, but the market continues to see big swings back and forth in terms of leadership.
The S&P has oscillated between 6800 and 7000 all year.
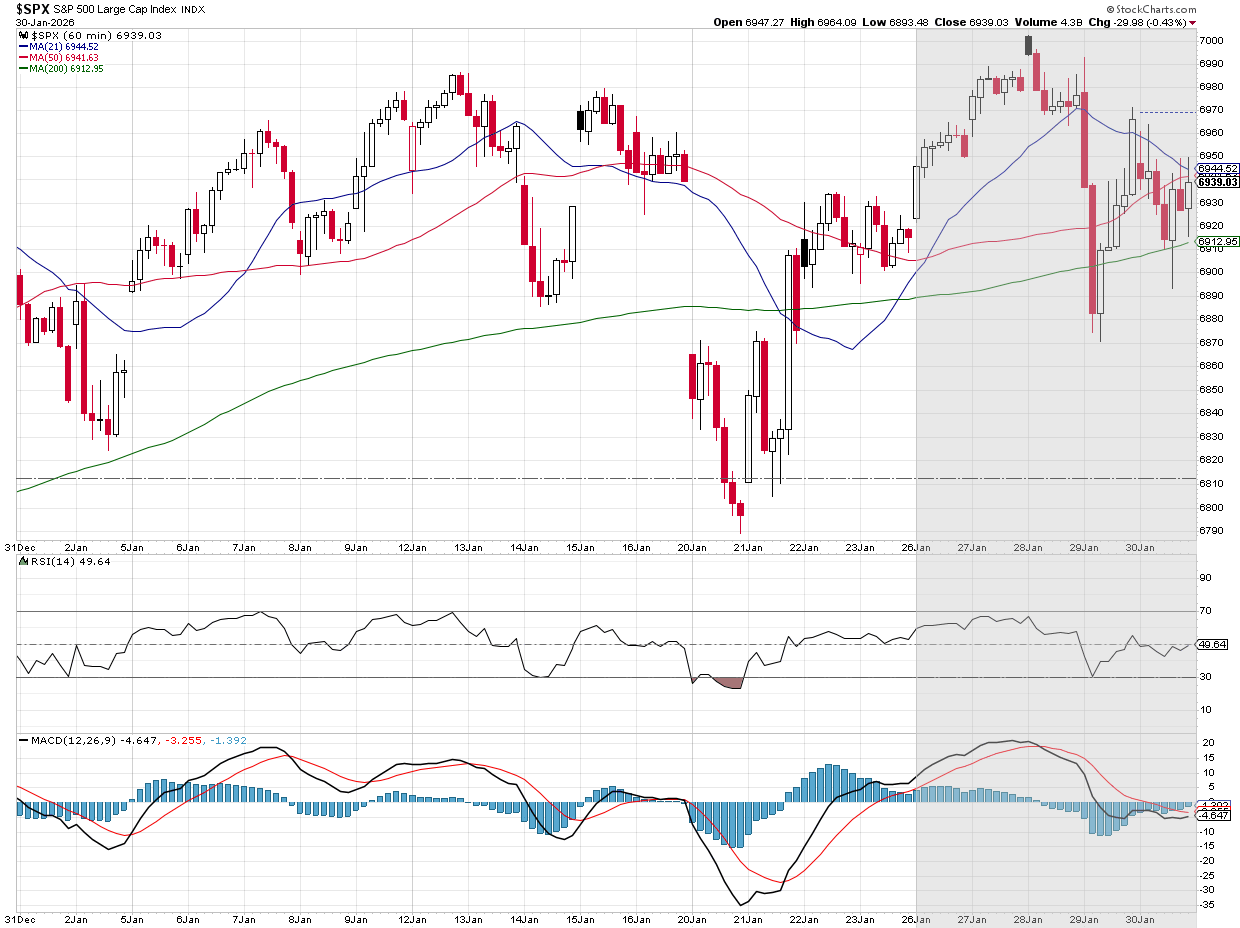
The market finally had broken out above the barrier where it had stopped going up following the last two Fed meetings. Following the meeting, we are right back to where we were the prior two meetings.
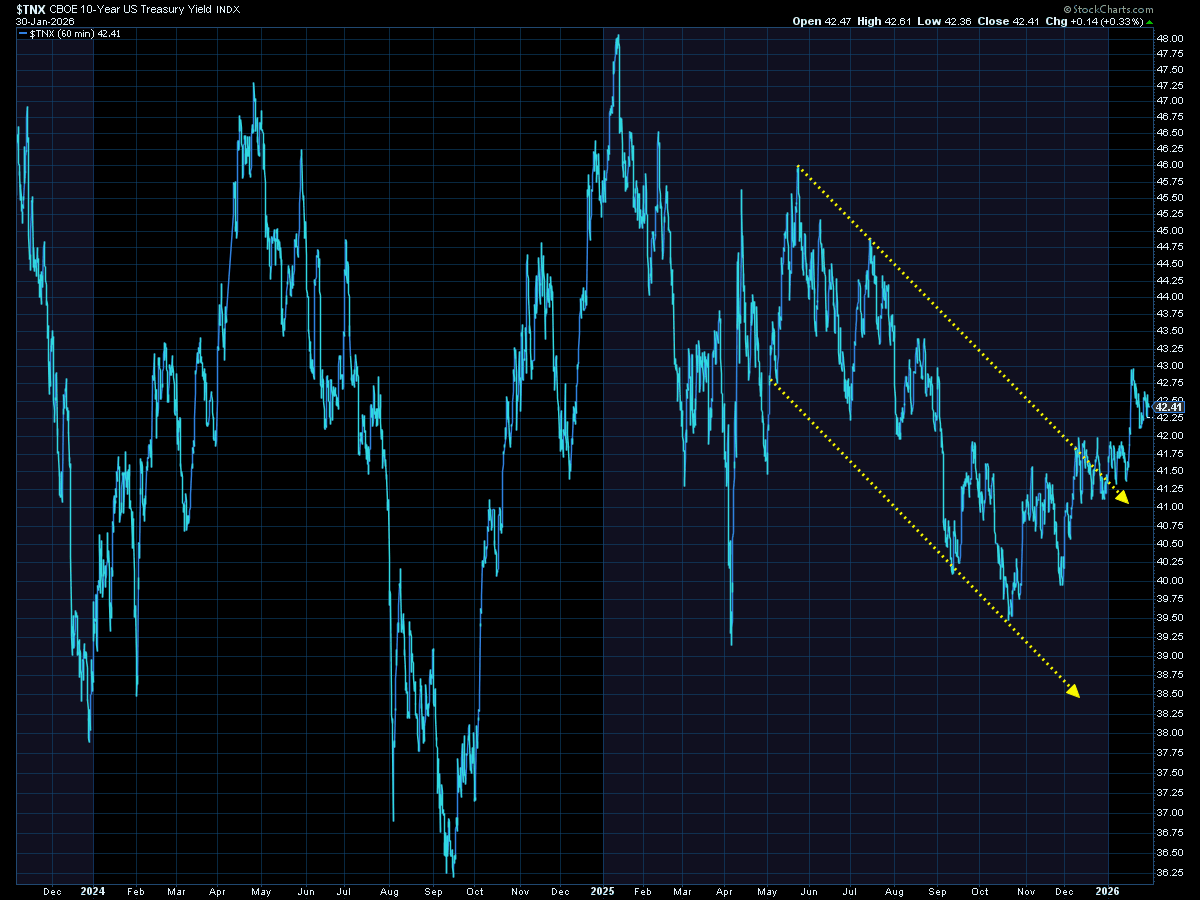
Yields on the 10-year bond were up again last week and continue to consolidate after breaking the 6-month downtrend channel in late 2025.
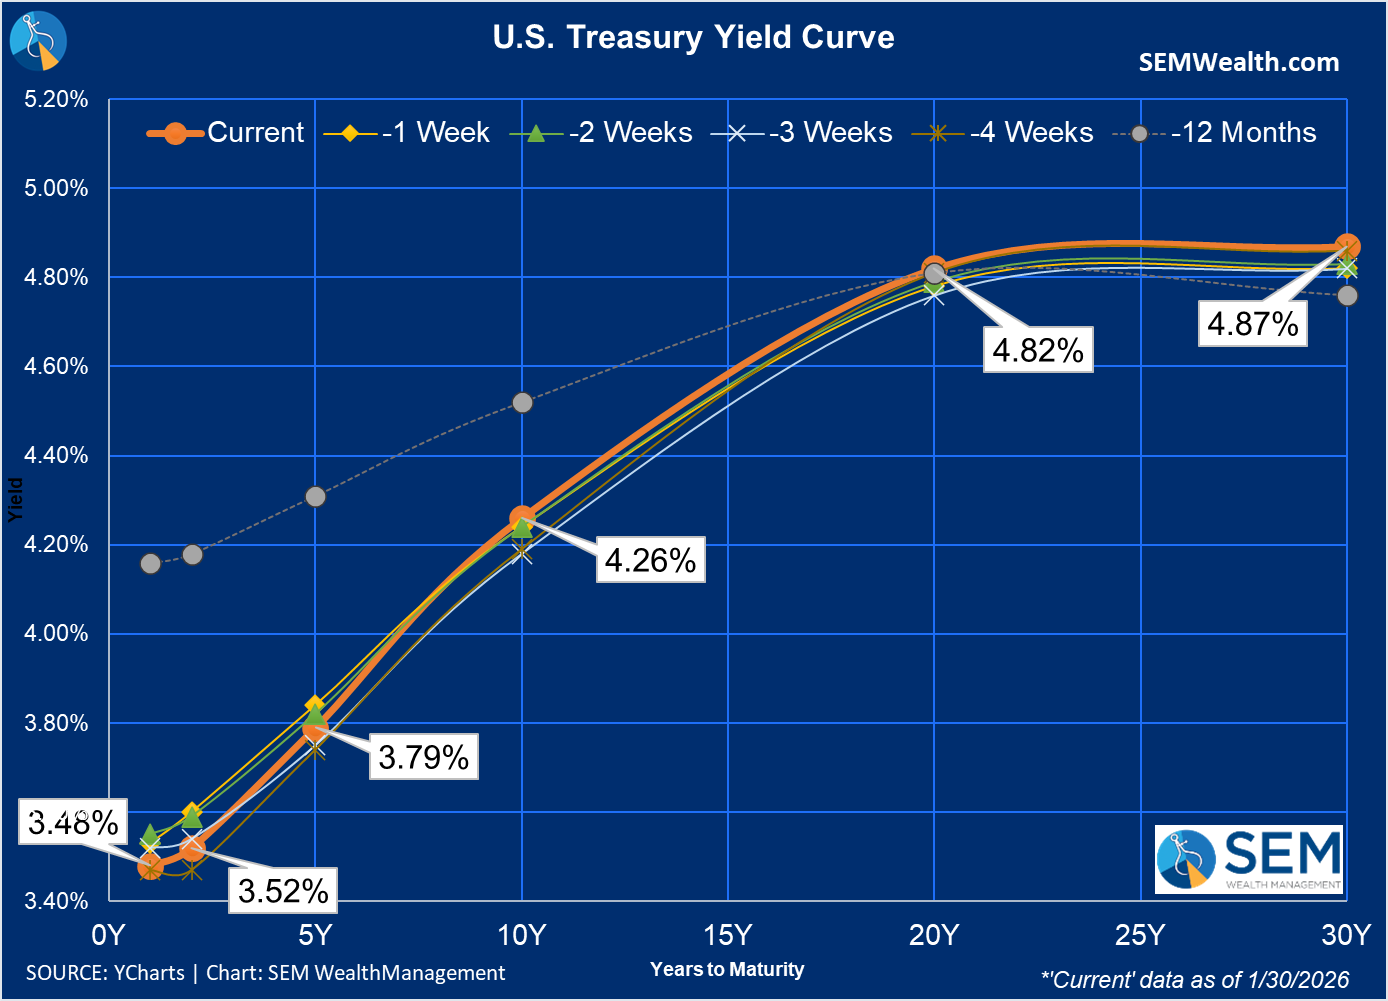
Looking at the yield curve, the assessment from the bond market last week seems to be the Fed meeting and the President's choice of Kevin Warsh (for now) seems to be "lower short-term rates, higher long-term rates" as the yield curve again steepened a bit last week.
We will see what next week brings!
SEM Market Positioning
| Model Style | Current Stance | Notes |
|---|---|---|
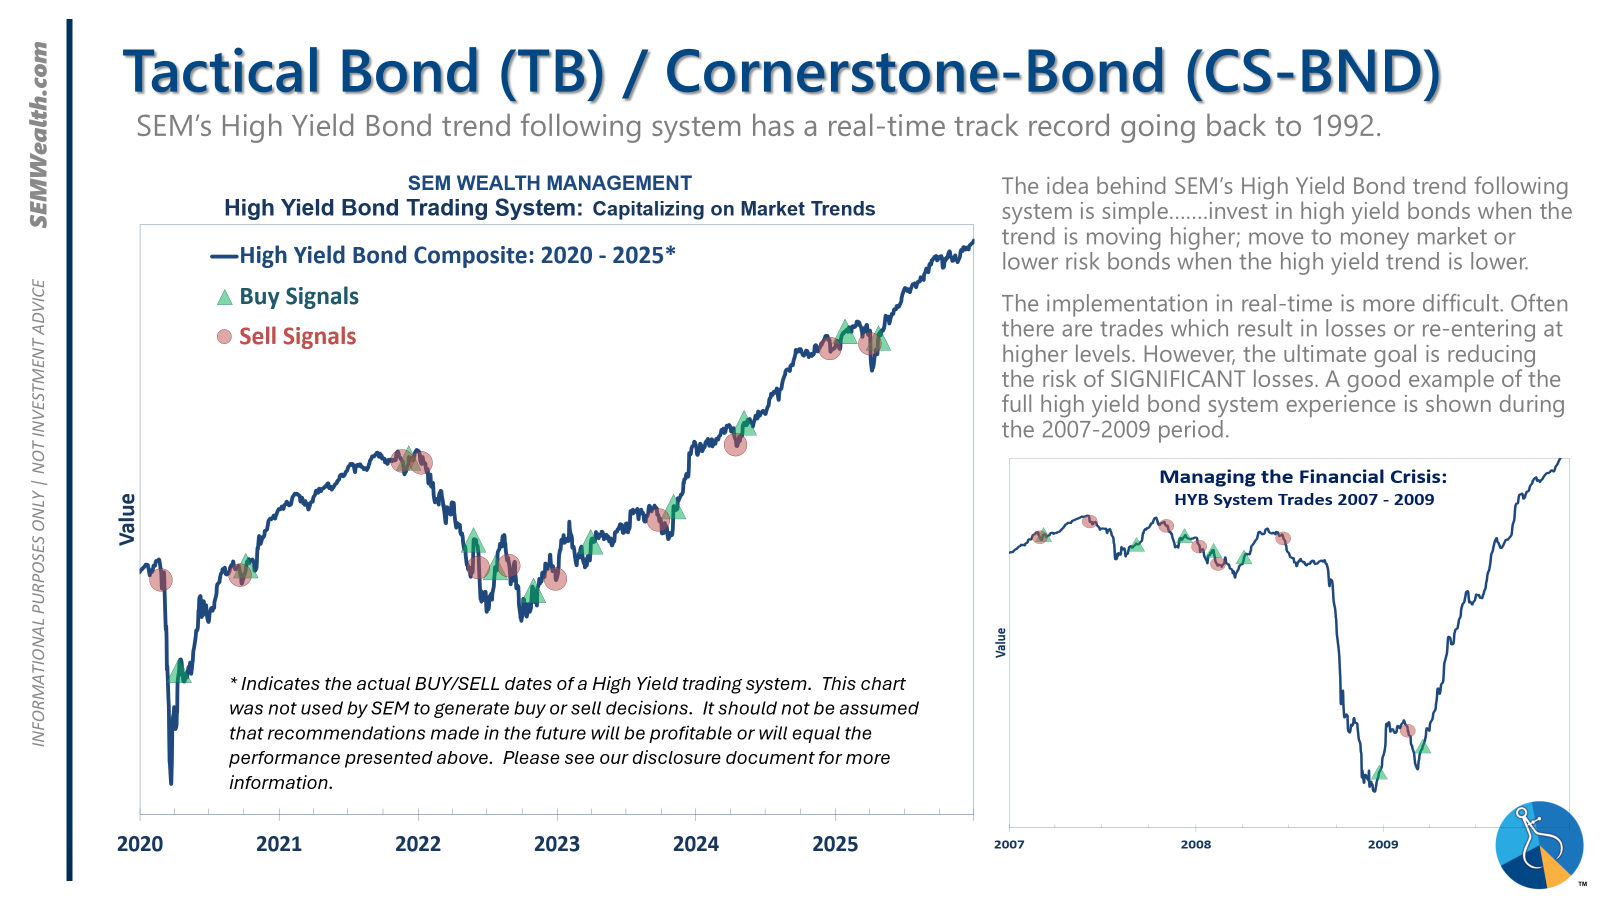
| Tactical | 100% high yield | High-yield spreads holding, but trend is slowing-watching closely |
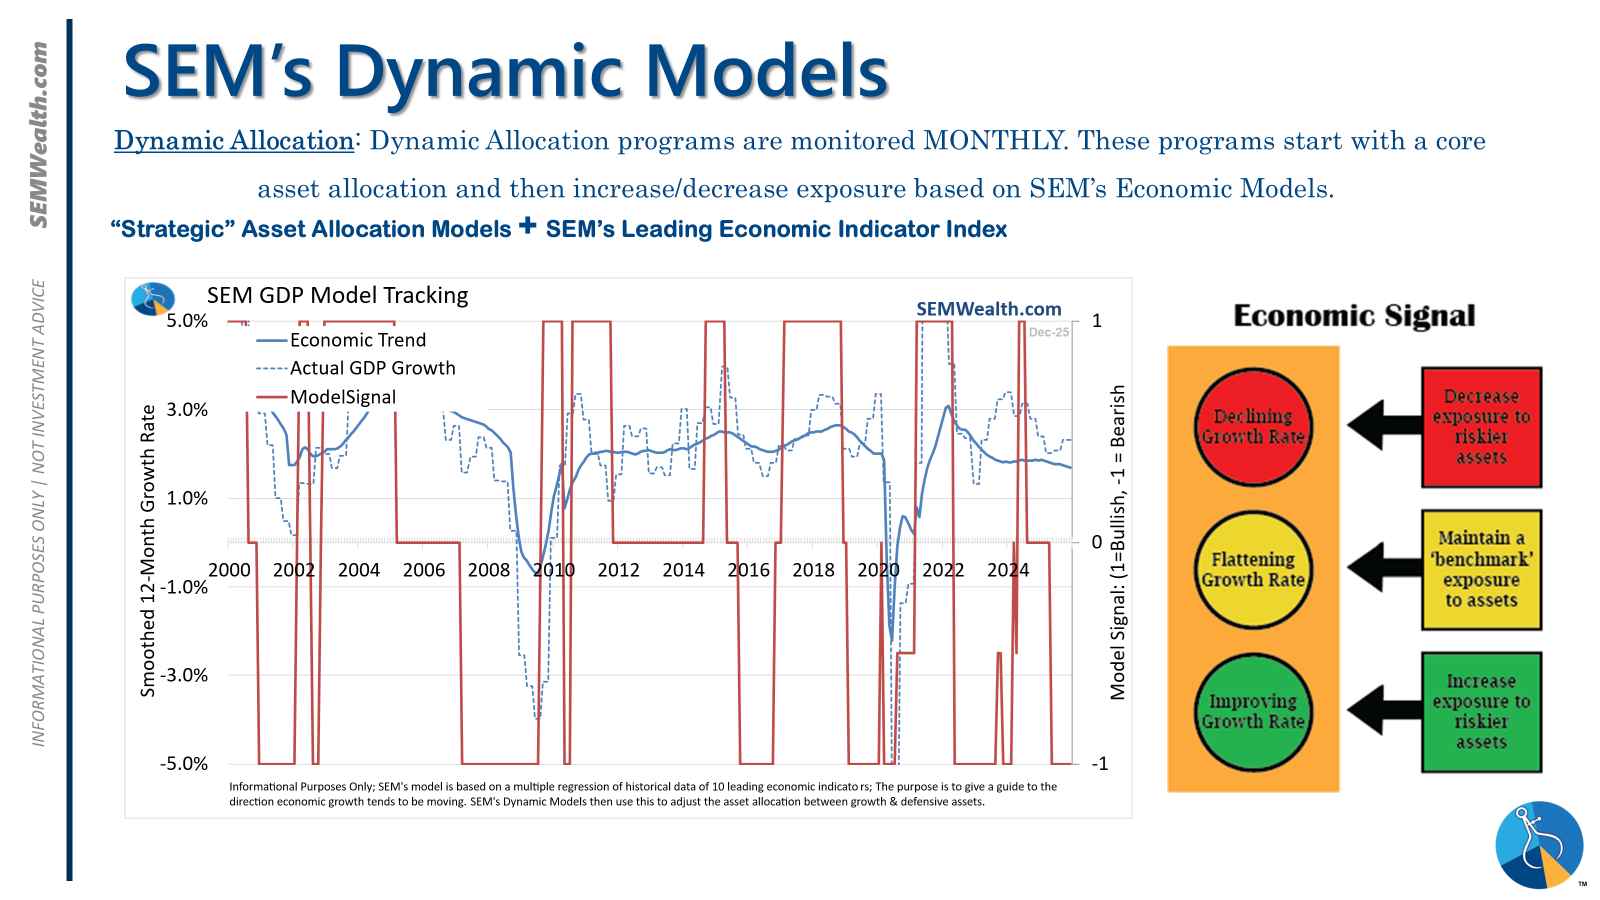
| Dynamic | Bearish | Economic model turned red June 30 '25' – leaning defensive |
| Strategic | Fully invested | Trend overlay shaved 10 % equity in April -- added back early July |
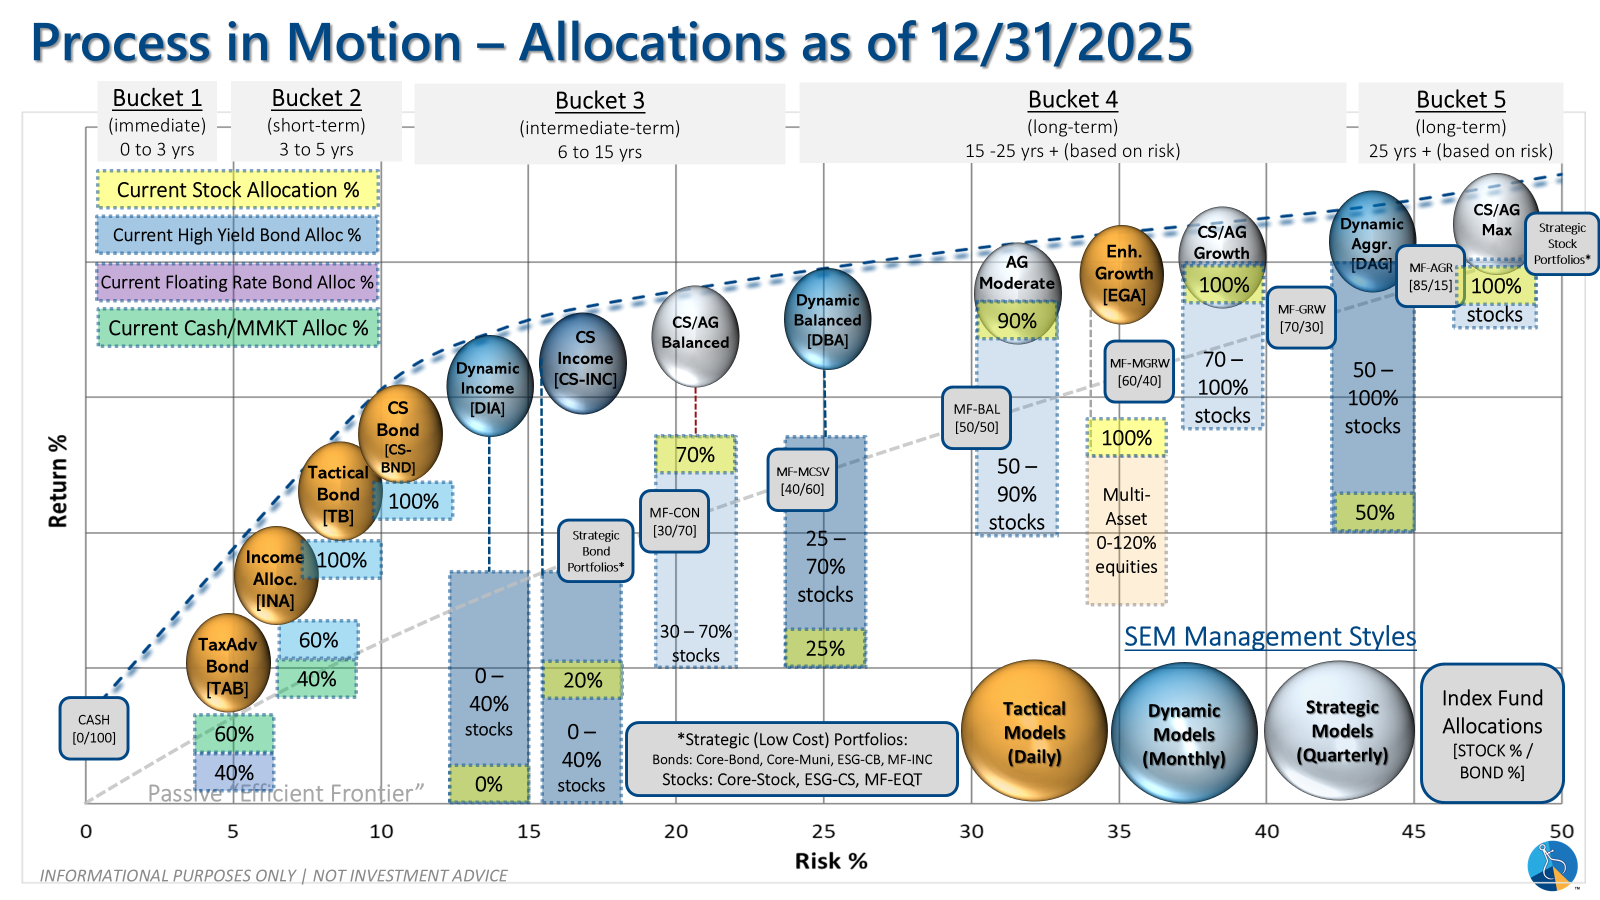
SEM deploys 3 distinct approaches – Tactical, Dynamic, and Strategic. These systems have been described as 'daily, monthly, quarterly' given how often they may make adjustments. Here is where they each stand.
Tactical (daily): The high yield system has been invested since 4/23/25 after a short time out of the market following the sell signal on 4/3/25.
Dynamic (monthly): The economic model went 'bearish' in June 2025 after being 'neutral' for 11 months. This means eliminating risky assets – sell the 20% dividend stocks in Dynamic Income and the 20% small cap stocks in Dynamic Aggressive Growth. The interest rate model is 'bullish' meaning higher duration (Treasury Bond) investments for the bulk of the bonds.
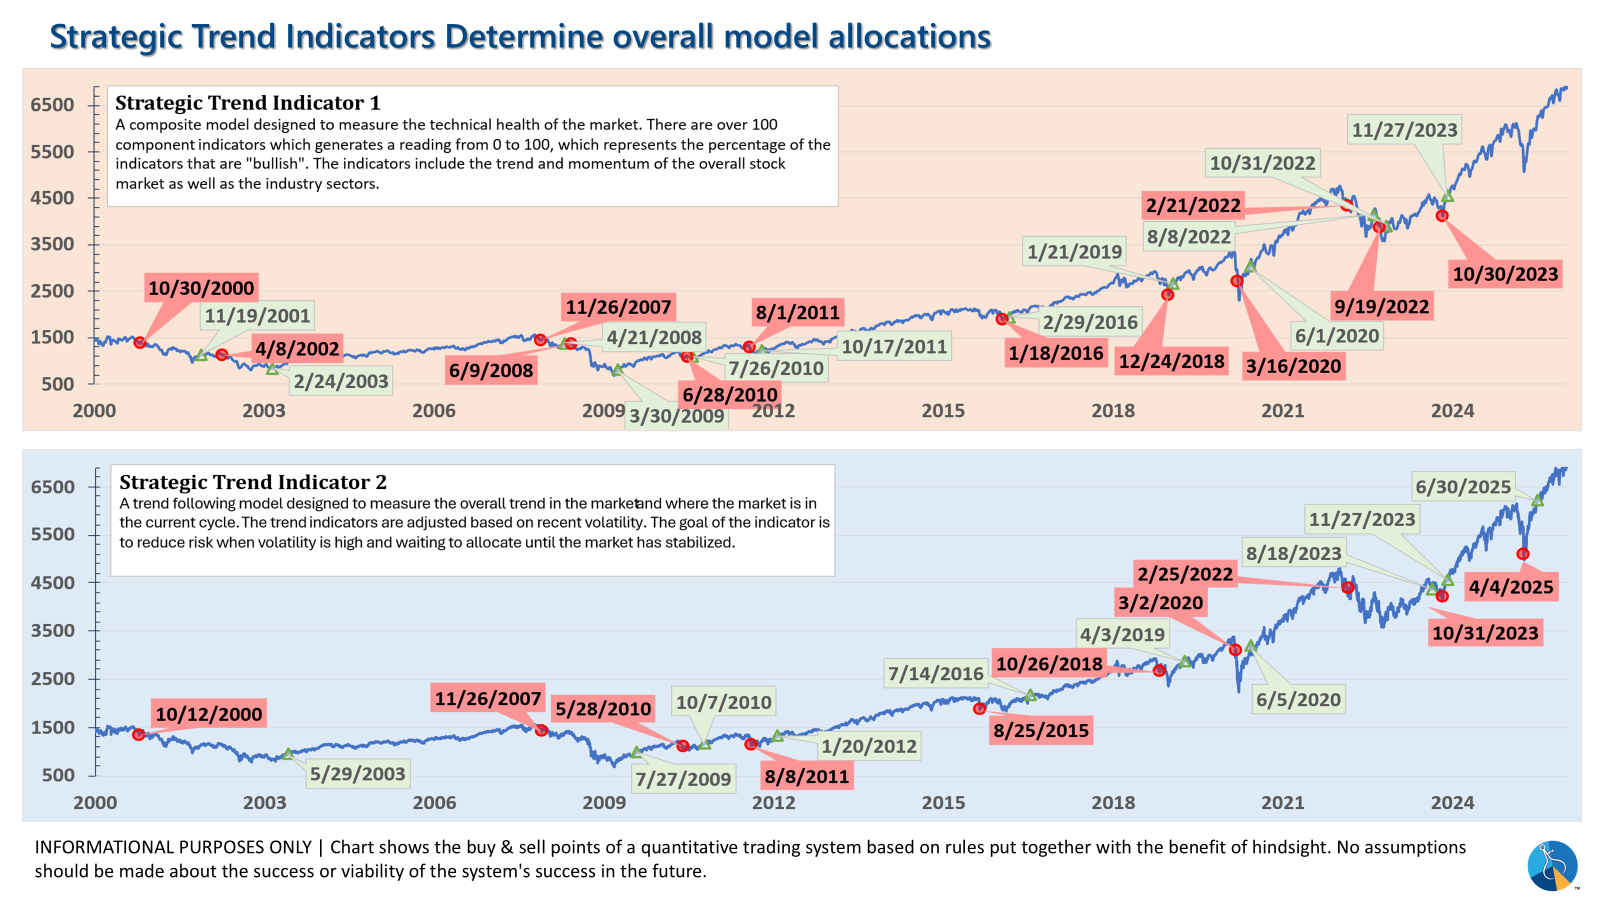
Strategic (quarterly)*: One Trend System sold on 4/4/2025; Re-entered on 6/30/2025
The core rotation is adjusted quarterly. This quarter we saw half of our international positions reduced (we sold developed markets and kept our emerging markets exposure). We also saw the remaining share of mid-cap reduced in favor of more small cap exposure. We remain with a "barbell" core portfolio – about half in large cap and half in small cap as the models expect the market to "broaden".
The * in quarterly is for the trend models. These models are watched daily but they trade infrequently based on readings of where each believe we are in the cycle. The trend systems can be susceptible to "whipsaws" as we saw with the recent sell and buy signals at the end of October and November. The goal of the systems is to miss major downturns in the market. Risks are high when the market has been stampeding higher as it has for most of 2023. This means sometimes selling too soon. As we saw with the recent trade, the systems can quickly reverse if they are wrong.
Overall, this is how our various models stack up based on the last allocation change:
Curious if your current investment allocation aligns with your overall objectives and risk tolerance? Take our risk questionnaire


