

Yet another strong year
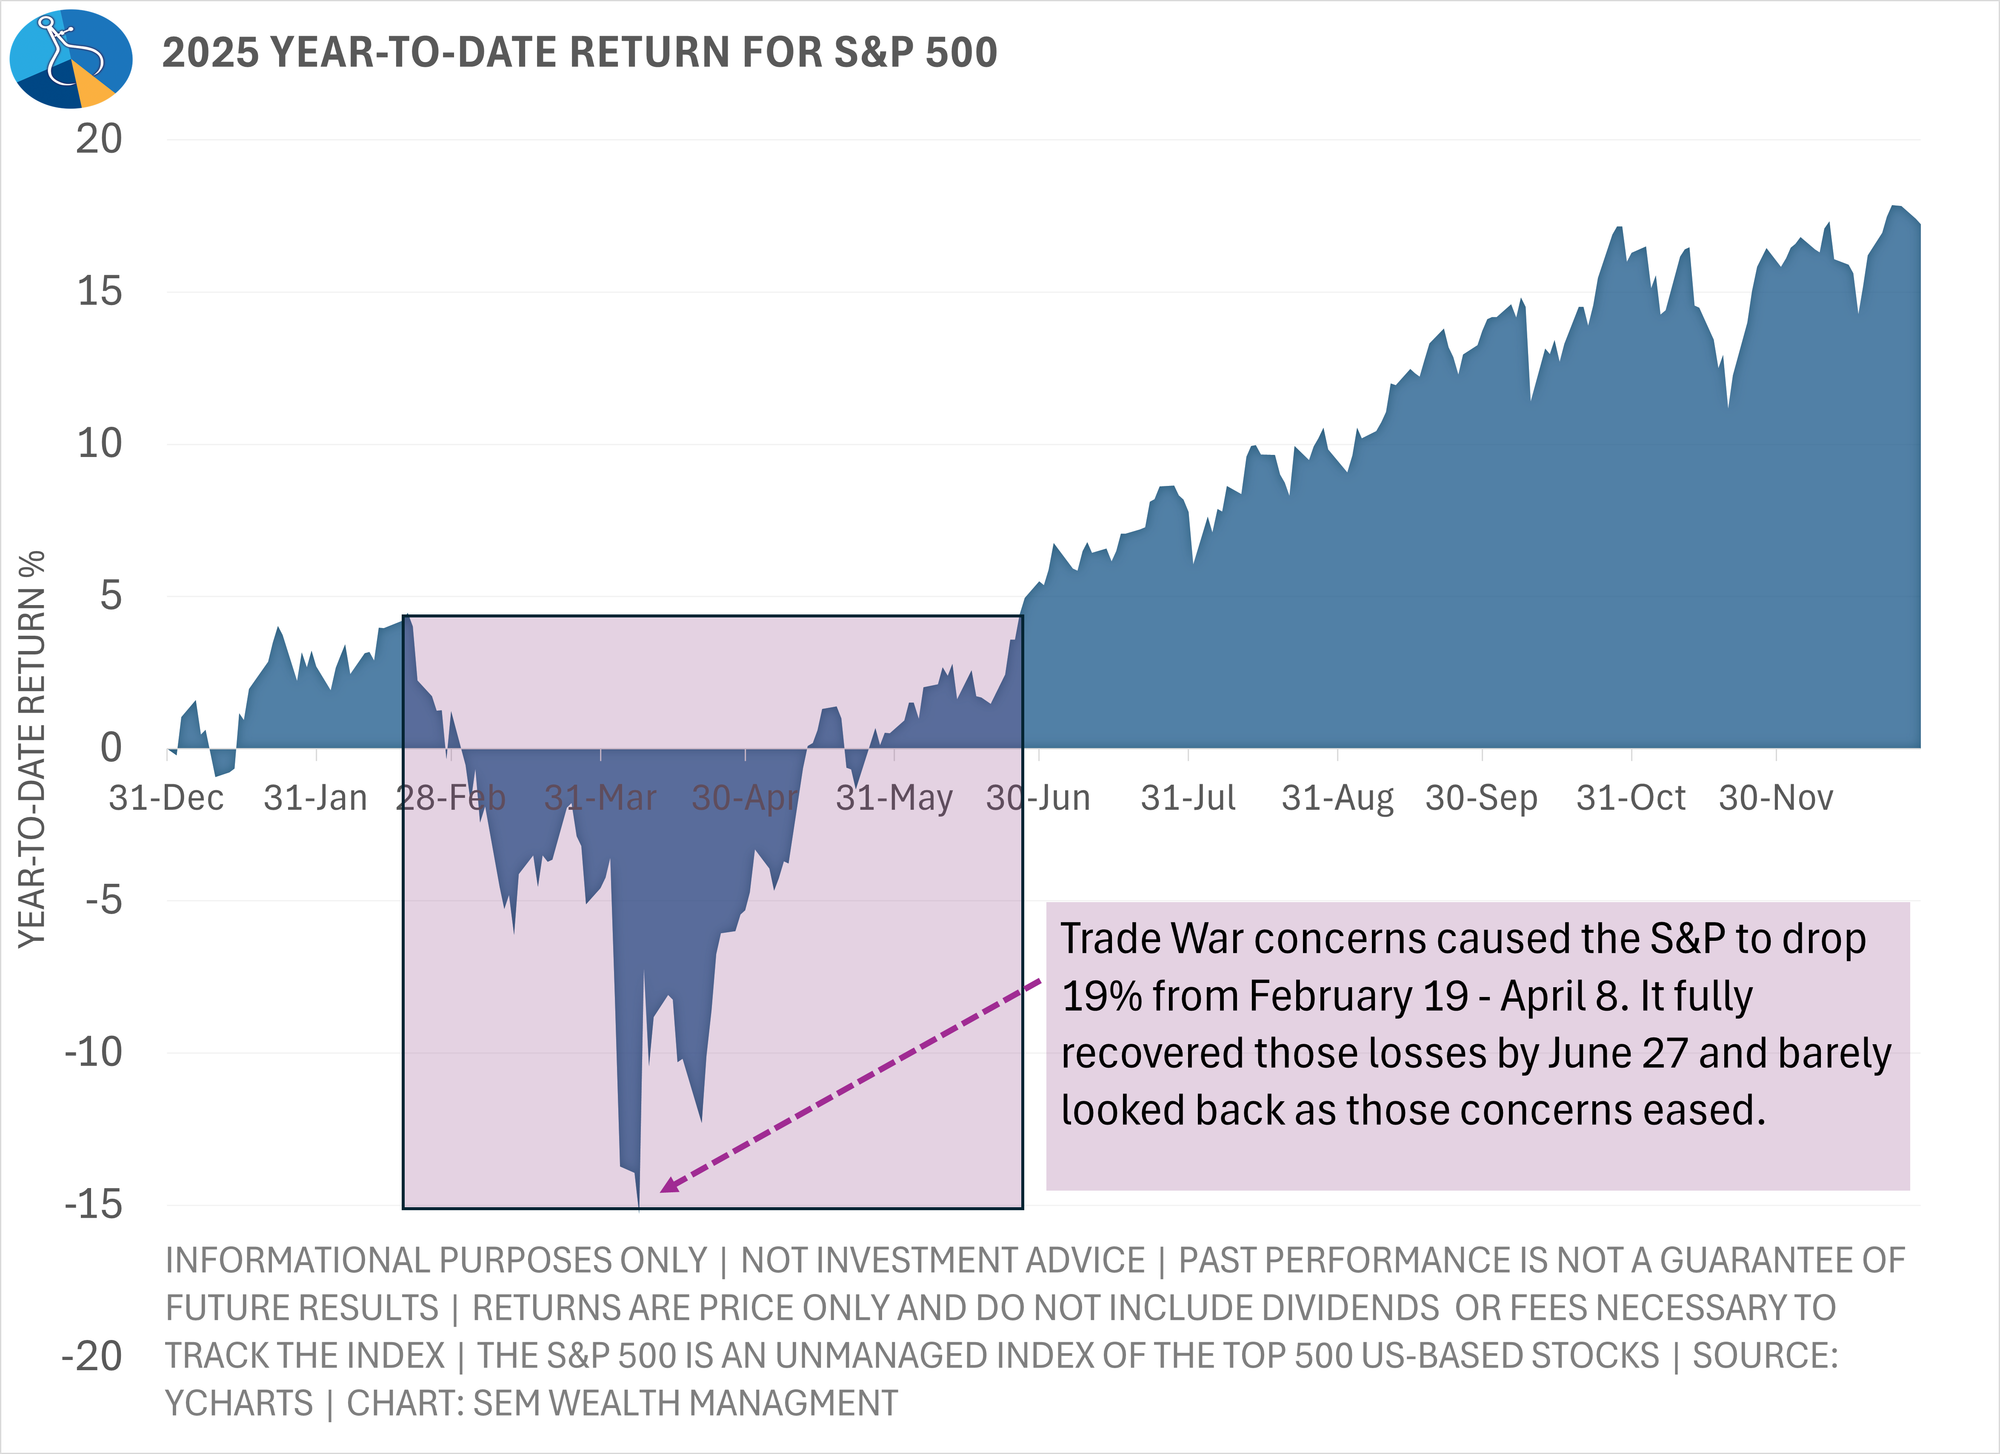
2025 started with optimism that was quickly put to the test as President Trump announced a series of strong tariffs ahead of his April “Liberation Day” announcement. As stocks plummeted, the President reversed coarse, just before the S&P 500 hit “bear market” territory of a 20% drop. Other than a brief 5% drop in November, the S&P 500 had strong upward momentum throughout the 2nd half of the year.
Strong corporate earnings, driven again by technology stocks continued to lead to confidence in the stock market. The rally broadened a bit in the fall with small cap and value stocks enjoying a few months of outperformance as we saw a brief cooling in the AI/Data Center mania that dominated the summer. The Fed cut interest rates as official inflation numbers showed inflation falling below 3% while the 3rd quarter GDP report led to confidence the small uptick in the unemployment rate was nothing to be concerned about.
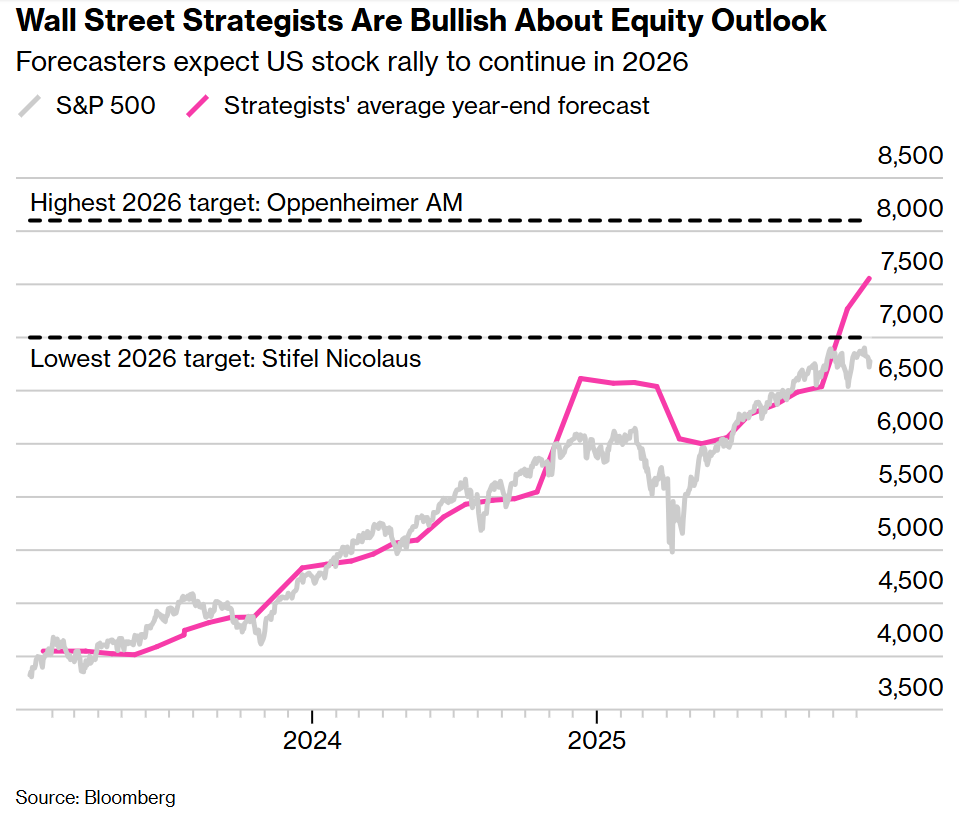
Right now, Wall Street’s forecasts are calling for a 10-16% gain for stocks in 2026. At SEM, we’ll let the data call the shots knowing that those forecasts are highly dependent on several key growth drivers continuing unabatted in the year ahead.
Do you need more stock exposure?
Following a 3rd consecutive above average year for stocks and Wall Street “experts” calling for another 10-16% gain for the S&P 500, many clients are asking to increase their stock exposure. We understand the urge and certainly could see scenarios which lead to continued strength in stocks, especially relative to the bond market. However, we also understand market cycles, which is why we trademarked our “behavioral portfolio pyramid” to take out the natural human desire to chase the best performing asset classes.
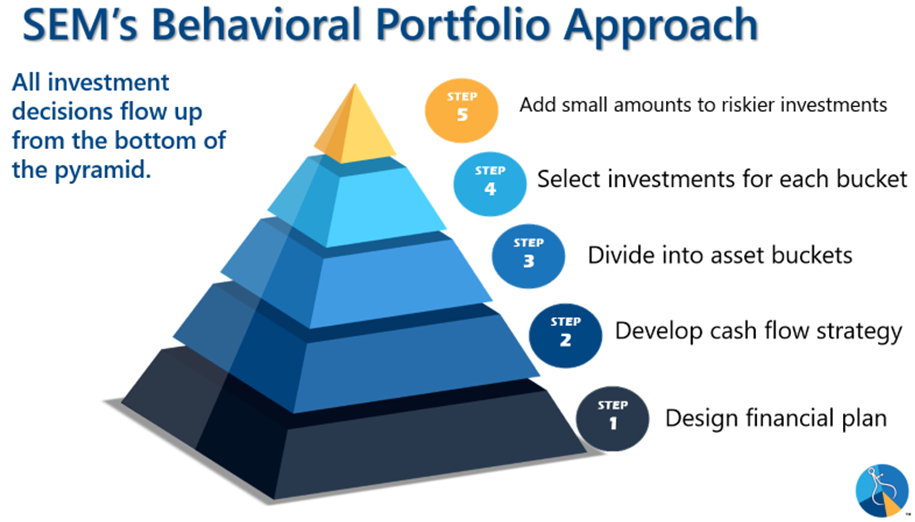
The base of every decision is the financial plan. Even with “average” performance in the bond market, the well above average performance of the stock market, unless there were outside changes to the demands on the financial plan, every plan should be looking a bit BETTER than it did a year or two ago.
Should you change your investment allocation? Only if your financial plan, or cash flow needs have changed. Stronger than average growth in your investment portfolio could allow more risk, but it also could mean you could REDUCE your exposure to riskier assets. How do you decide? The first step is to contact your financial advisor or take SEM’s Risk Questionnaire on our website.
If you would like a personalized review of your portfolio, go to Risk.SEMWealth.com
Understanding Cycles
Since our founding in 1992, SEM has been driven by one key understanding — investment markets move in cycles. These cycles are driven by human behavior which lead to long periods of overly optimistic assumptions inevitably followed by overly pessimistic reactions when the positive assumptions eventually disappoint.

Our goal at SEM is to lessen the cycles our clients go through by applying quantitative, risk management strategies. These strategies have been tested over all types of up and down cycles. Through our testing and 33+ years of experience, we know at times applying any sort of risk management to an account will hurt overall performance. 2025 was one of those years.
We’ve also learned the longer an upward cycle continues, some investors will experience the investor behavior cycle with respect to their risk-managed investments. During up cycles, any sort of risk management will inevitably hold back returns. This is especially true during the later years of the cycle when the DATA is saying the cycle is becoming more risky, but the markets continue their seemingly unstoppable stampede higher. History and logic would tell us this is the time you want MORE risk-managed strategies, but our natural reaction has us questioning whether we have TOO MUCH risk-management on our investments.
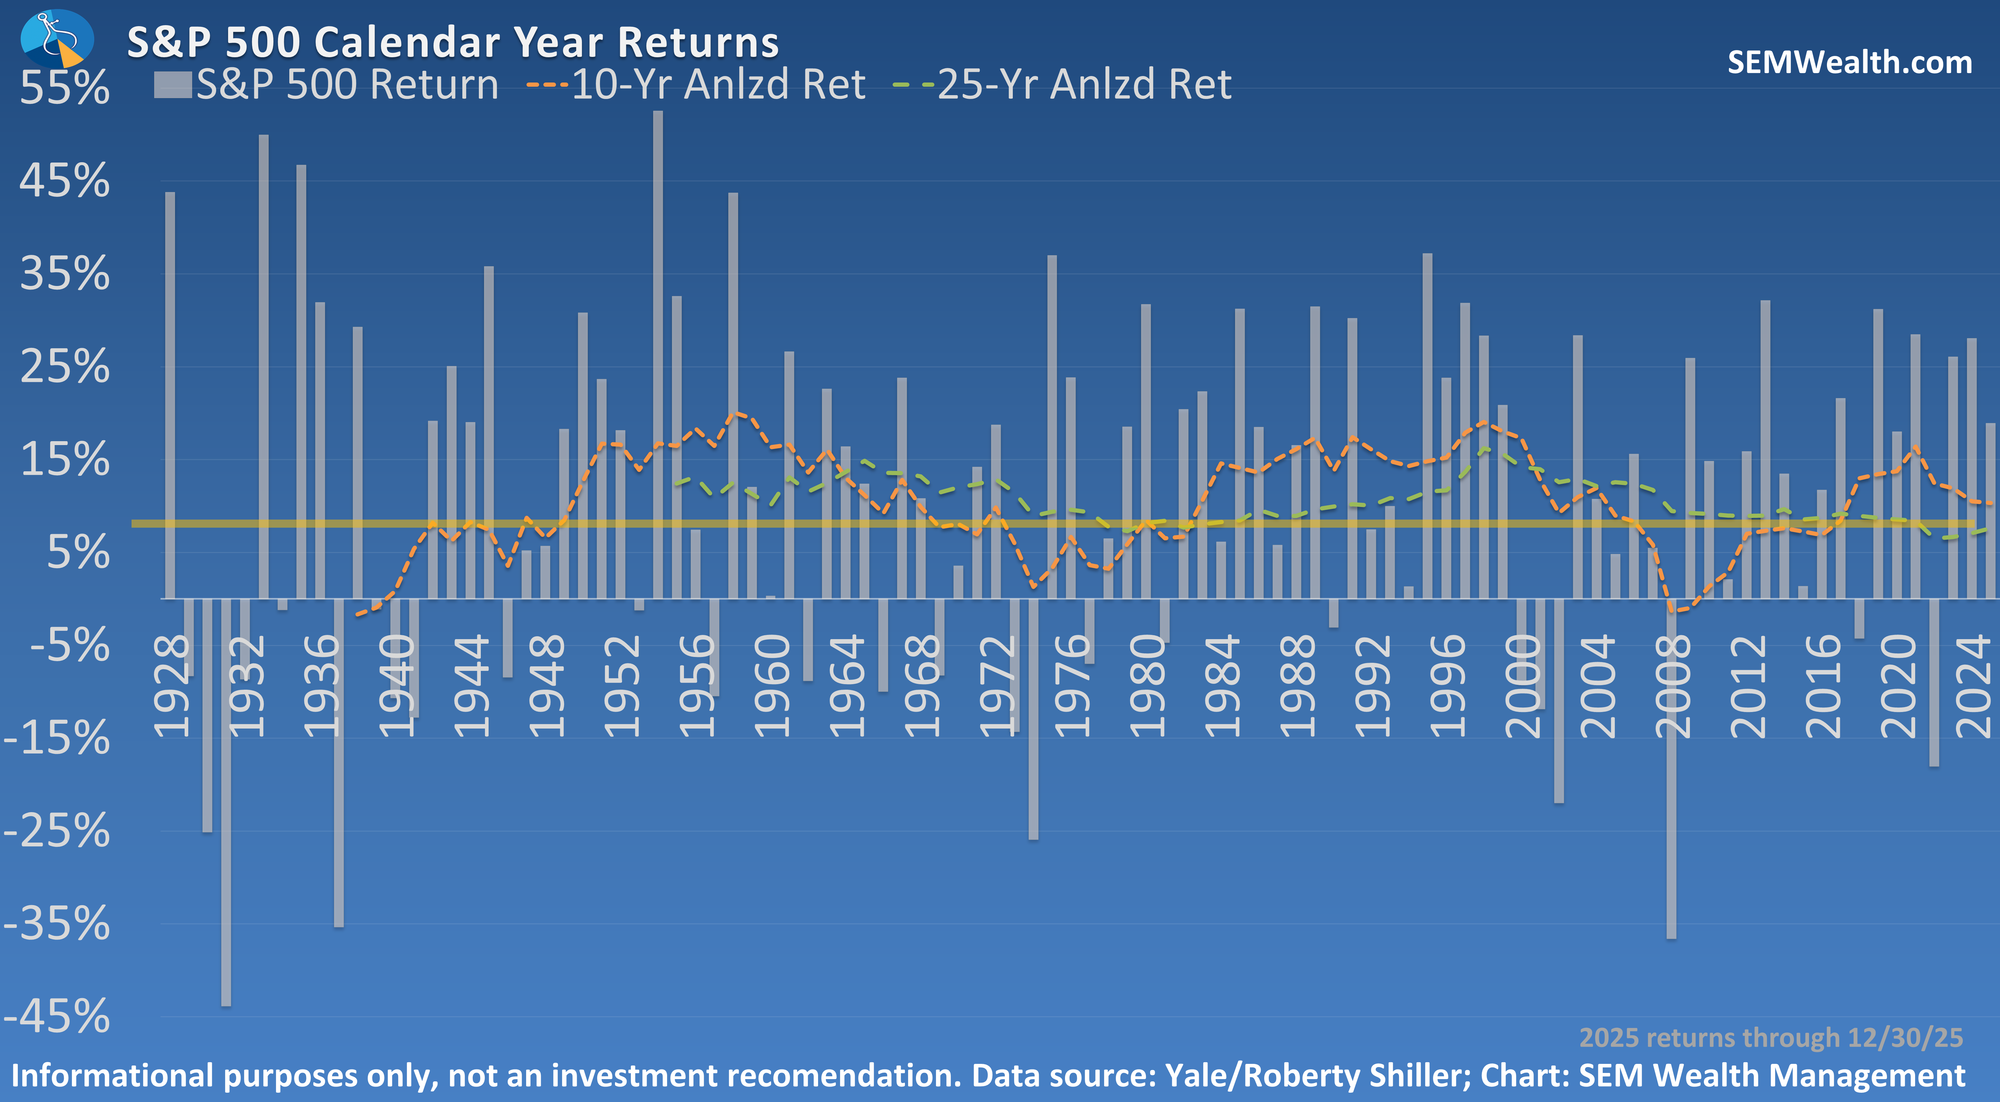
2025 was the 3rd consecutive year of above average returns for the S&P 500. Can the S&P make it 4 in a row? It is certainly possible, but nearly 100 years of history shows us that has only happened three other times — twice during the post-WWII recovery and in the mid-90s (when we saw 5 consecutive years of 10% or higher returns.)
Data and history tells us predicting the end of an upcycle is imprecise. It also tells us chasing returns after this many up years can be dangerous to your financial health.
Bonus Content:
Why did SEM's 'Growth' Models Underperform in 2025?
Am I happy with how 2025 turned out for us, especially our "growth" portfolios?
Absolutely not. 2025 was one of the most frustrating years I've experienced in my 30 years of managing money.
Is there anything we could have done differently?
Short of subjectively over-riding our quantitative signals, unfortunately no.
So what happened?
It really came down to 2 untimely trades.
January "Core" Rebalance – overweight large cap growth
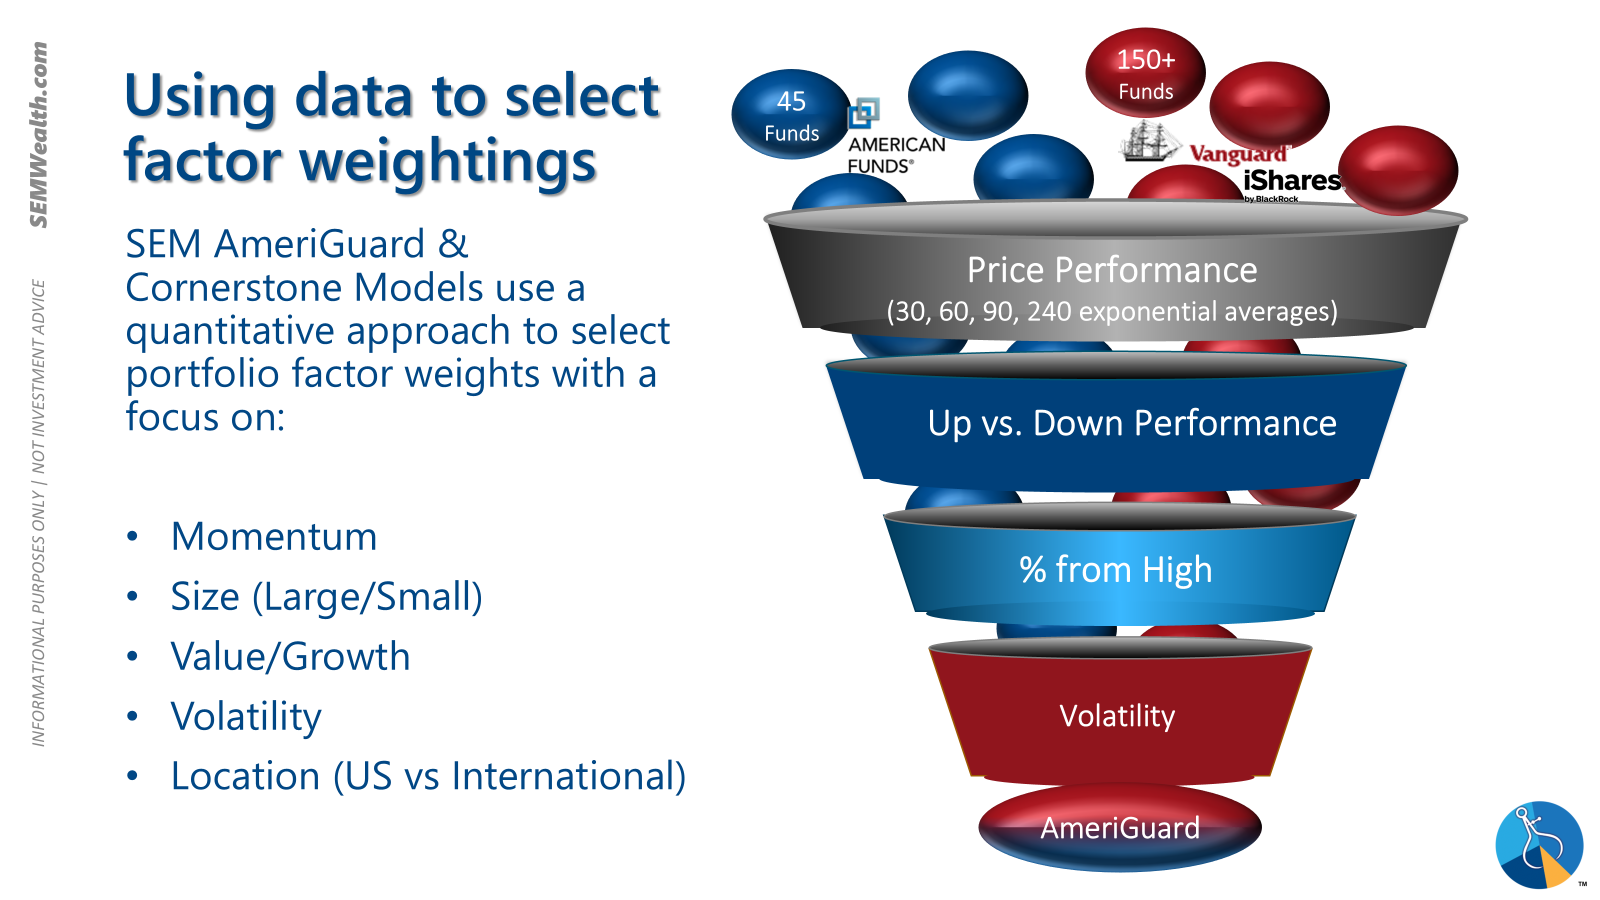
Our AmeriGuard and Cornerstone models have core portfolios that are designed to shift our allocations around using several quantitative models that look back over the past 30, 60 90, & 240 trading days to increase or decrease our allocations to the various segments of the stock market. This rebalance is run at the start of every quarter.
In January all of the lookback periods were highlighting the overwhelming strength in momentum/large cap/growth segments. While our opinion was the rally may be over-extended, we also know the data shows when there is that type of momentum it is likely to continue until something comes along to stop it.
Several "somethings" arrived in the 1st quarter which hammered the large cap growth and momentum stocks we were overweight: In late January, Chinese company Deep Seek announced a model which they claimed cost significantly less than any of OpenAI's models. This hit Nvidia the hardest, but pulled all of the large cap growth stocks down with them.
The next "something" was the beginning of the trade war, especially the threats made regarding China. US technology companies have been relying heavily on China for both growth and their supply chain. This caused investors to question the growth rates of these stocks, brining down their share prices even more.
Liberation Day "Core" Rebalance & Trend Sell Signal
The Liberation Day announcement on April 2 came just ahead of our quarterly rebalance on April 4. Large cap growth stocks were down so much ALL lookback periods had us moving to "underweight" positions in favor of international stocks and US based mid-cap and value stocks.
At the same time, 1 of our 2 "trend" indicators, which are designed to take some money off the table if the longer-term trend reverses lower triggered a sell. Unfortunately, the day of the rebalance and sell signal, stocks were down over 5%. The chart below shows both trend indicators. Thankfully (with hindsight) Trend indicator 1 did not trigger (it was VERY close).
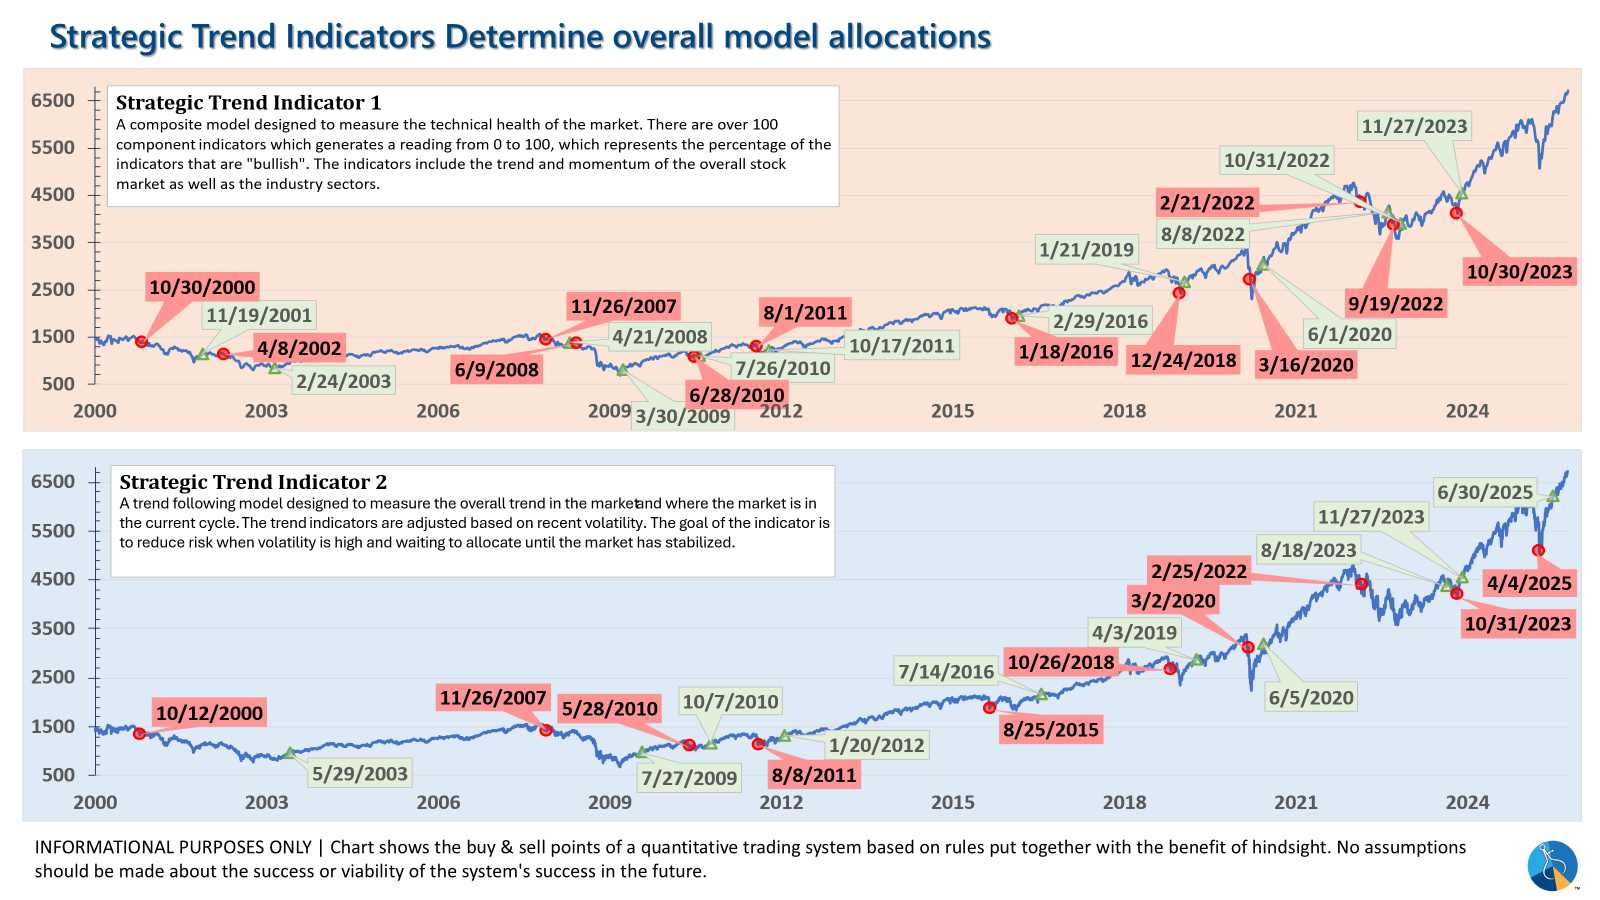
Despite selling on a down 5% day, on Monday and Tuesday the "risk-off" moves appeared to be 'good' trades.......until Wednesday afternoon when the Treasury Secretary announced the "Liberation Day" tariffs were going to be delayed by 90 days.
Stocks reversed 10% off the lows that day and closed 7% higher. In 3 weeks, the S&P had gained 10%.
The rally was furious, but volatile. Our internal indicators showed it was driven by speculators, not investors, meaning it could reverse. It would not go back into the market until June 30 when the rally appeared to "broaden".
Could we have prevented the "bad" trades?
The short-answer is 'no'. Something we do every year for all of our trading systems is review the "bad" trades to see if there could have been tweaks to the rules that eliminated the trades. The challenge is whether those "tweaks" make the past performance better or worse. As was the case this time, expanding the rules to eliminate the "bad" trades would have hurt both our risk management and our overall performance during past market shocks.
One thing we have to keep in mind is the rally off the lows was the fastest recovery of a 15% loss since the post-9/11 recovery (that ended up being short-lived). Tweaking the trend indicator and core allocation algorithm would have hurt our performance during the inflation "panic" in 2022, the COVID-drop in 2020, and during several trades we made during the 2007-2009 financial crisis.
It could have been MUCH worse.
Whatever the reason President Trump reversed his hardline stance on April 9 we should all be thankful.
Could this happen again?
Yes. There will always be some "bad" trades. We have to be careful to use the benefit of hindsight in evaluating trading decisions. While it appears "obvious" now that the President would care too much about the stock market losses to not back down (something I said often in our lead-up to 2025), that may not always be the case going forward and is not something we will ever do.
If the system says to trade, we trade. This allows us to have predictable results and reactions. It removes emotions and our inevitably fallible human brains from overriding a decision because we THINK we know better.
The models have "re-calibrated"
While not always a guarantee, something we have seen throughout our history is when a model gets "out of alignment" with the market trends it has a tendency to play "catch-up". I mentioned earlier the signal to get back in on June 30 as the market "broadened" out. Our July core re-balance identified this broadening and since that time both AmeriGuard-Max and AmeriGuard-Growth are ahead of its benchmarks. Five months does not make a trend, but it is encouraging to see the core models again enhancing the value of our portfolios.
2026 Forecasts
Every year, the Wall Street firms issue their forecasts for the year ahead. As always, the median forecast is positive. There are many behavioral biases which factor in to these forecasts, the first being "anchoring and adjustment" bias. Analysts start with the "average" (the anchor) which is 10% and then ask, will next year be better or worse than average? This is why the median expectations are almost always between 5 to 15%. Here's a look at the forecast ranges going back to 2000.
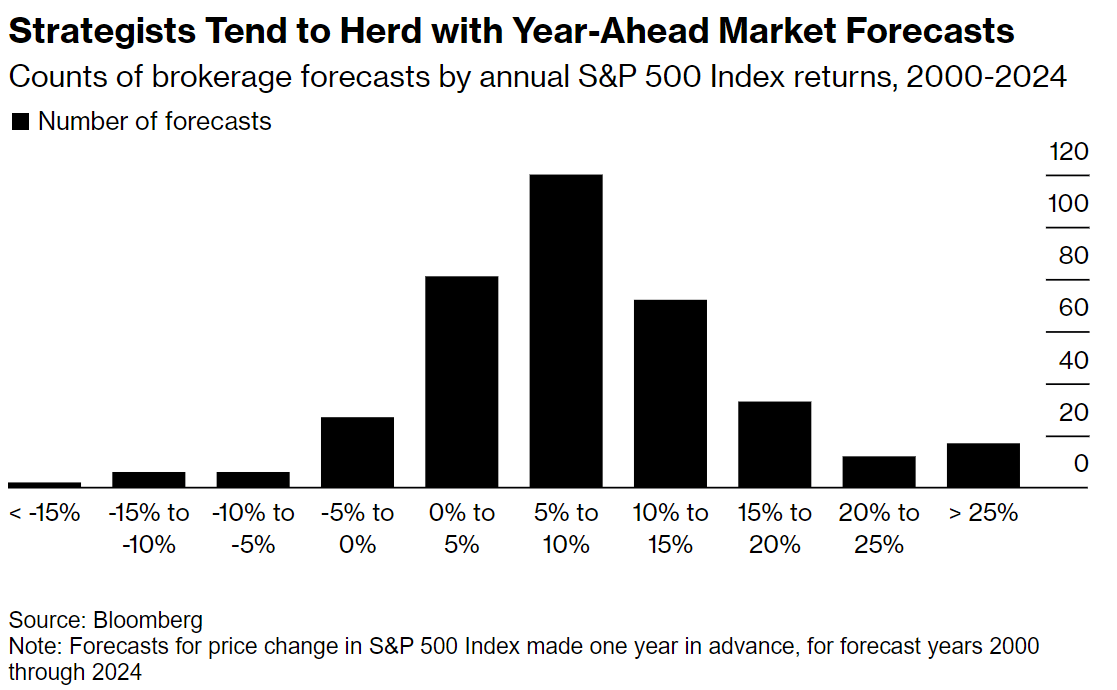
You factor in other things like availability (recency), overconfidence, and representativeness biases and we can see why the forecasts are so often wrong.
Here is a list of the year-end price targets by firm. Oppenheimer once again has one of the highest price targets for the S&P 500. For what it's worth they were predicting a 15% jump for stocks in 2022, a year the S&P 500 lost 18%. Only one firm (Morgan Stanley) predicted a drop that year – a modest 2% decline. The median 2022 prediction was for a gain of 9%. Deutsche Bank had predicted a 14% jump for 2022 and Wells was predicting 12%. In other words, just because the biggest firms are predicting another year of double digit returns should not give us confidence that is what will happen.
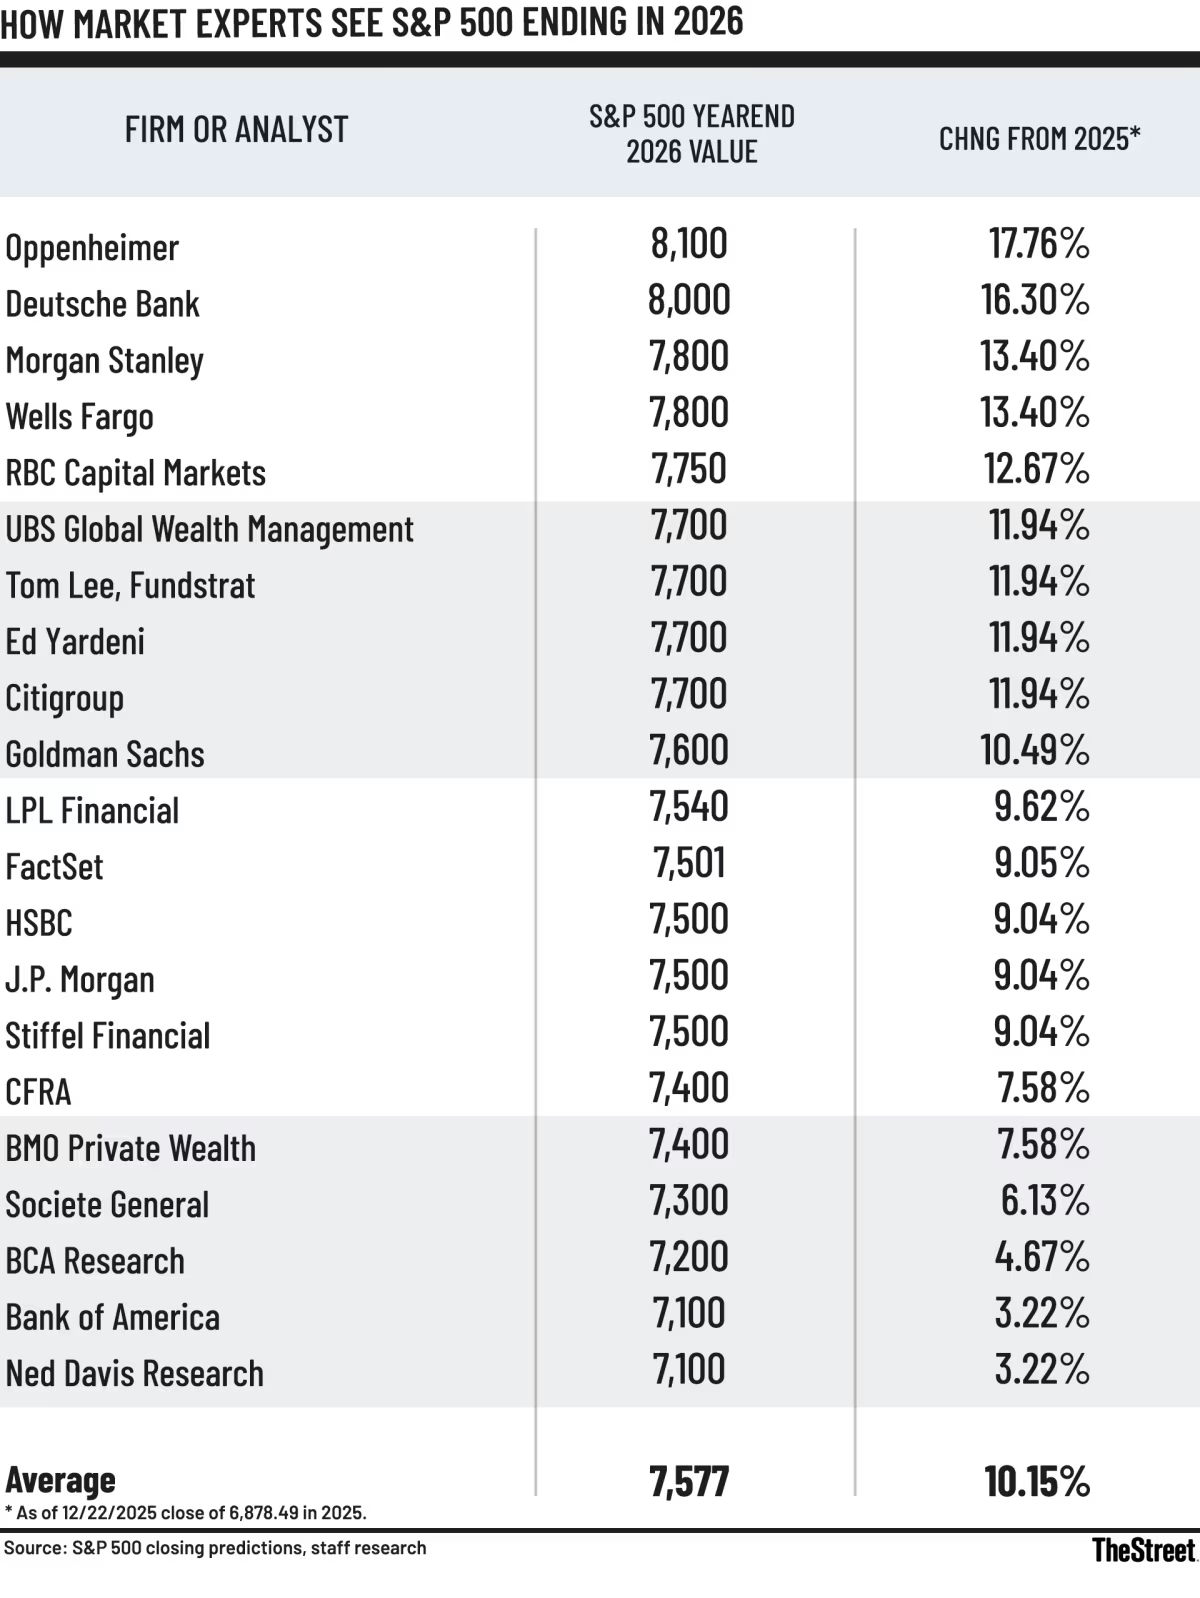
The S&P 500 is down on average 1 out of every 4 calendar years, yet it is extremely rare to see a firm predict losses for stocks. The consequences for the firm are too high (predicting losses for stocks could lead their clients to move money out of their firm and to bank accounts.) It also could result in missed opportunities if the firm follows the guidance and allocates too much money out of the stock market.
So what we get is a number that shows which firms are the most and least optimistic, but serves little purpose in making actual decisions.
Do you need more stock exposure? Part 2
In the main part of the newsletter, we asked the question above because during the fourth quarter of last year we saw an onslaught of clients and their advisors asking for MORE stock exposure. We fully expect more requests to come both to us and to employer retirement plans in the next few months as the "reviews" of the last 5 years will show exceptionally strong returns for US stocks and much smaller returns for bond investments. For some investors it does make sense. It really comes down to 3 things:
1.) Financial Plan (what is the planned use and time frame of the money invested?)
2.) Cash Flow Strategy (when and how much will you be taking from the investments?)
3.) Investment Personality (can you handle the inevitable recessionary bear market?)
We should EXPECT a 35-50% drop in stock prices. Recessions and the bear markets which accompany them will happen. If you NEED the money during or 3-7 years after the large drop, having too much money in stocks could do significant long-term damage to your plan. If you know you will want to take some money off the table if you see a 12-18 month period of losses of 35% or more, you also should be adjusting your stock allocation down, not up.
While we are seeing record high allocations to stocks as part of retiree portfolios, Vanguard has warned the current valuation levels and especially the EXPECTATIONS of continued high returns from AI related stocks, which as valuation levels at extreme levels will likely lead to low returns for the next 10 years. (Read their full report here)
We remain most guarded in our assessment of U.S. growth stocks. Our muted expected returns for the technology sector are entirely consistent with our more bullish prospects for an AI-led U.S. economic boom. The heady expectations of U.S. technology stocks are unlikely to be met for at least two reasons. The first is the already-high earnings expectations and the second is the typical underestimation of creative destruction from new entrants into the sector which erodes aggregate profitability. Our muted U.S. stock return forecast of 4%–5% average returns over the next 5-to-10 years is nearly single-handedly driven by our risk-return assessment of large-cap technology companies. – Vanguard 2026 Economic and Market Outlook
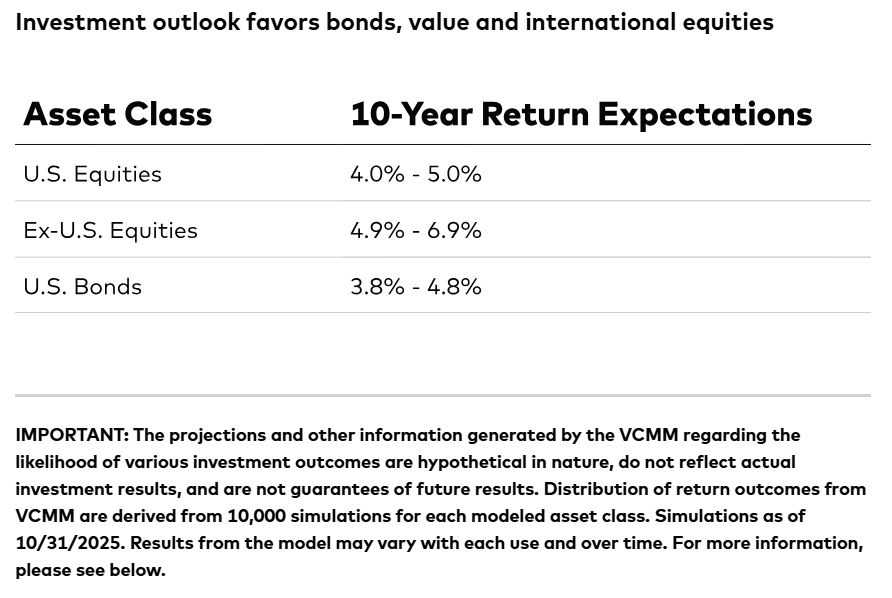
Predicting returns about half of the long-term average matches what some other well-known firms are forecasting for US Stocks. Morningstar is forecasting 10 year annualized returns of 5.2% while JP Morgan, Schwab and Blackrock are forecasting those returns to be around 6%. All but Blackrock are predicting US Bonds to return just 1% less than US Stocks. All are forecasting higher returns from both developed international stocks as well as those in emerging markets. (source)
The consequences for those both choosing to INCREASE their stock allocation now as well as those simply choosing to not reduce their stock allocation due to being closer to retirement are important to understand. You are accepting MORE risk while you should expect LESS returns. These forecasts are not a prediction or a good timing indicator, but they are something everyone should take into consideration going into the new year.
Again, the most critical decisions are for those already retired or 10-years from retirement. Here's a simple way to look at it.

The most important thing to keep in mind is it is highly unlikely we simply see US stocks compounding at a steady 5-6% per year for the next 10 years. Anytime we've had valuation extremes such as now, what has happened was a 12-18 month decline followed by 5-8 years of much larger gains just to recover the losses. Yes, from the 10-year point A to point B you would have compounded at an AVERAGE of 5-6%, but it has not been a comfortable ride.
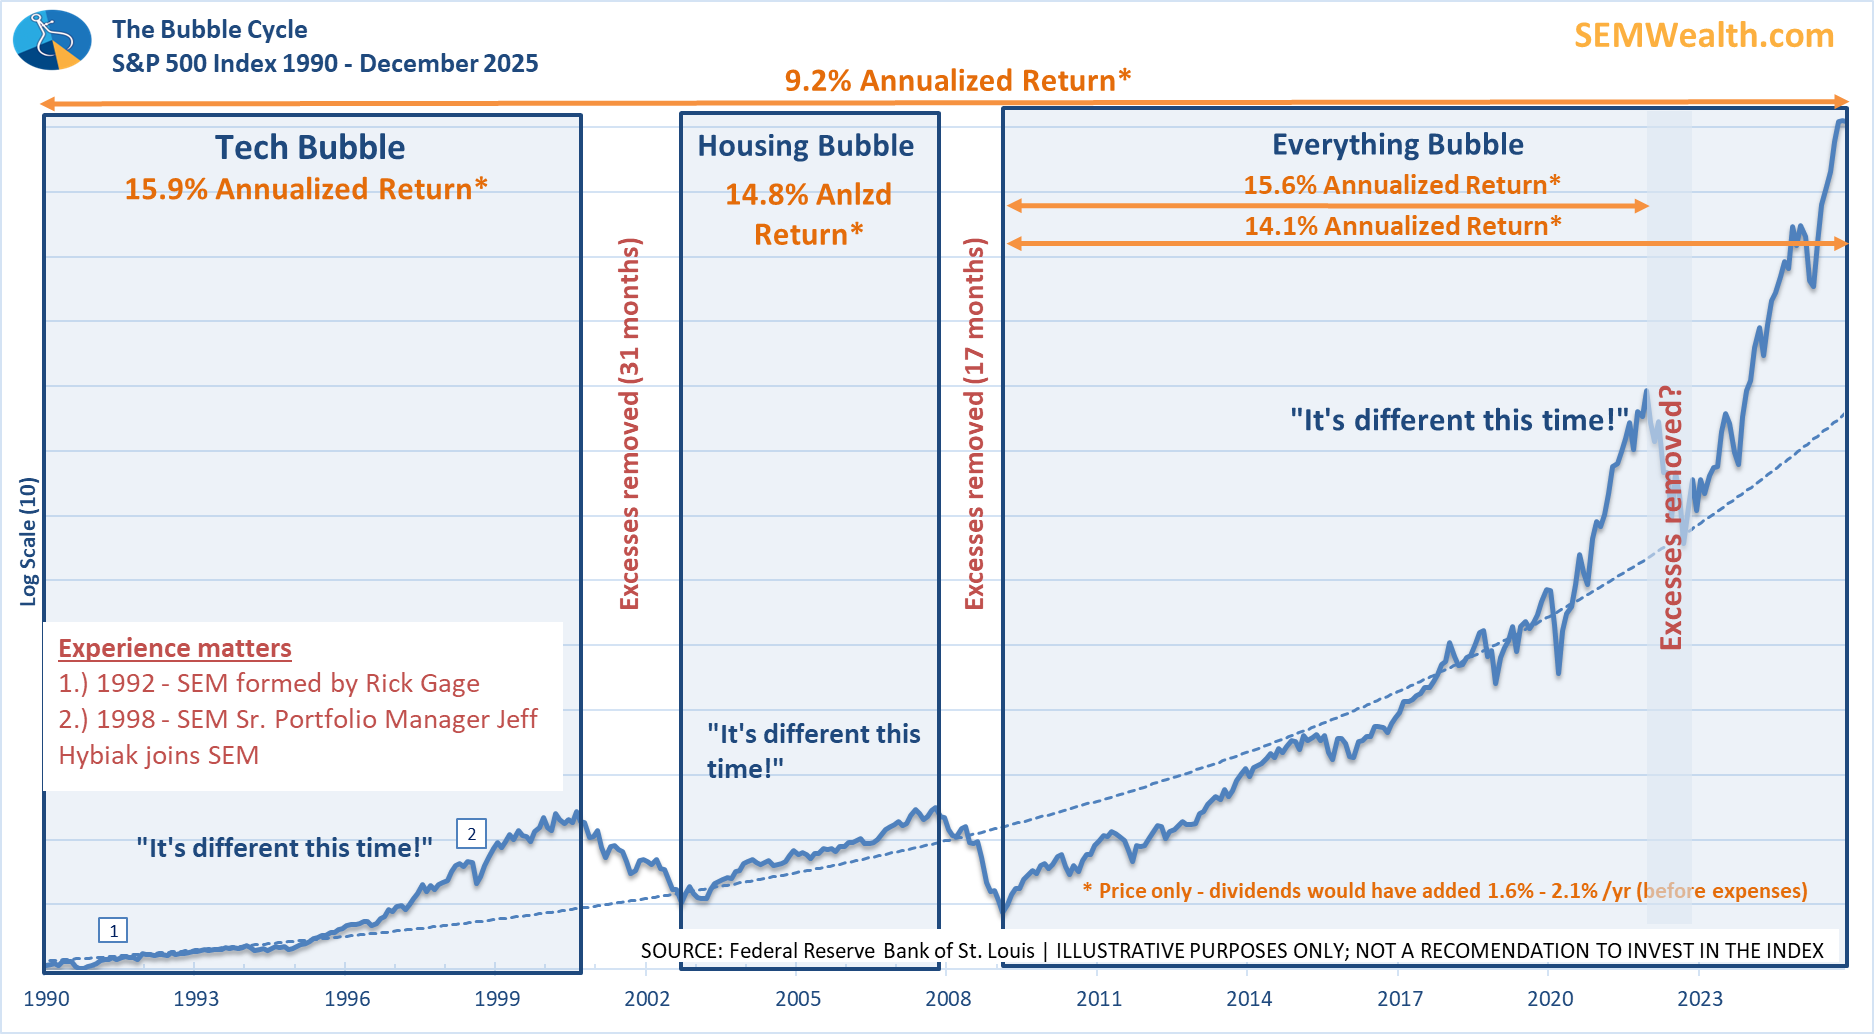
Looking at this chart, it's important to consider all of the amazing technological revolutions which have been developed since 1990. They've made us more productive, efficient, increased profit margins and been a source of tremendous growth for corporations and individuals alike – exactly like they were predicting in the 1990s. Yet, since that time, the stock market has compounded at a 9.2% annualized rate (without dividend reinvestment).
Everyone is saying the same thing about "AI" as they were about the technology revolution of the 90s. I fully expect (most of) those predictions to come true. However, that doesn't mean stocks will suddenly continue compounding at a 14-15% annualized rate rather than the long-term rate of 9-10% (which is the same rate we've enjoyed going back 50 & 100 years!) Excesses have always been removed when we get to these types of expectations and is something we should plan for.
Our goal at SEM is to do what we've always done. Use our data driven models to take money off the table when risks are high (even if they end up with hindsight being "bad" trades). We would rather give up some upside than risk having too much downside. We also fully expect our core systems to rotate more into international stocks should the data indicate that is where the momentum is. On the bond side, we also expect plenty of opportunities to make-up for "lackluster" recent returns. The key there is keeping the losses at manageable levels so when those opportunities emerge we do not have to take on large amounts of risk just to make up the losses.
If you are contemplating taking on adding more equities to your portfolio or want to know whether you should be reducing your equity exposure, the best place to start is with our risk questionnaire. It kicks off an automatic portfolio review which will be sent to your SEM Financial Advisor for discussion.
What can go wrong?
One thing the year-end forecasts can help us with is understanding what Wall Street is expecting for the year. In this case, why do the majority of firms believe 2026 will be a 4th consecutive year of above average returns for stocks?
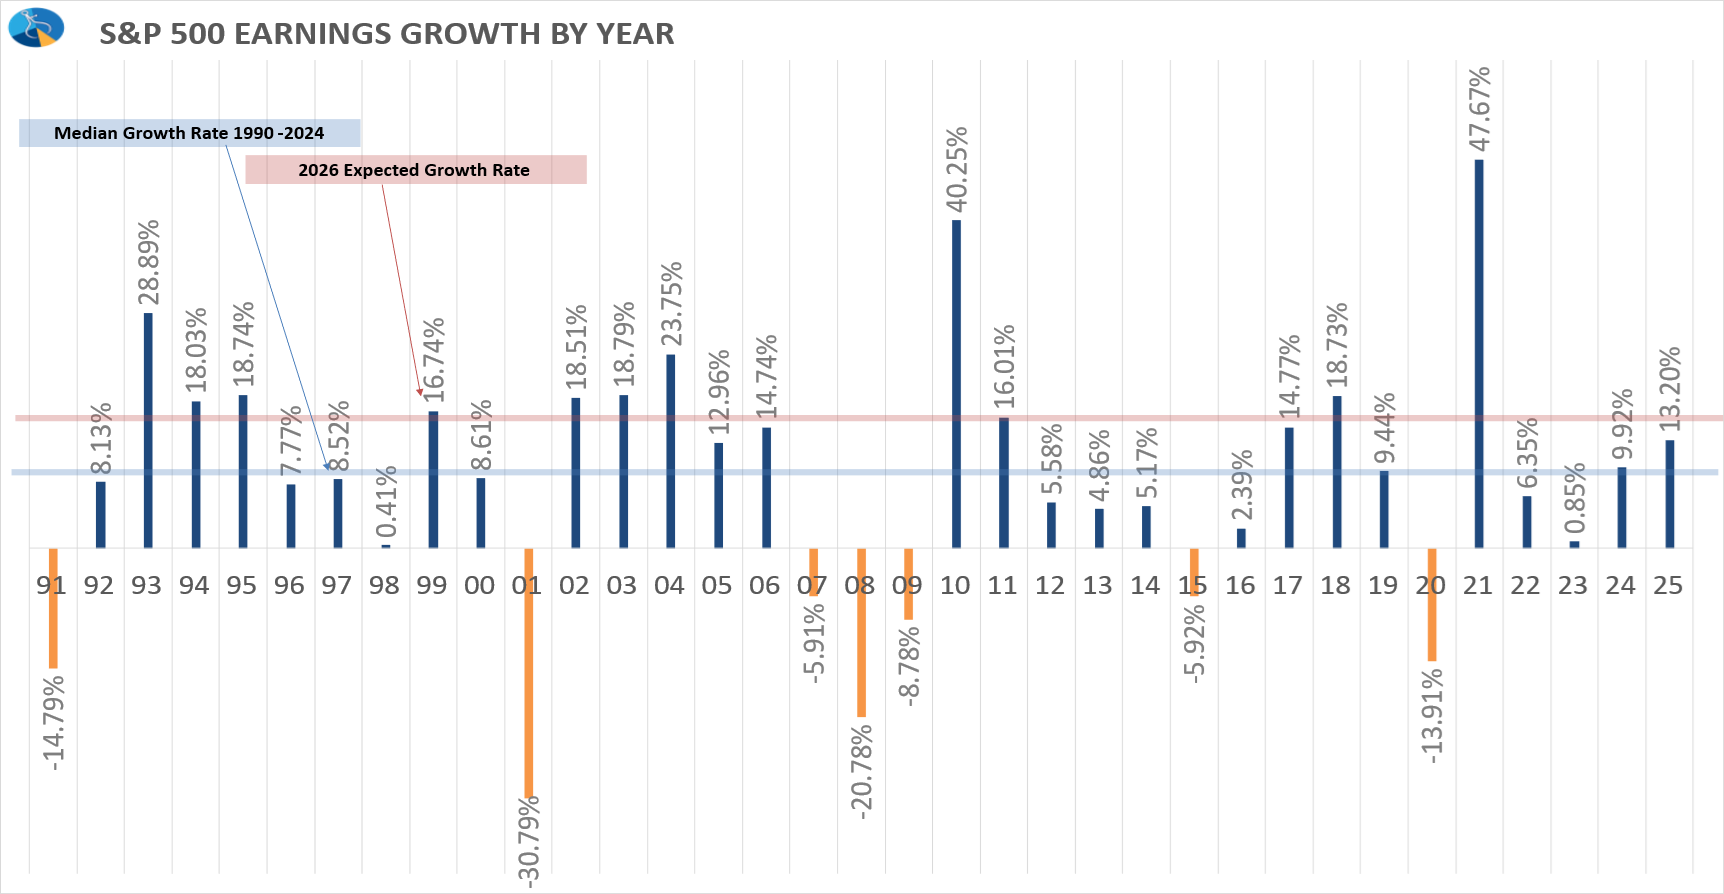
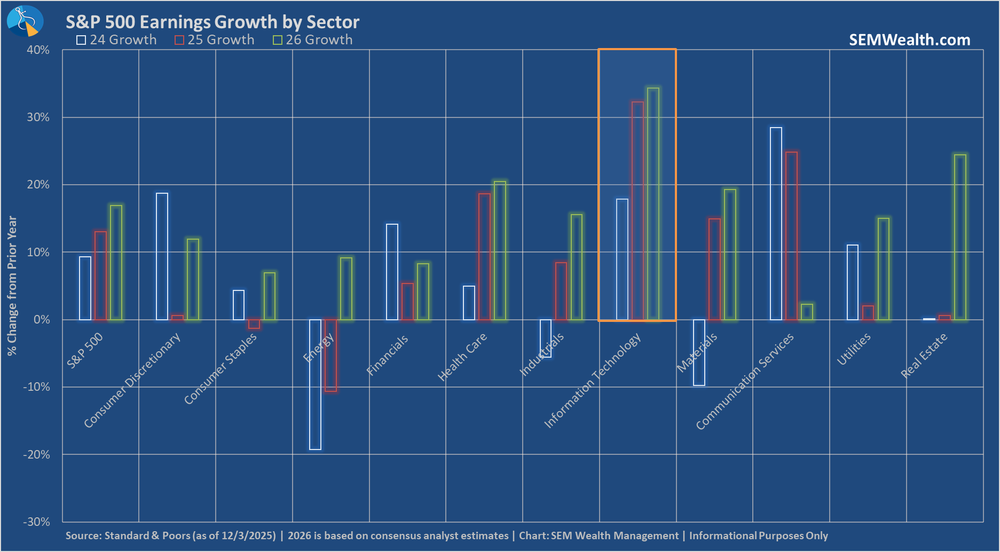
The most obvious take away is that Wall Street believes economic growth will rebound and lead to strong corporate earnings growth. As of December, analysts are forecasting 17% growth in S&P 500 earnings, well above both the long-term average of 10% and 2025's 13% earnings growth.
To put that in perspective, earnings have only grown at 17% or higher 8 times since 1991.
Most written forecasts are calling for a "broadening" of the rally to other non-tech sectors, but digging deeper, Wall Street is expecting the technology sector to become even more dominant – representing 68% of the TOTAL S&P 500 earnings amount.
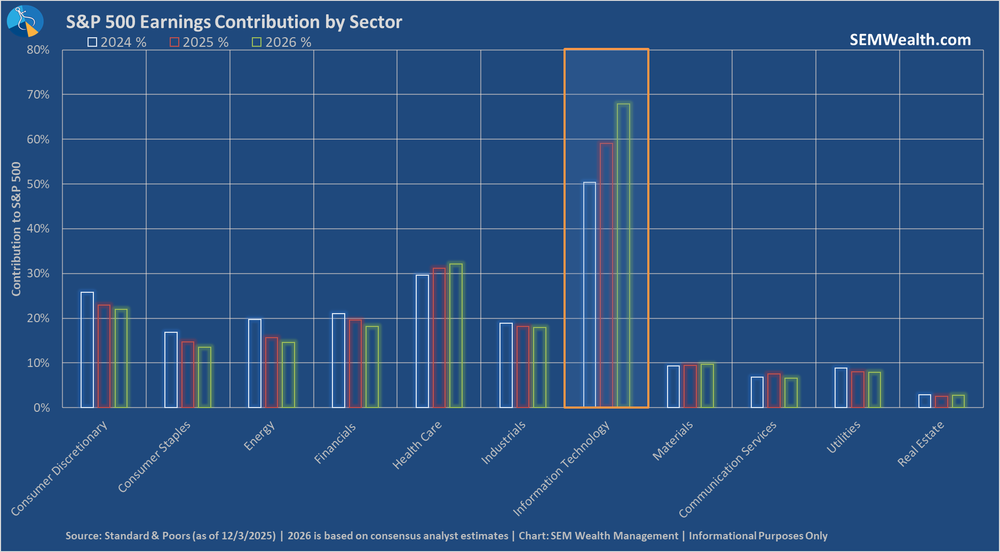
Not only that, Wall Street is expecting the technology sector to see an even higher growth rate in 2026. They also see strong growth in the health care and real estate sectors, but nothing compared to the 34% growth they expect from technology stocks.
So breaking all of this down, what could go wrong in 2026?
- The data center buildout slows (or some projects are delayed)
- Companies are unable to "monetize" their AI spending (tech companies cannot charge enough to their end customers to support their AI spending)
- We see a major private credit loan default (which will hurt the data center buildout)
- Unemployment continues to increase
- Consumer spending slows
- Inflation moves back to 3% or higher.
Any of the above would make it tough to hit expectations. That said, a case could be made none of the above happens, which would lead to a 4th consecutive year of above average returns.
Understanding the Q3 GDP Report
In late December, the government reported the economy grew at a very impressive 4.3%. While we love to see this type of positivity, nobody seems to be asking how we got there.
What the 4.3% growth rate means: from July 1 - September 30, the economy expanded by 1.07%. The calculation works like this:
[GDP(Q3) / GDP(Q2)] ^4 -or- take the last 3 months and assume we will grow at the same rate the next 9 months.
So you get 1.0107 x 1.0107 x 1.0107 x 1.0107 = 1.0434....(then subtract 1 and multiply by 100 to get 4.34%)
GDP is the only financial number I know of where a 3-month rate of growth is then annualized (also CPI, but they give BOTH the "annualized" and "year-over-year" numbers). For everything else we compare the growth now versus the last 12 months.
The economy has expanded at a 2.33% rate over the last 12 months. That's BELOW the 2.79% rate we saw a year ago as well as in the fall of 2022 (when many people said we were in a recession.) Granted, back then we had 2 more quarters of ANNUAL declines.
The economy was growing at a 3.23% rate in the fall of 2023.
This is the chart I use to show the difference between the "official" (orange bars) and the annual growth (the solid blue line). The dashed blue line shows the long-term average of 3.1%. This should be the benchmark we use to evaluate the economy.
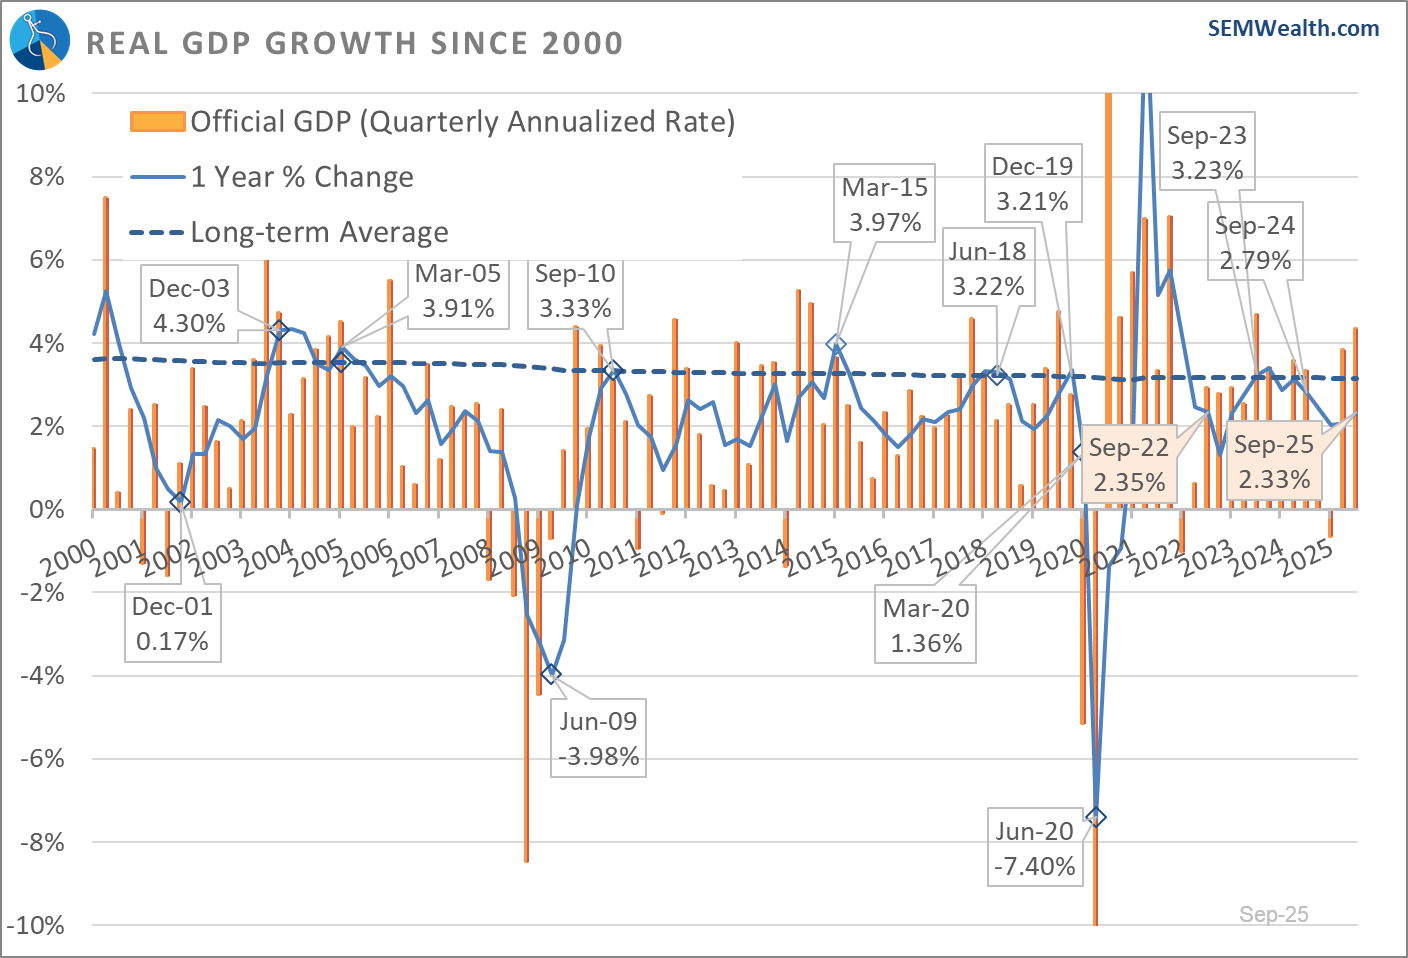
Don't get me wrong, a 1.1% gain in 3 months is amazing, but it is most certainly not unprecedented. We saw 1.15% growth in 3 months (4.69% "officially") back in the 3rd quarter of 2023. We also enjoyed an official 4.76% growth rate in Q3 2019 and 4.59% in Q4 2017. There were 4 quarters with higher growth rates during the 2010-2016 recovery. We also saw 5 quarters of over 4% "official" growth in the post-9/11 economic recovery.
These are backwards looking numbers that politicians on both sides like to use to support their side. They take advantage of Americans not understanding the difference between the "official" GDP number and what the economy actually did. Looking forward, we are still in a bit of a dark zone as the government shutdown both delayed and eliminated numbers as well as leaving us with skepticism about the numbers they have reported (since data wasn't being collected and statistical assumptions had to be made.)
We still only have a few bits of data from October and November. That data shows a cooling economy. That can change of course. Some of the things which supported the huge jump may continue:
- Surge in Net Exports (trade deficit reduction): This added 1.6% points to the growth rate. There may be some strange adjustments due to inventory surges in January, but for now, the trade deficit is declining, which helps GDP.
- AI Spending: Spending on information Processing Equipment and Software added 0.8% to the Q3 growth rate. Non-residential structures (the shell of the data centers) subtracted 0.2% in Q3. That may not all be data center related as it includes all commercial building projects.
- Health Care Services: While not a positive overall for the economy, spending on health care services added 0.8% to the Q3 number. With approximately 20 million people losing their ACA Subsidies, I'm not sure of the impact this will have on health care spending.
- Defense Spending: This contributed another 0.4% to Q3 growth. The recently passed defense spending bill ensures this will be a driver of "growth" in the year ahead as the Department of War budget was increased once again.
If any of these things let up in the quarters ahead the "headline" number could be below 1% (because again they are comparing the current 3 months to the prior 3 months). That isn't "dire", but it is something we should factor in to our expectations for 2026.
Economics 101
Due to our focus on risk management, we are often labeled as "bearish", or somebody who doesn't like stocks. That isn't even close to the case. What we always tell people: If you have a 15+ year time horizon AND you can stomach some periods where you may lose 35-50% of the value of this LONG-TERM bucket, you SHOULD have that money in the stock market.
Our 33+ years of experience, study of market history, understanding of human nature, and the fact we are getting closer to the end of our investing time horizon every year tells us that few people can have 100% of their money always invested in the stock market. For everyone else, we need to find ways to manage the risk in the accounts to keep losses at sustainable and reasonable levels.
Part of that balance is understanding the LONG-TERM driver of stock prices. It comes down to a simple formula.
GDP Growth + Dividend Yield + Inflation
Long-term the average growth rate for stocks is 10% (going back 30, 50, 70, and nearly 100 years). The long-term averages of each input sums almost exactly to 10%:
GDP Growth (3.1%) + Dividend Yield (2.5%) + Inflation (3.8%) = 9.4%
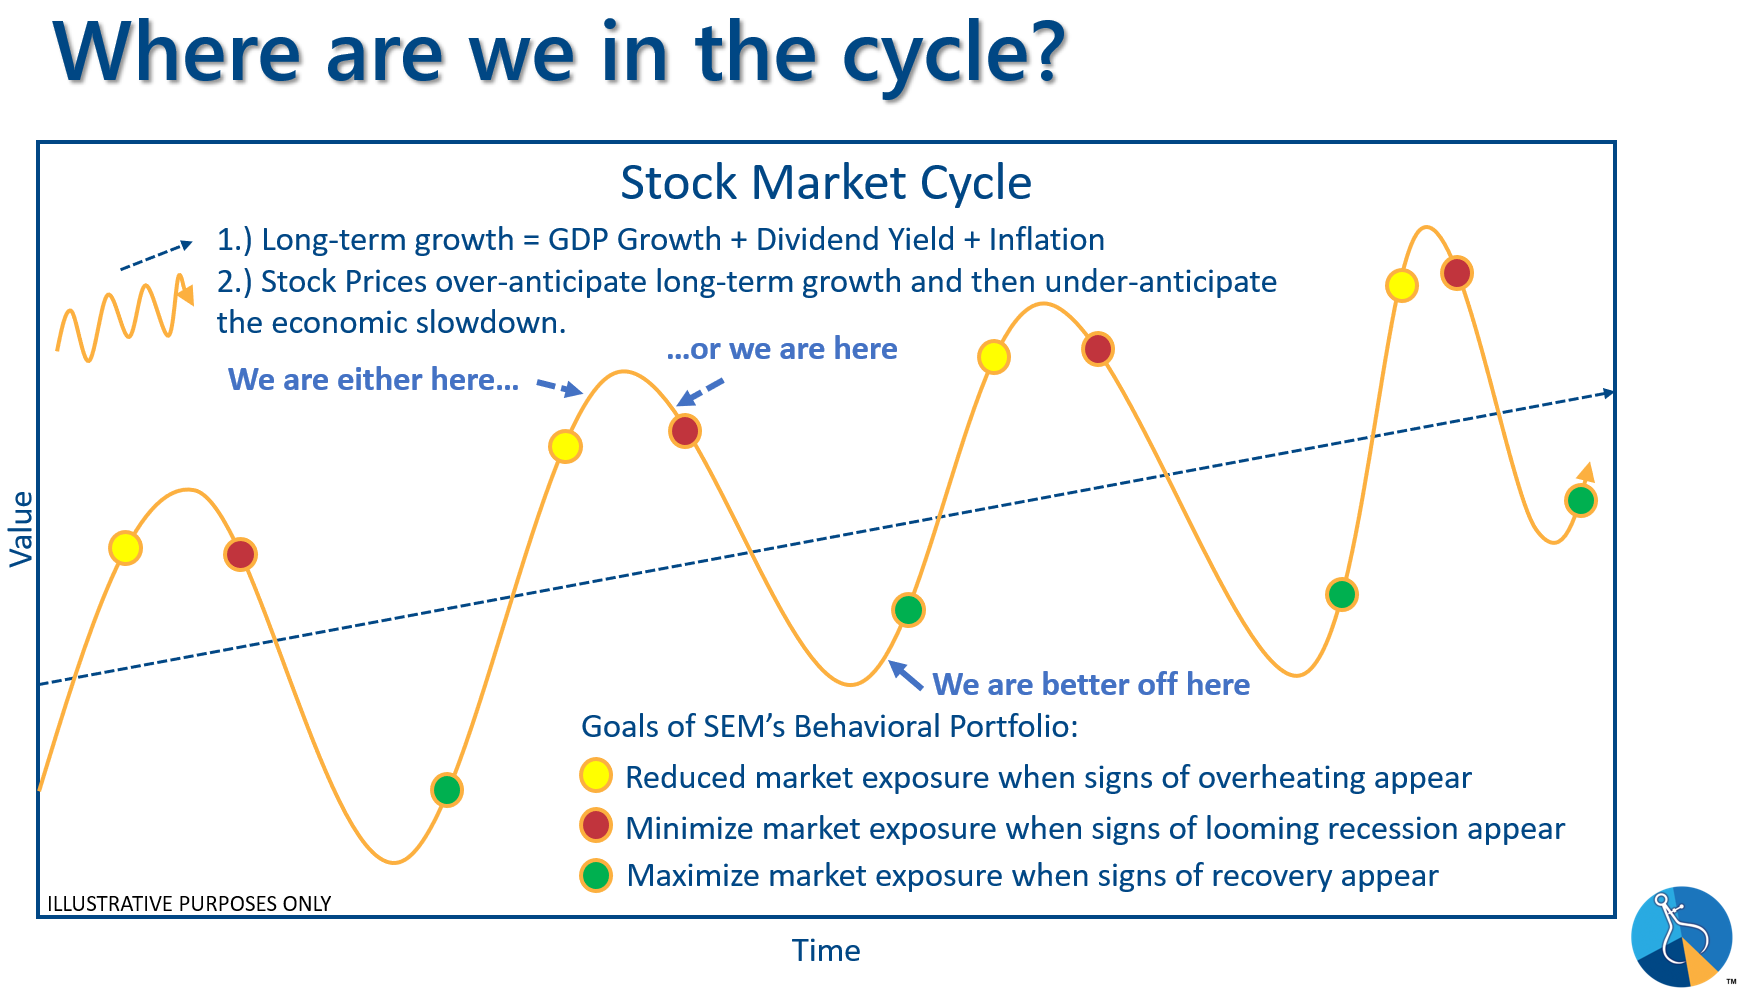
We obviously have periods of time where we've enjoyed above average returns and periods where we've had below average returns. This is where the human factor comes in – investors will be overly optimistic during good times and overly pessimistic during the down times.
Looking forward, the question is should we expect 10% annual growth for the stock market for the next 10 years? This requires some guess work on the inputs. Here is what the DATA says we should expect:
GDP Growth: 2.5% – We've struggled to reach the long-term average of 3% due to our trade and budget deficits. The budget deficit is getting worse, not better leading to increased interest expense. We are also spending over 50% of our budget on retirees (Social Security, Medicare, and Federal Government Pensions). From an economic perspective, that is an unproductive use of money and leads to lower growth.
Dividend Yield: 1.1% – with so much focus on earnings growth, few companies are paying dividends. The growth in the market the past 3 years has pushed this metric to one of the lowest yields on record.
Inflation: 3.0% – the Fed is targeting 2%, but the increasing government budget deficit, the aging population, increased health care spending, and the push to lower our trade deficit by using tariffs will make 3% inflation more likely than 2%.
This brings us to a long-term expected growth rate of:
GDP Growth (2.5%) + Dividend Yield (1.1%) + Inflation (3%) = 6.6%
As I often say, this doesn't mean we simply compound at 6% for 10 years instead of 10%, but instead go through a major correction (where expectations become overly pessimistic) and then spend the rest of the time recovering the losses.
Our goal is to have money ready to deploy when everyone becomes overly pessimistic. That's easier said than done, which is why we deploy quantitative systems to implement our strategies and do not rely on our subjective experience.
Download/Print version of the Newsletter

What is ENCORE?
ENCORE is a Quarterly Newsletter provided by SEM Wealth Management. ENCORE stands for: Engineered, Non-Correlated, Optimized & Risk Efficient. By utilizing these elements in our management style, SEM’s goal is to provide risk management and capital appreciation for our clients. Each issue of ENCORE will provide insight into investments and how we managed money.
The information provided is for informational purposes only and should not be considered investment advice. Information gathered from third party sources are believed to be reliable, but whose accuracy we do not guarantee. Past performance is no guarantee of future results. Please see the individual Model Factsheets for more information. There is potential for loss as well as gain in security investments of any type, including those managed by SEM. SEM’s firm brochure (ADV part 2) is available upon request and must be delivered prior to entering into an advisory agreement.


