

Writing a quarterly newsletter to summarize the past 3 months and look ahead at the next 3 months is never easy. It is especially difficult when you have as much happening as we do right now. Based on the market performance in the 1st quarter, you would think all of the news was bad.
Granted, most of the news wasn’t great, but the market has weathered negative news quite well over the past few years. The issue the market is facing now is that EXPECTATIONS for 2026 growth was even higher than 2025. Corporate earnings growth still appears to be strong, the labor market is still somewhat stable, and manufacturing appears to be picking up a bit. However, the headwinds for the market have also increased. This is causing investors to question the premiums they have been paying for growth stocks.
With the S&P 500 closing the quarter well off the early February highs, the next quarter could determine the direction for stocks the rest of the year. SEM will be monitoring the markets daily on behalf of our clients and advisors, allowing them to focus on the big picture and ignore what is sure to be a continuation of our already noisy environment.
The Value of Financial Planning
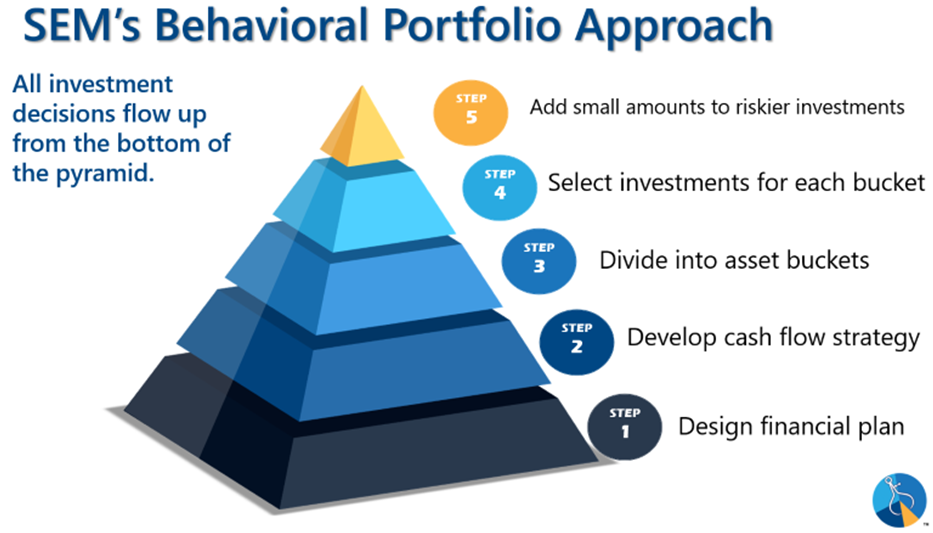
Over the past six months the value of financial planning has been apparent. The more the markets fluctuate from seemingly non-stop headlines, the more important it is to focus on the big picture and the end goal. SEM’s Behavioral Portfolio Pyramid highlights this with the foundation of every decisions starting with the Financial Plan. These plans do not have to be sophisticated, 50+ pages of paper (although some situations may call for this), but rather a roadmap for how much money is needed and how it will be used in the future.
Whenever somebody asks us whether we think they should increase (decrease) their allocation to stocks, our answer is simple – has your financial plan changed? If not, SEM’s customized investment portfolios were set-up to increase (decrease) the allocation to equities based on your customized financial plan, cash flow strategy, and risk personality. This is valuable in all markets, but especially in “noisy” ones like we have had the past few months.
If you would like a personalized review of your portfolio, go to Risk.SEMWealth.com
Headwinds to Overcome
Stocks are facing several significant headwinds. Here are the most important ones.
1.) Iran / Middle East / Oil
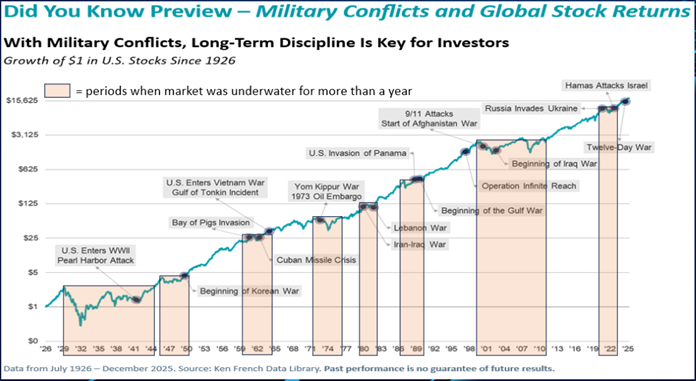
This is stealing the headlines for obvious reasons. From a history stand point, we’ve seen conflicts before & know they can impact stock prices and the economy, but not always in the way we might expect. Even if the war ends "soon", the more important issue will be what happens to the middle east oil supplies. Rather than predicting the outcome, we will stick to the data to determine whether we need to make adjustments to our portfolios.
2.) AI / Data Center Growth
Our fall newsletter was titled “AI: Boom, Bubble, or Both”. Our conclusion was “both”. Since last November, market participants have been anxious about the growth prospects of some AI-related businesses, the massive amounts of spending, questions surrounding revenue, and how these projects will be financed. This is typical whenever we see major innovations. As always, rather than predicting the outcome, we will stick to the data to determine whether we need to make adjustments to our portfolios.
3.) Inflation & Interest Rates
Even before the War in Iran started, inflation was trending higher. It wasn’t the runaway inflation we saw in 2022, but it had stopped going down and was heading back towards 3%. The thought 6 months ago was the Federal Reserve would be cutting interest rates throughout 2026. Instead interest rates have gone higher, creating a difficult environment for both consumers and businesses.
4.) Recession?
SEM’s Economic Model was predicting a slowdown during the 2nd half of 2025. That slowdown did not occur due to the heavy capital expenditures on AI, in particular the data centers necessary to meet the increasingly high processing demands to implement AI solutions. With some of that spending and the financing behind it now being questioned, there is a growing concern the economy could fall into recession later in the year. The data isn’t quite showing that slowdown just yet, but it is something we are hearing about more and more. As always, rather than predicting the outcome, we will stick to the data to determine whether we need to make adjustments to our portfolios.
5.) Human Nature
Our own emotions and natural biases are always there. What we know from studying the data is these reactions are much more magnified when a longer-term trend begins to shift. The “uncomfortable” feeling of growth not meeting expectations and “new” information coming along threatening our outlook can lead to investors making big adjustments to their portfolios. This is the primary reason SEM follows a data driven approach. Rather than predicting the outcome, we will stick to the data to determine whether we need to make adjustments to our portfolios.
Bonus Content: More on the Market Headwinds
Headwind #1: Iran / Middle East / Oil
As noted in the main article, this is something which cannot be predicted. This is obviously a very fluid situation which will have longer-term consequences. The price of oil is clearly one of the more important drivers of inflation. If it remains sustainably high, it will filter down to a long list of industries, hurting both growth and consumer spending. Manufacturers are already seeing an impact, with the March Prices Paid component showing the highest levels since 2022.
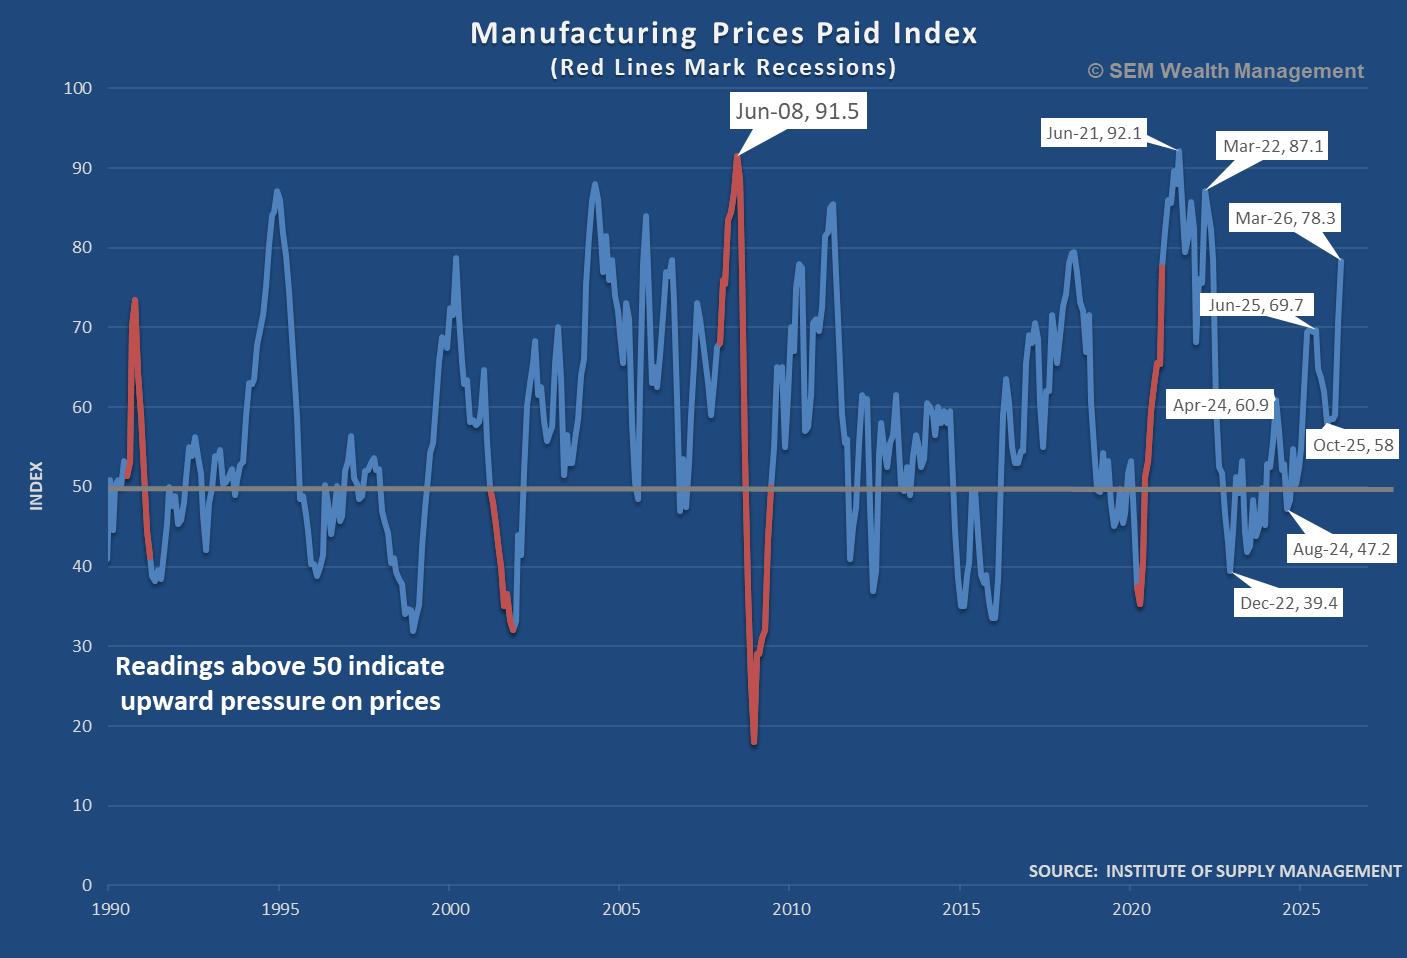
It's not so much the timing of when the war with Iran ends, but instead how soon oil prices begin to ease.
Headwind #2: AI / Data Center Growth
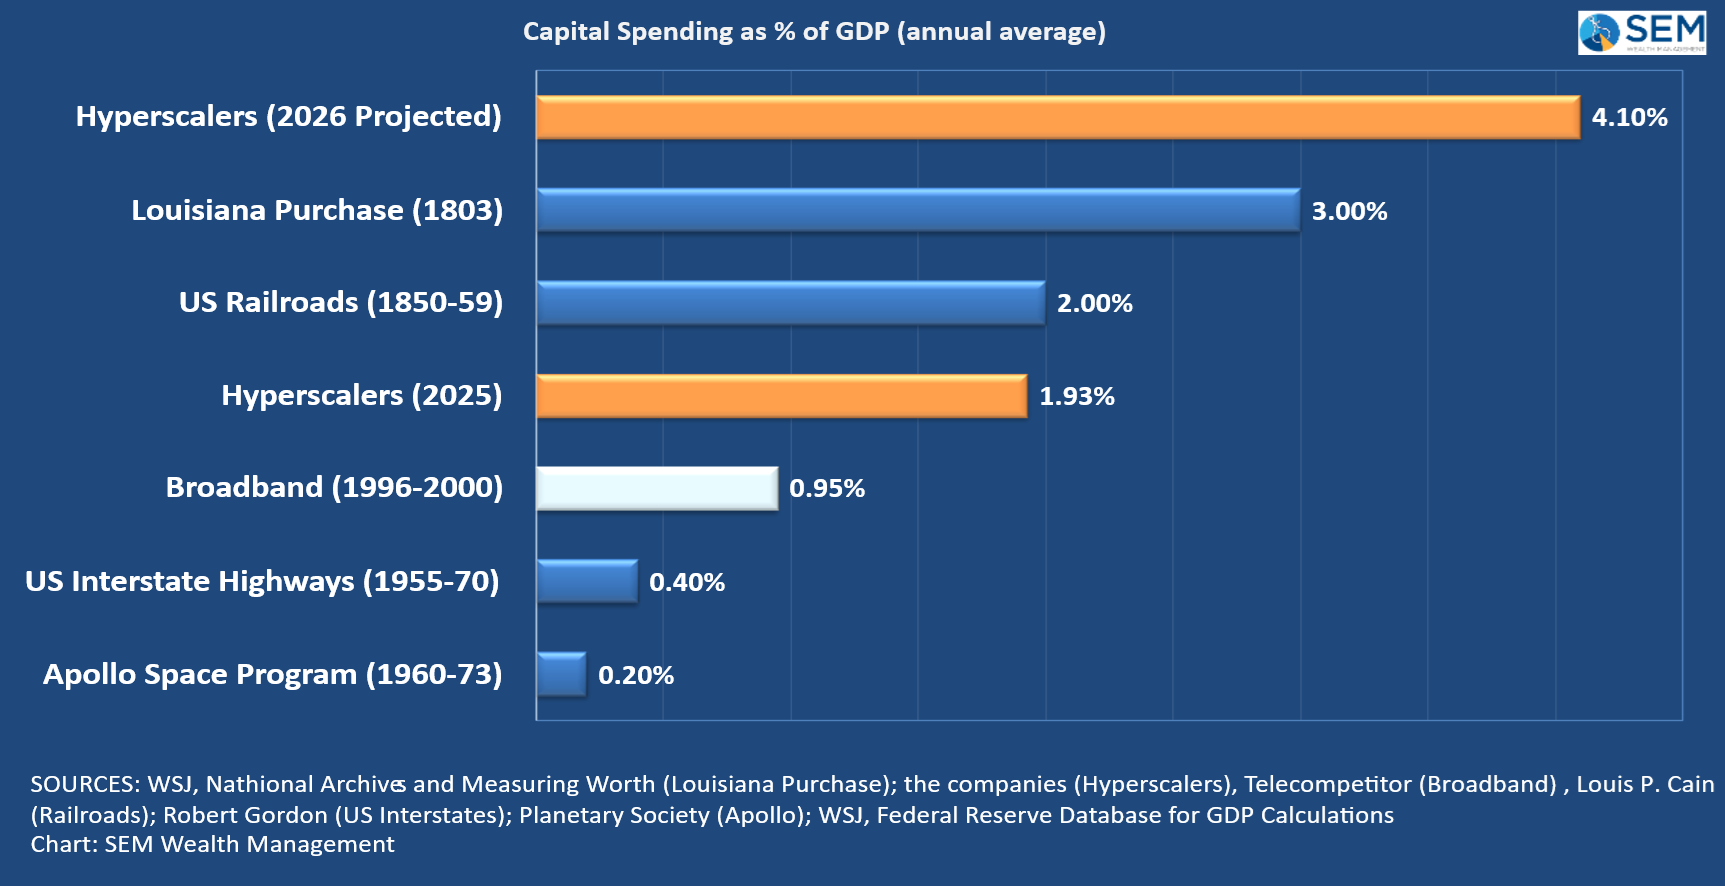
Since the launch of Chat GPT by OpenAI in 2023, we've witnessed an unprecedented amount of spending by just a handful of companies. These so-called "hyperscalers" are Amazon, Alphabet (Google), Microsoft, and Meta (Facebook/Instagram). In 2025 alone, they spent more than all technology companies spent on the Broadband Internet rollout from 1996-2000.
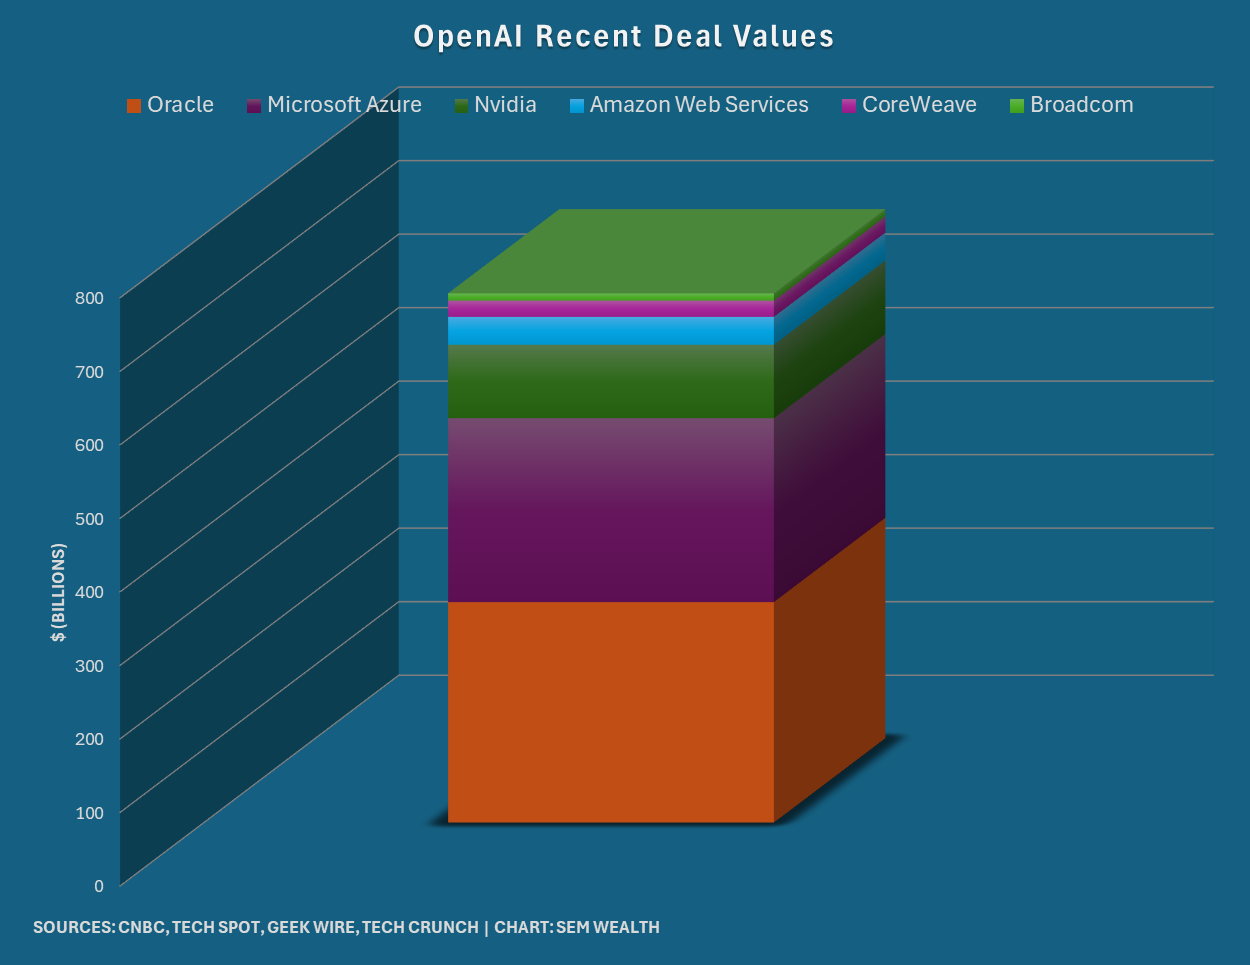
For the early part of the spending, the vast amount of money was coming from their "free cash flow". We began talking about this in our Fall 2025 Newsletter with the title "AI: Boom, Bubble, or Both?" and have continued throughout the months since then. One of the things we identified was the "circular" financing behind every deal Open AI was announcing. In November we posted this chart documenting the commitments Open AI had made since the spring. A whopping total of $700B.
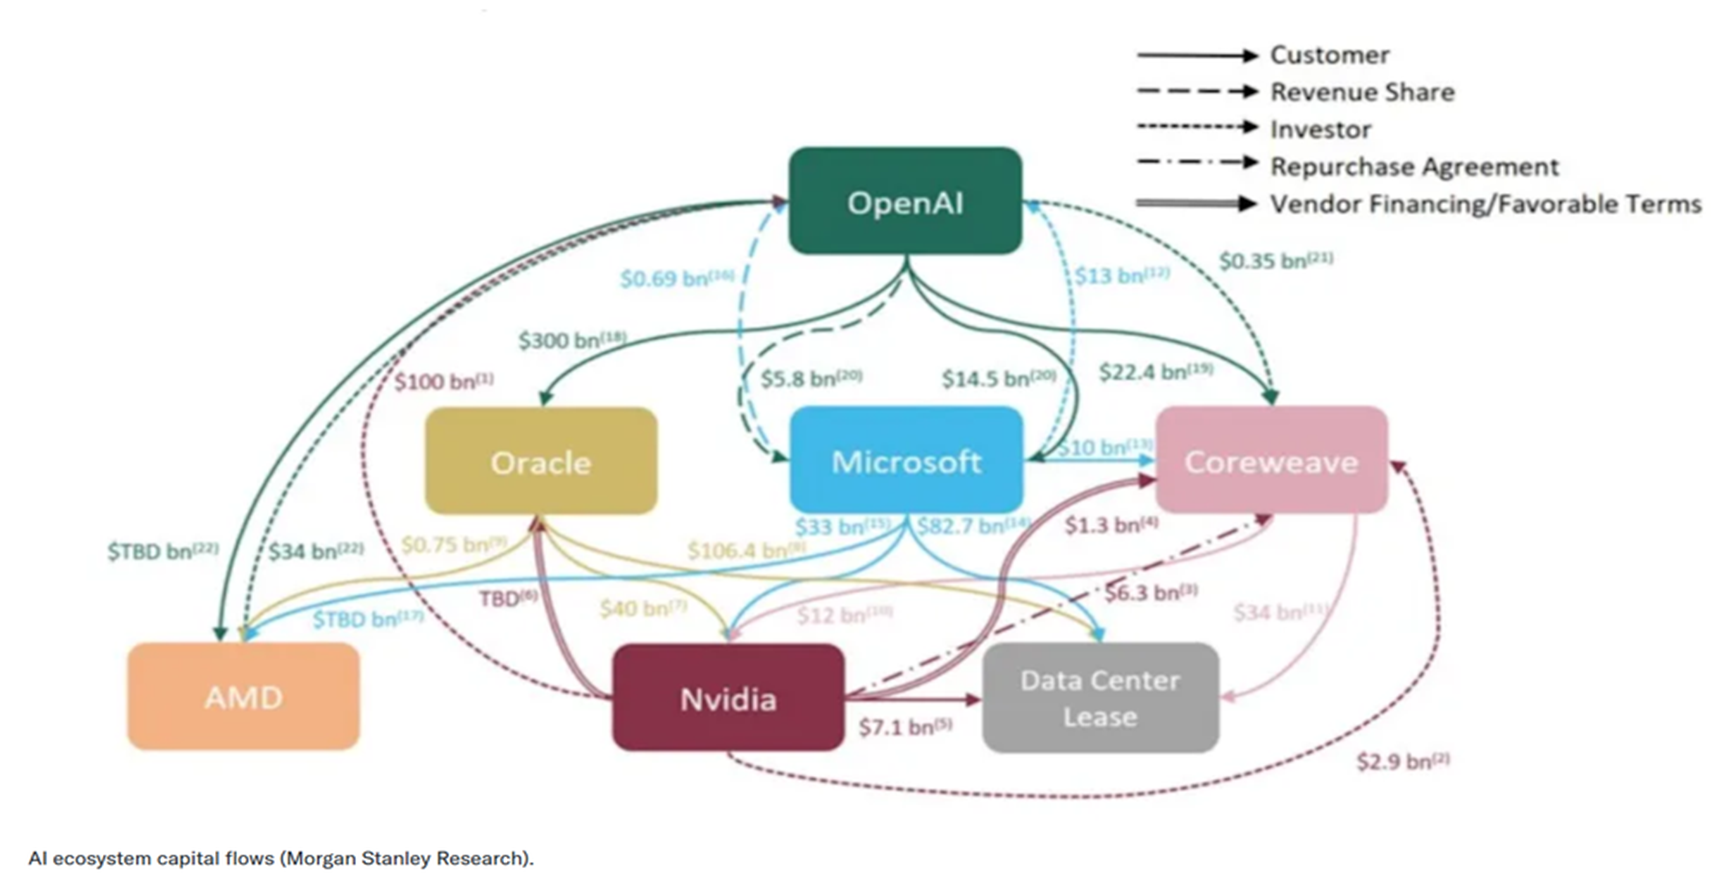
In nearly all cases, Open AI wasn't actually buying the products with actual cash, but in exchange for stock in the company (which is not yet public). Here was a Morgan Stanley diagram we posted to illustrate this web:
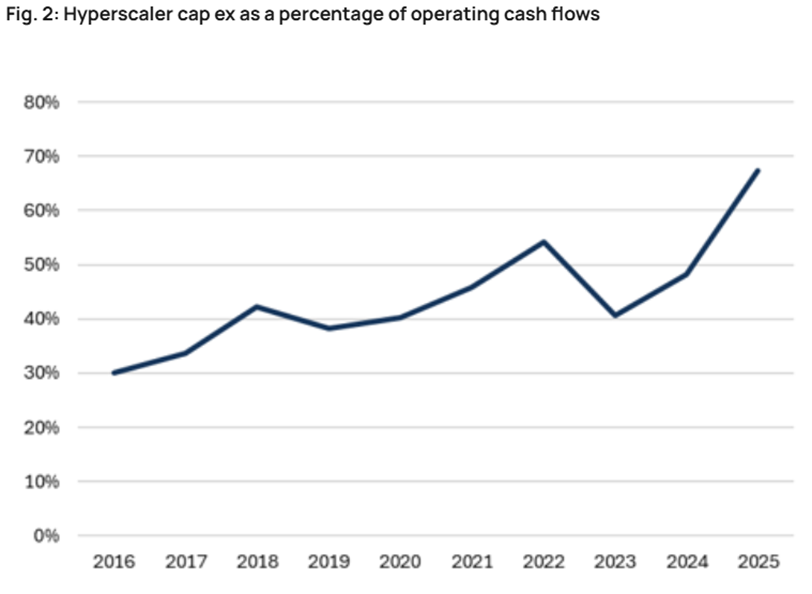
Since the Hyperscalers weren't actually receiving cash for their products, the amount of free cash flow being absorbed increased significantly.
This led to some "creative" financing, which we illustrated in the blog:
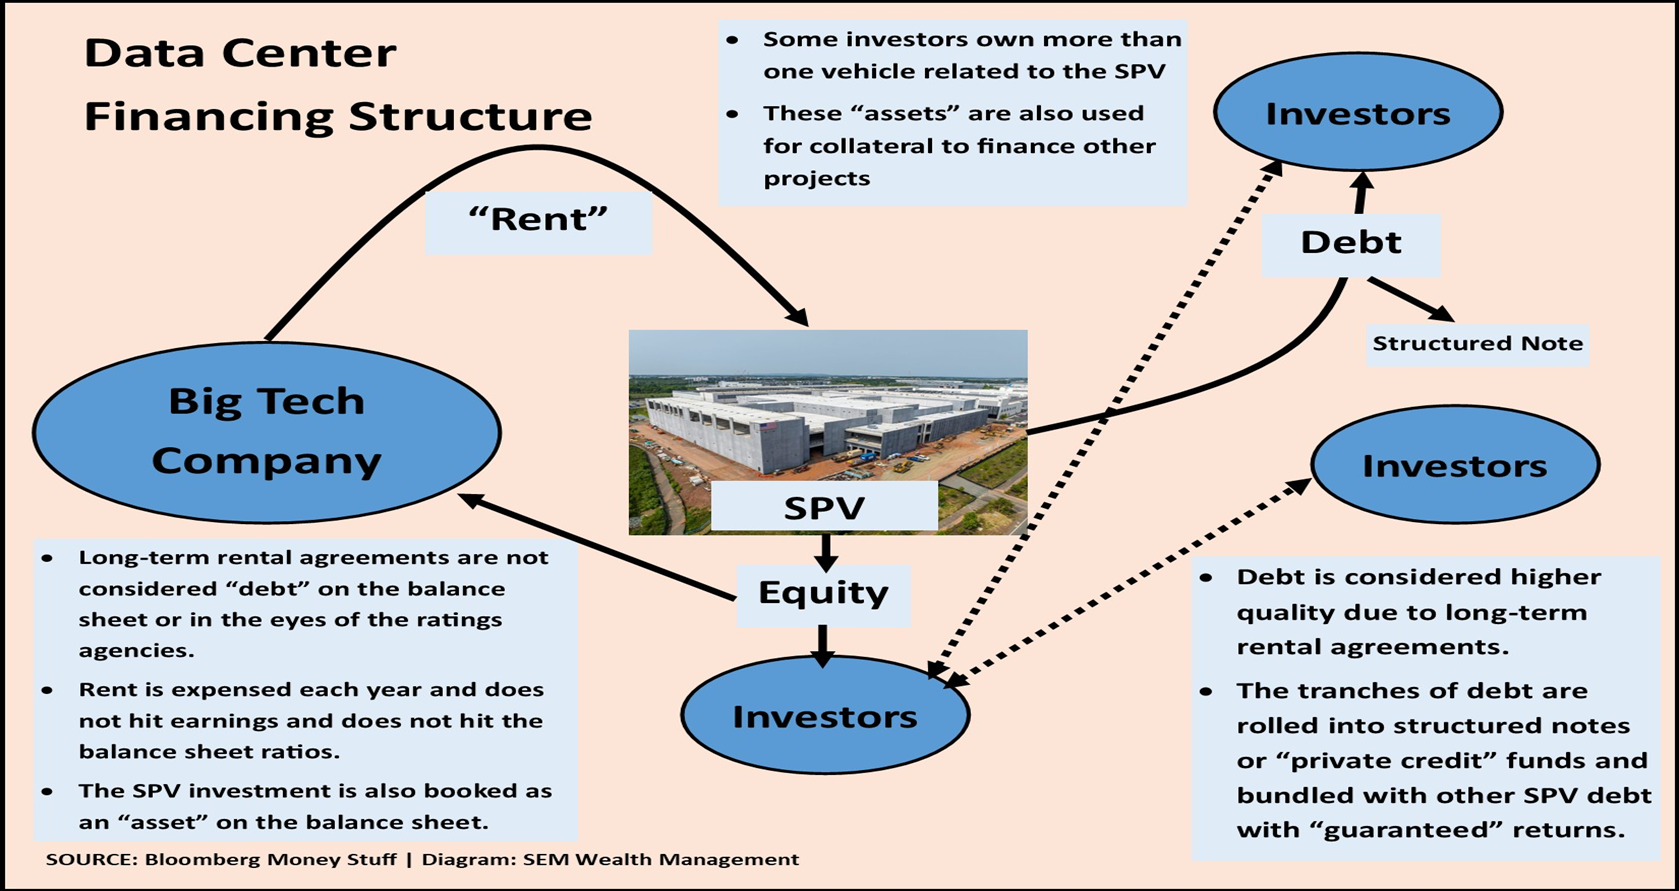
The idea of this financing structure was to keep debt off of the balance sheets of the Hyperscalers and instead convert it to an asset via the "investment" in the "Special Purpose Vehicle". This is where the link between private credit and AI became a problem (see sidebar below).
As the spending on data center's was called into question, the stocks of the Hyperscalers have taken a hit as investors have been questioning when all of the spending will turn into meaningful and sustainable revenue.
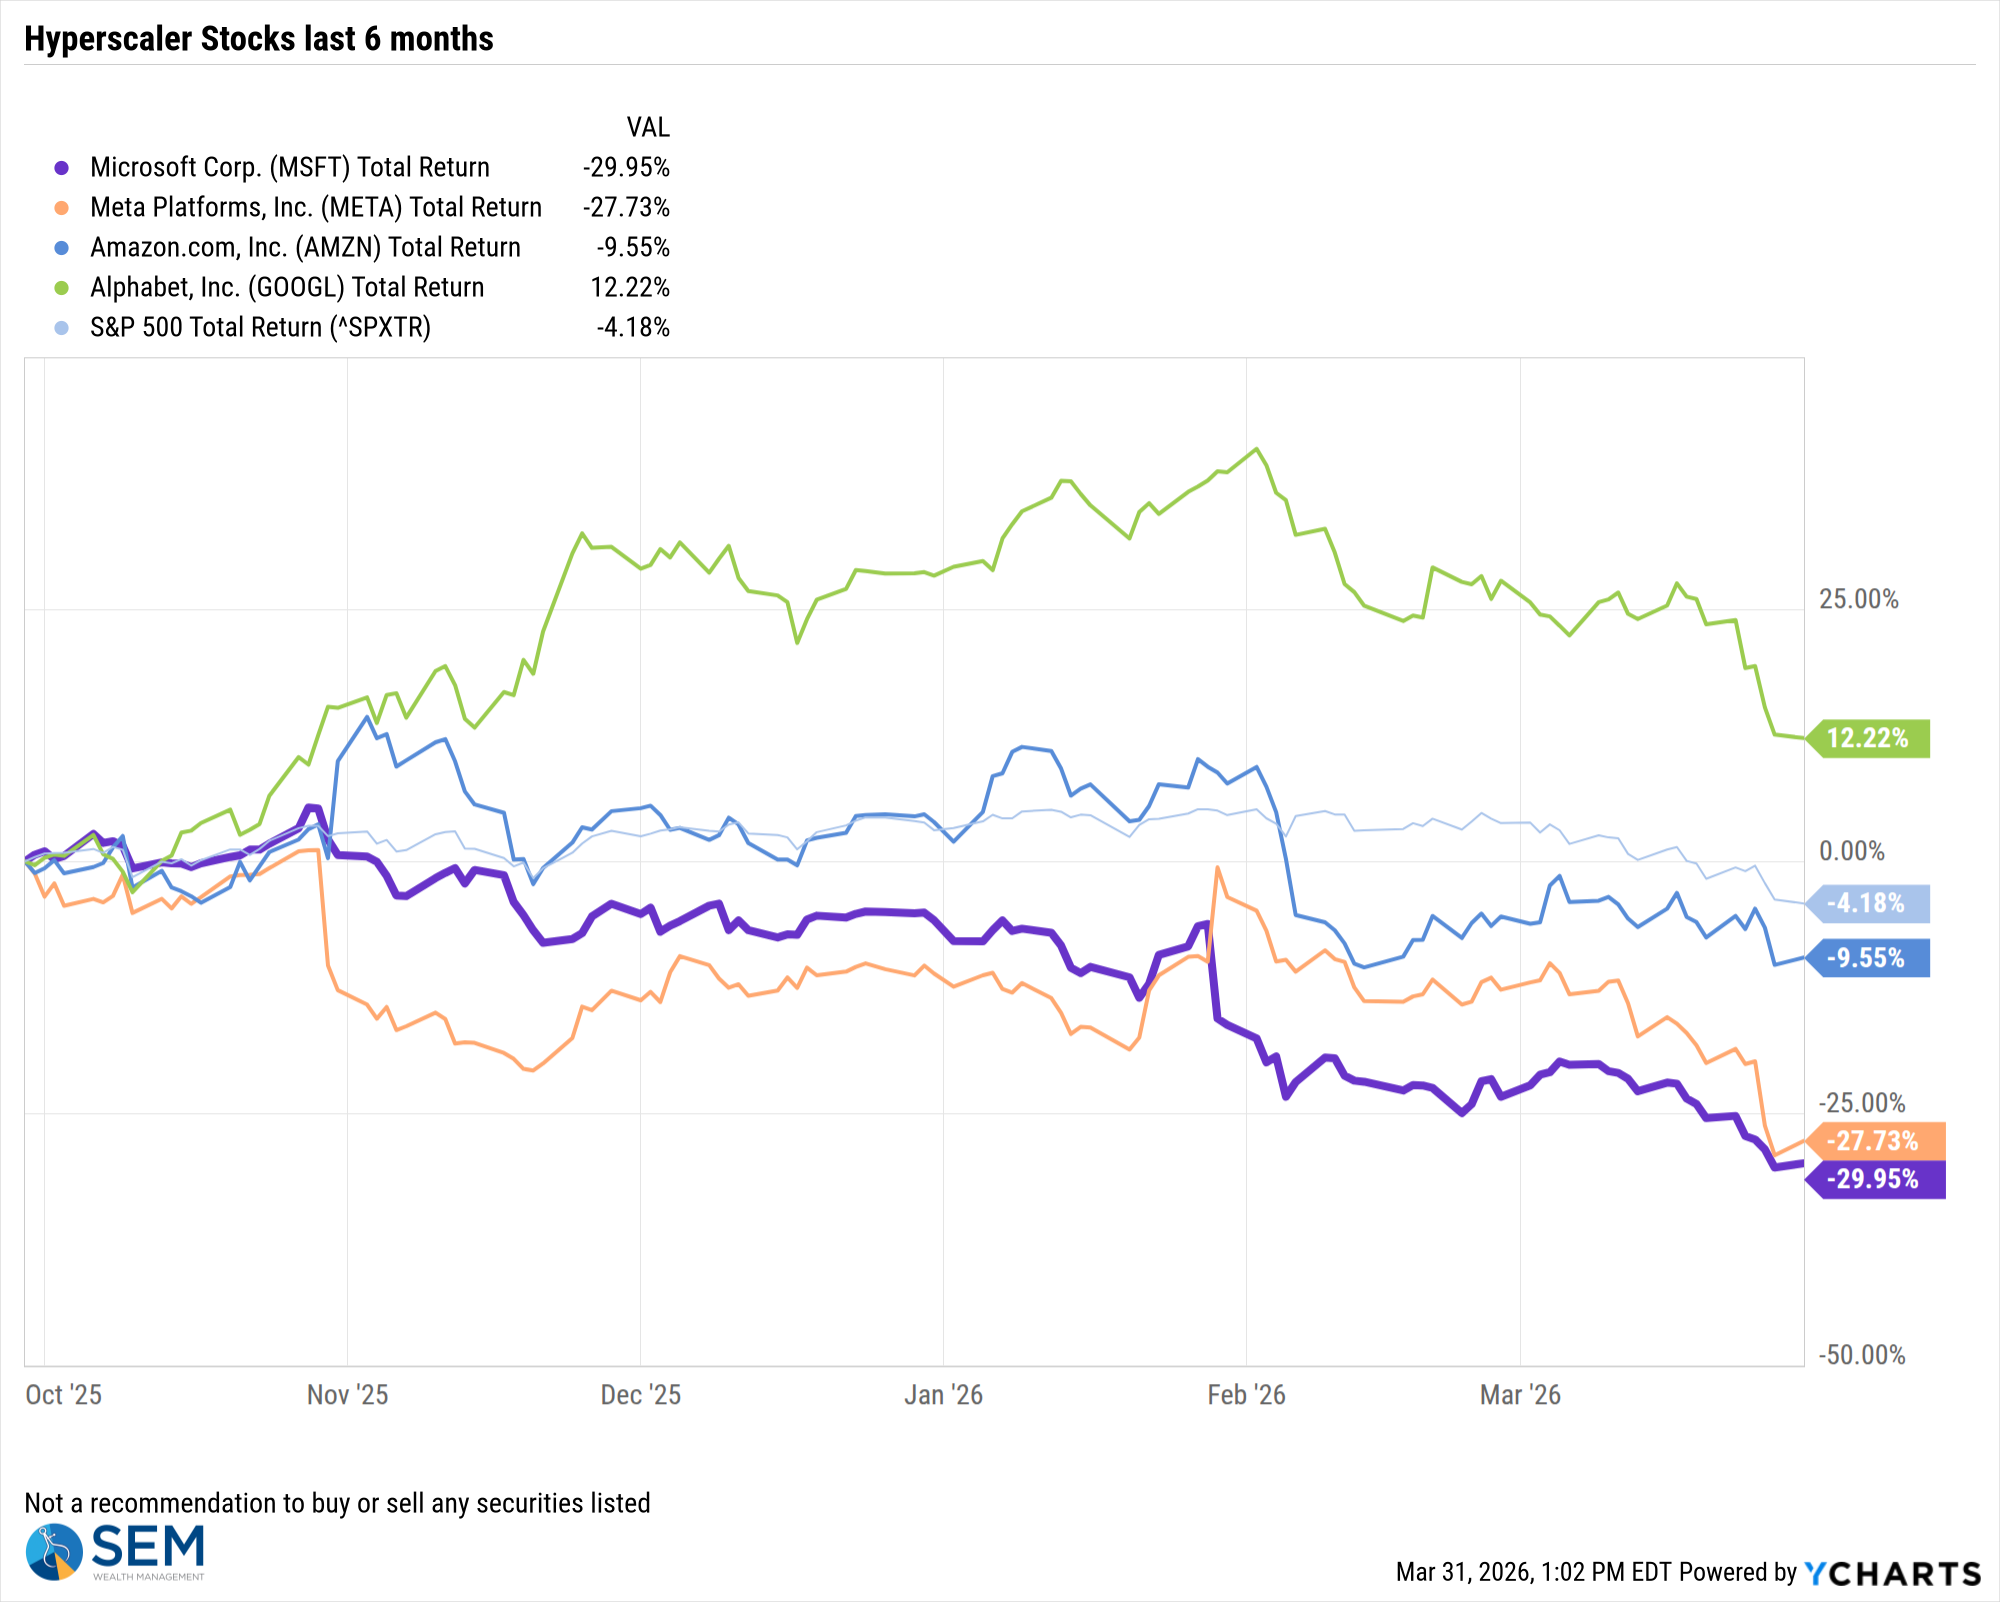
This may be just a normal, temporary pause in what will still be a major structural change, but it could also be a sign the spending on AI was overdone (for now) and investors are now adjusting their expectations.
Sidebar: What is Private Credit?
There has been much discussion in the media about private credit and "liquidity" concerns. This has led to questions about private credit, what it is, and what is happening.
While there are a wide range of offerings in the private credit markets, private credit is basically when businesses borrow money directly from investors instead of issuing bonds or going to a bank. Public bonds are similar to loans, but are issued to investors on the open market, while private credit is a behind‑the‑scenes loan with custom terms, usually held by investors until it’s paid back.
Since these are loans, there are strict terms which lock-up the money for specific periods of time. Most of these funds allow quarterly redemption periods, but limit the total which can be redeemed (usually around 5% of the fund.) With the news about some loans held inside of some more well known private credit funds defaulting, there has been growing concern about how many other loans might default. This has caused investors to ask for more money than the funds could handle, causing them to take action to limit withdrawals.
We've detailed several of these instances in the blog throughout the last quarter. Unless you are invested in a private credit fund already, understanding the issues inside these funds is not important. What is important is knowing that problems with the private credit market COULD impact the pace of the AI/Data Center build-out which has been a key driver of economic and market growth over the past couple of years.
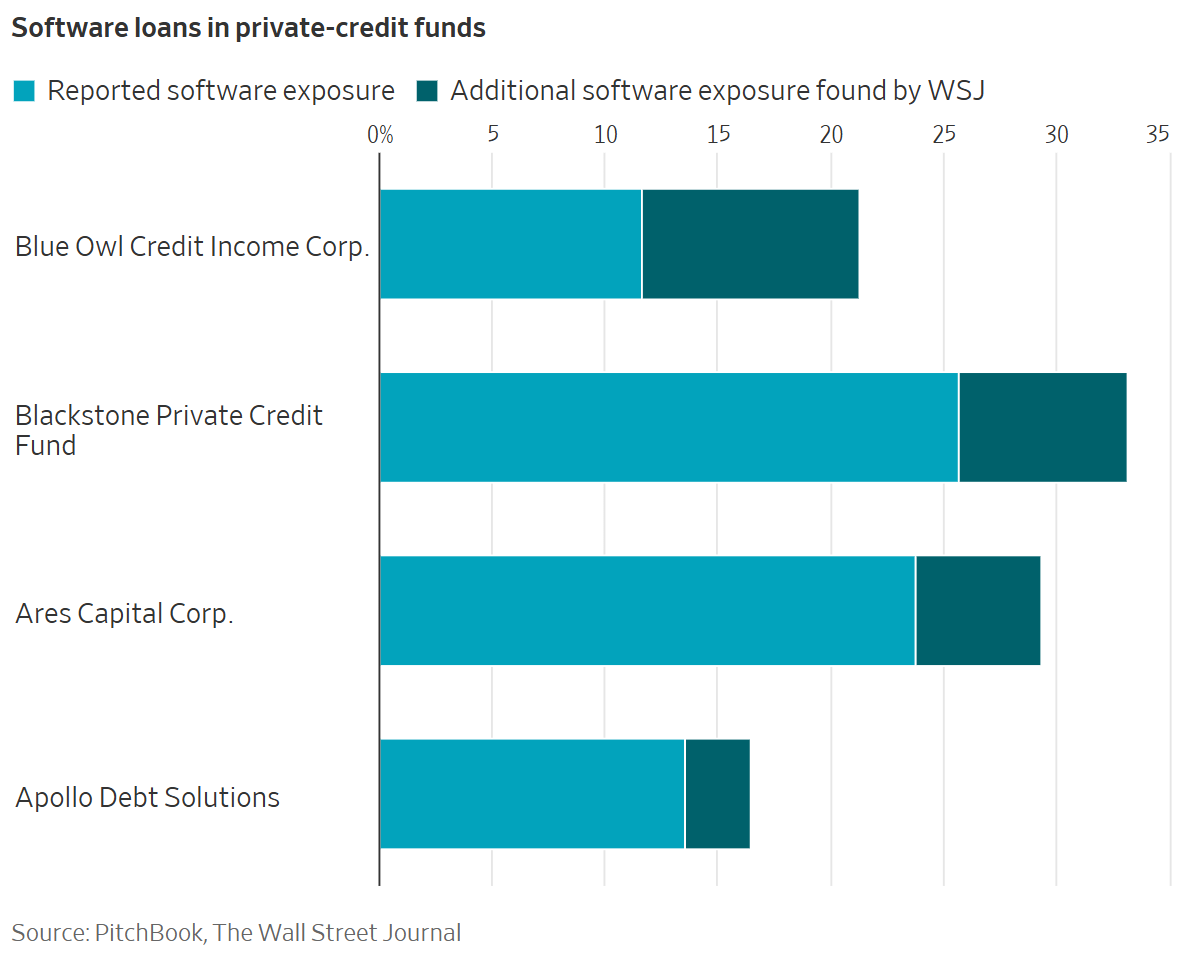
Interestingly enough, software companies, who were thought to be beneficiaries of AI have come under pressure as AI tools such as Claude are thought to now be a threat to many of the largest software companies in the industry. Many of the private credit funds have heavy exposure to this software space. The Wall Street Journal found that the disclosure of their exposure varied widely, but in all cases, the largest funds have underreported the amount of loans they have to software companies.
Private credit has grown by 5x since 2009 to an estimated size of $1.5 Trillion. This is nearly the same size as the high yield bond market and now bigger than the sub-prime mortgage market was in 2007 before the Financial Crisis. [Note: the Financial Crisis was not caused by the existence or size of sub-prime mortgages, but the tangled web of derivative products.] Whether or not this turns into a bigger problem will depend on a lot of factors, including how much exposure the Wall Street banks have to these funds.
Headwind #3: Inflation and Interest Rates
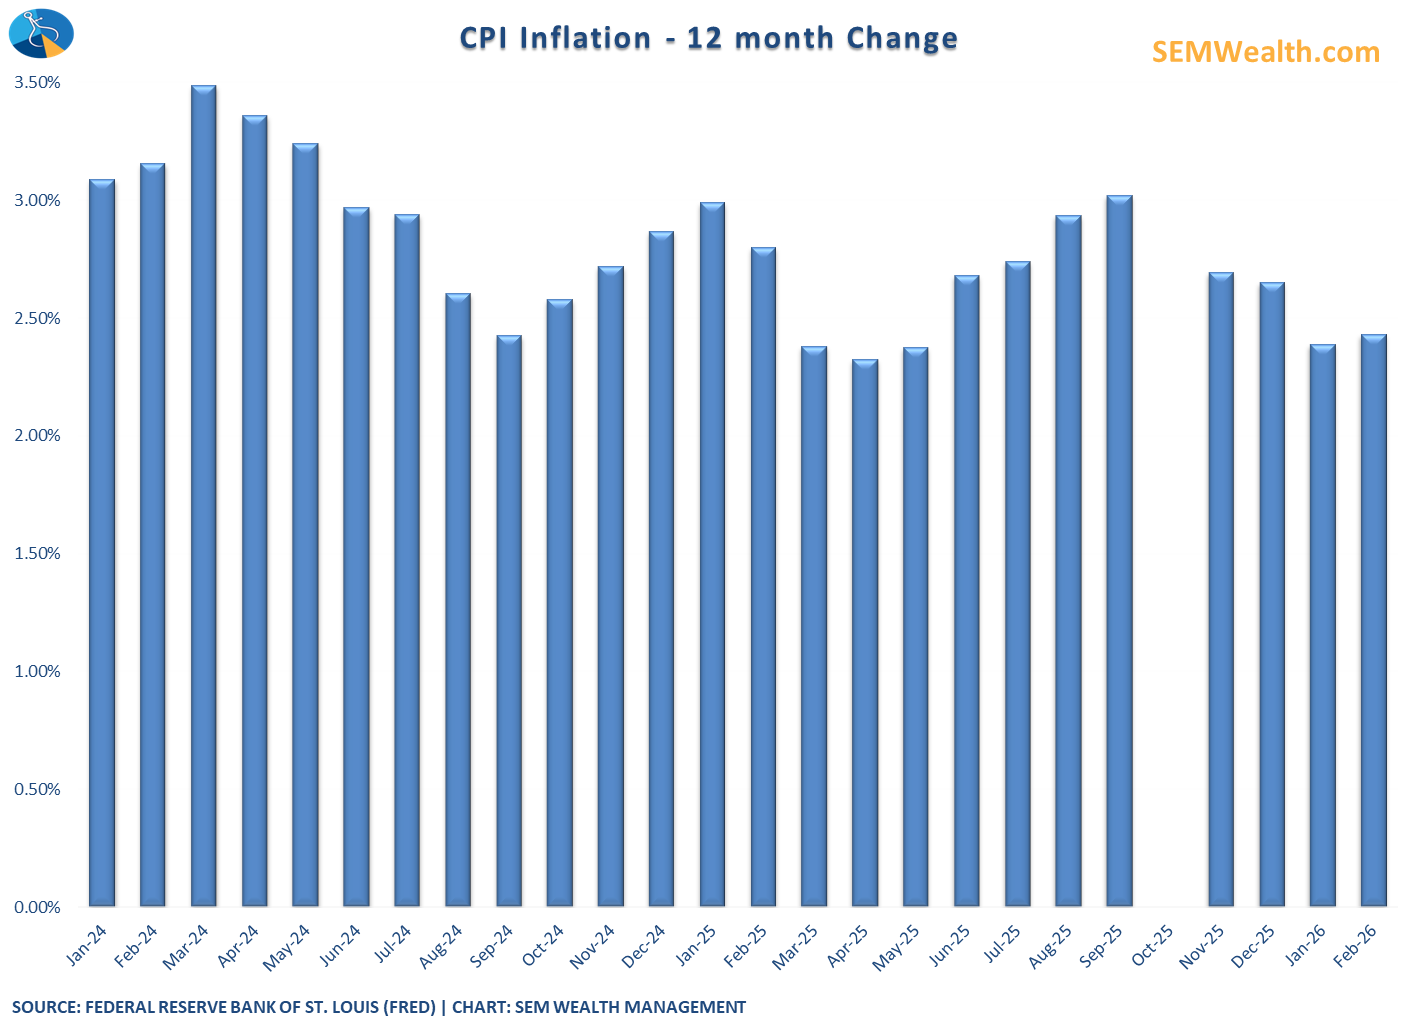
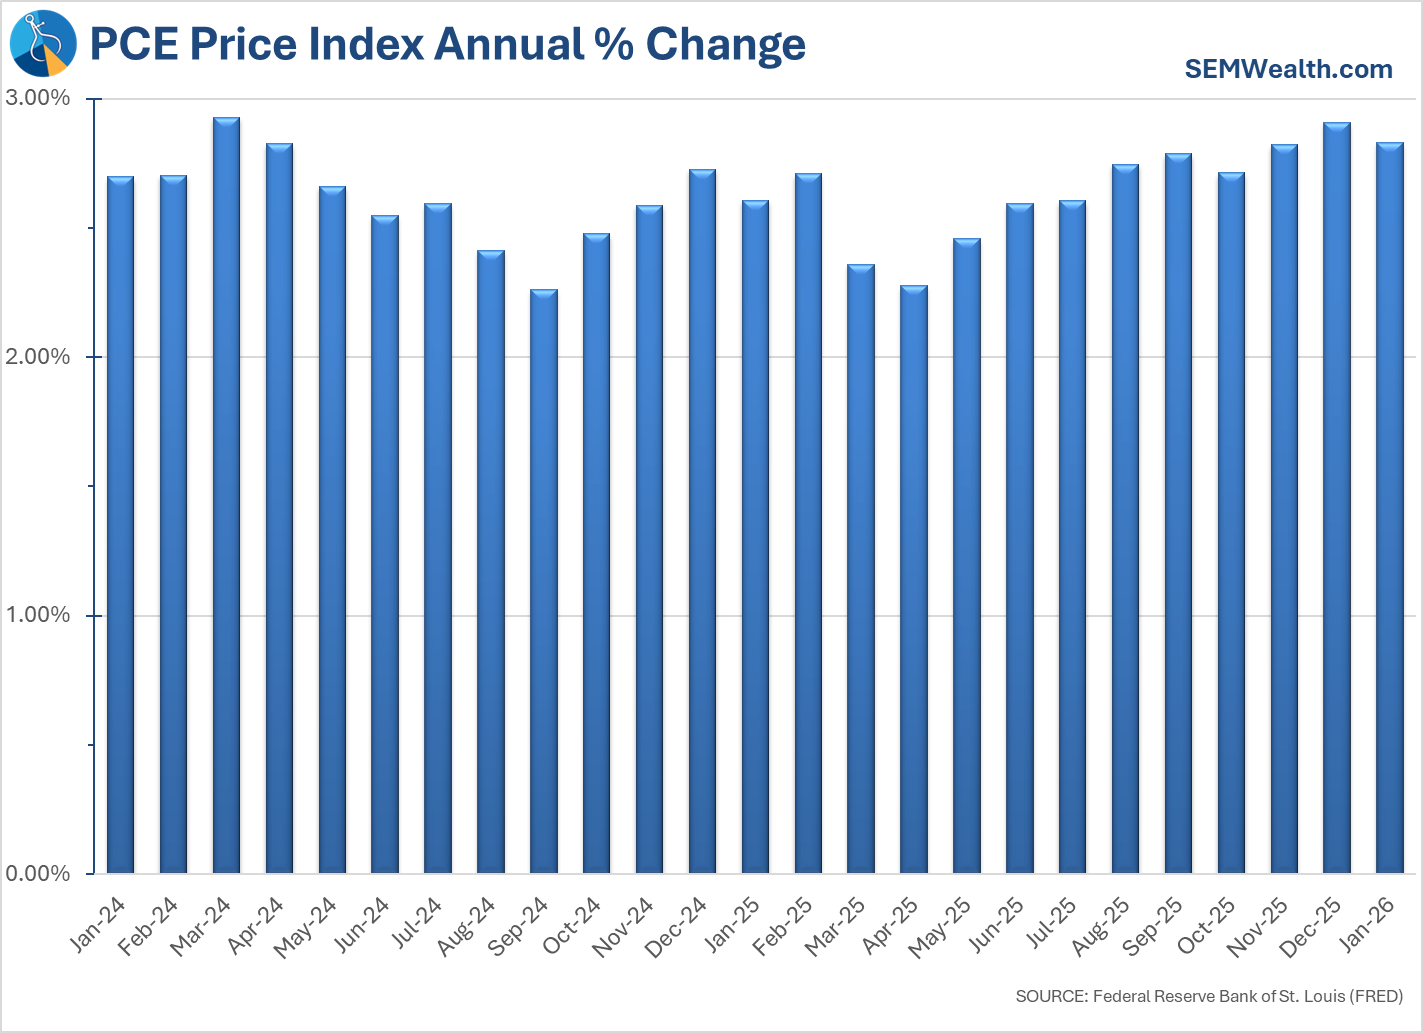
Going into the year, the thought was inflation would continue trending towards 2%, which would allow the Federal Reserve to cut interest rates multiple times. Unfortunately that has not been the case and the rate of inflation is still running closer to 3% than 2%. There are 2 measures of inflation. The Consumer Price Index (CPI) is the most popular metric used in the media, but it has some flaws which make it more volatile and much less reliable to set economic policy. This chart shows the annual change since the beginning of 2024.
A more robust measurement, and the one the Federal Reserve uses is the PCE Price Index. Unlike CPI, the trend is not lower.
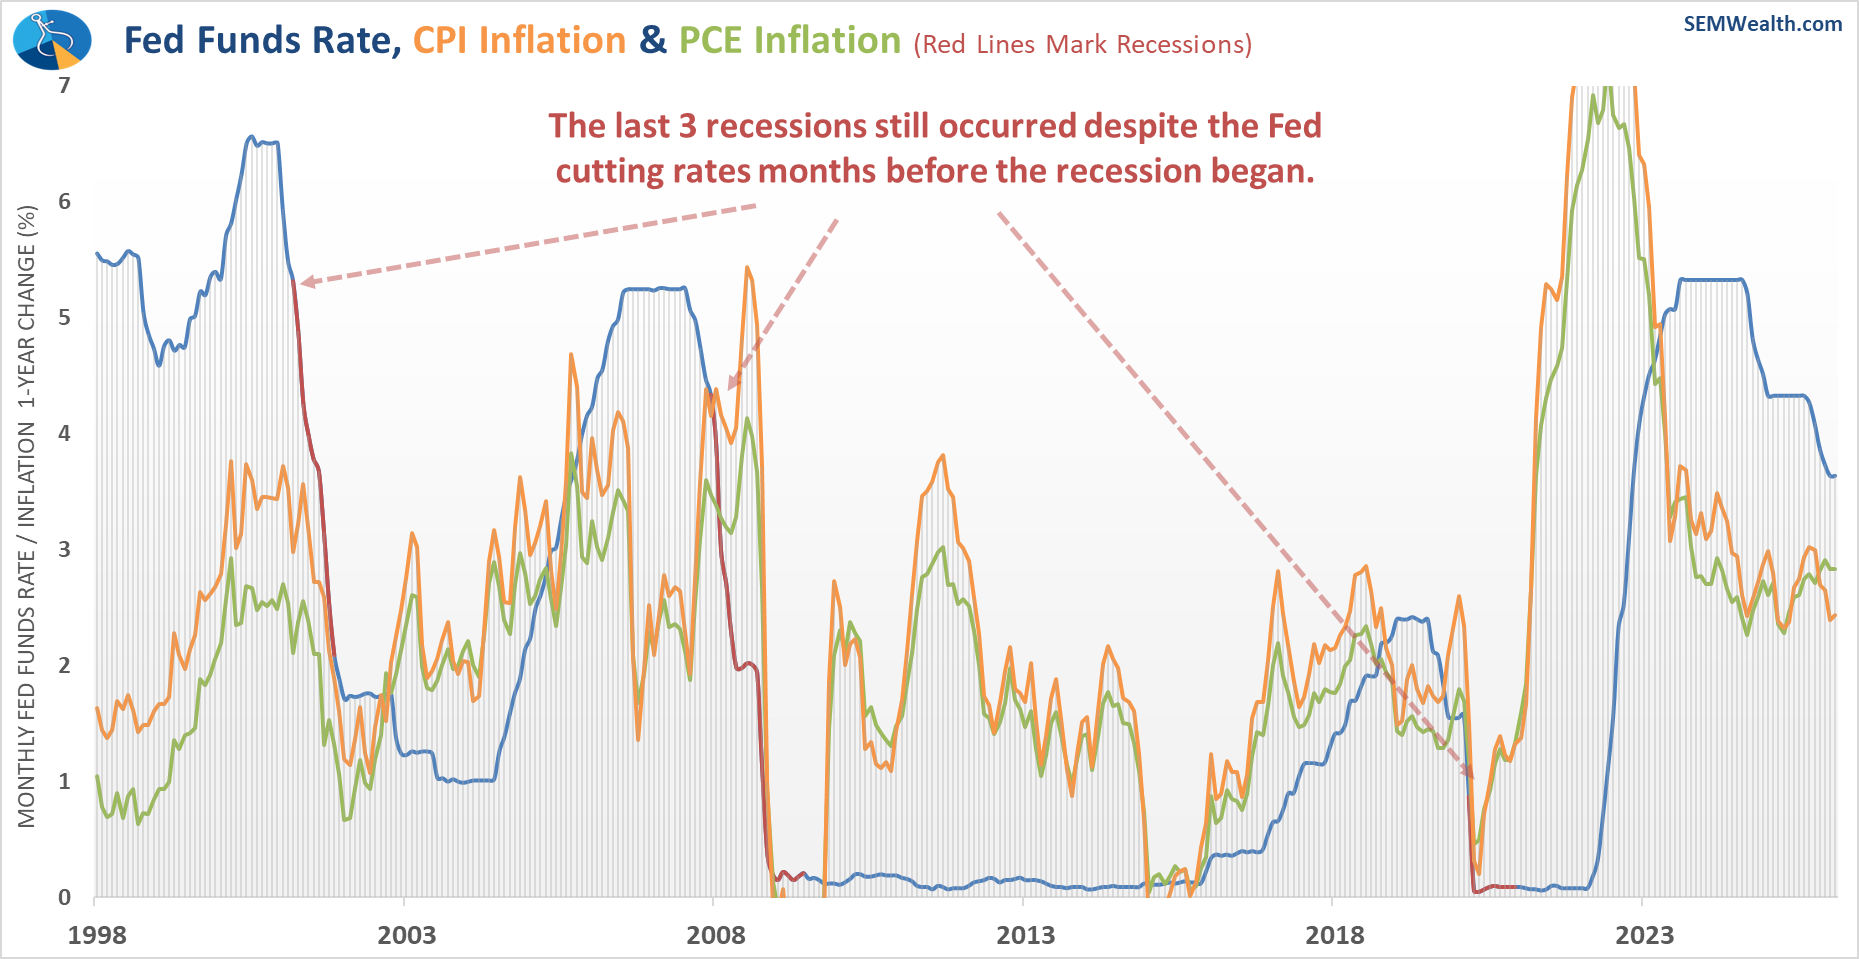
The Fed has now taken a "pause" on cutting rates. One thing I think is important to understand is the fact the Fed has both been historically wrong about the direction of inflation and unable to prevent a recession. This chart overlays the Fed Funds rate (blue line with red lines marking recessions) with the CPI and PCE annual changes. A drop in the Fed Funds rate signals when the Fed was cutting rates (easing) and a rise shows when they were raising rates (tightening).
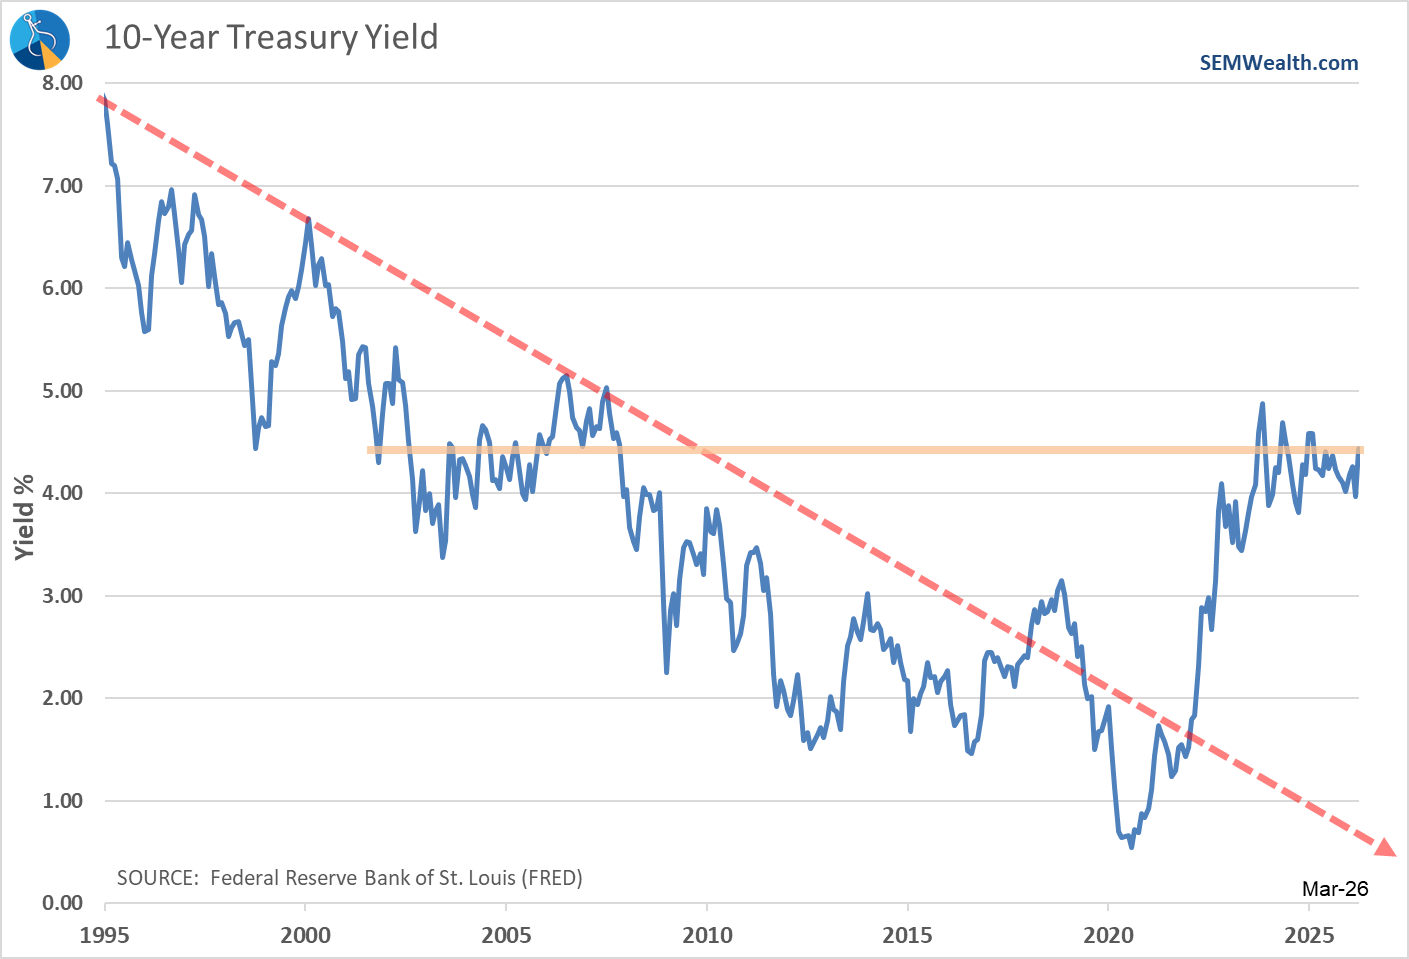
Another misunderstanding is the fact the Federal Reserve only controls SHORT-TERM interest rates, which are used mostly by businesses, while the bond market sets LONG-TERM rates, which impact consumers on things such as mortgages and car loans. Long-term rates have been rising this year, which could cause a further drag on economic growth.
Headwind #4: Recession?
Both of the first two headwinds can impact the economy. We've already witnessed wide swings in economic growth the past 5-6 years. When you combine this with the "spin" the various media outlets put on the data, you get some confusion about what is actually happening.
One point of confusion has always been the "official" GDP growth number. It has very wild swings because it is the only indicator where the last 3 months are essentially multiplied by 4 to give an "annual" number. The chart below shows the "official" release in orange, with the actual 1-year growth marked by the blue line.
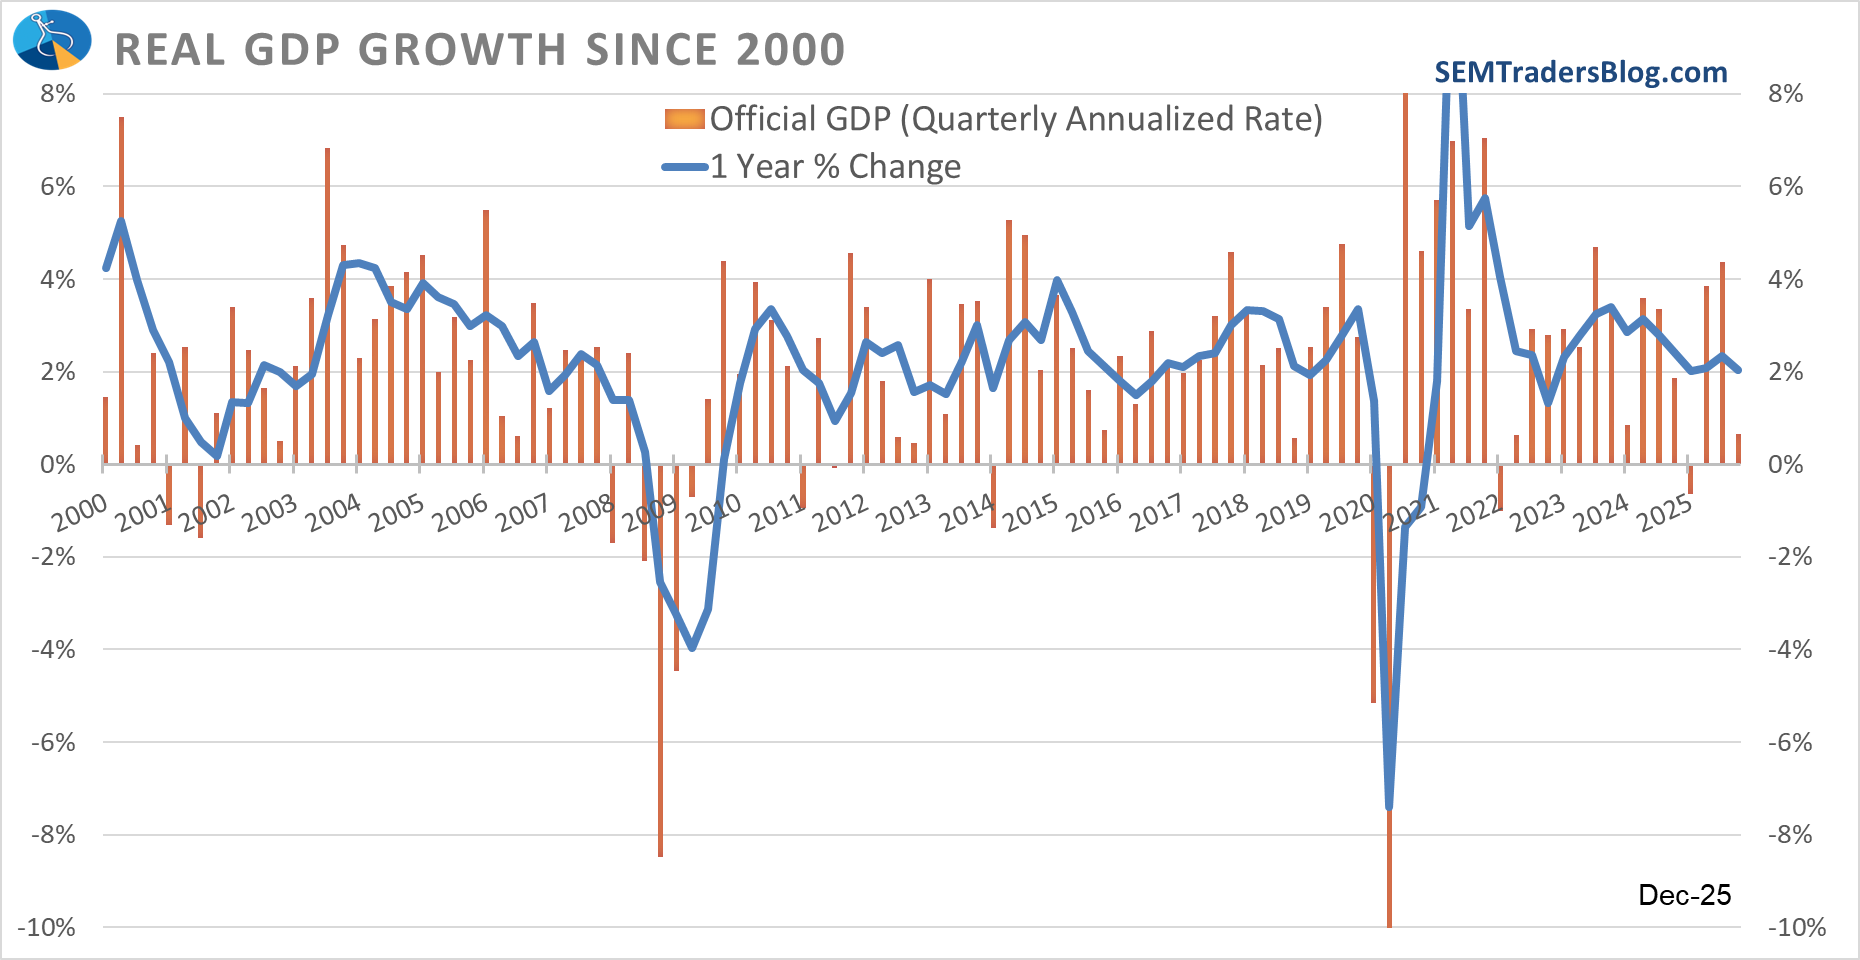
Taking out the noise and focusing on the 1 year growth numbers, we see a problem — with the exception of the post-COVID recovery, there have been very few consecutive quarters where the economy has grown at an ABOVE average rate. The last time was in June-December 2023. During President Trump's first term, we only hit that mark in January-June 2018 and again in October-December 2019.
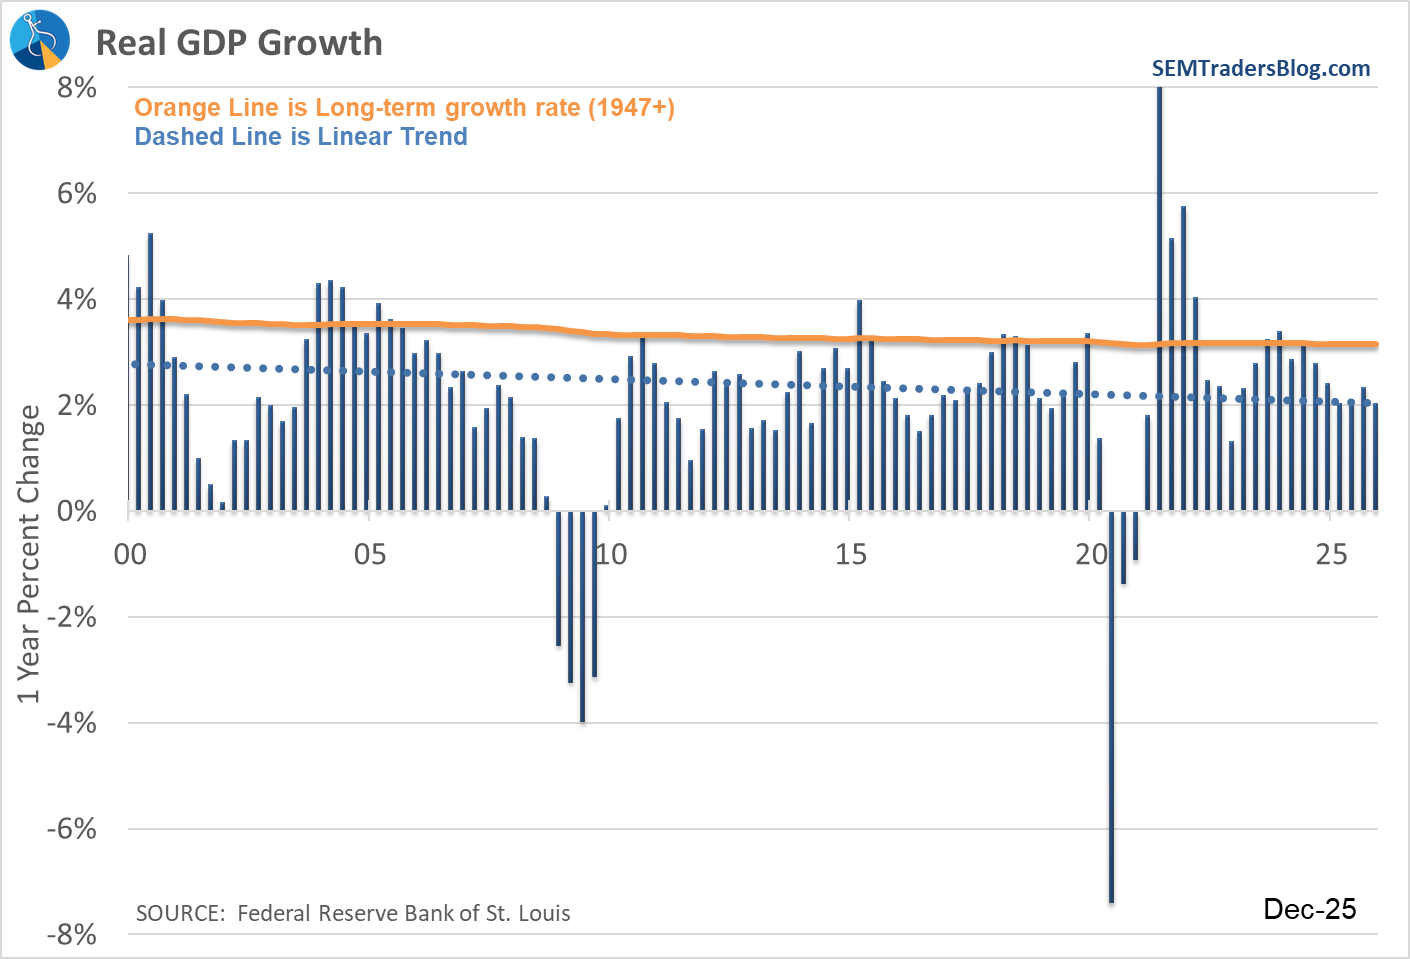
The lack of above average growth is a LONG-TERM, STRUCTUAL problem we will have to address in the coming years. Focusing more on the current outlook, there are a few key datapoints to watch.
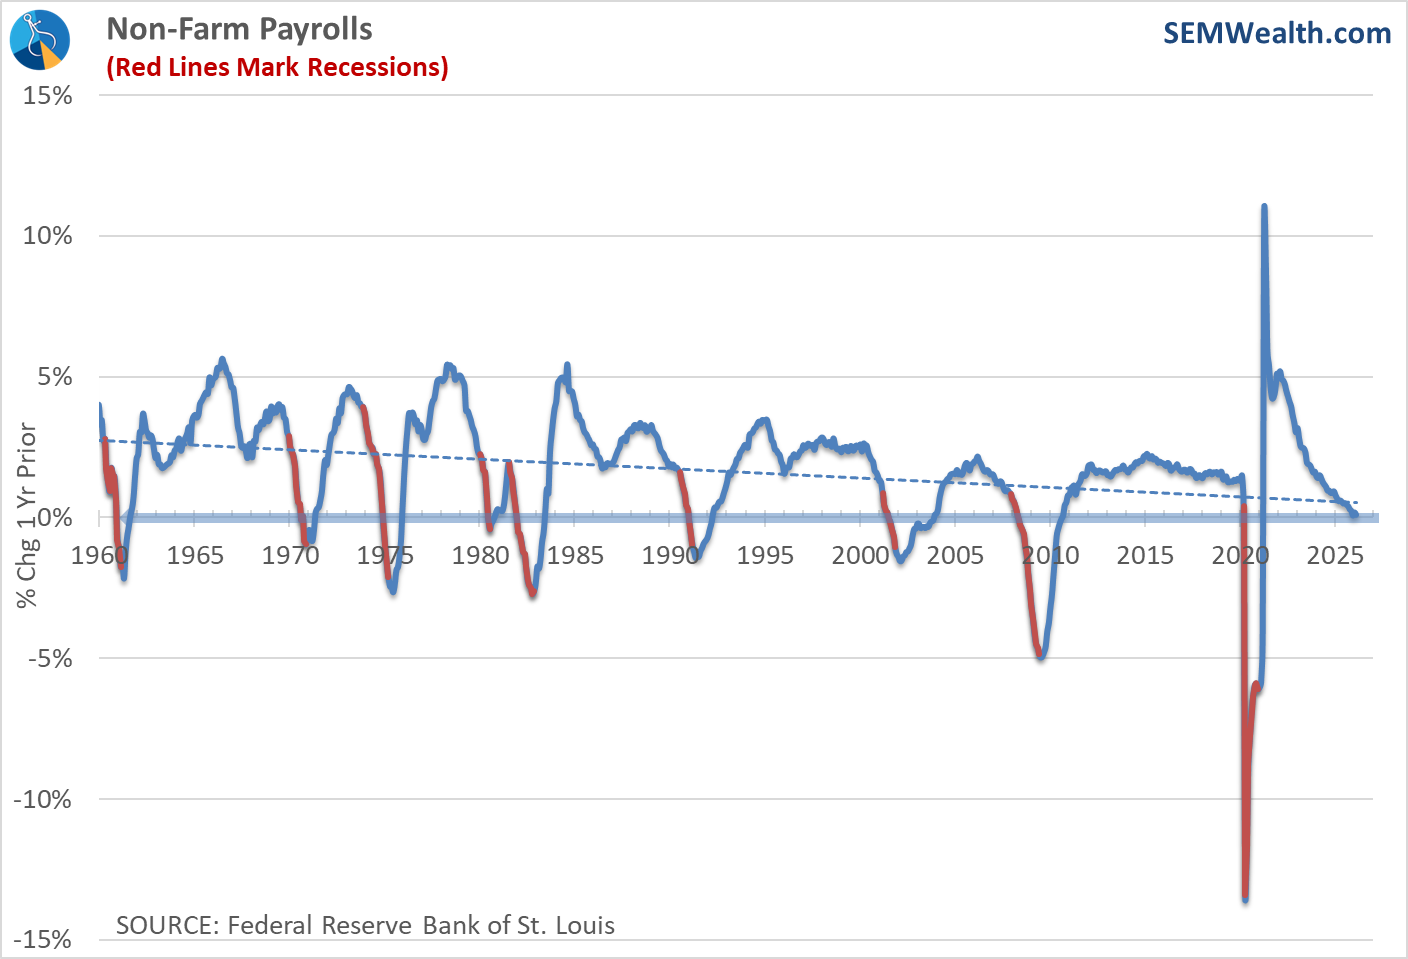
The first is Jobs. The number of jobs in our country was essentially unchanged over the past 12 months. This has been described as a "no hire, no fire" labor market. Basically, if you have a job you most likely will be able to keep it, but if you lose your job, you may have a difficult time finding a new one.
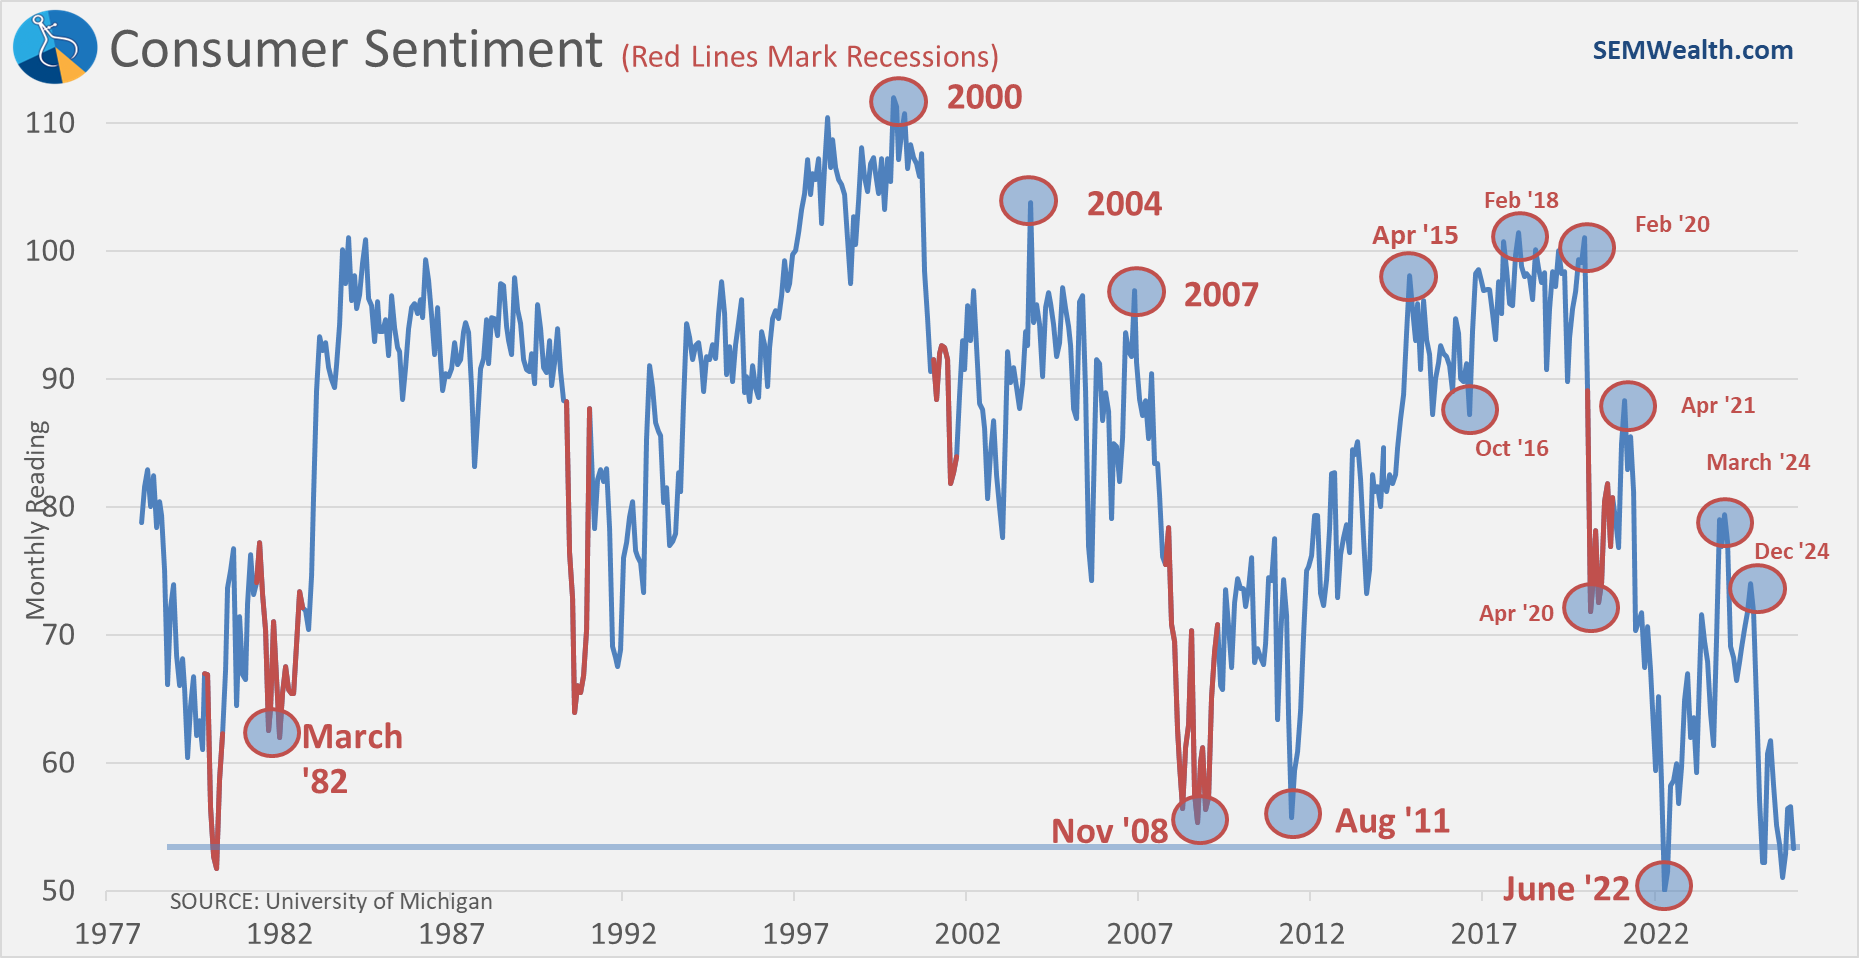
This has weighed on Consumer Sentiment, which is back down near the levels we saw in 2022 when inflation was running close to 10%. The recent spike in gasoline prices could weigh on that further.
Overall our Economic Dashboard shows a mixed bag.
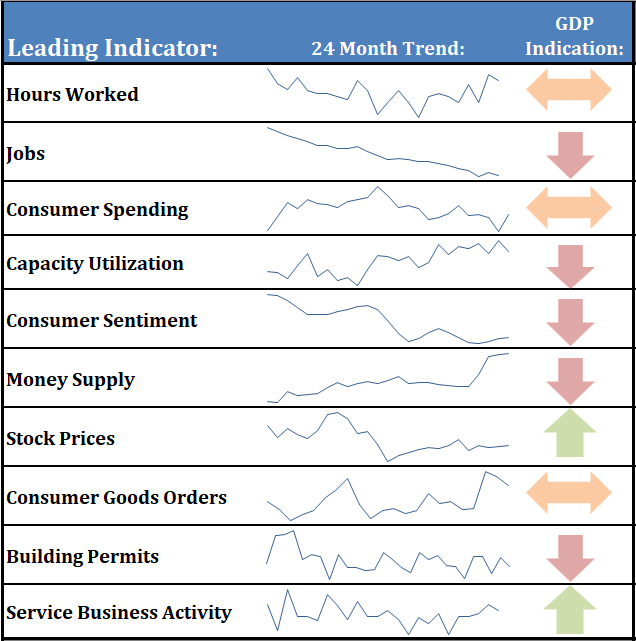
If the economy does slide into a recession, this could hit the highest growth stocks the hardest. As always, if you're interested in following along with our economic model, you can subscribe to the Traders Blog for more frequent updates.
Headwind #5: Human Nature
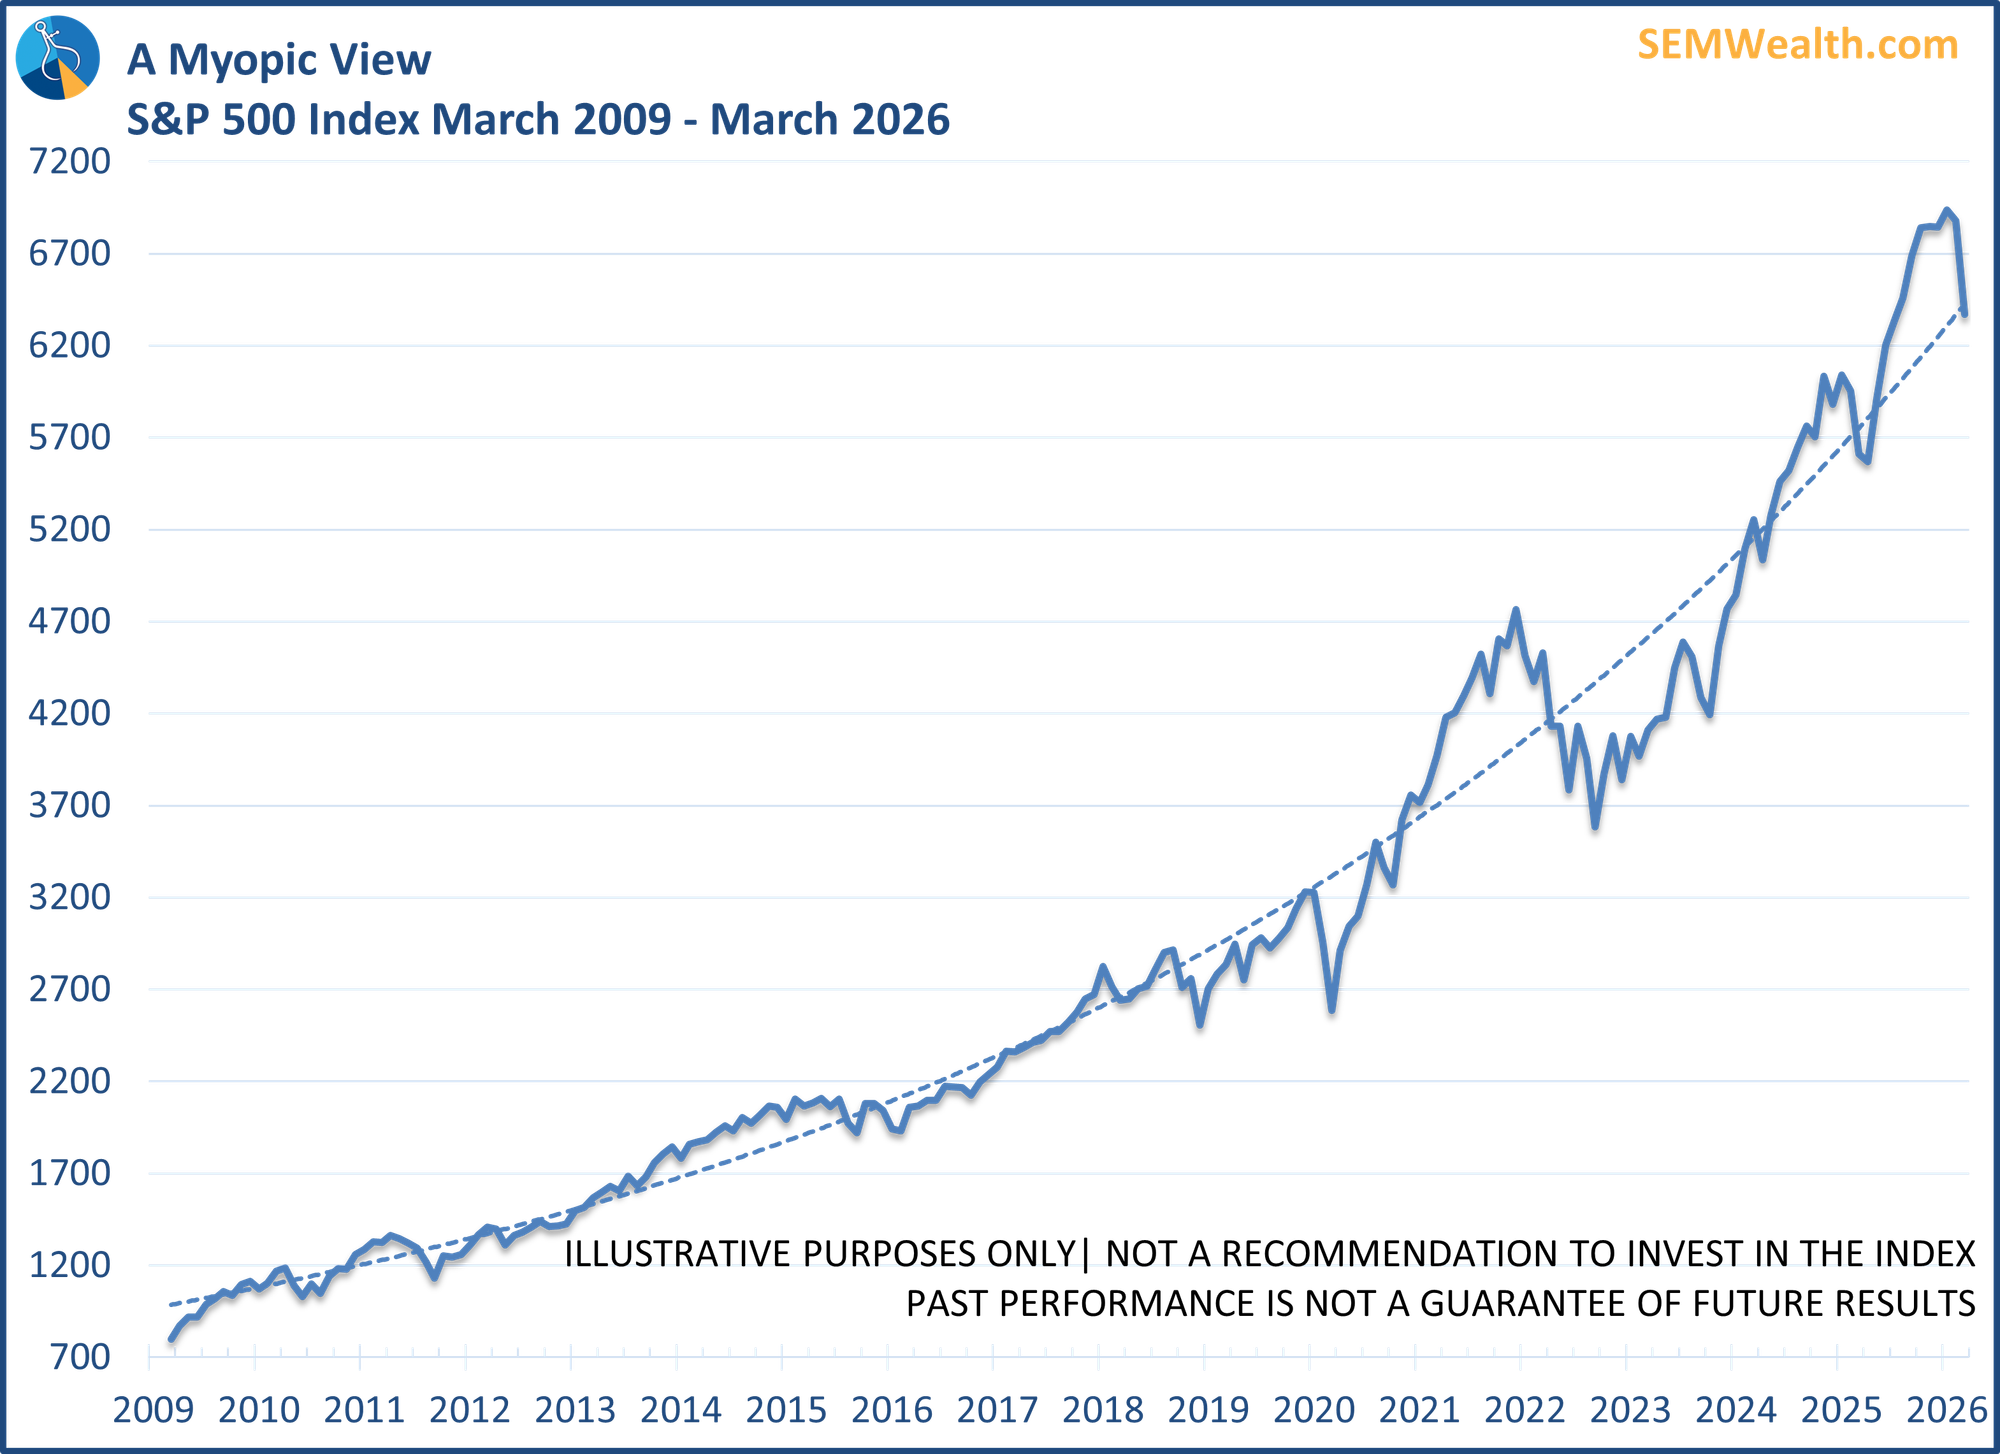
The Housing Bubble was hitting its peak 20 years ago. The Technology Bubble burst 26 years ago. For many investors and advisors those are "stories" they head about, but something that they think will not happen again. Even for investors and advisors who lived through those terrible times, many think the market is simply "smarter" having gone through those periods. Over the very long-term, stocks have proven to do quite well, averaging around 10%. The problem we have seen is many investors do not hold for the long-term and get shaken out of the market after significant declines.
Earlier we showed this chart of the S&P 500 since the end of the Financial Crisis. If this is your experience, every dip should be bought because the market will be rescued by the Fed, Congress, a social media post from the President or all of the above.
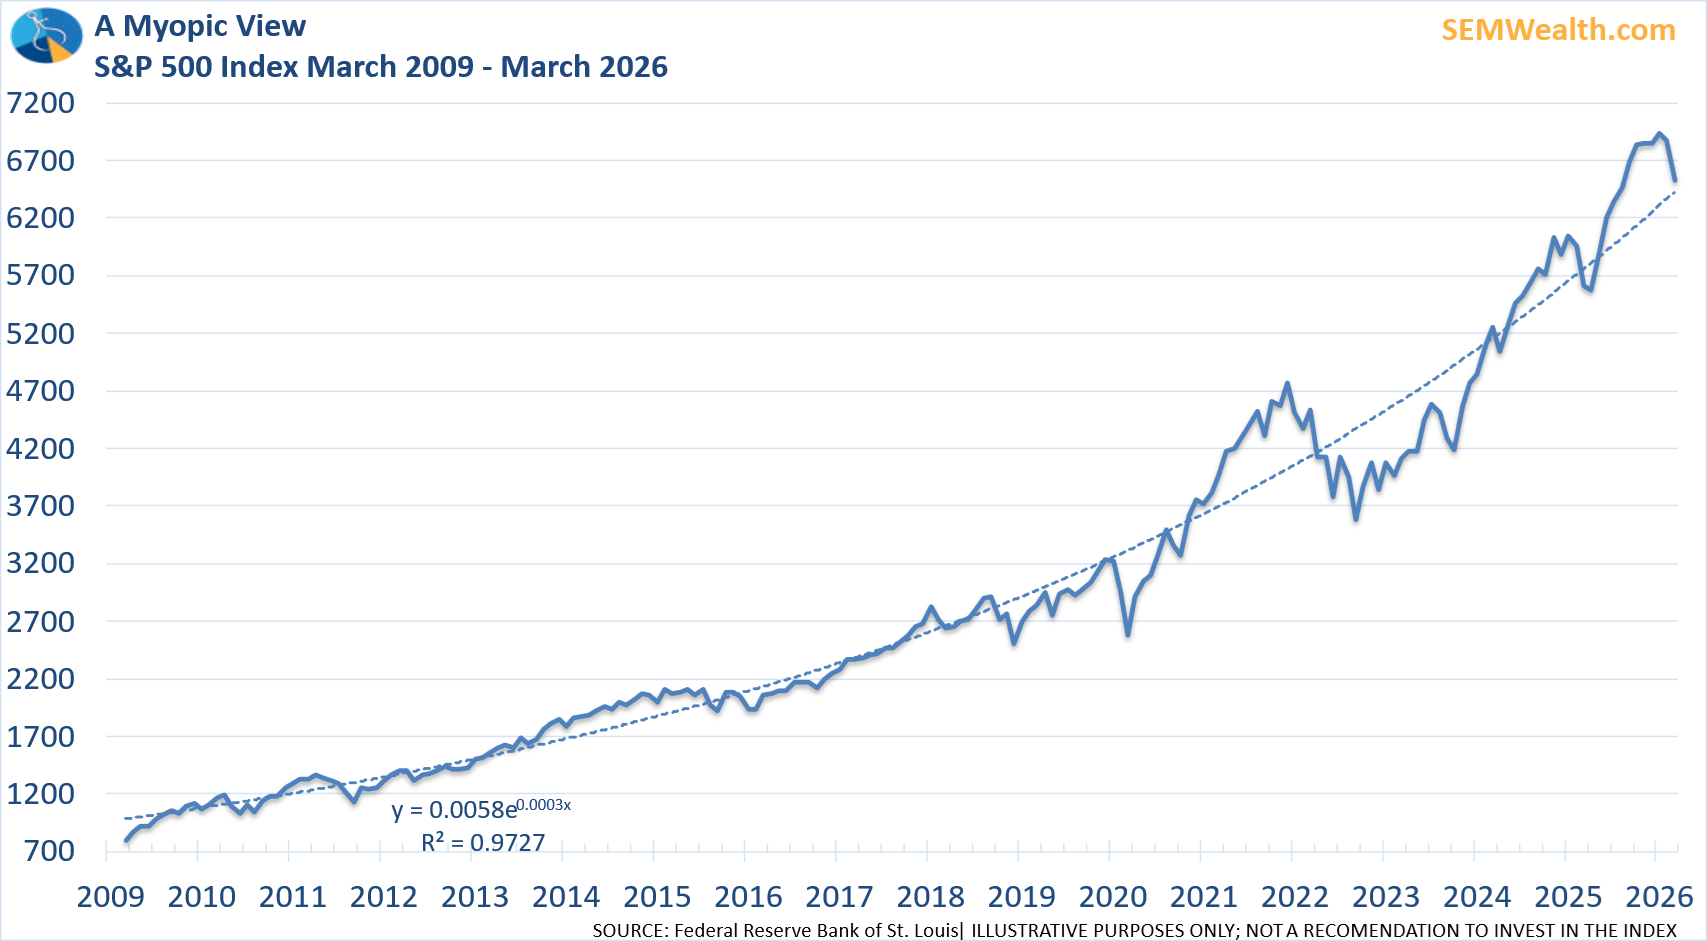
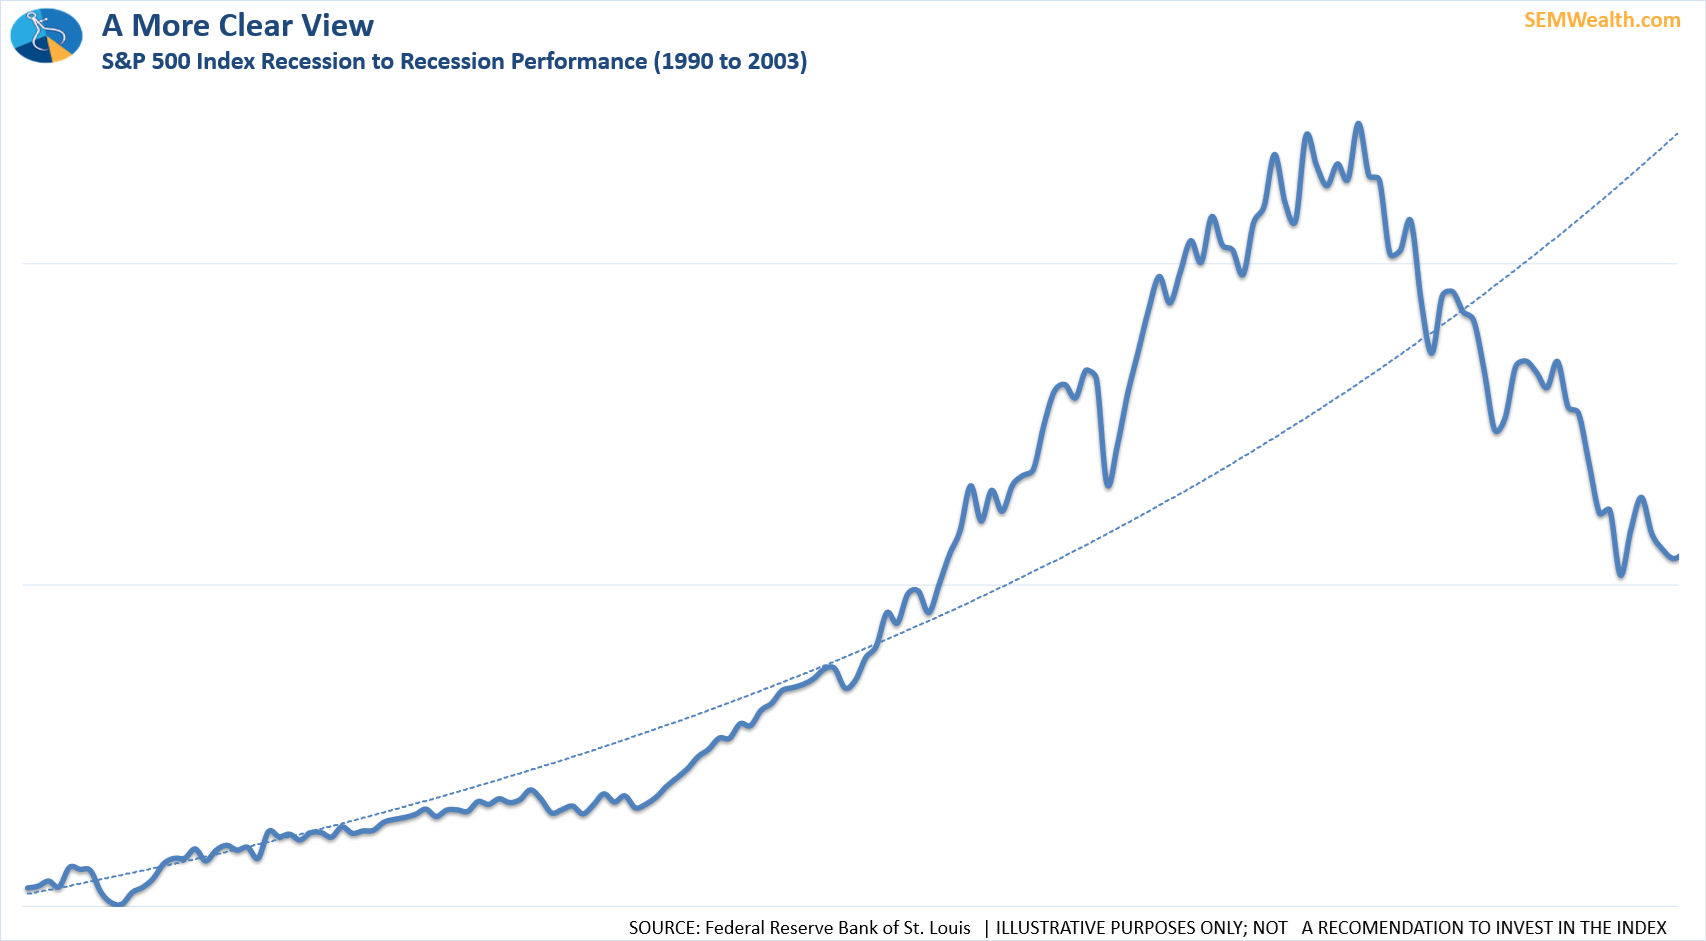
What investors fail to understand is many of the same things (minus social media posts) were in place throughout the 1990s bull market. Here is the bull market chart of that era.
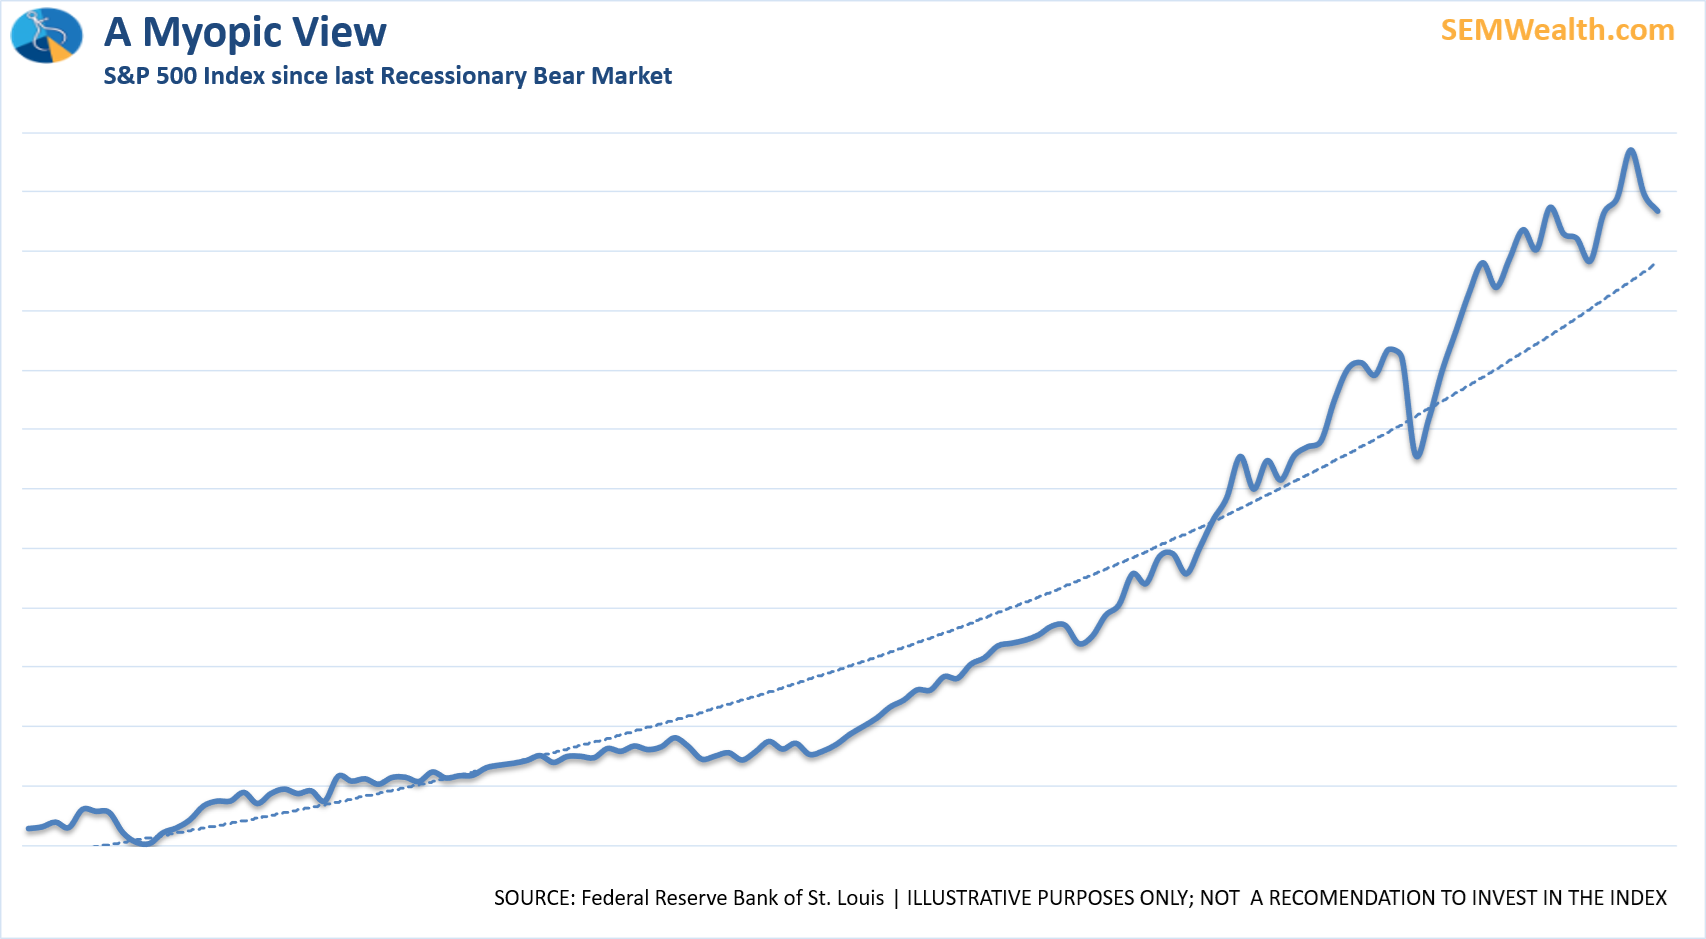
History doesn't repeat, but it most certainly rhymes. Understanding this is important......so is EXPECTING large declines, especially after prolonged periods of well above average returns. Going back to the chart above, the S&P 500 has averaged a 9-10% annualized return. The problem is the chart above was a period where the S&P 500 averaged a 16% annualized return. What happened next? This chart tells the whole story.
Throughout market history we've seen periods where there have been above average returns followed by those excess returns being removed. Looking at the market since 1990 we see the actual story.
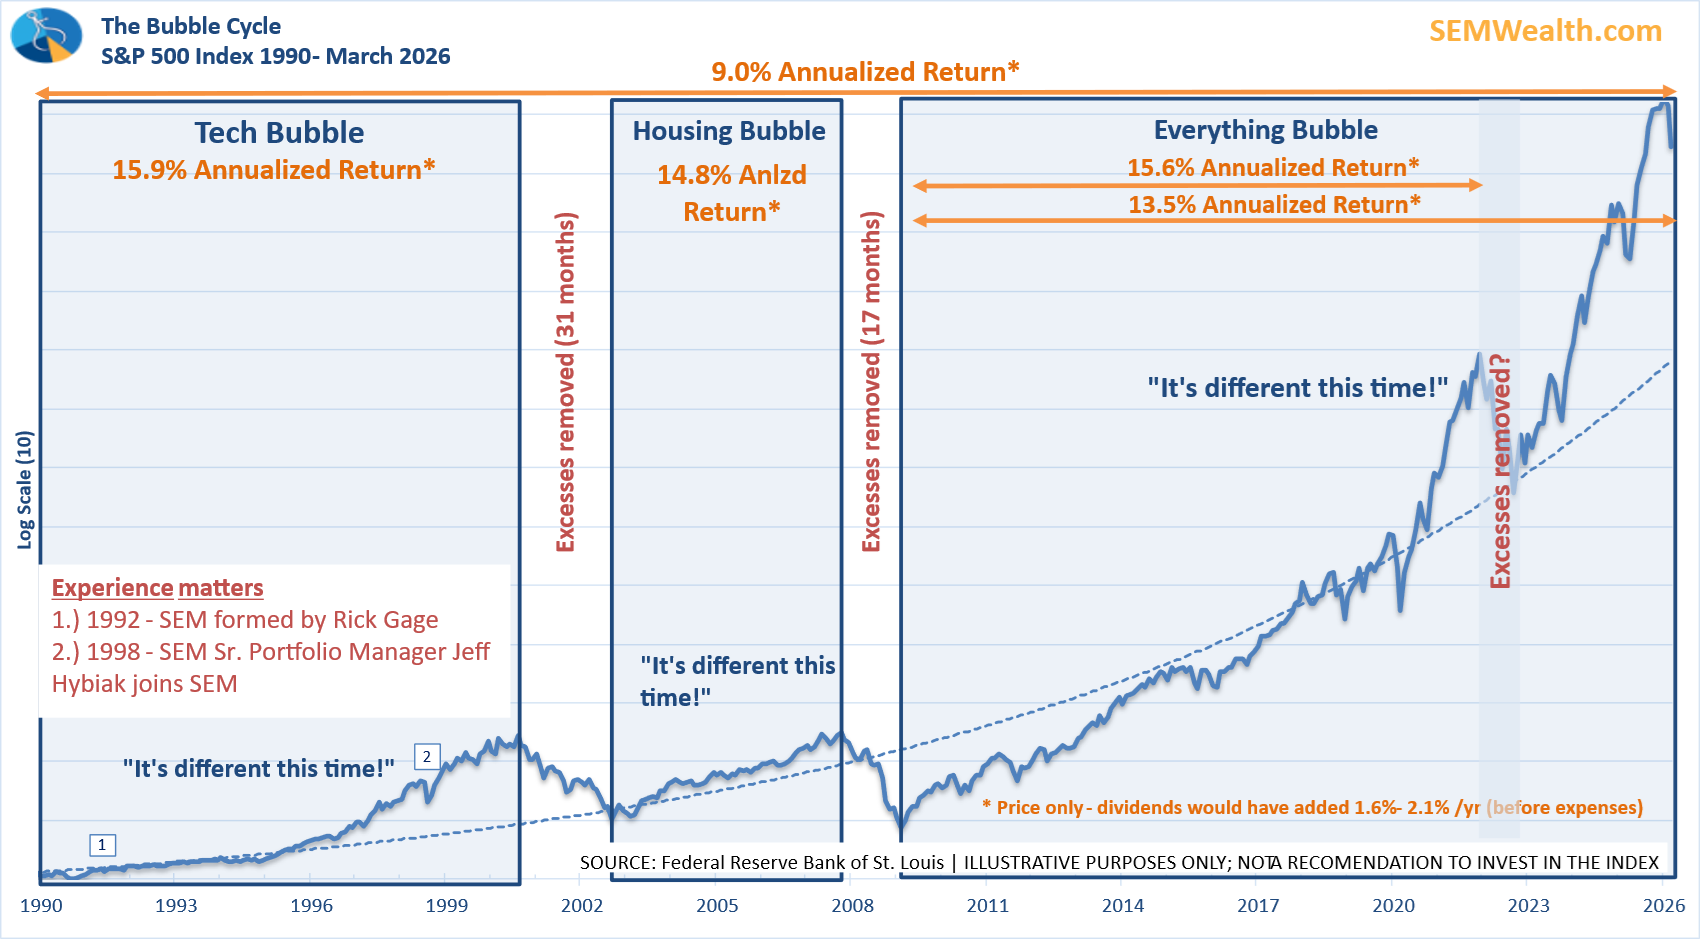
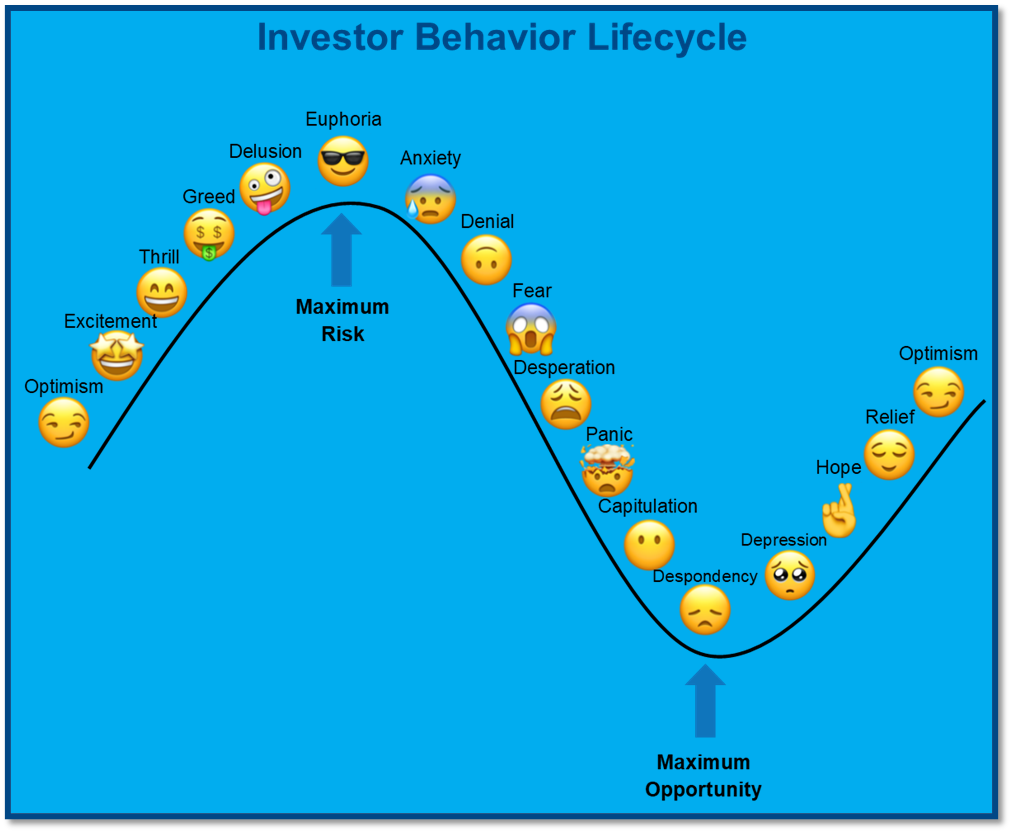
We don't post this as a message to "get out of the market", but instead frame your expectations for what to expect from stocks going forward. We especially use these charts with people who cannot afford to lose a significant amount of money due to their time horizon or other items in the financial plan. The market moves in cycles because humans make predictable mistakes time and time again. This chart illustrates the cycle most of us go through as the markets rise and inevitably fall.
Our goal is to properly set expectations along with providing a customized portfolio solution designed to fit your financial plan, cash flow strategy, and investment personality.
If you would like a personalized review of your portfolio, go to Risk.SEMWealth.com
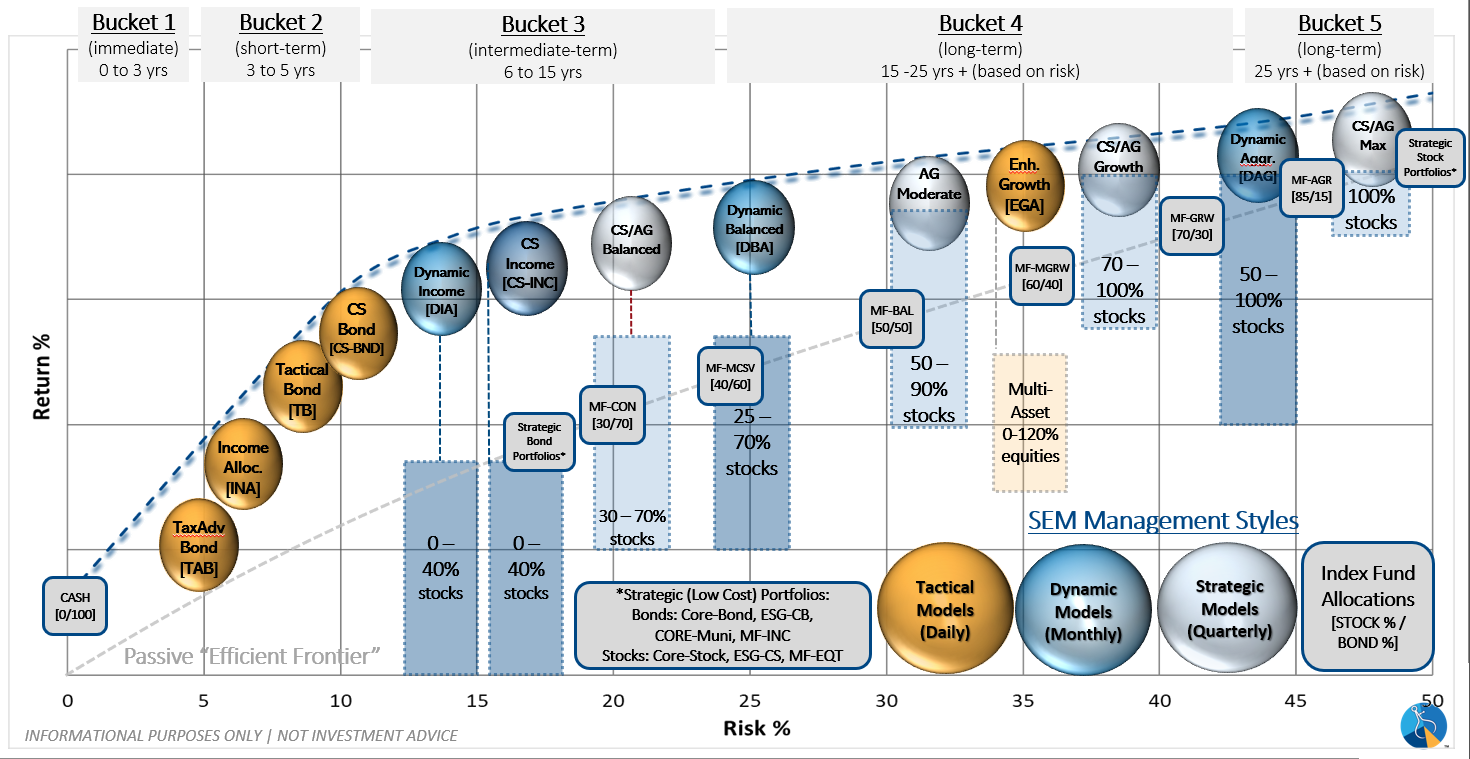
SEM Model Positioning
SEM utilizes 3 different model styles, designed to provide diversification and the ability to adjust positioning utilizing different quantitative investment methods. Here is a brief summary of what they are seeing as we start the 2nd quarter:
Tactical:
- Monitored DAILY
- Models: Tactical Bond, Cornerstone Bond, Income Allocator, Tax Advantaged Bond
- Designed to follow the trends for use in our lower risk models
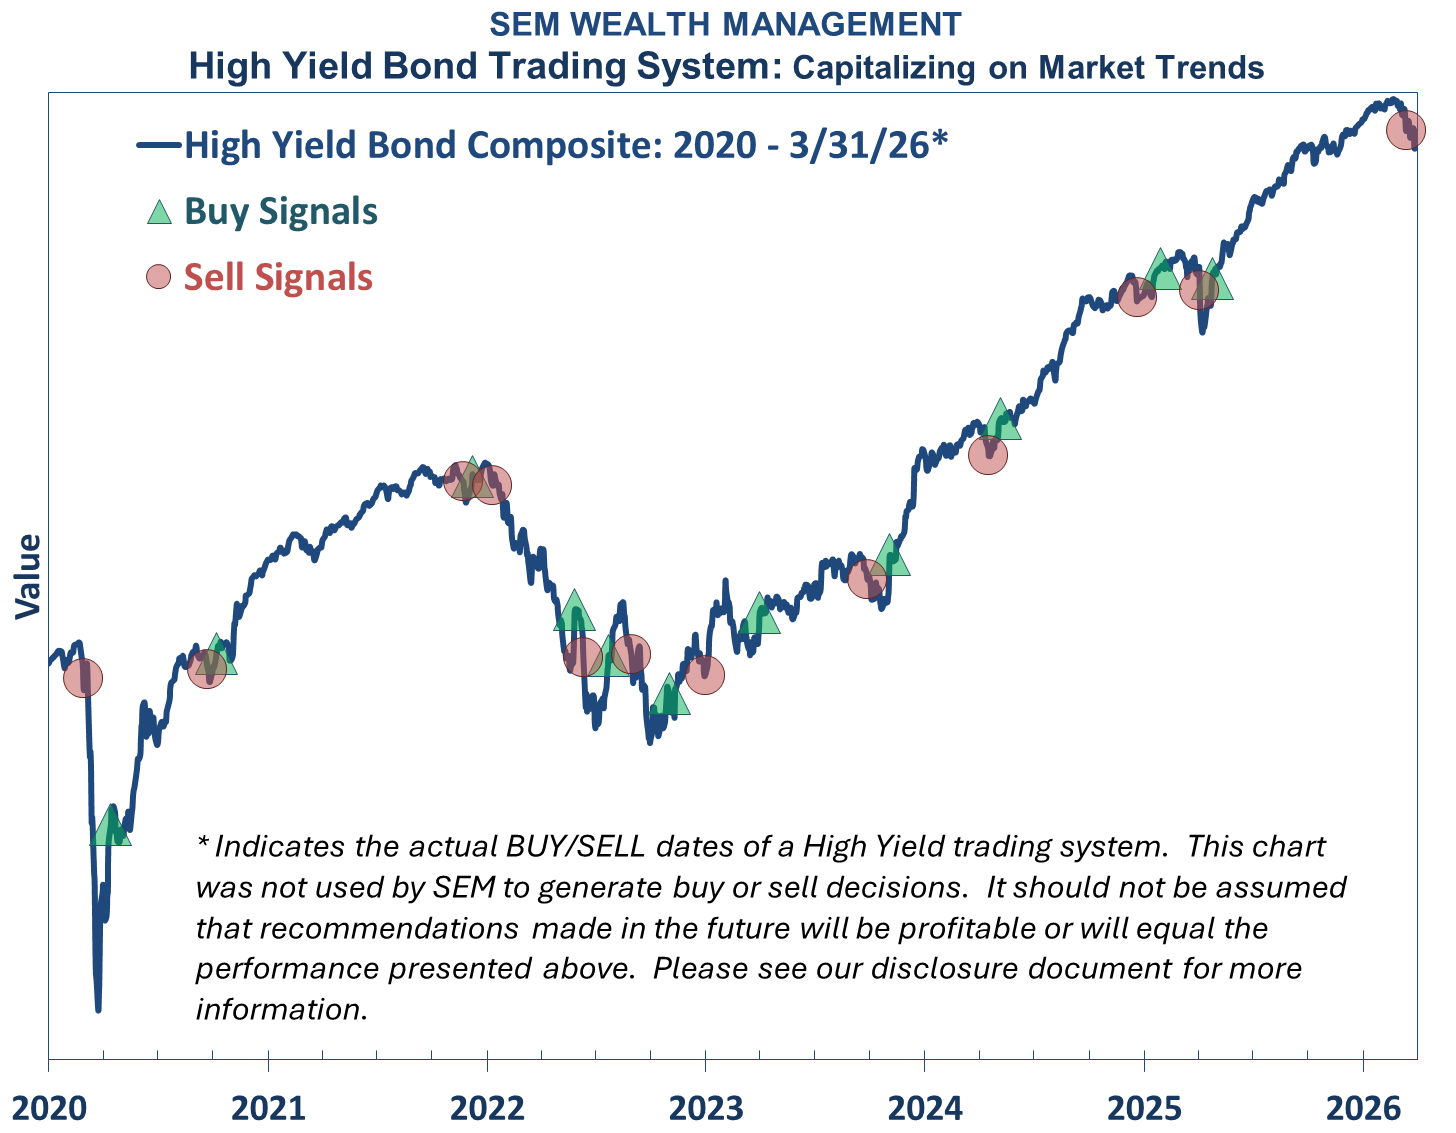
- SELL Signal issued March 13, 2026 (exiting the buy from April 25, 2025)
The chart below is an overlay of the high yield bond index with the buy and sell signals since 2020.
Dynamic:
- Monitored MONTHLY
- Models: All "Dynamic" Models (Income, Balanced, Growth, and Asset Allocator)
- Uses SEM's Quantitative Economic Model
- Designed to overweight riskier assets if economic trend is higher & underweight those assets if economic trend is lower.
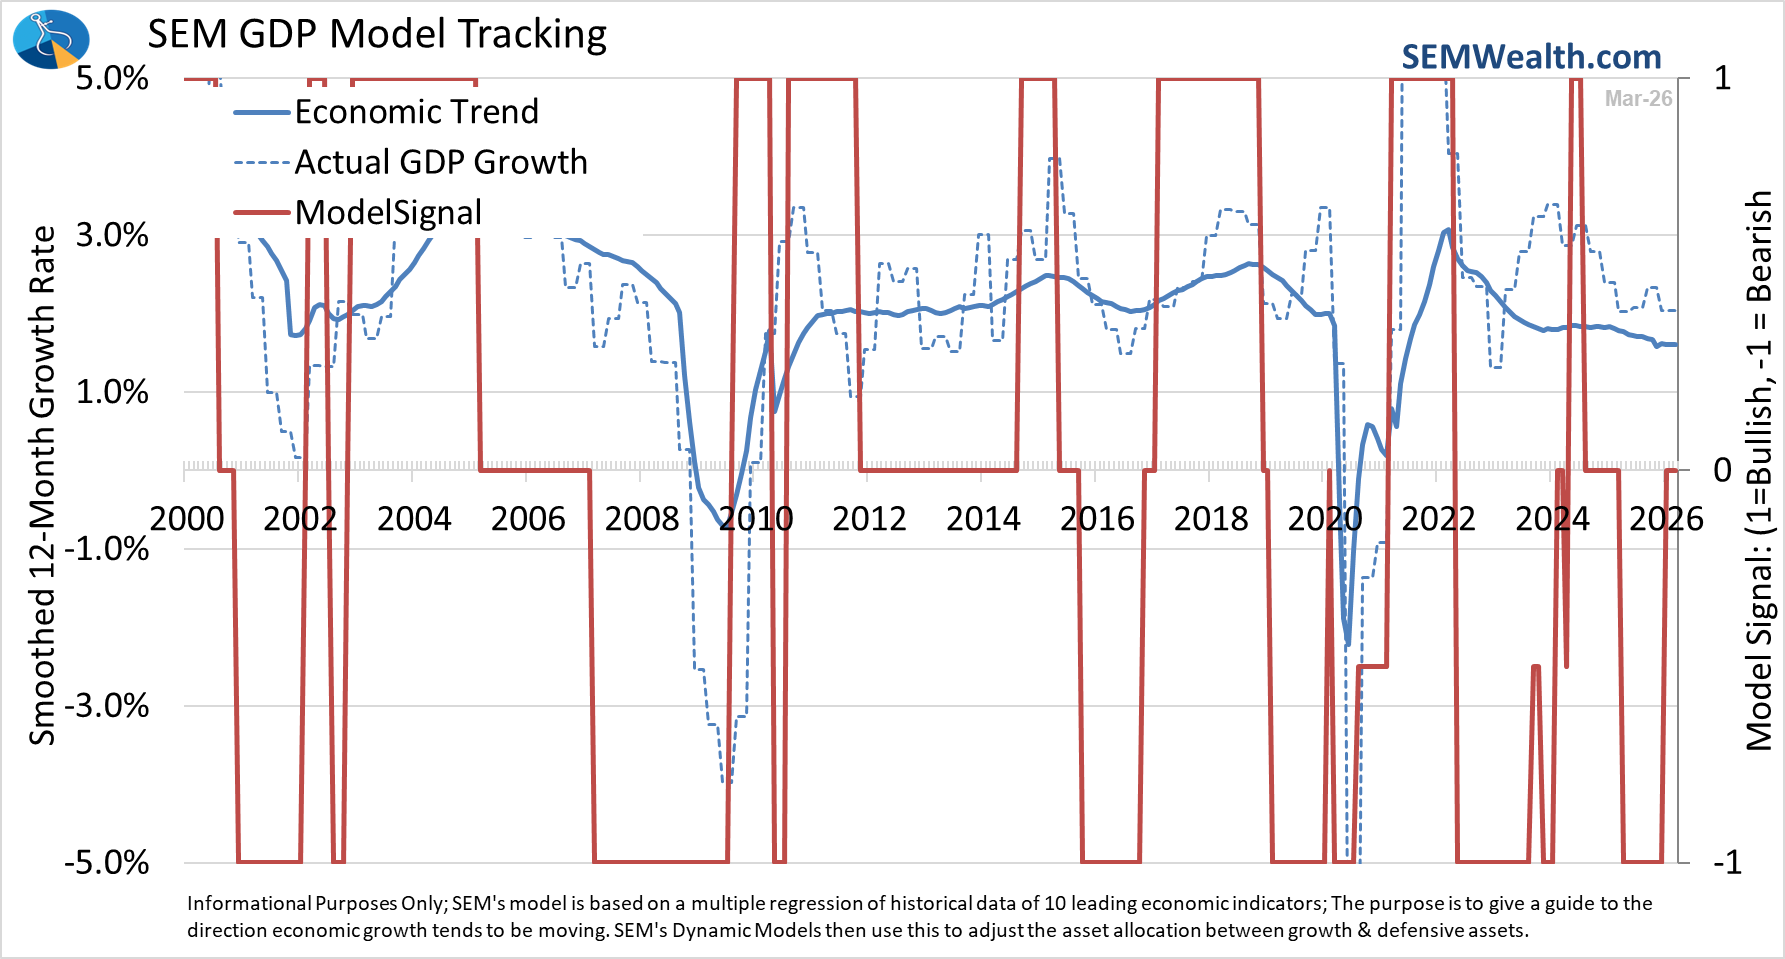
- NEUTRAL signal issued February 15, 2026 (following BEARISH signal from July 2025)
The chart below shows GDP growth, SEM's Trend Model and our allocation.
Strategic*:
- Monitored QUARTERLY
- Models: AmeriGuard (Balanced, Moderate, & Growth) and Cornerstone (Balanced & Growth)
- Core Component: Quantitative Filter using 4 different time horizons across universe of asset classes
- Trend Indicator: Two different Quantitative Systems monitoring the intermediate-term trend, health of the market, and volatility
- CORE has been overweight small cap and international since October 2025 – overweight increased slightly in January
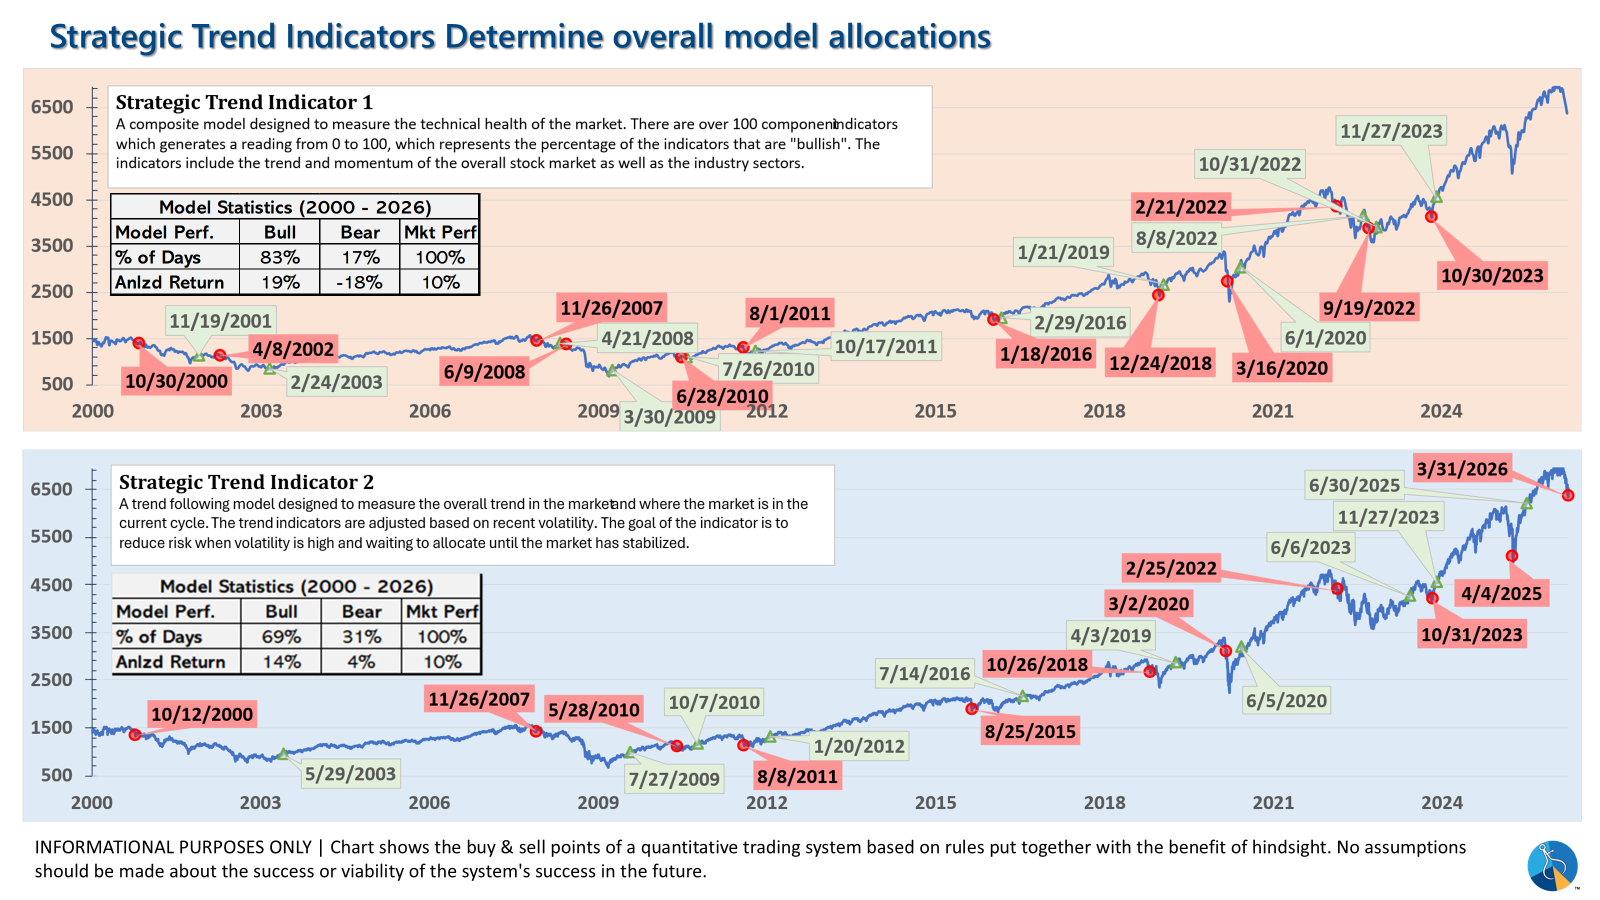
- One TREND indicator issued a SELL on March 30, 2026 bringing stock allocation down to 50% in Balanced, 70% in Moderate, and 85% in Growth)
- AmeriGuard & Cornerstone Max DO NOT use the Trend indicator and are always 100% invested in stocks using our CORE rotation model.
The goal of the trend indicators is to take some money off the table when the market is likely to go into a difficult environment. The chart below shows the Strategic Trend Indicators:
*SEM offers other "strategic models" (such as Core Stock, MF Models, and the Patriot Portfolio) which are always invested at their target allocations.
Tax Information
We realize filing your taxes is always a difficult process. This year, there have been a much larger number of corrections issued to the 1099s for our investment accounts. We have been in close contact with Axos and the investment managers issuing the corrections to do our best to get you information in a timely manner. If you received a corrected 1099, here is some information which may be helpful.
We understand how frustrating it is to receive a corrected 1099. This year has had more corrections than usual, but we expect the next tax year to see fewer corrections as companies gain a better understanding of the changes in the tax law.
While we cannot offer tax advice and do encourage you to seek your own advice, when researching this for our own situation, Turbo Tax’s “experts” advise this:
"Receiving a corrected 1099 does not necessitate filing a corrected return. The IRS will receive the corrected 1099 and adjust your return accordingly. If more or less tax is owed due to the correction you will be notified."
In other words, if you have already filed your return and the amount of the correction is small, the IRS, if necessary will adjust your return and send notification of the amount adjusted. This includes any savings or extra taxes owed.
If you received notice from Axos about a recent correction to your 1099, you can find the boxes and lines that changed by looking for a “C” on the right hand side of the form. Here are some of the most common reasons for a correction we have found:
Box 1a: There was an adjustment to the dividends received. It mostly appeared to be due to funds finding they had not properly coded a dividend. The amounts were typically small, but still had to be corrected. Changes to Box 1a MAY lead to a slightly higher tax liability (reduction of refund).
Box 1b, 5: Box 1b & 5 amounts may lower the tax rate on certain dividends. The tax laws allow certain dividends to be classified as “qualified” and moved to the long-term gain category, which may be a lower rate depending on your tax situation. Changes in the One Big Beautiful Bill Act (OBBA) were retroactive to the start of 2025 and did allow some dividends to be moved to the more favorable rate. Due to the timing and lack of guidance from the IRS, investment firms were left with little time to assess any possible changes. Several firms which found many and sometimes all of their dividends are now considered “qualified” and have thus issued a correction.
Whether or not this impacts you depends on your tax bracket. The amount saved on taxes would be (roughly) calculated by this formula:
[Corrected $ Amount x (Effective Income Tax Rate % – Long-term Capital Gains Rate %)]
Box 12: Part of the dividend was classified as “tax free” dividends, possibly reducing the state tax liability. The amounts were typically quite small.
Capital Gains: This is the more complicated one. In most cases some obscure tax rules required the "cost basis" for specific shares sold to be adjusted. In most cases, this amounted in a slight change the realized gain or loss, but there may have been circumstances which led to a larger change.
As always, if you have questions on how any of the corrections impact you, please contact your tax advisor.
Download/Print version of the Newsletter

What is ENCORE?
ENCORE is a Quarterly Newsletter provided by SEM Wealth Management. ENCORE stands for: Engineered, Non-Correlated, Optimized & Risk Efficient. By utilizing these elements in our management style, SEM’s goal is to provide risk management and capital appreciation for our clients. Each issue of ENCORE will provide insight into investments and how we managed money.
The information provided is for informational purposes only and should not be considered investment advice. Information gathered from third party sources are believed to be reliable, but whose accuracy we do not guarantee. Past performance is no guarantee of future results. Please see the individual Model Factsheets for more information. There is potential for loss as well as gain in security investments of any type, including those managed by SEM. SEM’s firm brochure (ADV part 2) is available upon request and must be delivered prior to entering into an advisory agreement.


