The US economy is growing at a “great” (but not historic) rate. This has pushed the S&P 500 all the way back towards the record high it hit in January of this year. My greatest fear is if the market surpasses the highs of January

The US economy is growing at a “great” (but not historic) rate. This has pushed the S&P 500 all the way back towards the record high it hit in January of this year. My greatest fear is if the market surpasses the highs of January
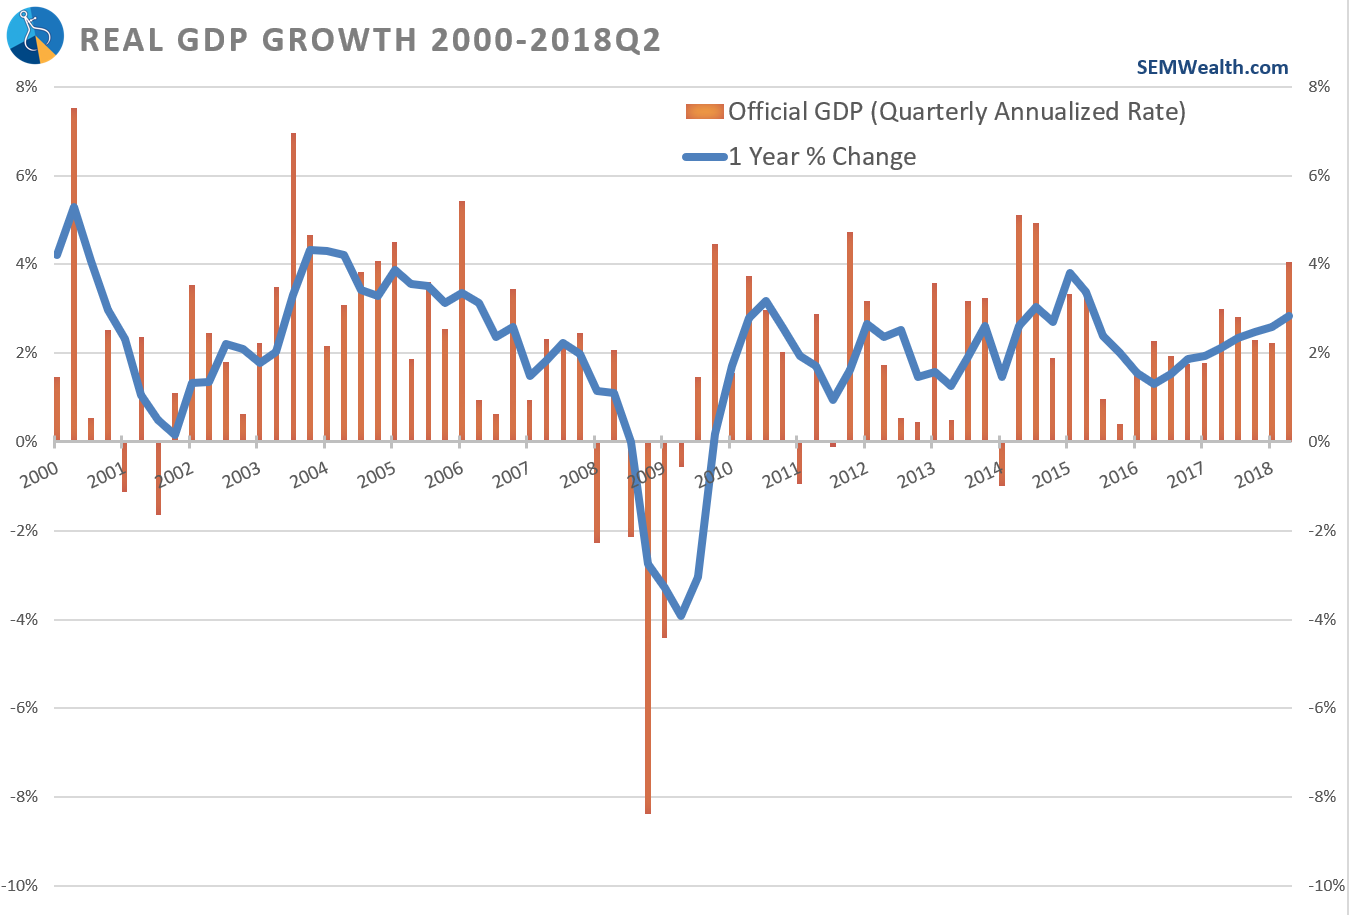
When the estimated growth rate for the US economy was released for the 2nd quarter, President Trump touted it as evidence of “an economic turnaround of historic proportions.” One of the secrets of the President’s success throughout his life has been his ability to spin things
On Friday Jeff wrote a very well thought out and sophisticated article going over the reasoning and data behind Facebook’s valuation after it fell 25 percent (located here). I saw that same drop and clicked buy (for my non-SEM account that is completely discretionary and has nothing
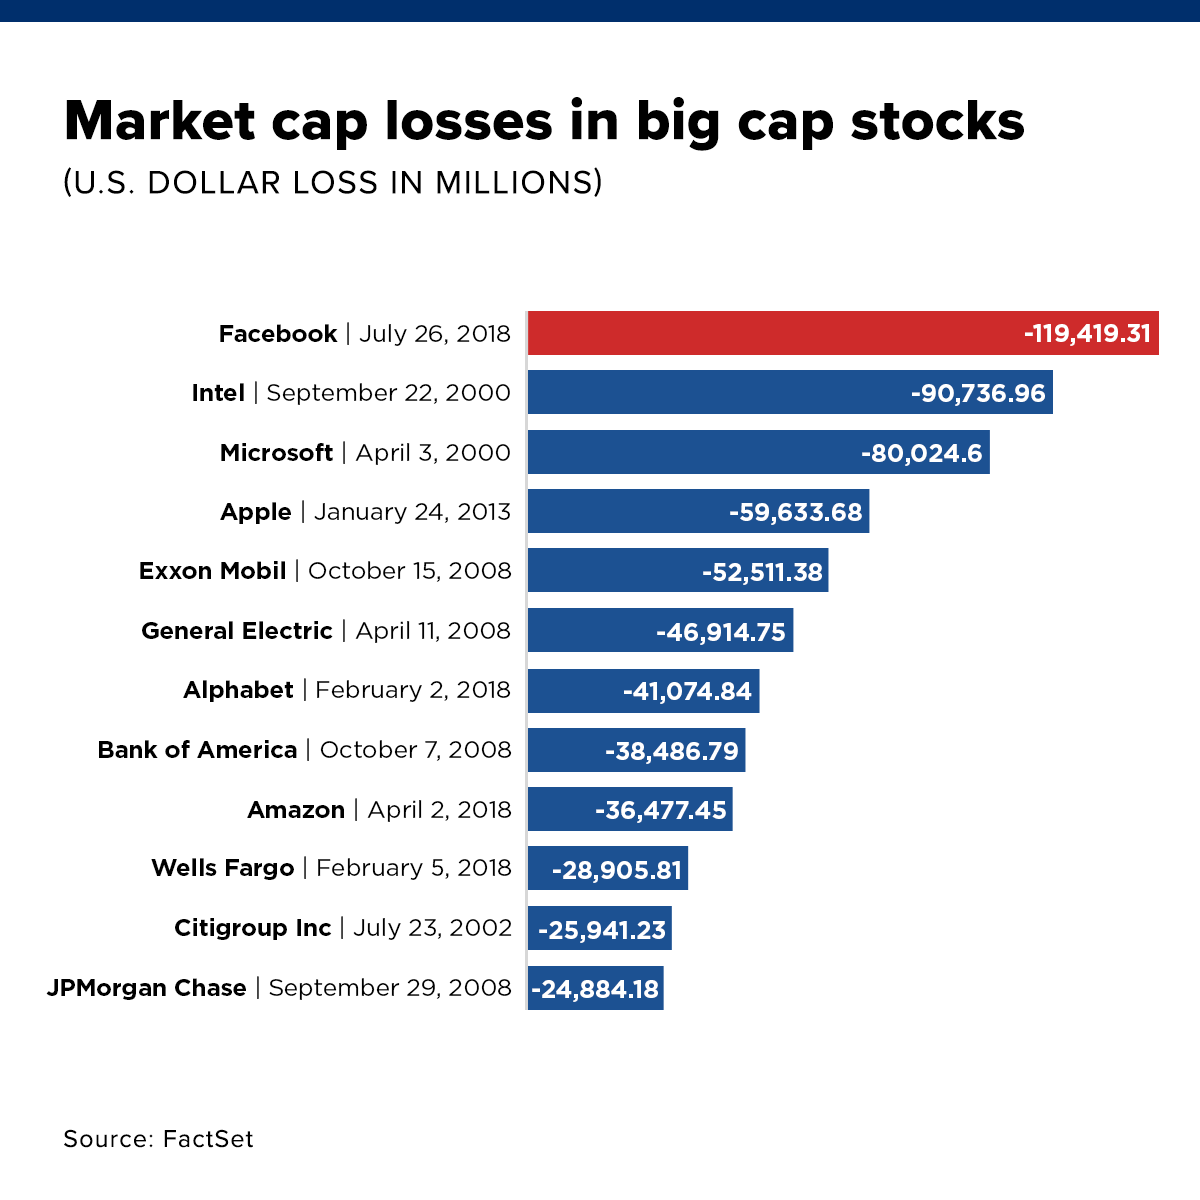
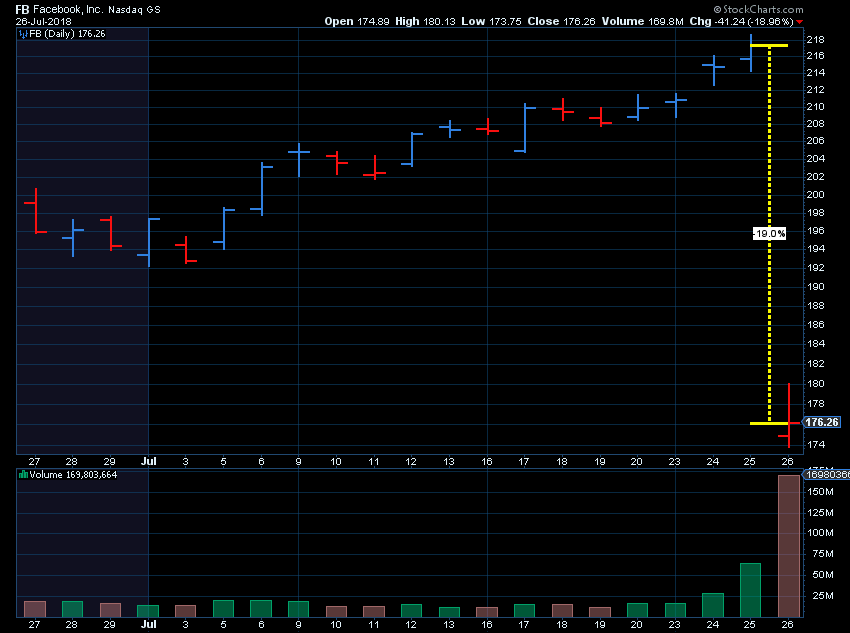
On Thursday Facebook stock suffered the largest single day loss of market value in history. At one point the stock was down 24%. It recovered to close down 19%. $119 Billion of market capitalization was lost. The reason behind the drop was a combination of the company reporting quarterly earnings
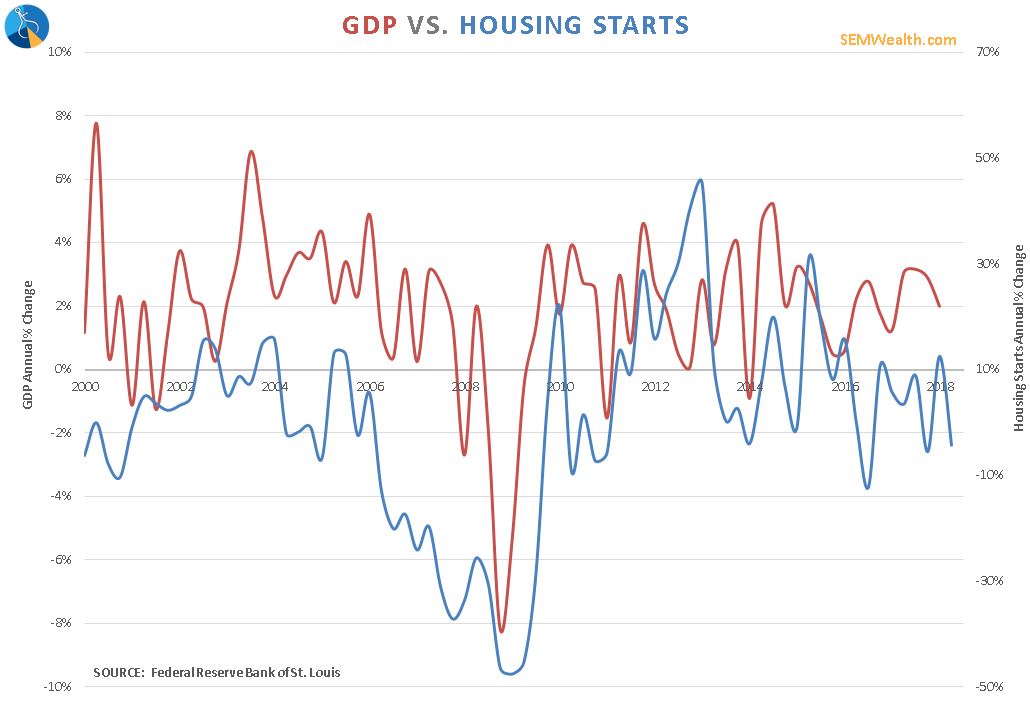
This week my second favorite leading economic indicator was released and it immediately threw cold water on my optimistic outlook. Two weeks ago, I posted our economic model showing a continued bullish uptrend for the next several months. Building Permits and Housing Starts tend to be a very early leading


